1
Universitat Politècnica de Catalunya SENSORS AS A SERVICE IN THE CLOUD Author: Eduard Montserrat Supervisor: Fatos Xhafa Departament de Ciències de la Computació Universitat Politècnica de Catalunya Degree in Informatics Engineering Software Engineering Specialization Barcelona School of Informatics – FIB April 22th, 2015 1 TABLE OF CONTENTS 2 Introduction ............................................................................................................... 6 3 Background ................................................................................................................ 7 4 5 6 7 3.1 Big Data .............................................................................................................. 7 3.2 Sensors ............................................................................................................... 8 3.3 Internet of things ............................................................................................... 9 3.4 Service in the cloud .......................................................................................... 10 Scope ....................................................................................................................... 11 4.1 Project definition ............................................................................................. 11 4.2 Limitations and risks ........................................................................................ 12 4.3 Methodology.................................................................................................... 12 4.4 Software tools .................................................................................................. 14 4.5 Validation methods .......................................................................................... 14 State of art ............................................................................................................... 15 5.1 Sensor as a Service ........................................................................................... 15 5.2 Sensor Clusters and the Cloud ......................................................................... 17 5.2.1 Fixed Clusters ............................................................................................ 17 5.2.2 Agile Clusters ............................................................................................ 18 5.2.3 Personal Clusters ...................................................................................... 18 Planning ................................................................................................................... 20 6.1 Task Description ............................................................................................... 20 6.2 Estimated time ................................................................................................. 21 6.3 Final Time ......................................................................................................... 21 6.4 Action Plan ....................................................................................................... 21 6.5 Estimated task plan .......................................................................................... 22 6.6 Final task plan .................................................................................................. 25 Feasibility study ....................................................................................................... 26 7.1 Initial considerations ........................................................................................ 26 2 7.2 Human resources cost ..................................................................................... 26 7.3 Expenses........................................................................................................... 28 7.4 Sales ................................................................................................................. 30 7.5 Social impact .................................................................................................... 32 7.6 Environmental impact...................................................................................... 32 8 Product Specification ............................................................................................... 33 8.1 Introduction ..................................................................................................... 33 8.2 Stakeholders .................................................................................................... 33 8.3 Goals................................................................................................................. 33 8.4 Domain Properties and hypothesis.................................................................. 34 8.5 Conceptual Schema ......................................................................................... 34 8.6 Use cases .......................................................................................................... 35 8.7 Requirements ................................................................................................... 42 8.7.1 Functional Requirements ......................................................................... 43 8.7.2 Non Functional requirements .................................................................. 45 8.8 9 Satisfaction argument ...................................................................................... 50 Design ...................................................................................................................... 52 9.1 User interface................................................................................................... 53 9.2 Sensor as a Service Logic.................................................................................. 53 9.3 Database .......................................................................................................... 53 9.4 Cloud Management ......................................................................................... 54 9.4.1 Cloud API layer.......................................................................................... 54 9.5 Communication ................................................................................................ 60 9.6 Physical sensor ................................................................................................. 61 10 Implementation ................................................................................................... 62 10.1 Software used .................................................................................................. 65 10.2 Views ................................................................................................................ 65 10.3 Testing .............................................................................................................. 67 10.3.1 Functionality testing ................................................................................. 68 3 10.3.2 Usability testing ........................................................................................ 68 10.3.3 9.3.3 Interface testing............................................................................... 69 10.3.4 Compatibility testing ................................................................................ 69 10.3.5 Performance testing ................................................................................. 69 10.3.6 Security testing ......................................................................................... 69 11 API ........................................................................................................................ 71 12 Results.................................................................................................................. 72 12.1 Conclusions ...................................................................................................... 72 12.2 Future Work ..................................................................................................... 72 13 Glossary ............................................................................................................... 73 14 Appendix 1 ........................................................................................................... 74 14.1 15 OpenStack set up ............................................................................................. 74 References ........................................................................................................... 77 4 The cloud is absorbing and becoming the established way to build the internet. We have assumed the challenge to create a platform where the cloud is at the center and intimately bound to the Internet of Things. It is yet another, solution to the problem of resource sharing. We not just saw it as a problem but also a new business model. We designed a model to conduct a rational sensor sharing with payment to the owners of the resources. This documents analysis and discusses trending concepts like Big Data and Internet of Things. The project described in this document tries to be alike the reality. We perused to build a product that can be “online” tomorrow. It is not likely to happen, but with some tweaks, more time and more experts it can became a reality. The solution proposed is a web app that enables sharing sensors among the users of the platform. We tried with Raspberries Pi acting like sensors and I can say that we are very hapy with the resutl. The web provides a map where the user can navigate and gather data from the specified sensor. The quantity of data consumed is stored and used to make the payment or get paid. The sensor information, as well as the sensor data, can be obtained through an API. It allows third applications to collect the data. ------------------------------El termino cloud está absorbiendo y convirtiéndose en el estándar en internet. En este Proyecto hemos asumido el reto de crear una plataforma donde el cloud está en el centro y muy ligado al internet de la cosas. Es por lo tanto, una solución más a la problemática de compartición de recursos. Hemos diseñado un modelo para compartir recursos, en este caso sensores, de forma racional y donde el propietario del recurso recibe una monetización por ello. Este documento analiza y discute conceptos muy de moda actualmente como Big Data y el comentado Internet de las cosas o IoT. Hemos intentado modelar la realidad de la forma más precise posible. Y por consiguiente hacer un producto que pudiera funcionar mañana mismo. La solución presentada no está suficientemente pulida para tal caso. No obstante con más tiempo y expertos en cada material podría ver la luz. La solución presentada es una aplicación web que permite compartir sensores entre los usuarios de la plataforma. Hemos probado con Raspberry Pies actuando como sensores. La web tiene un mapa donde los usuarios pueden navegar, seleccionar sensores y visualizar la información que estos obtienen. La cantidad de datos consumidos es almacenada y usada posteriormente para realizar el pago o cobro. Toda la información está disponible mediante una API para que terceras aplicaciones puedan hacer uso. 5 2 INTRODUCTION Nowadays, the term “cloud” has become a significant trend in computing. Cloud computing or merely the cloud stands for allocate components over the internet and access them remotely. The components could be software, hardware, or both. The word itself, the cloud, is also an excellent trade name for marketing campaigns. The cloud aims to be simple, user-friendly and portable. The aspects implicated in a computer based engineering solution have become more sophisticated. Eventually, each of those will be impossible to be managed by the same entity. Cloud computing allows to maximize efficiency by delegating the components to third parties. Each subject of the chain is expert and responsible to work at the best performance. The National Institute of Standards and Technology of United States defines cloud computing as: “Cloud computing is a model for enabling ubiquitous, convenient, ondemand network access to a shared pool of configurable computing resources (e.g., networks, servers, storage, applications, and services) that can be rapidly provisioned and released with minimal management effort or service provider interaction”. The essential Characteristics are On-demand self-service; Broad network access; Rapid Elasticity; Measured service [1]. The term Cloud computing did not appear in the last few years. John McCarthy introduced the first approximation to the idea in 1961. He said at the MIT Centennial: “If computers of the kind I have advocated become the computers of the future, then computing may someday be organized as a public utility just as the telephone system is a public utility. The computer utility could become the basis of a new and important industry.” [2]. Probably the first use of the word, in the actual meaning, was in 2006 when Google CEO Eric Schmidt said at an industry conference: “What’s interesting is that there is an emergent new model. I do not think people have really understood how big this opportunity really is. It starts with the premise that the data services and architecture should be on servers. We call it cloud computing—they should be in a “cloud” somewhere.” [3]. Swiftly, many of the big IT companies started to use it. Amazon launches EC2 a few weeks later. NASA, IBM, Microsoft and lastly Apple also developed cloud solutions. 6 3 BACKGROUND This section reviews and contextualizes the foundations of this project. 3.1 BIG DATA IEEE Spectrum [4] recognizes both sensors and big data as to of the five technologies that will shape the world. According to the BCC Research [5], the global market for sensors was around $56.3 billion in 2010. In 2011, it was around $62.8 billion. Global demand for sensors is expected to increase up to $91.5 billion by 2016, at a compound annual growth rate of 7.8%. Infosys, a global leader in consulting, technology, and outsourcing solutions established cloud computing, sensor networks, and intelligence as a key for growing your enterprise [6]. Big data is not new concept or idea. However, earlier notions of Big Data were limited to few organizations such as Google, Yahoo, Microsoft, Facebook or IBM. This has changed. With recent developments in technologies such as sensors, computer hardware and the Cloud, the storage and processing power increase and the cost comes down rapidly. As a result, many sources (sensors, humans, applications) start generating data and organizations tend to store them for a long time due to inexpensive storage and processing capabilities. The challenge now is to take advantage of this new source. Thus, Big data has become an extended word in the industry. Big Data is a broad concept that has no precise definition because it is not a particular process or methodology. However, there are three characteristics that can be used to define big data, as also known as 3V’s [7]: volume, variety, and velocity. - Volume: It stands for the massive amount of data generated. As of 2012, about 2.5 Exabyte of data are created each day, and that number is doubling every 40 months or so. More data cross the internet every second than were stored on the entire Internet just 20 years ago. For instance, “it is estimated that Walmart collects more than 2.5 petabytes of data every hour from its customer transactions” [8]. - Variety: Variety means the types of data. Difference sources will produce big data such as sensors, devices, social networks, the web or mobile phones. Therefore design a database compatible with a large variety of formats and attributes and make it interoperable is not an easy task. 7 - Velocity: This means how frequently the data is generated. We can identify three main categories: occasional, frequent, and real-time. Some researchers consider “Value” also as a chief characteristic of big data. It means that somewhere within that data, there is some valuable information, though most of the pieces of data individually may seem valueless. The following steps represents the process of merging big data with IoT. -Finding a sensor on the internet may become an issue. The discovery is crucial to assure a reliable solution. -Combining the raw data with business intelligence and social integration. -Seeking to help companies understand the results of the analysis. -Data visualization is highly important to present a good-looking, efficient and convenient data. Information science represents the evolution from raw data in a pyramid known as DIKW. Wisdom Teamwork Knowledge Knowledge engineering Information Mining Data Data Mining Figure 1: DIKW pyramid 3.2 SENSORS A sensor [9] is a device that detects or measures a physical property and records, indicates, or otherwise responds to it. Digital sensor harvests quantitative measurements and turns analog input into a digital signal. I do not go into detail of the hardware specification. 8 Sensors used to imply expensive, and sometimes large contraptions to measure realworld variables. They are often exposed to hazardous environments where human observation would be not only much less accurate, but dangerous as well. It can be solved thanks to microelectromechanical systems, or MEMS technology, enabling the creation of tiny structures that could be fabricated using semiconductor processes. MEMS has launched sensor technology to a place where small, inexpensive, far accurate sensors that can be attached to almost anything. A big trend in MEMS sensor design today is packing more into less space, with multiple sensor types in a single package. The latest TPMS devices combine pressure sensors with radial acceleration and temperature sensors. Adding variables can help compensate for changing weather, such as underinflation with cooler days in autumn. The combination of more sophisticated variables with more powerful localized processing into a single part is driving new breakthroughs. Motion sensors, with a gyroscope, accelerometer, and magnetometer provide affordable 9-axis orientation data for tiny devices. The state-of-the-art Bosch Sensortec BNO055 packs an ARM Cortex-M3 MCU onboard, enabling advanced sensor fusion algorithms for uses such as augmented reality and indoor navigation. Sensors have transformed from things to read into things that can do something, when coupled with the right software and a better understanding of their surroundings. Efficient implementations of IPv6 TCP/IP stacks more suited for embedded use. However, simply Ethernet and TCP/IP specifications carry a significant amount of overhead. TCP/IP is useful for long file transfers, but in a short amount of data like many sensors typically provide, the required headers and formatting can be more than the actual data itself. Every bit transmitted consumes precious power. 3.3 INTERNET OF THINGS Internet of things or IoT stands for connecting the physical world to the Internet. Things? Could be anything or anyone, Objects, machines, vehicles, animals, sensors or even people. To turn a physical object to a smart thing on the internet we have to take a number of steps. First of all, the object needs a unique identity. The protocol ipv6, with an astonishing 2^128 number of addresses, has more than enough addresses to map all the objects on earth. For the sake of curiosity, 2^128 is much larger than the atoms of the surface on earth or the nanoseconds that have passed since the Big Bang. Secondly, 9 the thing has to communicate. The third step is to be able to sense the environment. Moreover, optionally the possibility to interact with the sensor. IoT allows an entirely new way to interact with the world and the possibilities that can offer intrigue the companies and academics. At the present time IoT can be used to connect with things, monitor environment or a person’s health, search for things, track traffic, control things or play with things among an endless number of possibilities. This change cannot come along without some concerns. What about the privacy or security. Some critics say that it will lead to a mass disruption where our lives will be guided for some smart device and a flaw in the system can cause a failure on a broad scale magnifying its consequences to an unknown level. The possibilities for the intruders will fear anyone. IoT is happening now, big companies, states, and startups are heavy investing on it. It will change our lives. The remaining question is how it will affect. 3.4 SERVICE IN THE CLOUD Providing services on the cloud is a model that is growing fast. It is defined as a style of computing in which massively scalable IT-related capabilities are provided “as a service” using Internet technologies to multiple external customers. Cloud computing consists of three main layers or model, Infrastructure as a Service (IaaS), Platform as a Service (PaaS), and Software as a Service (SaaS). Each layer has been discussed in [10]. In addition to the primary layers, some other layers has been introduced such as Database as a Service (DBaaS), Data as a Service (DaaS), Ethernet as a Service (EaaS), Network as a Service (NaaS), Identity and Policy Management as a Service (IPMaaS), Metal as a Service (MAAS) or Sensing as a service (SaaS) among others. In general, all these models are called XaaS, which means “X” can be virtually anything. 10 4 SCOPE 4.1 PROJECT DEFINITION The main idea of the project is to design and implement a system to manage sensors in the cloud. A wide range of sensors and networking technologies commonly used in fielded sensor networks add a unique set of challenges to sensor identification and discovery, sensor access and control, and sensor data consume. Current solutions often use tailored systems (both hardware and software) that access sensors individually, which increases their complexity and cost, limits their scalability, and reduces their effectiveness The proposal comes from the necessity of grouping several resources from different organizations in one solution. Today many of the sensors of the public administration work independently. There are many advantages of developing such system. Economical, because it reduces the amount of equipment as well as the amount of personal needed to maintain the systems. The system pretends to work not only across the public departments but also with companies. The resources might be shareable, saleable or rentable. The project comprises the design and implementation of the backend, an interface and a business model applied to the system created. The solution may also allow an external application to obtain data from the sensors as a push notification. This feature can be used for avoiding disasters that can occur e.g. a river overflow. The project tries to offer a solution to solve a critical infrastructure. It has to be able to address hardware failures. Another major risk lies in the security. The idea is to include high-priority agents of the public administration such as police or fire department. To do so, it is mandatory to create a secure system. Non-authorized users cannot get access to the resources. Available hardware like sensors might lead to unfinished modules. We believe that the project is viable according the following reasons. The solution decreases public expenditure. The companies may use it too, selling, buying or renting sensor. It is also viable because it builds up Smart Cities that is a growing concept involving more and more interconnecting cities every year. 11 Once the project is finished, the following features will be available: Sensor network management Auto discover new sensors In case of failure, reallocate similar sensor data Web client Business model design 4.2 LIMITATIONS AND RISKS The solution is intended to run in a real environment and provide a useful implementation in the field of Internet of Things. Therefore, it exists significant risks than can occur and few limitations that may arise in the development process. - Hardware communication - Security threats - Scarce quantity of hardware devices to test limitation - Budget limitation - Underestimate the cost of some processes - Some aspects of the project can be outside of the software engineering field 4.3 METHODOLOGY According to the limitations of the project: solo project, four-month time, hardware and software integration, little feedback from the users. The next development life cycles were selected to fit the requirements [11] [12] [13] [14] 4.3.1.1 Waterfall It is a sequential model, which each process starts when the previous step has finished. The phases, followed in order are Requirements, Design, Implementation, Verification, and Maintenance. Pros: · Easy to learn and follow · Ideal when all the requirements are known, and they will not change Cons: · A bad design will lead to a failed project · Strong penalization over the mistakes · No client feedback until the last part of the cycle 12 4.3.1.2 Unified Process It is an interactive and incremental development process. It has four phases: Inception, Elaboration, Construction, and Transition. Each phase has a defined set of deliverables and contains added, or improved functionality compared with the previous release. Pros: · Adaptability · Useful working in a team Cons: · Difficult to update · Slower than the average 4.3.1.3 Agile software development The Agile method proposes an incremental and iterative approach to software design. Designers are free to respond to changes in conditions as they arise and make changes as the project progresses. Agile development is a guideline; it exists numerous solutions that implement it. Pros: · Flexible · Adaptability to clients · It works well when the requirements are not defined or known · It facilities the communications with the developers and customers Cons: · Hard to predict the budget, amount of hours · Client active participation and constant helps · Lack of extensive documentation · Changes in the programmers become dangerous because the development is carried out Taking into consideration that one person performs the project. There is no need to create a communication protocol neither split the work. However, there is a need to use an efficient, reasonable and structured methodology to implement a structured and easy to deal project. Among all the methodologies analyzed, the methodology that will be used in the project would be a custom methodology mixing waterfall and unified process. UP because it helps to document the work done and waterfall because it provides a natural methodology than will not take much time, the requirements are defined, and there is no feedback from the client. 13 4.4 SOFTWARE TOOLS All the work done is stored automatically in a Dropbox [15] folder. It assures up to date files, accessible anywhere, and consistency. An integrated development environment (IDE) will be used to code the software. GitHub will handle the source code management. It provides the code hosting, and all the Git features [16]. The website will be hosted in UGDSI Computing Laboratory, a UPC department. 4.5 VALIDATION METHODS In order to validate the workflow a week or a fortnight meeting (physical or virtual) with the tutor will be carried out. Besides that, periodical tests will be performed over the system to address the possible issues that may occur. 14 5 STATE OF ART How we can achieve the potential of Sensors as a Service could offer? It is not an easy question. To take the maximum advantage of a sensor network requires a synergy between the hardware and the software. The system has to be defined together; it is not like a PC where the hard and soft can be done quite separately. We can choose a sensor that barely sends the data obtained or a sensor that can compute the data flow and a communication like Ethernet, wireless or a custom one. Just like it happened with the phones, this type of sensors are called smart sensor. Other questions arise, such as power consumption, battery life, accuracy, reliability and connection protocol. The next step relies on how to deal with the enormous amount of data generated. This part represents the core of the project. Can the reader imagine a city like Barcelona with a million of sensors streaming data all the time? What happened if a fireman would like to watch the temperature in the forest to do some prevention work but even more useful if they are the sensors themselves that alert about a possible fire o one that just started and even more useful if that notification also arrives at the police, major and all the departments what this concerns. The possibilities are unimaginable. The scope of the project is broad. There are many concepts involved directly or indirectly. The purpose of this document is to provide an overview of the subjects I will have to handle to develop a successful prototype. 5.1 SENSOR AS A SERVICE Read a variable, or data flow is relatively straightforward given all the sensor and networking technology we could have. The tricky part is to determine the context (the relation between past and current readings) and interpret it, supporting the next decision a person should make. A practical example of it is a Tire-pressure monitoring system (TPMS). Many drivers do not check the pressure in his or her car tiers or even if they do get an accurate reading is difficult. A sensor can help by notifying the flaw in the car dashboard. That information is not very useful inside the vehicle when the driver is outside with the air pump inflating the tire. Nissan [17] cars honk the horn when a tire is sufficiently re-inflated. 15 The Microsoft Research and University of Pittsburgh have recently published a paper named “Finger Shadow: An OLED Power Optimization based on Smartphone Touch Interactions” [18]. They explain a method that can save battery life by dimming the screen area covered by user's fingers. They said that could save 13% on average of screen power consumption. Moreover, the actual capabilities came mixing different sensors. For instance, a GPS localization combined with a purchase history that can guide the user to a shop that he or she might like. It can compare prices of the same product in the area. The next three examples illustrate the bigger potential of sensor fusion, bringing together more variables and supporting advanced computational platforms [19]. · Movea’s MotionCore™ contains a context engine optimized for mobile devices (lowpower and small footprint). It can determine three sets of conditions: 1) Device Position: on body, on table, in bag, in hand, near ear; 2) User Activity: standing, walking, biking, running; 3) Mode of Transport: walking indoors, walking outdoors, in a car, on a plane, in an elevator, on a train. · Sensor Platforms’ FreeMotion™ Library also creates context, with two extensions: a resource manager, which directs compute resources when context has changed, and minimizes power consumption when setting is unchanged; and the idea of context as virtual sensor, an abstraction for developers to access via API. FreeMotion has recently been ported to the NVIDIA® Tegra® 4, with its quad-core ARM Cortex-A15 processors and 72 GPU cores. · Xsens has concentrated on biomechanical motion tracking, going way beyond “walking” or “dancing” into the analysis of 23 body segments. Unlike systems that use reflective dots and depend on lighting and camera angles, Xsens uses MEMS inertial sensors and advanced software to model smoothly and assess human movement in realtime. Enabling context starts with the local processing at the sensor itself, and most sensor vendors – Analog Devices, Bosch Sensortec, Freescale, InvenSense, Kionix, STMicroelectronics, and other members of the MEMS Industry Group – provide libraries to help translate readings into context. For example, STMicroelectronics’ iNEMO Engine is a sensor fusion library implementing Kalman, filtering for adaptive prediction, available in both a free version and a professional version. Here is a list of related implementations, frameworks or designs: 16 - Physical Sensor Management with Virtualized Sensors on Cloud Computing [20]. The authors propose an infrastructure called Sensor-Cloud infrastructure that can manage physical sensors on IT infrastructure. The Sensor-Cloud Infrastructure virtualizes a physical sensor as a virtual sensor on the cloud computing. Dynamic grouped virtual sensors on cloud computing can be automatic provisioned when the users need them. - SenaaS: An Event-driven Sensor Virtualization Approach for Internet of Things Cloud [21]. The authors propose an Internet of Things virtualization framework to support connected objects sensor event processing and reasoning by providing a semantic overlay of underlying IoT cloud. It encapsulates both physical and virtual sensors into services according to Service Oriented Architecture (SOA). SenaaS mainly focuses on providing sensor management as a service rather than providing sensor as a service. - OpenIoT: Open Source blueprint for large scale self-organizing cloud environments for IoT applications [22]. OpenIoT is an Open Source middleware platform aimed to connect Internet-Objects to the cloud. 5.2 SENSOR CLUSTERS AND THE CLOUD Gathering sensors, devices, networks, and users together on the cloud can be done with three sorts of sensor clusters: fixed, agile, and personal. 5.2.1 Fixed Clusters Many applications of sensors are set: the number of sensors is known, the wireless coverage is pre-determined, and the network topology and bandwidth requirements are predictable. These fixed clusters are, usually, managed with knowledge of exactly what sensors should be on the network at any given time to aid in security and maintenance. With a limited range, fixed clusters commonly use familiar WSNs such as ZigBee [23], 6LoWPAN, and Wi-Fi depending on the exact requirements of the devices. They send their data to a gateway or concentrator for cloud connectivity. Gateways offer bandwidth, backed by a high-speed wired or fibered pipe. Thousands of sensors can roll up into one real-time view, and data can be brought into storage networks for further analysis. 17 Fixed clusters are common in industrial, point-of-sale, healthcare, and surveillance applications. 5.2.2 Agile Clusters With longer distances and ad-hoc connections involved, agile clusters incorporate endpoints that move over relatively wide ranges and join and leave networks of interest. An example is an electric vehicle charging station, which is discoverable by nearby cars looking for a charge and seeking information on wait times or special offers such as nearby shopping discounts. Agile clusters typically use cellular M2M (Machine to Machine) technology, which enables a mobile device to access the cloud anywhere there is coverage – ubiquitous in urban and suburban settings, and even more useful with small cell technology. Cellular M2M is well suited for data and not disturbed by a node moving from the access point to the access point, even during transmission. Cellular M2M devices can also be actively managed, with data plans, security, and bandwidth controls. Typical applications for agile clusters are transportation, digital signage, and vending machines. Roaming may be an imperative feature for an application such as a delivery vehicle. Other devices may not move routinely during operation but can be set up or taken down quickly without adding networking infrastructure, once there is coverage for a given area. 5.2.3 Personal Clusters With data and application capability, the smartphone and tablet have brought the power of the cloud to the individual. The space is being extended with smartwatches and lifestyle monitoring devices. Personal clusters are that setup directly around you, anytime, anyplace, with short range networks using the smart device as display and gateway. These small yet significant clusters rely on Bluetooth, NFC, and Wi-Fi Direct for most of their capability – WSNs found in most smartphones today. Sensors are paired, tethered, or scanned as needed, usually with some user interface presented via an application on a mobile device. The applications of personal clusters are just being imagined. The recent push for automotive smartphone integration is an example, with the car being transformed into a gigantic rolling set of sensors. Other examples are the “quantified self” and mHealth 18 and fitness applications, and smart home with security, convenience, and entertainment features. The common theme in all these clusters is the cloud, able to connect sensors quickly and share data without boundaries. Debate rages about which WSN technology is “better”, depending on variables like range, signal penetration, addressability, topology, power efficiency, and more. 19 6 PLANNING The project separate 5 phases. In order to start each point, the previous one must be done. All the elements of the phases mentioned in this document have to be backed up with documentary evidence of the work performed. The deadlines stipulated may change over the project if it does not compromise the whole project. The waterfall methodology is followed in the project planning. The calendar is not a regular one. As the project is carried out individually with a very few schedule restrictions, the timing is flexible. Therefore, it means there is no working time established, e.g. the work may be done on weekends as well as at night. 6.1 TASK DESCRIPTION STEP 1 – STRATEGIC PLAN This stage is part of the GEP course. The goal of it is to help the student to pass the initial milestone. It helps to guide the students in their projects and assure that the idea is properly carried out. STEP 2 – SYSTEM DESIGN This phase comes after the definition. It bases on prepare all the requirements that will be needed to implement the solution. STEP 3 – IMPLEMENTATION & VALIDATION This step is the core of the project. The solution is constructed based on the information provided in the two previous phases. The validation of the coding is not formal. The validation is performed checking the correctness of the features. STEP 4 – TESTING This phase will test the code. Even the previous step validates the software; it still may contain little errors such as poorly user input checking, hardware incompatibility, and security flaws. STEP 5 – FINISH PROJECT This phase divided into two parts. The first part chronologically is dedicated to finishing the documentation and formatting the deliverable. If needed, a user manual will be written. The second part relies on preparing the final presentation of the solution. 20 6.2 ESTIMATED TIME In order to plan the amount of hours needed to develop the project, I take into consideration the following factors. The difficulty of the phase; the days that I will be working on it, previous work on the subject and the credits ECTS of the project. Phase Estimated work-hour Select Project 18h Strategic Plan 106h System Design 55h Implementation & Validation 240h Testing 40h Finish project 90h Total 549h Table 1: Estimated work-hour The central part of the project focus on implementing and testing the solution created. According to that, the major part of the time will be dedicated to writing the code and test it in a real environment. 6.3 FINAL TIME The product has reached the final step. The code and the documentation are written. Looking back to the initial estimation the project took the amount of hours described. It was accurate. The unique fault is that Testing did not take that many hours. 6.4 ACTION PLAN As said previously, the methodology followed is a waterfall. It means that there is not overlap among the tasks. To start a new task, the previous must be finished. It means that each part represents a milestone. There are a few tasks can be overlapped as specified in the diagram. However, it can be modifications if it appears some inconvenience or new key features that should be added. 21 6.5 ESTIMATED TASK PLAN In order to put the solution into practice, the following set of resources will be used. There are two groups, the elements used eventually, and the ones used every time. Occasionally: PC, Server acting as a cloud server, a group of sensors (cameras, temperature, humidity), GitHub, Webcam. The essential tools are Microsoft Office 2013, Windows 7, IDE and Dropbox. The following image shows the tasks to be performed. It contains the start and finish date, the predecessor task, the resources required and the type of job. Task Name Duration Start Finish Pre Resource Names Sensors as a Service Project 40 days Mon Mon 08/09/14 26/01/15 Phase 1 - Strategic Plan (GEP) 101 days Mon Mon 08/09/14 26/01/15 Scope 5 days Mon Fri 08/09/14 12/09/14 Planning 3 days Mon Wed 15/09/14 17/09/14 2 Consultant;Essential tools[1] Budget & Sustainability 3 days Thu Mon 18/09/14 22/09/14 3 Essential tools[1];Accountant Preliminary Presentation 5 days Tue Mon 23/09/14 29/09/14 4 Essential tools[1];Consultant;Web cam[1] Contextualization & References 9 days Tue Fri 23/09/14 03/10/14 4 Essential tools[1];Consultant Final presentation & delivery 7 days Mon Tue 06/10/14 14/10/14 6 Essential tools[1];Consultant Phase 2 - System design 15 days Mon Fri 13/10/14 31/10/14 Requirements Definition 5 days Mon Fri 13/10/14 17/10/14 7 Essential tools[1];Analyst Architecture Design 5 days Mon Fri 20/10/14 24/10/14 9 Essential tools[1];Analyst Consultant;Essential tools[1] 22 Hardware requirements 4 days Mon Thu 20/10/14 23/10/14 9 Essential tools[1];Analyst Use case definition 6 days Fri Fri 24/10/14 31/10/14 10 Essential tools[1];Analyst Phase 3 Implementation & Validation 1 day Mon Mon 03/11/14 08/12/14 4 days Fri Wed 07/11/14 12/11/14 12 Essential tools[1];Programmer;Ecli pse[1];Github[1];Server 0,5 days Thu Thu 13/11/14 13/11/14 14 Essential tools[1];Programmer;Ecli pse[1];Github[1];Server 8,5 days Wed Mon 26/11/14 08/12/14 15 Essential tools[1];Programmer;Ecli pse[1];Github[1];Server 16 Essential tools[1];Programmer;Ecli pse[1];Github[1];Sensors [1];Server 17 Essential tools[1];Tester;Sensors[1 ];Server Core architecture implementation Core Architecture Validation Use Case n implementation Use Case n Validation 8,5 days Wed Mon 26/11/14 08/12/14 Phase 4 - Testing 1 day Tue Wed 09/12/14 17/12/14 Test whole implementation among different systems 3,5 days Fri Wed 12/12/14 17/12/14 Phase 5 - Finish project 1 day Thu Fri 18/12/14 23/01/15 Finish documentation 6 days Thu Thu 18/12/14 25/12/14 18 Essential tools[1];Consultant Format the deliverable 3 days Fri Tue 26/12/14 30/12/14 21 Essential tools[1];Administrative Prepare the presentation 18 days Wed Fri 31/12/14 23/01/15 22 Essential tools[1];Consultant Present the solution 1 day Mon Mon 26/01/15 26/01/15 23 Essential tools[1];Consultant Table 2: Tasks 23 The next image displayed below is a Gantt diagram of the workflow. Figure 2: Gantt diagram 24 6.6 FINAL TASK PLAN The initial project was supposed to be presented in January. It took much time than I expected. Limit the boundaries and knowing the tools to use required much time. The estimated made in September were quite right, but the fact that I had to learn and establish exactly what I wanted to do made the project longer. In order to adjust to the reality, from the previous Gantt I added a couple of months more allocated to learn and establish the goals of the system. 25 7 FEASIBILITY STUDY 7.1 INITIAL CONSIDERATIONS - The amounts showed in this section are based on the Spanish average - The personnel costs are obtained from the INE (Instituto Nacional de estadística). Precisely from the trimestral survey of labor cost divided by jobs. [24] - Cost per hour covers all the expenses of the worker. It includes the wage, the vacations, and the bonuses. - Extra cost per hour covers the taxes (Cotizaciones a la Seguridad Social) and expenses e.g. Gas. - The amortizations are calculated in days of use. The same result can be used to calculate how much will cost to rent the hardware. 7.2 HUMAN RESOURCES COST The following images represents the budget required to carry out the project. Step Select project topic and register it Choose a subject Contact the tutor Apply for the project Prepare the environment Total 1. Strategic Plan Scope Planning Budget & Sustainability Preliminary presentation Contextualization & References Final presentation & delivery Total Cost per hour Extra cost per h. 6 4 4 4 18 17,75 € 11,67 € 11,06 € 15,09 € 5,85 € 4,15 € 4,15 € 5,90 € 141,60 € 63,28 € 60,84 € 83,96 € 349,68 € Consultant Consultant Accountant Consultant 16 13 15 13 17,75 € 17,75 € 14,03 € 17,75 € 5,85 € 5,85 € 5,06 € 5,85 € 377,60 € 306,80 € 286,35 € 306,80 € Consultant 21 17,75 € 5,85 € 495,60 € Consultant 28 17,75 € 5,85 € 660,80 € Job Type # Hours Consultant Administrative Administrative Technical 106 Total 2.433,95 € 2. System Design 26 Requirements Definition Architecture Design Hardware requirements Use case definition Total Analyst; I+D Analyst; I+D Analyst; I+D Analyst; I+D 15 10 10 20 55 18,43 € 18,43 € 18,43 € 18,43 € 5,42 € 5,42 € 5,42 € 5,42 € 357,75 € 238,50 € 238,50 € 477,00 € 1.311,75 € Programmer 50 17,75 € 5,85 € 1.180,00 € Programmer 10 17,75 € 5,85 € 236,00 € Programmer 150 17,75 € 5,85 € 3.540,00 € Programmer 30 240 17,75 € 5,85 € 708,00 € 5.664,00 € 4. Testing Test whole implementation among different systems Total Tester 40 16,42 € 4,61 € 841,20 € 5. Finish project Finish documentation Format the deliverable Prepare the presentation Present the solution Total Consultant Administrative Consultant Consultant 3. Implementation & Validation Core architecture implementation Core architecture Validation Use Case n implementation Use Case n Validation Total Total Adjustment TOTAL 40 5% 30 5 50 5 90 841,20 € 17,75 € 11,06 € 17,75 € 17,75 € 5,85 € 4,15 € 5,85 € 5,85 € 708,00 € 76,05 € 1.180,00 € 118,00 € 2.082,05 € 549 27 12.682,63 € 634,13 € 576 13.316,76 € Table 3: Human resource cost The adjustment is to cover possible unexpected situations. 27 7.3 EXPENSES Amortizations PC Server Sensors Windows 7 Microsoft Office 365 small business Total # Items 2 1 4 1 1 # Days Value 150 120 80 150 1.000 € 1.500 € 30 € 129 € Depreciation per year 25% 25% 25% 33% 150 150 € 100% Depreciation Cost per day 10,27% 205,48 € 8,22% 123,29 € 5,48% 6,58 € 13,56% 17,49 € 41,10% 61,64 € 2.809 € 414 € Table 4: Amortization Energy Energy consumption PC Energy consumption Server Energy consumption Office Total # Hours Kw kWh Cost 500 0,3 0,13 € 19,50 € 2200 0,25 0,13 € 71,50 € 550 1 0,13 € 71,50 € 3250 1,55 163 € Table 5: Energy consumption Supplies Water supply Internet & telephone Office supplies 4 Cost per month 15 € 4 50 € 200 € 1 50 € 50 € # Months Cost 60 € Total 310 € Table 6: Supplies cost Headquarters Rent Maintenance # Cost per Months month 5 800 € 5 Cost 4.000 € 100 € 500 € Total 4.500 € Table 7: Headquarters cost 28 Taxes # Months Cost per month Cotització a la seguretat social 5 - - IBI 5 50 € 250 € Waste tax 5 - - IAE - - - Impuesto de sociedades - - - Business society establishment - - Management cost Cost 500 € 500 € Total 750 € Table 8: Taxes Total Adjustment TOTAL 6.136,98 € 5% 306,85 € 6.443,83 € Table 9: Total expenses There are some considerations. “Cotización a la Seguridad social” is included in the personnel wages as part of the extra cost per hour. The IBI tax is paid to the council and varies in each city. Usually, the amount of money is calculated in function of the price of the local where the business activity takes place. For further information check [25]. The waste tax is paid to the council and varies in each city. In many cities, you do not have to pay it. The IAE (Impuesto Actividades Económicas) is paid to the council. Only the companies that exceed 1 million euros have to pay it. The business establishment includes the paperwork required to start a company e.g. trade name register. To create a society, at least, the owner/s must have 3.000€ capital for a limited company and 60.000€ for a corporation. The “Impuesto de Sociedades” is paid depending on the profit. There are many factors that can change the percentage. It varies from 20% to 30%, but it can be fewer thanks to some tax deduction e.g. hire a new employee. For further information [26] 29 7.4 SALES The previous calculations represent the cost of the project. In this section, I will describe how to make the project profitable. Product Cost Total Cost % Profit Sale Price Personnel 13.316,76 € 30% 17.311,79 € Expenses 6.443,83 € 30% 8.376,98 € Total 19.761 € 25.689 € Table 10: Overall product Cost - Cost per hour - Extra cost per h. - 4.000 € Facebook campaign - - - 3.000 € Other advertisement - - - 2.000 € Salesman 80 16,42 € 4,61 € 1.682 € Marketing # Hours Google campaign Total Budget 10.682 € Table 11: Marketing cost Concept Job Type # Average Hours Install a new sensor on the city Technical 0,5 15,09 € 5,90 € 10 € 30% 13,64 Sensor cost - - - - 15 € 30% 19,50 Programmer 0,2 17,75 € 5,85 € 5€ 30% 6,14 Administrative 0,1 11,67 € 4,15 € 2€ 30% 2,06 - - - - 5€ 0% 5,00 Sensor configuration Administrative management Extras (traveling, managing) Total Cost per hour Extra cost per h. Total Cost % Profit Sale Price 37 € 46 € Table 12: Install a sensor cost 30 Concept Gross with profit Product cost 25.689 € Marketing 10.682 € Total cost 36.371 € # Customers 100 Monthly amortization 3,0% Average user per month expenses 10,911 € VAT 21% Average user per month expenses VAT 13,203 € Table 13: Average user payment I believe that the product is profitable. The costs and profits describe a reasonable scenario, also includes variations and unexpected events. The information of the table 1 comes from the calculations made before. Table 2 stands for an approximation of a marketing campaign. Table 3 represents the cost of mounting a sensor over the city. This calculation is difficult because it depends on many factors such as internet connectivity, city facilities and many more. I thought that an approximation to the cost of mounting a sensor was needed in order to calculate an average payment per sensor. I assumed that the system will run with a hundred of active subscribers, and an amortization of 3% monthly which means that the entire initial investment plus a profit of 30% will be paid in less than 3 years. I sincerely believe that the business analysis is accurate, and the solution can be a serious competitor in the market. Variable Value Cost of a sensor 46 € # Usage hour per month and sensor 200 Company sell price per hour and sensor 0,2317 € Our income per hour 0,018 € Average sell price sensor per hour 0,2500 € Table 14: Average price sensor per hour 31 7.5 SOCIAL IMPACT The solution to develop is focused in a relatively new field. Nowadays is not widely used practically. It exists many research investigations but still there is a lack of practical experiments compared to the possibilities that IoT can bring. A goal of the product is to make it economically viable but also to test this new environment deep. I honestly think that my work will contribute creating a useful solution. The project is limited to work in Barcelona environment. Because it is where it will be tested, and Barcelona is one of the top smart cities in the world. The project intends to create a system to work in the public administration. Help the different departments to share resources, unify and simply the management of remote sensors. It also improves citizens’ life as they could access to this information and take profit of the business model designed. 7.6 ENVIRONMENTAL IMPACT This project has a very little impact on the environment. The central part of the project is developed using a standard PC. A group of sensors is required to produce the last part. The power consumption of the PCs is described in the expenses section. The amount is 5037w of electricity. Converted to CO2, it represents three tons of CO2, plus the CO2 of the transport, the total number results in 3.5 tons of CO2 sent out. This estimation is based on the Spanish electricity system according to the European Union [27]. For further information about CO2 consumption check out the IDAE (Instituto para la Diversificación y Ahorro de Energía) web page. The project is carried out entirely within the PCs or the sensors. The amount of paper used is insignificant as well as water or others. The sensors could emit radio electrical or electromagnetic radiations. However, the intensity will be very low. Thus, it cannot be considered pollution. The software developed will be available for future work on the field. In fact, it can help another project to save resources, therefore, occasionally it can save energy. The hardware required is reduced to a group of sensors that could be borrowed from the university and be used after the project for other purposes. By means of conclusion, I would say the ecological footprint of this project is reasonable. 32 8 PRODUCT SPECIFICATION 8.1 INTRODUCTION Our product is a web application that facilitate the access of the sensors. The solution is intended to work among a variety of situations. Companies could loan sensors, and other companies or final users can use them paying a establish price. This section describes the software to be developed technology independent. 8.2 STAKEHOLDERS The following table describes the stakeholders of the project. Role Subscriber User System administrator Cloud provider Sensor as a Service company Third party app Sensor company Description The entity that have the right to access the sensors. The subscriber pays for the usage of the sensors. The subscriber can have multiple users associated. The entity that consumes the data provided by the sensors. The person who is in charge of the well behavior of the system. The entity that is responsible for maintaining the cloud. The company that manages all the system. A third party software that access the sensors via API The company that owns and manages the sensors. 8.3 GOALS The goals express why the stakeholders will want this solution. Goals are expressed using SMART criteria. SMART stands for Specific, Measurable, Assignable, Realistic and Time-related. The business model has to be accurate, sustainable and provide a win-win for customers and companies. The platform has to offer a reliable infrastructure. Avoid unwanted access, an up time similar to other services on the Internet and perform well with hundreds of users gathering data simultaneously. Design and develop a platform for resource sharing among companies and subscribers. 33 The user has to be able to access the data from a sensor without any technical knowledge. Develop a functional system that can be presented as a “Projecte Final de Grau” in April 2015. 8.4 DOMAIN PROPERTIES AND HYPOTHESIS The project is designed and developed without the participation of the stockholders. I made assumptions simulating their behavior: · Truthfulness: We designed the platform without taking into consideration aspects involving the correctness of the given information. In a real environment, we should provide the platform some tools to check the integrity of the data as well as to assure the identity of the participants. Sensor data, billing information and user details are a sensitive data that must be kept well secure, strictly follow the laws and provide the users some way to erase all the data they have produced. 8.5 CONCEPTUAL SCHEMA Figure 3: Conceptual schema 34 8.6 USE CASES Figure 4: Use cases Use case 1 Description Actors Trigger Precondition Add Subscriber The administrator of the platform inserts a new subscriber to the system. Admin, Subscriber, Service Provider and System New client 1. The subscriber signed the contract with the provider Postconditions 1. New subscriber is entered into the system Steps 1. The administrator enters the information about the client 2. Platform validates and stores the information Exceptions If the information is not correct, the system informs the administrator in order to solve it. 35 Use case 2 Description Actors Trigger Precondition Delete Subscriber The administrator of the platform removes a subscriber from the system. Admin, Subscriber, and System Delete Client 1. The subscriber wants to end the contract Postconditions 1. The subscriber is deleted from the system and, therefore, all the users associated with that subscriber Steps 1. The admin received the order to delete the subscriber 2. The admin requests the deletion of the subscriber 3. Platform validates and deletes the subscriber Exceptions If the information is not correct, the system informs the administrator in order to solve it. Use case 3 Description Add Company The administrator of the platform inserts a new company to the system. Admin, Company, and System New company 1. The company signed the contract with the provider Actors Trigger Precondition Postconditions 1. New company is entered into the system Steps 1. The administrator enters the information about the company 2. Platform validates and stores the information Exceptions If the information is not correct, the system informs the administrator in order to solve it. 36 Use case 4 Description Actors Trigger Precondition Remove Company The administrator of the platform removes a company from the system. Admin, Company, and System Remove company 1. The company wants to end the contract with the provider Postconditions 1. The company is removed from the system Steps 1. The admin received the order to delete the company 2. The admin requests the deletion of the company 3. Platform validates and deletes the company Exceptions If the information is not correct, the system informs the administrator in order to solve it. Use case 5 Description Search sensors by location A user wants to search the available sensor within an area. User and System Search sensors 1. The user is logged in 2. The user has the required privileges Actors Trigger Precondition Postconditions 1. A group of sensors close to the specified area is showed Steps 1. The user access the sensors tab 2. The user specifies the desired area 3. The system validates the input Exceptions 37 Use case 6 Description Actors Trigger Precondition Search sensors by type A user wants to search the available sensor by its type User and System Search sensors 1. The user is logged in 2. The user has the required privileges Postconditions 1. A group of sensors of the specified type is showed Steps 2. The user access the sensors tab 3. The user specifies the desired area 4. The system validates the input Exceptions Use case 7 Description Actors Trigger Precondition Add user The subscriber adds a new user. User, Subscriber, and System New user 1. The subscriber is logged in Postconditions 1. A new user is created and stored. Steps 1. The subscriber access the administration section 2. The subscriber selects create a new user 3. The subscriber introduces the information related to the new user (e.g. email, password) 4. The system validates the information Exceptions If the information entered is not correct, the system informs the user in order to solve it. 38 Use case 8 Description Actors Trigger Precondition Delete user A subscriber deletes a user account. User, Subscriber, and System Delete user 1. The subscriber is logged in Postconditions 1. The user is deleted. It has no longer the ability to login, but the actions made by the user might remain in the database. Steps 1. The subscriber access the administration section 2. The subscriber selects remove the user account 3. The system asks for a confirmation 4. The subscriber confirm 5. The system deletes the account Exceptions Use case 9 Description Actors Trigger Precondition Change usage and payment parameters A subscriber wants to change the payment information Subscriber and System Change payment attributes 1. The subscriber is logged in Postconditions 1. The payment information is changed. Steps 1. The subscriber access the administration section 2. The subscriber selects change payment information 3. The system asks for a confirmation 4. The subscriber confirm 5. The system makes the changes Exceptions 39 Use case 10 Description Actors Trigger Precondition Obtain statics The user wants to see statics related to the sensors User and System Obtain statics 1. The user is logged in 2. The user has the required privileges Postconditions 1. The statics are showed Steps 1. The user selects obtain statics Exceptions Use case 11 Description Actors Trigger Precondition Set up notifications The user can configure the notifications. The types of notifications, the frequency, the way of notifying and the importance. User and System Set up notifications 1. The user is logged in 2. The user has the privileges Postconditions 1. The notifications setting has changed Steps 1. The user access the settings section 2. The user marks change notifications 3. The user specifies the new configuration 4. The system validates the selection Exceptions If the information entered is not correct, the system informs the user in order to solve it. 40 Use case 12 Description Actors Trigger Precondition Obtain information about the system The web page will have a help section where are described the portioning mode of the software. This information can be written in a FAQ style, as a guide or both. User and System Get help 1. The user is logged in Postconditions 1. The user has read the software guide Steps 1. The user access the help section 2. The user navigates trough the help section in order to obtain the desired information Exceptions Use case 13 Description Actors Trigger Precondition Add sensor to favorites The user wants to add a sensor to the favorite list User and System Add sensor 1. The user is logged in 2. The user has the required privileges Postconditions 1. The sensor is added to the list Steps 1. The user selects a sensor to add 2. The system adds the sensor Exceptions 41 Use case 14 Description Actors Trigger Precondition Delete sensor to favorites The user wants to delete a sensor to the favorite list User and System Delete sensor 1. The user is logged in 2. The user has the required privileges 3. The sensor is in the favorites list Postconditions 1. The sensor is deleted to the list Steps 1. The user selects a sensor to delete 2. The system deletes the sensor from the favorites list Exceptions 8.7 REQUIREMENTS A requirement is something that the product must do, or a property that the product must have, and that is needed or wanted by the stakeholders. Each requirement in this section should be: Correct Traceable (both forward and backward to prior/future artifacts) Unambiguous Verifiable (i.e., testable) Prioritized (with respect to the importance and/or stability) Complete Consistent Uniquely identifiable (usually via numbering) In order to accomplish the prioritized condition and make the process of implementing as clear as possible the requirements can be: Essential: Implies that the software will not be acceptable unless these requirements are provided in an agreed manner. Conditional: Implies that these are requirements that would enhance the software product, but would not make it unacceptable if they are absent. 42 Optional: Implies a class of functions that are worthwhile, but depending on the available resources they might not be implemented. 8.7.1 Functional Requirements • Abstract. Implementation independent. • Unambiguous. Can be interpreted in only one way. • Traceable. Its source is known. • Validatable. There are means to prove that the system satisfies the requirement. Functional requirements are the fundamental or essential subject matter of the product. They describe what the product has to do or what processing actions it is to take. Reference FR 1 Definition The users have to be able to search sensors Description The users can search among all the available sensors the one they desire Stakeholder User Degree of Essential necessity Reference Definition Description Stakeholder Degree of necessity FR 2 The users can visualize a sensor data The users can visualize the data of a sensor by selections one of them. The kind of data can vary. E.g., text, audio or video. User Essential Reference Definition Description Stakeholder Degree of necessity FR 3 The users can manage favorite sensors The users can add sensors to a favorite sensor pool User Essential Reference Definition Description FR 4 The sensor data is accessible via API The data gathered from a sensor can be accessible via API to third party apps. Third party app Essential Stakeholder Degree of necessity 43 Reference Definition Description Stakeholder Degree of necessity Reference Definition Description Stakeholder Degree of necessity Reference Definition Description Stakeholder Degree of necessity Reference Definition Description Stakeholder Degree of necessity Reference Definition Description Stakeholder Degree of necessity FR 5 A subscriber can manage users belonging to itself The subscribers can add users that depend on themselves. All of these users will share the same sensor quota and billing User, Subscriber Essential FR 6 A subscriber can change its billing information The subscriber can add or modify the way to pay for the services from our company Subscriber Essential FR 7 The companies can manage its sensors The companies can add/remove and change the prices for their sensors Company Essential FR 8 The admin of the platform can add/remove companies and subscribers The admin of the platform “Sensor as a Service” manages the subscribers and companies. Company Essential FR 9 The system can reallocate sensors. If one sensor fails, the system offers to the user another similar sensor. User Essential 44 8.7.2 Non-Functional requirements Non-functional requirements are requirements that specifies criteria that can be used to judge the operation of a system, rather than specific behaviors. 8.7.2.1 Interface Requirements USER INTERFACES Reference Definition Description Stakeholder Assessment Degree of necessity Reference Definition Description Stakeholder Assessment Degree of necessity Reference Definition Description Stakeholder Assessment Degree of necessity UI1 The design must be clear and functional. The design has to permit a correct navigation, and the vocabulary shall not lead to confusion. The web does not need to be attractive, but it must be clear. User Any person that can use the an ordinary web page should be able to interact with the product Essential UI2 The software will be accessible in various languages. The primary language of the web will be English. However, it is recommended to offer it is Spanish and Catalan too. User Check the correctness of the translations Optional UI3 The web page is displayed without errors in the most used web browsers. The web page follows the w3c standard and remains as designed without problems in the most used web browser (e.g. Chrome, Firefox, and Internet Explorer). User Navigate using the browsers Essential 45 Reference Definition Description Stakeholder Assessment Degree of necessity UI4 The system is accessible via API. Access the data throughout an API. Third party app An API wiki or doc is generated Optional HARDWARE INTERFACES Reference Definition Description Stakeholder Assessment Degree of necessity HI1 All the sensors must have the same interface. The backend has to be able to connect to a varied range of sensors without knowing its internal structure nor implementation. System Connect to different sensors without any issue Essential COMMUNICATIONS INTERFACES Reference Definition Description Stakeholder Assessment Degree of necessity Reference Definition Description Stakeholder Assessment Degree of necessity CI1 The content retrieved may have different types. The communication between the platform and the sensors should permit flexibility. E.g., streaming, scheduled data. User, Cloud Platform Test different kinds of data retrieving Conditional CI2 The system must support the most used connection protocols. The sensors can send the information using a variety of technologies. (E.g., 3g, GPRS, Wi-Fi). Cloud Platform Establish a connection using the available communication technology Conditional 46 Reference Definition Description Stakeholder Assessment Degree of necessity CI3 Maximize the battery of the sensors by means of the communication. If the sensor does not have a source energy stable, e. g. Battery, solar energy, the system must retrieve the data at the best time, using the less energy possible and maintaining the user experience. User To test different kinds of data. Optional 8.7.2.2 Operational Requirements PERFORMANCE Reference Definition Description Stakeholder Assessment Degree of necessity Reference Definition Description Stakeholder Assessment Degree of necessity NFP1 The system has to deliver the sensor information in real time. The information of the sensor has to be accessible as fast as possible. The time needed may vary depending on the hardware. User, Cloud Platform The access to a unique sensor should take less than five seconds Essential NFP2 The system has to be scalable. The architecture has to enable a fast growing. It means that the system has to prepare for an exponential growing in users, sensors, and queries. Cloud Platform Adding more data does not imply architectural changes Essential 8.7.2.3 Reachability Reference Definition Description Stakeholders Assessment Degree of necessity R1 The Cloud Platform has to reach all the available sensors. For each query, the system has to deliver all the mapped sensors that match that query. User, Cloud Platform Do a test assuring this requirement Essential 47 8.7.2.4 Availability Reference Definition Description Stakeholders Assessment Degree of necessity A1 The system has to be available all the time. The cloud platform must be accessible at least 99,9% of the time. Users, Cloud Platform Get access without a registered account shall not be possible Essential 8.7.2.5 Security Reference Definition Description Stakeholders Assessment Degree of necessity NFS1 The system must deny access to unauthorized users. The stakeholder will require a trusted system and be confidence about the security and privacy of the data. Users Get access without a registered account shall not be possible. Essential 8.7.2.6 Maintainability Reference Definition Description Stakeholders Assessment Degree of necessity NFM1 The system must be restorable. In order to prevent data loss, the system backs up the information daily without any actions of the users neither the administrators. Moreover, all the actions committed must be registered in a log file. System admin The system is performing backups, which can be used to restore. Essential 8.7.2.7 Partition tolerance Reference Definition Description Stakeholder Assessment Degree of necessity NFA1 The cloud platform is partitionable. The elements of the system can be allocated to several nodes. System admin The system allows splitting the data into various nodes. Essential 48 8.7.2.8 Legal requirements Reference Definition Description Stakeholders Assessment Degree of necessity L1 The system must follow the legislation and the requirements marked by the administration. Assure that the software respects the actual legislation and primarily follows the LOPD. Users Analyze if the system follows the LOPD Essential 8.7.2.9 Database Reference Definition Description Stakeholder Assessment Degree of necessity Reference Definition Description Stakeholder Assessment Degree of necessity Reference Definition Description Stakeholder Assessment Degree of necessity DB1 The sensor database must be fast. The queries must be answered immediately to provide a useful product. Cloud platform Less than 0,5s is acceptable. Depending on the available hardware. Essential DB3 The sensor database has to be highly available. To assure a good service, the available rate has to be superior to 99%. Cloud Platform Essential DB4 The sensor database must be largely scalable. The amount of users and sensors may vary within hours. The system must be prepared to allow this changes. Cloud platform Add more data will not end to changes in the architecture. Essential 49 8.8 SATISFACTION ARGUMENT Goal 1: The business model has to be accurate, sustainable and provide a win-win for customers and companies. This goal is achieved and explained in the section 6 of this document. Goal 2: The platform has to offer a reliable infrastructure. Avoid unwanted access, an up time similar to other services on the Internet and perform well with hundreds of users gathering data simultaneously. This goal is achieved by means of: Requirement NFP1: “The system has to deliver the sensor information in real time.” Requirement NFP2: “The system has to be scalable.” Requirement A1: “The system has to be available all the time.” Requirement NFS1: “The system must deny access to unauthorized users.” Requirement DB3: “The sensor database has to be highly available.” Requirement DB4: “The sensor database must be largely scalable.” Goal 3: Design and develop a platform for resource sharing among companies and subscribers. This goal is achieved by means of: Requirement FR1: “The users have to be able to search sensors.” Requirement FR2: “The users can visualize a sensor data.” Requirement FR3: “The users can manage favorite sensors.” Requirement FR7: “The companies can manage its sensors.” Requirement FR8: “The admin of the platform can add/remove companies and subscribers.” Goal 4: The user has to be able to access the data from a sensor without any technical knowledge. This goal is achieved by means of: UI1: “The design must be clear and functional.” UI3: “The web page is displayed without errors in the most used web browsers.” 50 HI1:” All the sensors must have the same interface.” FR2: “The users can visualize a sensor data.” Goal 5: Develop a functional system that can be presented as a “Projecte Final de Grau” in April 2015. This goal is achieved and explained in the section 5 of this document. 51 9 DESIGN The system has been designed to be allocated on top of an existing Infrastructure as a service (IaaS) provider. This project will not go into hardware requirements such a firewall, hard disk drive nor network. The scope is to define and implement the software capable for a provide sensors as a service. Products that run on dedicated servers or Virtual Machines that support a hundred or so users simultaneously accessing thousands of devices may not scale well. Even if horizontal scaling is possible, inefficient use of resources can raise the cost of providing SaaS services above the target. Latency issues can cause poor performance on public clouds if proper optimization is not done. Security must be fundamental to the architecture given the nature of shared resources. The figure 3 represents the structure of the system described divided into layers. Each layer is explained in the followings sections. User interface Sensor as a service logic Database Cloud Management Communication Physical sensor Figure 5: System architecture 52 9.1 USER INTERFACE The Sensors as a Service platform will be accessible through a web page. The web provides access to the pool of sensors, quotas, and news feed. One can login as a user to consume date or as a company to manage the sensors and payment info. The web is Restful. Also, the web is an API that delivers the information in JSON. 9.2 SENSOR AS A SERVICE LOGIC In order to run the web and web server, we use Ruby on Rails [28]. Ruby [29] is a dynamic, object oriented, open source programming language among many other features. I chose Ruby because of the framework Ruby on Rails. Rails is a full stack web server MVC, Model View Controller, and development platform for dynamically created database backend websites. The term full stack means that rails do all the process from getting the request and processing going to the database, modeling the web and sending HTML, CSS, JavaScript content or error handling. Rails is a Ruby Gem that implements full web server and dynamic DB driven website generator. Ruby on Rails or RoR is based on convention over configuration and DRY (Don’t repeat yourself). These aim to facilitate the programmer’s task as well as reduce the number of bugs. RoR is a young framework but reputed. It has been used by Twitter, GitHub, Soundcloud, and it is used as well for many new startups. The application is model-driven written in Ruby. Grounded in the MVC and using gems as external services. A web interaction works as follow: 1. A user asks the web server for the sensors in an area. 2. The web server sends the request to the Cloud Management system. 3. The Cloud Manager replies 4. The user opens a sensor 5. The Cloud Manager stores the session 9.3 DATABASE Based on the requirements, flexibility, an enormous amount of devices, fast access, and retirement a NoSQL solution will fit. It allows a very flexible and scalable solution, enabling us to specify with detail the implementation. On top of that, many of the NoSQL 53 solutions are free to use, and the source code is available which permits an easy integration with our system. Inside the NoSQL tag, there are several kinds of solutions for different purposes each one, e.g. Document store, key-value, graph, object store. A Graph database is designed for data whose relations are well represented as a chart. Elements interconnected with an undetermined number of relations between them. This structure fits perfectly with our solution. Although all the key features that could offer a NoSQL solution, the focus of this project is not to design a database. Therefore, and since our tests will not have thousands of sensors we will stick to a Relational database management system for the purpose of this project. 9.4 CLOUD MANAGEMENT A cloud stack consists of following major components: 1. Hardware infrastructure 2. Operating system infrastructure 3. Cloud API layer that enables consumption and orchestration of underlying cloud infrastructure 4. Cloud Management layer that provides governance, resource planning, and financial planning. 5. Applications running on top of cloud infrastructure Specify, designing and implementing all of these layers would require entire projects for themselves. These projects focus on the Cloud Management layer and the application running on top of it. 9.4.1 Cloud API layer Cloud APIs allow software to request data and computations from one or more services through a direct or indirect interface. Cloud application programming interfaces specify how software applications interact with a cloud-based platform where these applications can be deployed. 54 They offer ways by which the applications can request information from the platforms and use their facilities. The API should be a platform not only independent but also language independent. There are dozens of Cloud APIs with or without infrastructure available. Many of them are well known for the developer’s community such as Amazon EC2, Microsoft Azure or Google computer engine. But not all of them fit in this project. The Cloud layer must be: - Open Source: To enable changes in the code, better understanding of what is going on It does not require a large pool of hardware to use it Free to use the license The following clouds might work: - OpenStack by OpenStack Foundation CloudStack by Apache The following points describes each solution in order to make the most accurate choose. 9.4.1.1 Apache CloudStack [30] [31]: CloudStack is open source cloud computing software developed to create, manage and deploy cloud infrastructure. It was launched by Cloud.com and made generally available in May of 2010 as free software under the GNU General Public License. In July 2011, Citrix purchased Cloud.com that resulted in Citrix donating CloudStack to the Apache Software Foundation (ASF), where it was accepted as part of the Apache Incubator. Today CloudStack is a single top level ASF project built around a committee of developers. Even though the project has a smaller community of committers than OpenStack, it is a cohesive single project that is commercially backed by a primary contributor, Citrix. Today over 50% of the Apache CloudStack code development is produced by a team of Citrix developers, many of who came from the Cloud.com acquisition. Not only is Citrix involved in the development of new features and bug fixes for the CloudStack platform, but also Citrix produces a commercial distribution of CloudStack called Citrix CloudPlatform. . Originally, CloudPlatform was a customized distribution of the CloudStack code base, which contained a significant feature divergence. As of the release of CloudPlatform 4.2 in September of 2013, all Citrix customizations have been committed back to the Apache CloudStack project; further justifying that Citrix is committed to the open source project and is continually working on products and services utilizing the core platform. The goal of the Apache CloudStack project is to continue to develop a stable cloud orchestration layer that is capable of 55 supporting various workloads. The cohesive project continually supports infrastructure, hypervisors and varying platforms with a commitment to a robust upgrade path, quality assurance, and regression. 9.4.1.2 OpenStack [32] [31] OpenStack is an open source cloud computing platform for public and private cloud environments. Jointly launched in July of 2010 by Rackspace Hosting and NASA, the project intended to help organizations offer cloud-computing services running on standard hardware. The early code for OpenStack came from NASA’s Nebula platform and Rackspace’s Cloud Files platform. In 2011, developers of the Ubuntu Linux distribution adopted OpenStack with an unsupported technology preview of the OpenStack “Bexar” release for Ubuntu 11.04. Ubuntu’s sponsor Canonical then introduced full support for OpenStack clouds, starting with OpenStack’s Cactus release. In 2012, Red Hat announced a preview of their OpenStack distribution, beginning with the “Essex” release and introduced commercial support in July 2013. During the same time, NASA released an internal audit citing lack of technical progress and other factors as the primary reason for dropping out as an active developer of the project. Currently, OpenStack is comprised of ten sub-projects, each having their technical lead. The community collaborates around a six-month, time-based cycle in which a new lead is assigned to each sub-project, resulting in ever changing and distributed leadership. The project is managed by the OpenStack Foundation, a non-profit corporate entity established in September 2012 to promote OpenStack software and its community. The following table made by Appcore [33] summarizes both systems: 56 Table 15:Cloudstack vs OpenStack Both systems have similar features. While CloudStack was designed as a singular system that operates in a cohesive manner; OpenStack is a combination of different project, and it is a bit harder to set up. However, both projects evolved well, and it is tedious whether to choose one or the other. I chose OpenStack because of its flexibility, and it can be used it with Ubuntu natively. I also decide it because it has a larger community of developers and more documentation. 57 Before going to the technical specification and the setup. Let’s explain OpenStack more precisely. Described by OpenStack Foundation: “OpenStack aims to produce the ubiquitous Open Source Cloud computing platform that will meet the needs of public and private clouds regardless of size, by being simple to implement and massively scalable.” OpenStack is open source software that delivers a framework of services for API based infrastructure consumption. The "plug-in" architecture of OpenStack services enables various vendors to integrate their infrastructure solutions to deliver an OpenStack cloud. OpenStack is a software layer that sits on top of the software infrastructure and allows an API based consumption of infrastructure. OpenStack enables "selfservice" model in which application owners can directly request and provision the compute, network, and storage resources needed to deploy their application. The primary benefits of self-service are increased agility from applications owners getting "on demand" access to the resources they need and reduced operating expenses by eliminated manual + repetitive deployment tasks. In a few points OpenStack is: Cloud computing project providing an IaaS Open Source infrastructure and application middleware for building private and public clouds Cloud operating system/framework that controls large pools of compute, storage, and networking resources throughout a data center Global community of technologists, developers, researchers, corporations and cloud computing experts OpenStack started in 2010 as a joint of Nebula project from NASA and Swift project from Rackspace. It is managed by the OpenStack Foundation, a non-profit corporate entity and supported by more than 200 companies including AT&T, AMD, Cisco, Dell, HP, IBM, Intel VMWare, RedHat and Yahoo [32] Lately, the releases came out every six months and are named after the city or street near the meeting places. Also, the releases are sorted by name being Austin the first, Bexar the second and so on until Juno. It was launched on 16th October 2014 58 The four ‘O’ of OpenStack: - Open Source o All code is Apache 2.0 licensed - Open Design o Anyone can attend or propose new features or code o Summits held two times per year - Open Development o All code available at https://github.com/openstack - Open Community o Official docs at http://docs.openstack.org o Ask OpenStack at https://ask.openstack.org/en/questions/ OpenStack is a framework divided into multiple top-level projects. Each one has its developers and design teams. Here is a list of the projects: - Identity (Keystone) - Compute (Nova) - Networking (Neutron) - Object Store (Swift) - Block Storage (Cinder) - Database Service (Trove) - Image Service (Glance) - Dashboard (Horizon) - Metering Service (Telemetry/Ceilometer) - Orchestration Service (Heat) - Data Processing (Savanna) Architecture: - Has a well-defined public API, with the exception of Horizon (dashboard), which is the web GUI; all the other projects have an RESTfull (JSON/HTTP) API - Users of OpenStack can only talk to it via these APIs - Service store state in the database - Services use queue for orchestration 59 Figure 6: OpenStack schema 9.5 COMMUNICATION Analyze and evaluate which is the option that best performs for this project could be itself another project [34] [35]. Therefore, I will not deal with the specification to be used in this field. However, the software must be able to adapt to heterogeneous connection protocol. The tricky part is the link of the sensors to the Internet. It could be wired or wireless. As a wireless connection, the communication can be done using IEEE 802.11 or Wi-Fi, GSM, IEEE 802.16 (WiMAX), Bluetooth, Satellite or RFID. In the wired group the IEEE 802.3 (Ethernet), fiber or digital subscriber line. Communicate the platform with the users and the sensors can vary depending on the needs. The sensor data communication protocol can be UPD or TCP and the format JSON. For the user interface, the communications will happen under TPC and using HTTP/S, and we will use the standard web formats e.g. HTML, CSS or JavaScript. 60 9.6 PHYSICAL SENSOR As I discussed previously, each group of sensors will be an OpenStack “Compute” instance. We could design the system as a group of sensors connected to a large datacenter, and the group sends raw data to it. However, we wanted to create a truly distributed sensor infrastructure where the sensors are autonomous and can work without the main server. How can we achieve it? We can install a regular PC with OpenStack on it using any Linux compatible distribution. It will work correctly, but it is not the optimal solution. It is not because we are dealing with sensors such as cameras, temperature sensing, noise detection and so forth. Therefore, we intend to provide a realistic system where you can put thousands of sensors all around the city without having to buy all this amount of underused PCs. The solution is to use a cheap, small, power efficient computer instead. However, it has to be powerful enough. We can use a mini-PC or a NUC [36] but it is not cheap enough. We found a more convenient solution a Raspberry Pi [37]. It fits perfectly it is cheap, around 30$, tiny 8.5cm x 5.6 cm, light 45 grams and a maximum of 1 Watt. The drawback is the lack of computing; just an ARM 700MHZ CPU with 512 MB of RAM may not be enough. A newer version of raspberry pi2 b+ has launched with ARMv7 quadcore 900MHz and 1GB RAM. The raspberry I used has installed Raspbian as Operating System, which is based on Debian 7.0. Raspberry Pi has also installed Ruby on Rails to provide remote access to the data. An OpenStack instance can be configured as well. 61 10 IMPLEMENTATION The platform implemented differs from the one designed in one aspect. One of the objectives of the project was to build a working solution; not only design it. However, in order to develop this project, we must rent and configure an OpenStack instance with at least three servers. Although I have implemented a module to connect to an OpenStack platform. OpenStack project launched a free OpenStack sandbox [38]. It can be used for testing and developing but not for production because the projects are deleted every 24 hours. Therefore due to the impossibility to have one I simulated. The following figure represents the diagram of the system developed. 62 Figure 7: Sensor As a Service diagram 63 Figure 8: Database schema As mentioned in the design chapter the web server and the backend is running with Ruby on Rails. RoR is an MVC. It allowed to write a modular and reusable code. When a user, through the browser, sends a request to the web server it forwards to the routes.rb which is a ruby file where the routes are specified. A route is a piece of code that links the requested URL to its controller destination. Afterward, it forwards to the dispatcher that sends the request to the appropriate controller and takes care of reloading the app and check the dependencies. Then, if there is not any previous login information or cookies, the dispatcher will load the enter controller. This controllers takes care of the login process. If the login is successful, the user information is stored locally (on the server) in a global variable called “Session” which is managed by rails. We can access this variable at any time to gather the user data, E.g., The id of the user. Once it is logged in, the homepage is rendered. This page shows the news in the platform, E.g., New sensors available. At this point, the user can navigate through all the tabs. Search to explore the sensors by means of a map. Statics to gather the sensor utilization. Favorites to see all the sensors marked as a favorite and Settings to change user preferences and information. In order to gather the information from the sensor. Each sensor has a Ruby on Rails 64 web server installed in it. This seamless interaction provides an easy way to develop maintaining all the requirements. When a user wants, some date from a sensor the controller through the database connector asks for the direction of the sensor. With the IP or the URL of the sensor, the controller asks the sensor connector for the data. 10.1 SOFTWARE USED In order to develop this solution, I have used the next frameworks, modules or pieces of software. RubyMine 7.1: The IDE used to build the ruby on rails code RubyGems 2.4.6: It is a package manager for the Ruby programming language that provides a standard format for distributing Ruby programs and libraries Ruby 2.2.0: The language that runs the solution Rails gem 3.3.21: The gem framework that manages the website Nokogiri gem1.5: it is required for Rails to parse HTML, XML or CSS Mysql2 gem 0.3.18: It provides a connector to the Database Bundler gem 1.8.3: It manages the dependencies Geocoder gem 1.2.8: It provides useful methods concerning maps. I used to convert addresses to coordinates Gmaps4rails gem 2.1.2: It provides an encapsulation to work with maps Rake gem 10.4.2: It builds and check dependencies from rakefiles (makefiles) JSON gem 1.8.2: It allows to deal with JSON files Fog gem 1.29: It is a complete library that provides a layer for cloud connections. It allows to connect to Amazon EC2, Azure, and OpenStack. 10.2 VIEWS This section shows how the web looks like. 65 Image 1: Homepage The image 1 represents the home page. It is the place where the user can follow the news inside the platform. It shows new sensors, changes in the quota or any new that could be interesting for the user. Image 2: List of favorite sensors The image 2 corresponds to the favorites page. It shows a list of the sensors of the user interest to quickly access them. Image 3: Search sensors 66 The image 3 corresponds to the search page. The user can navigate in the city where the sensors are. At the left sidebar, there are filters to eliminate the undesired sensors. In this case, the filters are a different type of sensor. The image 4 is the result of a click to the sensor. Image 4: Sensor click Image 5: Usage statics The image 5 corresponds to the statics page. It shows the usage of all the sensors by the user. It also shows the money the user will have to pay for the time he used that particular sensor. 10.3 TESTING Requirements elicitation is governed by Humphrey's requirements uncertainty principle: "For a new software system, the requirements will not be completely known until after the users have used it." To assure a good quality of the solution, it should pass a testing evaluation and a usability test. Since the solution is not available for everyone, I will make the tests trying to abstract myself from the internal details I know. 67 The test has six points: Functionality testing; Usability testing; Interface testing; Compatibility testing; Performance testing and Security testing. 10.3.1 Functionality testing Functionality testing stands for test all the links, database connections, forms, and cookies. Test all internal links Test all outgoing links Test if there are any orphan page Check validation on each form field Checked Login form Check default form field Checked Login form Cookies The web does not use cookies Validate HTML/CSS Found 2 error: 1)HTML5 recommends http://www.w3.org/1999/xhtml instead of /html 2) An “img” tag must have an alt attribute Check for data integrity and errors while editing, deleting, modifying the forms or do any DB related functionality. 10.3.2 Usability testing Test for Navigation All the web follows the same structure. Using the same framework for visual items connects the elements seamlessly, and the users can follow it comfortably. The buttons have an icon that helps to identify, quickly, the idea behind it. The structure of the website is simple and clear. The downside is that the web does not provide instructions or any guide to help with the doubts they may have. It is also recommended to have a sitemap. Content checking I did not find any spelling mistake. The content is meaningful filling the available space. The web does not have dark colors or annoying colors nor annoying fonts. 68 10.3.3 Interface testing Interface testing Checked if all the interactions between the servers are executed properly. Errors are handled correctly. If database or web server returns any error message for any query, the application server catches and displays these error messages appropriately to users. If the transactions are interrupt, the operations are interrupted but the user does not have to re login because the session did not expire. 10.3.4 Compatibility testing Browser compatibility OS Compatibility Mobile browsing The web renders correctly under Google Chrome 41; Mozilla Firefox 35 and Safari 8. The web renders correctly under Microsoft Windows 7 and MAC OS 10.10.3. The web renders correctly(slowly) under Apple iPhone 6 10.3.5 Performance testing This test cannot be done properly because the web runs in a local environment and would not respond like a web server on the internet 10.3.6 Security testing A security testing should be done by a third party organization that audits the software searching for vulnerabilities. However, the software provided should at least avoid the most common vulnerabilities. In order to achieve a secure enough product, several tests will be performed. A user cannot access a resource without login. Even if the user knows the URL Try some invalid inputs in input fields like login username, password, and input text boxes. Check the system reaction to all invalid inputs. Web directories or files should not be accessible All transactions, error messages, security breach attempts should get logged in log files somewhere on a web server. Test if SSL is used for security measures. The folders and the nonpublic files are not accessible Yes, Ruby on Rails stores all the transactions done. The website has not implemented any SSL mechanism 69 The major web errors or vulnerabilities have been addressed. However, if this web goes public, there are some changes that must be done. First, the web server needs an SSL certification to provide a secure connection. 70 11 API The platform provides a REST API to obtain all the sensors, the information related to them and also to gather the sensor data. To access it, the user must follow the following specification: s, 1) /api/user&password/getSensors 2) /api/user&password/gatherSensorData/:idSensor Image 6: API response Image 6 refers to the answer to the first query, get all the sensors. The answer is in JSON format. The first column corresponds to the id of the sensor; the second to the company that owns it; the third column to the price per hour and the followings correspond to the street number, street name and city where the sensor is allocated. The second query answers in JSON too If the kind of data retrieved can be represented in JSON. 71 12 RESULTS 12.1 CONCLUSIONS While developing this project, I have faced several difficulties. The first was to establish the aspects related to the methodology and way of work. Clearly, I failed in the estimation of the amount of work and more precisely in the difficulty of it. I failed because I did not finish the project within the initial schedule. None of the steps were straightforward, but the part that challenged me the most was the learning. I had to study many new concepts, frameworks and systems. For example I has to spare a lot of time setting up and discovering how OpenStack works and eventually I did not use it as I wanted. In addition, another inconvenient was to learn a new language and framework. Ruby on Rails was an optimal framework and I enjoyed learning it. However, it took much time than I thought. Antoher mistake was that I was too ambitious. I should have set the boundaries more strictly, but it was complicated due to the lack of experience in some of the fields the project was involved. On the other hand, I am thrilled to present this project. All the effort I have put on it. If I look backwards I can see all the work done and I am satisfied. 12.2 FUTURE WORK This project has established the core of sensors as a service. From this point, the project can evolve into a product that can be used in reality. To do that, the ones continuing the work should perform a more sophisticated analysis of the world. Contact with investors and interested customers. The project is completed but not enough to go live. It requires more compatibly with a huge range of sensors. It also requires more options and functionalities. I think the project can also evolve into one more focused on the internet of things which is a very interesting topic for the next few years. 72 13 GLOSSARY VM: Virtual Machine SaaS: Software as a Service SRS: Software Requirements Specification IaaS: Infrastructure as a service FAQ: Frequently asked questions API: Application Programming Interface IEE: Institute of Electrical and Electronics Engineers IoT: Internet of Things RoR: Ruby on Rails MVC: Model View Controller JSON: JavaScript Object Notation 73 14 APPENDIX 1 14.1 OPENSTACK SET UP OpenStack can be used in several ways. The easiest way is by the web trystack.org. As I mentioned in the 8 section, the OpenStack foundation created this tool to practice with OpenStack without the troubles of configuring it. To do it, I had to “like” the Facebook page of trystack and wait a couple of days to be able to grant access to the web. After doing the configurations and set up a compute instance I was able to connect to the instance from the ruby on rails server. It was pleasant to discover that I was able to do so. However, it was for discovering, it is not possible to work with it, since all the instance are deleted after 24 hours. Another way to have an OpenStack platform running is to rent it. There are services that offer OpenStack as a service. Amazon EC2 and Rackspace are the most common providers. A third way to set it up is by installers. There is a couple of ways to do so. DevStack which comes from OpenStack. It has a set of scripts that help with the tedious process of configuring OpenStack. It even has a way to set it up on only one computer. Another installer is RDO. RDO is a community of people using and deploying OpenStack on Red Hat Enterprise Linux, Fedora and distributions derived from these. Moreover, the hardest way to configure it is manually. From now on I will explain how I did it. I used several virtual machines. Each virtual machine (VM) has installed Ubuntu 14.04.1 LTS server 64 bits [39]. It is a command line Linux distribution optimized for server purposes and will be supported for five years. Each Virtual Machine has a role. The implementation of the cloud environment has three VMs. A controller node, which has the DB and configurations; the compute node that runs the operations and the network node to manage the connections. The following sections represent the configuration to run OpenStack. 74 NETWORK CONFIGURATION ALL NODES Add in /etc/hosts: 10.0.0.11 # controller controller # network 10.0.0.21 network # compute1 10.0.0.31 compute1 Delete in /etc/hosts: 127.0.1.1. Ubuntu # sudo apt-get install ubuntu-cloud-keyring # echo "deb http://ubuntu-cloud.archive.canonical.com/ubuntu" \"trusty-updates/juno main" > /etc/apt/sources.list.d/cloudarchivejuno.list CONTROLLER # sudo ifconfig eth0 10.0.0.11 netmask 255.255.255.0 # sudo route add default gw 10.0.0.1 eth0 NETWORK # sudo ifconfig eth0 10.0.0.21 netmask 255.255.255.0 # sudo route add default gw 10.0.0.1 eth0 # sudo ifconfig eth0:0 10.0.1.21 netmask 255.255.255.0 COMPUTE # sudo ifconfig eth0 10.0.0.31 netmask 255.255.255.0 # sudo route add default gw 10.0.0.1 eth0 # sudo ifconfig eth0:0 10.0.1.31 netmask 255.255.255.0 75 DATABASE CONFIGURATION Most OpenStack services use an SQL database to store information. The database typically runs on the controller node. The procedures in this guide use MariaDB or MySQL depending on the distribution. OpenStack services also support other SQL databases including PostgreSQL. CONTROLLER # sudo apt-get install mariadb-server python-mysqldb.0 Edit the /etc/mysql/my.cnf file and complete the following actions: a. In the [mysqld] section, set the bind-address key to the management IP address of the controller node to enable access by other nodes via the management network: 1 2 3 [mysqld] ... bind-address = 10.0.0.11 b. In the [mysqld] section, set the following keys to enable useful options and the UTF-8 character set: 1 2 3 4 5 6 7 [mysqld] ... default-storage-engine = innodb innodb_file_per_table collation-server = utf8_general_ci init-connect = 'SET NAMES utf8' character-set-server = utf8 # sudo service mysql restart # sudo mysql_secure_installation 76 15 REFERENCES [1] National Institute of Standards and Technology, "The NIST Definition of Cloud," 2011. [Online]. Available: http://csrc.nist.gov/publications/nistpubs/800145/SP800-145.pdf. [Accessed 05 09 2014]. [2] J. McCarthy, "Architects of the Information Society, Thirty-Five Years of the Laboratory for Computer Science at MIT," MIT Centennial, 1961. [3] E. Schmidt, Search Engine Strategies Conference, Google inc., 2006. [4] E. Ackerman and E. Guizzo, "5 Technologies That Will Shape the Web," IEEE Spectrum, vol. 48, pp. 40-45, 2011. [5] BBC Research, "Sensors: Technologies and Global Markets". [6] Infosys Limited, "Pervasive Computing View Point," Infosys, Tech., 2011. [7] R. Dobbs, J. Manyika, C. Roxburgh and S. Lund, "Big data: The next frontier for innovation, competition, and productivity," McKinsey Global Institute, 2011. [8] A. McAfee and E. Brynjolfsson, "Big Data: The Management Revolution," Harvard Business Review, no. Big Data, pp. 61-68, 2012. [9] Oxford dictionary, "Definition of sensor in English:," [Online]. Available: http://www.oxforddictionaries.com/definition/english/sensor. [Accessed 1 10 2014]. [10] S. Patidar, D. Rane, and P. Jain, "A Survey Paper on Cloud," pp. 394-398, 2012. [11] Oxagile Solutions, "Waterfall Software Development Model," Oxagile, 2014. [Online]. Available: http://www.oxagile.com/company/blog/the-waterfallmodel/. [Accessed 06 09 2014]. [12] C. Larman and V. R. Basili, "Using Both Incremental and Iterative Development," The Journal of Defense Software Engineering, pp. 27-30, 2008. [13] S. Kharytonov, "Waterfall, RUP and Agile: Which is Right for You?," 2009. [Online]. Available: 77 http://www.ebizq.net/topics/dev_tools/features/11821.html?page=3. [Accessed 10 09 2014]. [14] K. MIKOLUK, "Agile Vs. Waterfall: Evaluating The Pros And Cons," 09 2013. [Online]. Available: https://www.udemy.com/blog/agile-vs-waterfall/. [Accessed 10 09 2014]. [15] Dropbox, "Dropbox features," [Online]. Available: https://www.dropbox.com/features. [Accessed 15 09 2014]. [16] GitHub, "GitHub features," [Online]. Available: https://github.com/features. [Accessed 9 09 2014]. [17] Nissan Innovation Makes Tire Inflation Easy. [Film]. 2013. [18] X. Chen, K. W. Nixon, H. Zhou, Y. Liu and Y. Chen, "FingerShadow: An OLED Power Optimization based on Smartphone Touch Interactions," Microsoft Research, University of Pittsburgh, Bejing, China and Pittsburgh, PA, USA. [19] W. Tu, "Sensors as a Service on the Internet of Things," ARM Limited, 2014. [20] M. Yuriyama and T. Kushida, "Physical Sensor Management with Virtualized Sensors on Cloud Computing," IBM Research, Tokyo, 2010. [21] A. Sarfraz, M. Chowdhury and J. Noll, "SenaaS: An Event-driven Sensor Virtualization Approach for Internet of Things Cloud," University Graduate Center, UNIK, Kjeller, Norway. [22] Openiot, "Openiot Documentation," [Online]. Available: https://github.com/OpenIotOrg/openiot/wiki/Documentation. [23] ZigBee alliance, "ZigBee specifications," [Online]. Available: http://www.zigbee.org/Specifications.aspx. [Accessed 5 10 2014]. [24] INE, "Encuesta Trimestral de Coste Laboral (ETCL)," 2014 Q2. [25] Ajuntament Barcelona, "ORDENANÇA FISCAL REGULADORA DE L'IMPOST SOBRE BÉNS IMMOBLES," Ordenança fiscal núm. 1.1, 25 03 2013. [26] Ministerio de Hacienda, Ley del Impuesto sobre Sociedades, vol. 61, BOE, 2004. 78 [27] Arboliza, "Cómo se calcula Co2," [Online]. Available: http://arboliza.es/compensar-co2/calculo-co2.html. [Accessed 05 10 2014]. [28] D. H. Hansson, "Ruby on Rails," [Online]. Available: http://rubyonrails.org/. [Accessed 15 03 2015]. [29] R. community, "Ruby Programming language," [Online]. Available: https://www.ruby-lang.org/en/. [Accessed 15 03 2015]. [30] Apache, "Open Source Cloud Computing," [Online]. Available: http://cloudstack.apache.org/. [Accessed 10 01 2015]. [31] Appcore, CLOUDSTACK VS OPENSTACK, 2014. [32] OpenStack, "Companies Supporting The OpenStack Foundation," [Online]. Available: http://www.openstack.org/foundation/companies/. [Accessed 01 12 2014]. [33] AppCore, "Cloud Automation Management Platform," [Online]. Available: http://www.appcore.com/. [Accessed 15 01 2015]. [34] Cisco, "Internetworking Technology Handbook," [Online]. Available: http://docwiki.cisco.com/wiki/Internetworking_Technology_Handbook. [Accessed 20 10 2014]. [35] Microsoft, "The OSI Model's Seven Layers Defined and Functions Explained," 13 06 2014. [Online]. Available: http://support2.microsoft.com/kb/103884. [Accessed 20 10 2014]. [36] Intel, "Mini PC: Intel NUC," [Online]. Available: http://www.intel.com/content/www/us/en/nuc/overview.html. [Accessed 15 01 2013]. [37] R. P. Foundation, "Raspberry Pi," [Online]. Available: https://www.raspberrypi.org/. [Accessed 04 12 2014]. [38] O. Community, "OpenStack SandBox. A free way to try OpenStack in your apps," [Online]. Available: http://trystack.org/. [Accessed 10 01 2015]. [39] C. Ltd., "Ubuntu 14.04.1 ReleaseNotes," [Online]. Available: https://wiki.ubuntu.com/TrustyTahr/ReleaseNotes. [Accessed 02 12 2014]. 79 [40] C. Larman, Applying UML and Patterns. An introduction to Object-Oriented Analysis and Design, Prentice Hall, 2005. 80


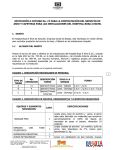


![[1 ] Oracle® Enterprise Manager](http://vs1.manualzilla.com/store/data/005669073_1-0396df232df5e560fdd03210f5126330-150x150.png)