1
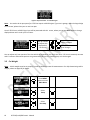
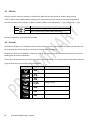
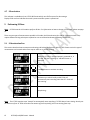
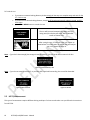
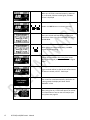
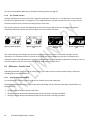
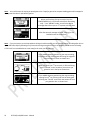
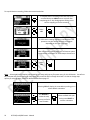
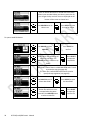
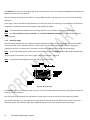
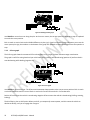
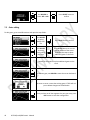
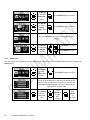
Figure 24: Braking distance graph
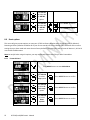
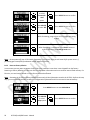
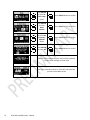
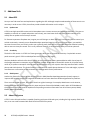
Use ROLLER to move the cursor along the plot. As the cursor moves, the current speed and distance to stop are updated
to match the cursor position.
Each tic mark on vertical axis marks 10 MPH difference. A plus sign (+) marks a 10 MPH change. Whenever you move the
cursor past a plus sign, the numbers on the bottom of the graph are updated to reflect the distance from that speed to a
stop.
7.2.5
G-force graph
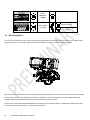
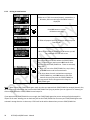
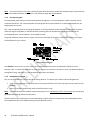
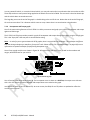
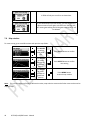
The G-force graph shows the measured G-force throughout a run. Larger G values indicate stronger acceleration.
The graph is useful for seeing how hard your vehicle was pulling when it was accelerating (positive Gs) and how hard it
was decelerating while braking (negative Gs).
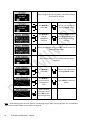
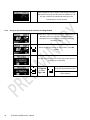
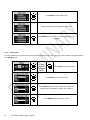
Figure 25:G-force graph
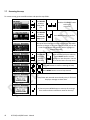
Use ROLLER to move the cursor. The G-force and timestamp always pertain to the current cursor position. Each tic mark
on the horizontal axis marks 1 second. Each tic mark on the vertical axis marks 0.1 G of acceleration.
Positive G-force means the vehicle is accelerating. Negative G-force means the vehicle is decelerating (shifting, coasting,
braking).
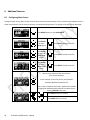
The brief dips in plot are shift points. When you shift, you temporarily remove power, and this causes the vehicle to
decelerate briefly, until you re-engage the next gear.
35
G-TECH/Pro SS/RR Fanatic Manual