1
Destination MATH Mac User Manual Version 3.1 © 1999/2000 Riverdeep Inc. See ‘‘Notices’’.
SECTION 4
GRAPHING TOOL
SECTION 0
Gr ap h i ng T o o l
Page 4 - 1
Destination MATH Mac User Manual Version 3.1 © 1999/2000 Riverdeep Inc. See ‘‘Notices’’.
4.1 Overview
The Graphing Tool, where available, is an open-ended environment in
which you can create one-dimensional and two-dimensional graphs. In
one-dimensional mode, you can graph simple and compound inequalities
in one variable. In two-dimensional mode you can graph a variety of
relations and functions.
In this section you will find descriptions of each of the two graphing modes
and how to use their various icons and buttons to create an control the
graphing window.
A user may:
• Launch the Graphing Tool
• Create a new graph
• Access templates
• Exit the Graphing Tool
Page 4 - 2
D e st in a tio n MA TH
Destination MATH Mac User Manual Version 3.1 © 1999/2000 Riverdeep Inc. See ‘‘Notices’’.
4.1.1 Launching the Graphing Tool
The Graphing Tool may be launched in:
• 2-dimensional mode
• 1-dimensional mode
2- DIMENSIONAL
MODE
Use the following procedure to launch the Graphing Tool in 2-dimensional
mode:
1 Within any tutorial or workout screen, click the Tool button.
2 Click the Graphing Tool button, or, double-click the Graphing Tool icon
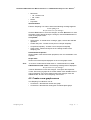
on the desktop. This will launch the default Graphing Tool, as illustrated
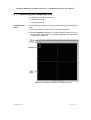
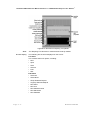
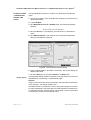
in Figure 83 and Figure 84.
Figure 83 2-dimensional Graphing Tool opening screen
Gr ap h i ng T o o l
Page 4 - 3
Destination MATH Mac User Manual Version 3.1 © 1999/2000 Riverdeep Inc. See ‘‘Notices’’.
Figure 84 2-dimensional Graphing Tool palette
Note:
Screen display
The Graphing Tool launches in 2-dimensional mode by default.
The following are the items displayed on the screen:
File menu
This contains the list of options, including:
• New
• Open
• Save
• Save As
• Print
• Quit
Edit menu
• Select All
• Select None
• Group Selected Objects
• Ungroup Selected Objects
• New Point
• New Line
• New Absolute Value
• New Half-Plane
• New Parabola
Page 4 - 4
D e st in a tio n MA TH
Destination MATH Mac User Manual Version 3.1 © 1999/2000 Riverdeep Inc. See ‘‘Notices’’.
• New Radical
• New Hyperbola
• Hide Grid
• Dimension
• 1D - Number Line
• 2D - Plane
• Delete
• Properties
Graph Screen
The part of the screen on which the user works.
Title bar
Contains Graphing Tool title.
Quit/exit button:
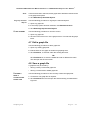
Exits the Graphing Tool. When clicked the following message appears:
E xit G rap h in g T ool
D o you w an t to save you r ch an ges?
Click the Save button to save the changes, click the Quit button to close
the graph screen without saving the changes, click the Cancel button to
return to the graph screen.
Tool palette
• Select mode - If clicked while creating a graph, cancels the selected
operation
• Create new point - Creates a new point
• Create new line - Creates a new line
• Create a new Absolute Value - Creates a new absolute value function
• Create a new Linear Inequality - Creates a new linear inequality
• Create a new Parabola - Creates a new parabola
• Create a new Radical - Creates a new radical
• Create a new Hyperbola - Creates a new hyperbola
• Grid on/off - Toggles on/off the grid view
• Trace on/off - Toggles on/off the tracing feature
• Axes on/off - Toggles on/off the axes
• Snap-to-grid - Toggles on/off. If on, snaps points to the closest
intersection of two grid lines
• Clear screen - Deletes all objects in the viewing window of the
Graphing Tool
Selected item properties
Shows details of the selected item properties, such as coordinates or an
equation.
Gr ap h i ng T o o l
Page 4 - 5
Destination MATH Mac User Manual Version 3.1 © 1999/2000 Riverdeep Inc. See ‘‘Notices’’.
Graph items
Shows a list of the objects displayed on the current graph screen.
1- DIMENSIONAL
MODE
Use the following procedure to launch the Graphing Tool in 1-dimensional
mode:
1 Within any tutorial or workout screen, click the Tool button.
2 Click the Graphing Tool icon, or, double-click the Graphing Tool icon on
the desktop. This will launch the default graph screen.
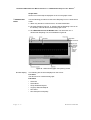
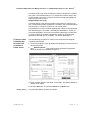
3 Click Edit>Dimension>1D-Number line. This will launch the 1dimensional Graphing Tool, as illustrated in Figure 85.
Figure 85 1-dimensional graph tool opening screen
Screen display
The following are the items displayed on the screen:
File menu
See file menu for 2-dimensional graph.
Edit menu
• Select All
• Select None
• Group Selected Objects
• Ungroup Selected Objects
• New Point
• New Compound Inequality
Page 4 - 6
D e st in a tio n MA TH
Destination MATH Mac User Manual Version 3.1 © 1999/2000 Riverdeep Inc. See ‘‘Notices’’.
• Dimension
• 1D - Number Line
• 2D - Plane
• Delete
• Properties
Quit/exit button
Exits the Graphing Tool. When clicked the following message appears:
E xit G rap h in g T ool
D o you w an t to save you r ch an ges?
Click the Save button to save the changes, click the Quit button to close
the graph screen without saving the changes, click the Cancel button to
return to the graph screen.
Tool palette:
• Select mode - If clicked when creating a graph, cancels the selected
operation
• Create new point - Creates a new point or a simple inequality
• Compound inequality - Creates a new compound inequality
• Clear screen - Deletes all objects in the viewing window of the
Graphing Tool
Selected Item Properties
Shows details of the selected item properties, such as coordinates or an
equation.
Graph items
Shows a list of the objects displayed on the current graph screen.
Note:
To revert to 2-dimensional mode when in 1-dimensional mod,. Click
Edit>Dimension>2D - Plane. The following message will be displayed:
D o you w an t to save you r ch an ges?
Click the Yes button to save the changes. This opens the Output file
screen. See saving a graph file for further details. Click the No button to
exit the Graphing Tool screen without saving the changes. Click the
Cancel button to return to the Graphing Tool screen.
4.2 Create a new graph screen
The Graphing Tool allows a user to:
• Construct a 1-dimensional number line graph
• Construct a 2-dimensional rectangular coordinate plane graph
Gr ap hi ng T o o l
Page 4 - 7
Destination MATH Mac User Manual Version 3.1 © 1999/2000 Riverdeep Inc. See ‘‘Notices’’.
C ONSTRUCTING A
1- DIMENSIONAL
Use the following procedure to construct a 1-dimensional number line
graph:
NUMBER LINE
GRAPH
1 Launch the Graphing Tool. By default the Graphing Tool launches in 2dimensional mode.
2 Click File>New.
3 Click Edit>Dimension>1D - Number Line. The following message
appears:
D o you w an t to save you r ch an ges?
4 Click the No button. The Graphing Tool launches in 1-dimensional
mode.
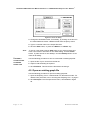
5 Click Edit>Properties. This will open the 1-dimensional properties
dialog, as illustrated in Figure 86.
Figure 86 1-dimensional properties dialog
6 Enter or adjust details in the fields, if necessary. See screen display for
details of the fields.
7 Click the OK button or press the <Return> or <Enter> key.
Dialog display
The properties dialog contains four panels. Only the following choices are
appropriate for constructing a 1-dimensional graph:
Options:
Snap to Grid: Check this item to plot points in the plane at the intersection
of the grid lines. The default setting is Off.
Decimal Precision: This allows the user to specify the degree of accuracy
for values displayed in the graph items and selected items properties box.
To adjust this number, click the default 2 in the field, or click on the arrows
in the field and choose from the pull-up menu.
Page 4 - 8
D e st in a tio n MA TH
Destination MATH Mac User Manual Version 3.1 © 1999/2000 Riverdeep Inc. See ‘‘Notices’’.
Constrain Angle: This value controls the number of degrees in a rotation
of a graph. The default setting is 0 . To change the constrain angle, click
on the number in the field, or click the arrow in the field and highlight an
angle from the pull-up menu.
Graph/number line setup:
Horizontal Range: This sets the maximum and minimum values for the
axis. To adjust the number, highlight the number in the Horizontal Range
field and type in a number of choice in one or both fields.
Horizontal grid: To enter numbers, highlight the number in the Horizontal
Grid field and type in a number. The fields are defaulted to -10 and 10.
Horizontal graduation: This is the incremental scale along a number line.
To enter numbers in the field, highlight the number in the Horizontal
Graduation field and type in a number. The field is defaulted to 1.
C ONSTRUCTING A
2- DIMENSIONAL
Use the following procedure to construct a 2-dimensional rectangular
coordinate plane graph:
RECTANGULAR
COORDINATE
PLANE GRAPH
1 Launch the Graphing Tool. By default the Graphing Tool launches in 2dimensional mode.
2 Click Edit>Properties. This will open the 2-dimensional properties
dialog by default, as illustrated in Figure 87.
Figure 87 2-dimensional properties dialog
3 Enter or adjust details in the fields, if necessary. See dialog display for
details on the fields.
4 Click the OK button or press the <Return> or <Enter> key.
Dialog display
Gr ap h i ng T o o l
The properties dialog contains four panels:
Page 4 - 9
Destination MATH Mac User Manual Version 3.1 © 1999/2000 Riverdeep Inc. See ‘‘Notices’’.
Options
Snap to Grid: Check this item to plot points in the plane at the intersection
of the grid lines. The default setting is Off.
Decimal Precision: This allows the user to specify the degree of accuracy
for values displayed in the graph items box and selected items properties
box. To adjust this number, highlight the defaulted number 2 in the field, or
click the arrows in the field and choose a number from the pull-up menu.
Constrain Angle: This allows the user to specify the degree of rotation for
a given graphing window as it applies to lines and inequalities. This is
defaulted to 0 degrees. To change the setting, highlight the number, or
click the arrows in the field and choose from the pull-up menu.
Default templates
This item allows the user to choose from a range of templates. To change
the default template click on the arrow in the default templates field and
choose from the pull-up menu. Click the Set button. For examples of
templates, see “Choose a template” on page 11.
View
X-intercept: Checking this item will display the value of the horizontal
intercept as a decimal to the nearest hundredth when a line is selected.
Y-intercept: Checking this item will display the value of the vertical
intercept as a decimal to the nearest hundredth when a line is selected.
Show intersection: Checking this item displays the coordinates of a
common point of intersection, if one exists within the range of the graphing
window, between two or more lines. Checking this will also open the
intersection panel. Note: Not seeing a point of intersection does not mean
that is does not exist, it may be outside the viewing window. If this is true,
reset the scale along one or both axes.
Intersection
All objects: Checking this item will display the common intersection point
of two or more lines automatically as they are added to the graph window.
Selected objects: Checking this item will display the common intersection
point of two or more lines when the lines have been selected.
Graph/Number line setup
Isometric Range: Checking this item shows one-to-one correspondence,
where the horizontal and vertical unit distances are equal. If Isometric
Range is selected when setting up a coordinate plane, the Vertical Range
will require only the minimum value for the vertical axis.
Horizontal Range: This sets the maximum and minimum values for the
horizontal axis. To adjust the number, highlight the number in the
Horizontal Range field and type in a number of your choice in one or both
fields.The default values are -10 to 10.
Vertical Range: This sets the maximum and minimum values for the
vertical axis in the viewing window. To adjust the numbers, highlight the
Page 4 - 10
Destination MATH
Destination MATH Mac User Manual Version 3.1 © 1999/2000 Riverdeep Inc. See ‘‘Notices’’.
numbers in the Horizontal Range field and type in a number of your choice
in one or both fields.
Horizontal Grid Size: This defines the increment value where vertical grid
lines will be drawn. To enter numbers, highlight the number in the
Horizontal Grid field and enter a number between .01 and 10000. The field
is defaulted to 1.
Horizontal Graduation: This defines the increment value to apply to the
scale along the horizontal axis. To enter numbers in the field, highlight the
number in the Horizontal Graduation field and type in a number. The field
is defaulted to 1.
Vertical Grid Size: This defines the increment values where horizontal grid
lines will be drawn. To enter numbers in the field, highlight the number in
the Vertical Grid field and type in a number. The field is defaulted to 1.
Vertical Graduation: This defines the increment value to apply to the scale
along the vertical axis. To enter numbers in the field, highlight the number
in the Vertical Graduation field and type in a number. The field is defaulted
to 1.
4.3 Choose a template
Templates are used to display the information in a prescribed format.
Templates may be used as an alternative to the available icons on the
screen. Templates may be used prior to graphing or after graphing.
C HOOSING
A
TEMPLATE
Use the following procedure to choose a template:
1 Open the 2-dimensional graph screen.
2 Click Edit>Properties. This will open the 2-dimensional properties
dialog, as illustrated in Figure 87.
3 Click on the title or the arrows in the default templates field, and choose
a template from the drop-down list.
4 Click the Set button. This will open the object properties dialog, as
illustrated in Figure 88.
Figure 88 Object properties dialog
5 Accept the equation as given, or, click the arrow in the Equation
template field and click on a choice from the pull-up menu.
Gr aphi ng To o l
Page 4 - 11
Destination MATH Mac User Manual Version 3.1 © 1999/2000 Riverdeep Inc. See ‘‘Notices’’.
6 Click the OK button or press the <Return> or <Enter> key.
A VAILABLE
The templates available are:
TEMPLATES
• Create a line
• Create a point
• Create a linear inequality
• Create an absolute value
• Create a half plane
• Create a parabola
• Create a hyperbola
• Create a root
• Group selected items
Create a Line
The create a line templates available are:
Y = mx + b
This template represents the slope-intercept form of a line. The
parameters that can be modified are m and b. If the line is manipulated so
that it is vertical, the equation changes to x = k, where k is the parameter
that can be changed. If the variable y is changed to x, the equation of the
line becomes x = b.
Slope only
This template displays only the slope of a non-vertical line. The parameter
m can be changed. If the line becomes vertical, the slope is reported as
Undefined.
Two master points
This template description refers to the two points that determine a line. It
displays the coordinates of the two points on the line, the slope m of the
line as the ratio between rise and run, and the calculation of the slope
using the coordinates. None of these parameters can be changed.
However, manipulating the line in the plane updates the slope, and
manipulating either or both points updates the given coordinates.
Two slave points
This template description is similar to the description for Two master
points, except the display in the Selected items Properties box does not
show the calculation of the rise and run. None of these parameters can be
changed, but manipulating the line and points in the plane update them
accordingly.
X and Y intercepts
This template description displays only the x- and y- intercepts of a line.
The values of each intercept can be changed.
Page 4 - 12
De s tin a t io n MA TH
Destination MATH Mac User Manual Version 3.1 © 1999/2000 Riverdeep Inc. See ‘‘Notices’’.
Point and Slope
This template displays the equation of a line in y - y 1 = m(x - x1) form.
Values for the coordinates of a point that lies on the line, along with the
slope of the line, are displayed in the selected items properties box.
Slope: m
This template displays the equation of a non-vertical line and its slope.
Only the parameter m can be changed. If the line becomes vertical, the
slope is reported as Undefined.
y-intercept
This template displays the equation of a line in slope-intercept form and
the value of its y-intercept. Only the value of the y-intercept can be
changed.
Create a point
The create a point template available is:
(x, y)
This template displays points plotted on the rectangular coordinate plane.
The coordinates of the point are displayed as an ordered pair in the graph
Items box and the x and y values are individually identified in the Selected
item Properties box.
Create a linear
inequality
The standard format used to display a Linear Inequality is of the form y <
mx + b. In the Selected item Properties box, you can change the
parameters m and b of the boundary line and the inequality sign that
determines the corresponding half-plane.
Create an
Absolute Value
Function
The absolute value function templates available are:
Gr aphi ng To o l
y = m*abs(x-b) + c
This template displays the most general form of an absolute value
function. Values of m, b and c can be changed. If m = 0, the function
degenerates to y = c.
y = ± abs(x)
This template centers the vertex of the function at the origin. You can
change the sign to reflect the graph either above or below the x-axis.
y = m*abs(x)
This option centers the vertex of the function at the origin. You can change
the parameter m to dilate the graph and/or reflect it over the x-axis. If m =
0, the function degenerates to y = 0.
y = ± abs(x - b) + c
This template lets you change the sign of the slope from 1 to -1 and/or
change the values of the parameters b and c.
y = m*abs(x - b)
This template keeps the vertex of the graph along the x-axis at x = b. You
can change the parameters m and b. If m = 0, the function degenerates to
y = 0.
Page 4 - 13
Destination MATH Mac User Manual Version 3.1 © 1999/2000 Riverdeep Inc. See ‘‘Notices’’.
Create a Parabola
The new parabola templates available are:
y = ax2 + bx + c
This template displays the standard form of the equation of a parabola.
You can change the values of a, b, and c to transform the function in the
plane. Note: Of a = 0, the graph degenerates to the line y = bx + c.
y = a(x - b)2 + c
This template represents the analytical form of a parabolic function whose
vertex is (b, -c). You can change any of the parameters a, b and/or c.
Again, if a = 0, the graph degenerates into the line y = c.
y = ax2 + c
This template creates a parabola whose axis of symmetry is always the yaxis. You can change the parameters a and c. If a = 0, the graph
degenerates to the line y = c.
y = ax2
This template creates a parabola that is always centered at the origin. You
can change the value of a. If a = 0, the graph degenerates to y = 0.
y = x2
This template creates a static parabola, whose axis of symmetry is the yaxis and whose vertex is at the origin. This graph cannot be transformed
in the plane.
Create a
H yperbola
Create a Square
Root Function
Page 4 - 14
The hyperbola templates available are:
y = a/(x - b) + c
This is the general template for a hyperbolic function. You can change the
values of a, b and c. If a = 0 then the graph degenerates to y = c.
y = ±1/(x - b) + c
This template restricts a to 1 or -1. You can change the values of b and c.
y = a/x
This template represents a hyperbola that is symmetric with respect to the
origin. You can change the value of a. If a = 0, the hyperbola degenerates
to y = 0.
y = ± 1/x
This template represents a hyperbola that remains whose distance from 0
is constant. You can change the sign of the numerator to reposition the
graph into opposite quadrants.
The square root function templates available are:
y = a ±( x + b ) + c
De s tin a t io n MA TH
Destination MATH Mac User Manual Version 3.1 © 1999/2000 Riverdeep Inc. See ‘‘Notices’’.
This template is a general equation for the square root function. You can
change the values of a, b and c, and the sign before the binomial
expression. If a = 0, the function degenerates to y = c.
y = a ±x + c
This template keeps the initial point of the graph along the y-axis. You can
change the values of a and c and the sign of the variable x. If a = 0, the
function degenerates to y =c.
y = a ±x
This template keeps the initial point of the graph at the origin. You can
change the value of the parameter a, and the sign of the variable x. If a =
0, the function degenerates to y = 0.
y = ± ±x
This is the simplest template of the square root function. You can change
the sign of the radical or change the sign of the variable x.
4.4 Exit the Graphing Tool
Use the following procedure to exit the Graphing Tool:
• Click File>Quit
OR
• Click the X button in the top right hand corner of the screen
Note:
If you attempt to exit the Graphing Tool after creating or editing a file
without first saving the file, the following message appears:
Exit Graphing Tool
Do you want to save your changes?
Click the Save button to save the changes. This opens the Output FIle
Screen; see 4.8“Save a graph file” on page 23. Click the Quit button to
exit the Graphing Tool without saving the changes. Click the Cancel
button to return to the Graphing Tool screen.
Graphing Tool
Page 4 - 15
Destination MATH Mac User Manual Version 3.1 © 1999/2000 Riverdeep Inc. See ‘‘Notices’’.
4.4.1 Working with graphs
Working with graphs allows a user to:
• Create a new graph file
• Use Graphing Tool items
• Save a graph file
• Open an existing graph file
• Print a graph file
• Edit a graph file
• Delete a graph file
4.5 Create a new graph file
New graph files may be constructed by using a:
• Point
• Line
• Absolute value
• Half-plane
• Quadratic
• Parabola
• Radical
• Rational
P OINT
Points may be entered on a:
• 1-dimensional graph
• 2-dimensional graph
1-dim ensional
G raph
Use one of the following procedures to construct a point:
1 Open a 1-dimensional graph screen.
2 Click the create point icon.
OR
Click Edit>New point.
3 Place the mouse pointer at the appropriate point on the line.
4 Click the mouse button.
OR
Type in the coordinate in the appropriate field, and/or use the arrow in
the field and select from the pull-up menu of the selected items
properties panel, and press the <Return> or <Enter> key.
Page 4 - 16
De s tin a t io n MA TH
Destination MATH Mac User Manual Version 3.1 © 1999/2000 Riverdeep Inc. See ‘‘Notices’’.
2-dim ensional
graph
Use one of the following procedures to construct a point:
1 Open a 2-dimensional graph screen.
2 Click the create new point icon on the main menu.
OR
Click Edit>New point.
3 Place the mouse pointer on the appropriate coordinates.
4 Click the mouse button.
OR
Type in the coordinates in the appropriate fields of the selected items
properties panel, and press the <Return> or <Enter> key.
L INE
Use one of the following procedures to construct a line:
1 Open a 2-dimensional graph screen.
2 Click the create line icon on the main menu.
OR
Click Edit>New line.
3 Place the mouse pointer on the appropriate coordinates.
4 Click and hold down the mouse button.
5 Drag the mouse to the required second coordinate.
6 Click the mouse button.
OR
Type in the coordinates in the appropriate fields, and/or use the arrow
in the field and select from the pull-up box of the selected items
properties panel, and press the <Return> or <Enter> key.
A BSOLUTE
Use one of the following procedures to construct an absolute value:
VALUE
1 Open a 2-dimensional graph screen.
2 Click the absolute value icon on the main menu.
OR
Click Edit>New absolute value.
3 Place the mouse pointer on the appropriate coordinate.
4 Click the mouse button.
OR
Gr aphi ng To o l
Page 4 - 17
Destination MATH Mac User Manual Version 3.1 © 1999/2000 Riverdeep Inc. See ‘‘Notices’’.
Type in the values in the appropriate fields, and/or use the arrow in the
field and select from the pull-up menu of the selected items properties
panel, and press the <Return> or <Enter> key.
H ALF - PLANE
Use one of the following procedures to construct a half-plane:
1 Open a 2-dimensional graph screen.
2 Click the half-plane icon on the main menu.
OR
Click Edit>New half-plane.
3 Place the mouse pointer on the appropriate coordinate.
4 Click the mouse button.
5 Move the pointer to the appropriate point on the screen.
6 Click the mouse button.
OR
Type in the values in the appropriate fields, and/or use the arrow in the
field and select from the pull-up menu of the selected items properties
panel, and press the <Return> or <Enter> key.
C OMPOUND
INEQAULITY
Use the following procedure to set a compound inequality:
1 Open a 1-dimensional graph screen.
2 Click the compound inequality icon on the screen.
OR
Click Edit>New Compound Inequality.
3 Place and click the pointer on the graph line.
4 Click the pointer again on any chosen point along the line.
OR
Type in the values in the appropriate fields, and/or use the arrow in the
field and select from the pull-up menu of the selected items properties
panel, and press the <Return> or <Enter> key.
P ARABOLA
Use the following procedure to set a parabola:
1 Open a 2-dimensional graph screen.
2 Click the parabola icon on the screen.
OR
Click Edit>New Parabola.
3 Place and click the pointer on the graph line.
Page 4 - 18
De s tin a t io n MA TH
Destination MATH Mac User Manual Version 3.1 © 1999/2000 Riverdeep Inc. See ‘‘Notices’’.
4 Click the pointer again on any chosen point along the line.
OR
Type in the values in the appropriate fields, and/or use the arrow in the
field and select from the pull-up menu of the selected items properties
panel, and press the <Return> or <Enter> key.
R ADICAL
Use the following procedure to set a radical:
1 Open a 2-dimensional graph screen.
2 Click the radical icon on the screen.
OR
Click Edit>New Radical.
3 Place and click the pointer on the graph line.
4 Click the pointer again on any chosen point along the line.
OR
Type in the values in the appropriate fields, and/or use the arrow in the
field and select from the pull-up menu of the selected items properties
panel, and press the <Return> or <Enter> key.
H YPERBOLA
Use the following procedure to set a hyperbola:
1 Open a 2-dimensional graph screen.
2 Click the rational icon on the screen.
OR
Click Edit>New Hyperbola.
3 Place and click the pointer on the graph line.
4 Click the pointer again on any chosen point along the line.
OR
Type in the values in the appropriate fields, and/or use the arrow in the
field and select from the pull-up menu of the selected items properties
panel, and press the <Return> or <Enter> key.
Note:
Any item entered on a graph grid in 1-dimensional or 2-dimensional mode
is color coded to match the display in the graph items panel.
4.6 Graph tools
Graphing Tool items include:
• View graph item definition
• Rotate a graph item
Gr ap hi ng To ol
Page 4 - 19
Destination MATH Mac User Manual Version 3.1 © 1999/2000 Riverdeep Inc. See ‘‘Notices’’.
• Translate a graph item
• Delete a graph item
• Grid on/Grid off
• Trace on/Trace off
• Axes on/Axes off
• Snap-to-grid
• Group/ungroup selected objects
• Clear screen
V IEWING
GRAPH
ITEM DEFINITION
A user may:
• View definition
• Change coordinate view
View definition
Use the following procedure to view graph item definition:
1 Open any graph file.
2 Click on the item of your choice on the graph screen, or click on the
definition in the graph items panel. This will highlight the chosen item,
show the coordinates in the selected items properties panel, and box
the values in the graph items panel.
Change
coordinates view
Use the following procedure to change the view of a graph item:
1 Open any graph file.
2 Click on the item of your choice on the graph screen, or in the Graph
Items panel.
3 Type in new coordinates and/or use the arrows to change the items in
the Selected Items Properties panel.
4 Press the <Return> or <Enter> key.
R OTATE A GRAPH
Use the following procedure to rotate a graph item:
ITEM
1 Open any 2-dimensional graph file.
2 Click on the item of your choice on the graph screen. The definition of
the chosen item will be highlighted, as illustrated in Figure 89.
Figure 89 Graph item coordinate highlight
3 Place the mouse pointer on the highlighted coordinate point on the
graph screen.
4 Click and hold down the pointer. The pointer changes to a hand.
Page 4 - 20
De s tin a t io n MA TH
Destination MATH Mac User Manual Version 3.1 © 1999/2000 Riverdeep Inc. See ‘‘Notices’’.
5 Rotate item to required position.
6 Release the pointer. The new position definition is displayed in the
selected items properties panel, and on the graph items panel.
T RANSLATE
A
GRAPH ITEM
Use the following procedure to translate a graph item:
1 Open any 2-dimensional graph file.
2 Click on a graph item of your choice on the graph screen. This will
highlight the selected graph item.
3 Place the pointer on any position on the chosen graph item.
4 Click and hold down the mouse button and drag the item to a new
desired position on the graph grid.
5 Release the mouse button. The new position definition is reflected in
the graph Items panel and the selected items properties panel.
D ELETE A GRAPH
Use the following procedure to delete a graph item:
ITEM
1 Open any graph file.
2 Click on the item of your choice on the graph screen, or click on the
definition of the item in the graph items panel.
3 Click Edit>Delete.
G RAPH
GRID ON /
OFF
This allows a user to view the grid lines on the graph screen. The feature
may be:
• Selected
• De-selected
Select/de-select
graph grid
Use the following procedure to select/de-select the graph grid:
1 Open any 2-dimensional graph file.
2 Click the grid on/off icon to view or clear the graph grid.
TRACE
ON / OFF
This allows a user to view, or trace, the coordinates of any graph item on
the graphing screen.
The trace on/off may be:
• Selected
• Deselected
Select the trace
option
Use the following procedure to select the tracing option:
1 Open any 2-dimensional graph file.
2 Click the graph item of your choice on the graph screen.
3 Click the trace icon.
Gr aphi ng To o l
Page 4 - 21
Destination MATH Mac User Manual Version 3.1 © 1999/2000 Riverdeep Inc. See ‘‘Notices’’.
4 Move the pointer anywhere on the graph grid. This will show the
coordinates at any point of the chosen graph item, as illustrated in
Figure 90.
Figure 90 Trace option
De-select the trace
option
Use the following facility to de-select the tracing facility:
1 Open any 2-dimensional graph file.
2 Click the trace on/off icon to view or clear this feature.
A XES
ON /A XES
OFF
Use the following procedure to select/deselect the axes option:
1 Open any 2-dimensional graph file.
2 Click on the Axes on/Axes off icon on the graph screen.
S NAP
TO GRID
Use the following procedure to use the snap to grid option:
1 Open any 2-dimensional graph file.
2 Click on a the snap to grid icon on the graph screen.
G ROUP /UNGROUP
SELECTED
OBJECTS
The group/ungroup objects option allows a user to link several selected
items:
• Group selected objects
• Ungroup selected objects
G roup selected
objects
Use the following procedure to group selected objects:
1 Open an existing graph, or structure a new graph screen.
2 Click Edit>Select All.
OR
Press and hold down the <Ctrl> key, and click on each required item
on the graph screen.
Page 4 - 22
De s tin a t io n MA TH
Destination MATH Mac User Manual Version 3.1 © 1999/2000 Riverdeep Inc. See ‘‘Notices’’.
Note:
If select all has been selected, all the graph items definitions will be boxed
in the graph items panel.
3 Click Edit>Group Selected Objects.
Ungroup selected
objects
Use the following procedure to ungroup the selected objects:
1 Open any graph file.
2 If the Group option has been selected, click Edit>Select None.
3 Click Edit>Ungroup Selected Objects.
C LEAR
SCREEN
Use the following procedure to clear the screen:
1 Open any graph file.
2 Click the clear screen icon on the graph screen. This will clear all graph
items.
4.7 Edit a graph file
Use the following procedure to edit a graph file:
1 Open any existing graph file.
2 Edit the items on the graph as outlined in graphing tools.
3 Click File>Save, to save file under the existing file name.
OR
Click File>Save as, to save the edited file under a different file name.
This will open the save as screen.
4.8 Save a graph file
A graph file may be saved by:
• Storing a newly-constructed graph file
• Storing a constructed or edited graph file
S TORING
NEW LY -
A
CONSTRUCTED
GRAPH FILE
Gr aphi ng To o l
Use the following procedure to save a newly-constructed graph file:
1 Construct a new graph file as required.
2 Click File>Save As. This will open the Save as dialog, as illustrated in
Figure 91.
Page 4 - 23
Destination MATH Mac User Manual Version 3.1 © 1999/2000 Riverdeep Inc. See ‘‘Notices’’.
Figure 91 Save as dialog
3 Change the destination folder, if necessary, by clicking on the arrow in
the folder field and choose a different folder from the pull-up menu.
4 Type in a new file name in the Output File field.
5 Click the Save button, or press the <Return> or <Enter> key.
Note:
S TORING
A
CONSTRUCTED
OR EDITED
GRAPH FILE
To set up a new folder click the New button on the save as dialog and
enter a new name in the Name of new folder dialog, click the Create
button. To place the file on the desktop, click the Desktop button on the
Save as file dialog.
Use the following procedure to save a constructed or edited graph file:
1 Open the file of your choice from the file list.
2 Adjust or edit the dialog as required.
3 Click File>Save. This will save the file without renaming it.
4.9 Open an existing graph file
Use the following procedure to open an existing graph file:
1 Open the Graphing Tool in 1-dimensional or 2-dimensional mode. For
details of this procedure, see “Launching the Graphing Tool” on page 3.
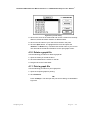
2 Click File>Open. This will open the file menu, as illustrated in Figure
92.
Page 4 - 24
De s tin a t io n MA TH
Destination MATH Mac User Manual Version 3.1 © 1999/2000 Riverdeep Inc. See ‘‘Notices’’.
Figure 92 Input file dialog
3 Click on the arrow in the folder field and choose a folder from the dropdown list, if files have been saved to a different folder.
4 Click on the file name of your choice from the list in the pane.
5 Click the Open button, or highlight the file name and press the
<Return> or <Enter> key, or double-click the file name of your choice.
This will load the saved file information on the open graph screen.
4.10 Delete a graph file
Use the following procedure to delete a graph file:
1 Open the folder you saved the file in.
2 Click and hold down the mouse on the file.
3 Drag the file to the Trash folder.
4.11 Print a graph file
Use the following procedure to print a graph file:
1 Open the required graph for printing.
2 Click File>Print.
OR
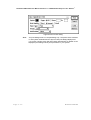
Press <Cmd+p>. This will open the print choice dialog, as illustrated in
Figure 93.
Gr ap hi ng To ol
Page 4 - 25
Destination MATH Mac User Manual Version 3.1 © 1999/2000 Riverdeep Inc. See ‘‘Notices’’.
Figure 93 Print choice dialog
Note:
Page 4 - 26
The print dialog shown is a sample dialog only. The printer driver software
on the system will determine the layout of the print dialog displayed on
your screen. Please check with the system administrator for details on the
displayed print dialog and the print procedure on your system.
De s tin a t io n MA TH