1
◆ dual values (shadow prices);
◆ basic rows and columns.
For information on the write commands, see Writing Problem and Solution Files on
page 53. Sensitivity analysis can also be performed in analyzing results, as explained in
Performing Sensitivity Analysis on page 51.
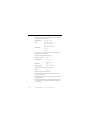
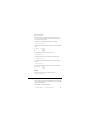
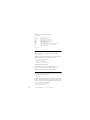
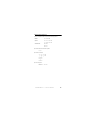
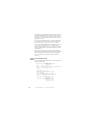
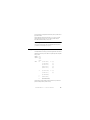
For example, to view the optimal value of each variable, enter the command:
display solution variables -
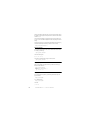
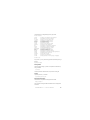
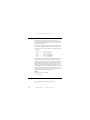
In response, the list of variable names with the solution value for each variable is displayed,
like this:
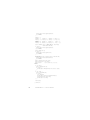
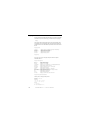
Variable Name
x1
x2
x3
Solution Value
40.000000
17.500000
42.500000
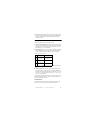
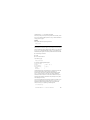
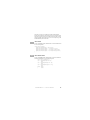
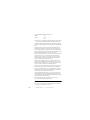
To view the slack values of each constraint, enter the command:
display solution slacks -
The resulting message indicates that for this problem the slack variables are all zero.
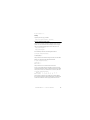
All slacks in the range 1-2 are 0.
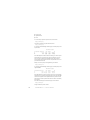
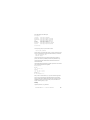
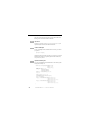
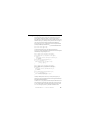
To view the dual values (sometimes called shadow prices) for each constraint, enter the
command:
display solution dual -
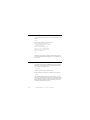
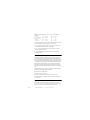
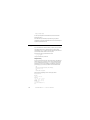
The list of constraint names with the solution value for each constraint appears, like this:
Constraint Name
c1
c2
Dual Price
2.750000
0.250000
Summary
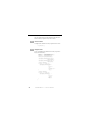
Display solution characteristics by entering a command with the syntax:
display solution identifier
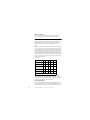
Performing Sensitivity Analysis
Sensitivity analysis of the objective function and righthand side provides meaningful insight
about ways in which the optimal solution of a problem changes in response to small changes
in these parts of the problem data.
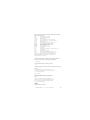
Sensitivity analysis can be performed on the following:
ILOG CPLEX 10.1
— GETTING STARTED
51