1
AmpFlSTR® Identifiler™
PCR Amplification Kit
User’s Manual
© Copyright 2001, Applied Biosystems. All rights reserved.
For Research, Forensic and Paternity Use Only. Not For Use in Diagnostic Procedures.
Printed in the U.S.A.
Notice to Purchaser for Research and Forensic Testing Use: Limited License
A license under U.S. Patents 4,683,202, 4,683,195 and 4,965,188 or their foreign counterparts, owned by Roche Molecular Systems,
Inc. and F. Hoffmann-La Roche Ltd (“Roche”), for use in research and forensic testing, has an up-front fee component and a runningroyalty component. The purchase price of the AmpFlSTR® Identifiler™ PCR Amplification Kit (P/N 4322288) includes limited,
non-transferable rights under the running-royalty component to use only this amount of that product to practice the Polymerase
Chain Reaction (“PCR”) and related processes described in said patents solely for the forensic testing and research activities of the
purchaser when this product is used in conjunction with a thermal cycler whose use is covered by the up-front fee component. Rights
to the up-front fee component must be obtained by the end user in order to have a complete license. These rights under the up-front
fee component may be purchased from Applied Biosystems or obtained by purchasing an Authorized Thermal Cycler. The right to
use the AmpFlSTR Identifiler PCR Amplification Kit to perform and to offer commercial services for forensic testing, using PCR,
including reporting results of purchaser’s activities for a fee or other commercial consideration, is also granted with the purchase of
said kit. Further information on purchasing licenses to practice the PCR process may be obtained by contacting the Director of
Licensing at Applied Biosystems, 850 Lincoln Centre Drive, Foster City, California 94404 or at Roche Molecular Systems, Inc.,
1145 Atlantic Avenue, Alameda, California 94501.
Notice to Purchaser for Paternity Testing Use: Limited License
The purchase price of this product includes limited, non-transferable rights under U.S. Patents 4,683,202, 4,683,195, and 4,965,188
or their foreign counterparts, owned by Roche Molecular Systems, Inc. and F. Hoffmann-La Roche Ltd ("Roche"), to use only this
amount of the product to practice the Polymerase Chain Reaction ("PCR") Process described in said patents solely for the
parentage determination testing applications of the purchaser, and excludes analysis of forensic evidence. The right to use this
product to perform and to offer commercial services for parentage determination testing applications, using PCR, including
reporting the results of the purchaser's activities for a fee or other commercial consideration, is also hereby granted. Further
information on purchasing licenses to practice PCR and related processes may be obtained by contacting the Licensing
Department, Roche Molecular Systems, Inc., 1145 Atlantic Avenue, Alameda, California, 94501.
The AmpFlSTR® Identifiler™ PCR Amplification Kit is covered by U.S. Patent No. 5,364,759 owned by Baylor College of
Medicine and is sold under license from Baylor College of Medicine.
AmpFlSTR Kits are developed and manufactured by Applied Biosystems, Foster City, CA, USA.
Certain Applied Biosystems PCR reagents are developed and manufactured by Roche Molecular Systems, Inc.
ABI PRISM and its Design, AmpFlSTR, Applied Biosystems, BioCAD, CytoFluor, GeneScan, Genotyper, MicroAmp, POROS,
and Procise are registered trademarks of Applera Corporation or its subsidiaries in the U.S. and certain other countries.
AB (Design), Applera, COfiler, 6-FAM, FMAT, Hi-Di, Identifiler, LIZ, Mariner, NED, PET, Pioneer, POP-4, Profiler Plus, SGM
Plus, VIC, and Voyager are trademarks of Applera Corporation or its subsidiaries in the U.S. and certain other countries.
AmpliTaq, AmpliTaq Gold, GeneAmp, QuantiBlot and TaqMan are registered trademarks of Roche Molecular Systems, Inc.
Mac and Macintosh are registered trademarks of Apple Computer, Inc.
All other trademarks are the sole property of their respective owners.
Contents
1 Introduction
Overview . . . . . . . . . . . . . . . . . . . . . . . . . . . . . . . . . . . . . . . . . . . . . . . . . . . . 1-1
About This Chapter. . . . . . . . . . . . . . . . . . . . . . . . . . . . . . . . . . . . . . . 1-1
In This Chapter . . . . . . . . . . . . . . . . . . . . . . . . . . . . . . . . . . . . . . . . . . 1-1
Product Overview . . . . . . . . . . . . . . . . . . . . . . . . . . . . . . . . . . . . . . . . . . . . . 1-2
Purpose . . . . . . . . . . . . . . . . . . . . . . . . . . . . . . . . . . . . . . . . . . . . . . . . 1-2
Five-Dye DNA Fragment Analysis. . . . . . . . . . . . . . . . . . . . . . . . . . . 1-2
About the Primers . . . . . . . . . . . . . . . . . . . . . . . . . . . . . . . . . . . . . . . . 1-2
Multicomponent Analysis Overview . . . . . . . . . . . . . . . . . . . . . . . . . . . . . . . 1-3
About Multicomponent Analysis . . . . . . . . . . . . . . . . . . . . . . . . . . . . 1-3
How Multicomponent Analysis Works. . . . . . . . . . . . . . . . . . . . . . . . 1-3
Loci Amplified by the Kit. . . . . . . . . . . . . . . . . . . . . . . . . . . . . . . . . . 1-4
About This User’s Manual . . . . . . . . . . . . . . . . . . . . . . . . . . . . . . . . . 1-6
Materials for the Kit . . . . . . . . . . . . . . . . . . . . . . . . . . . . . . . . . . . . . . . . . . . 1-7
Kit Contents . . . . . . . . . . . . . . . . . . . . . . . . . . . . . . . . . . . . . . . . . . . . 1-7
Kit Storage and Stability. . . . . . . . . . . . . . . . . . . . . . . . . . . . . . . . . . . 1-7
Safety . . . . . . . . . . . . . . . . . . . . . . . . . . . . . . . . . . . . . . . . . . . . . . . . . . . . . . . 1-8
Documentation User Attention Words . . . . . . . . . . . . . . . . . . . . . . . . 1-8
Chemical Hazard Warning . . . . . . . . . . . . . . . . . . . . . . . . . . . . . . . . . 1-8
Site Preparation and Safety Guide . . . . . . . . . . . . . . . . . . . . . . . . . . . 1-9
About MSDSs . . . . . . . . . . . . . . . . . . . . . . . . . . . . . . . . . . . . . . . . . . . 1-9
Ordering MSDSs. . . . . . . . . . . . . . . . . . . . . . . . . . . . . . . . . . . . . . . . 1-10
2 PCR Amplification
Overview . . . . . . . . . . . . . . . . . . . . . . . . . . . . . . . . . . . . . . . . . . . . . . . . . . . . 2-1
About This Chapter. . . . . . . . . . . . . . . . . . . . . . . . . . . . . . . . . . . . . . . 2-1
In This Chapter . . . . . . . . . . . . . . . . . . . . . . . . . . . . . . . . . . . . . . . . . . 2-1
PCR Work Areas . . . . . . . . . . . . . . . . . . . . . . . . . . . . . . . . . . . . . . . . . . . . . . 2-2
Setup Work Area. . . . . . . . . . . . . . . . . . . . . . . . . . . . . . . . . . . . . . . . . 2-2
iii
Amplified DNA Work Area . . . . . . . . . . . . . . . . . . . . . . . . . . . . . . . . 2-2
PCR Equipment and Materials . . . . . . . . . . . . . . . . . . . . . . . . . . . . . . . . . . . 2-3
Equipment and Materials Required But Not Supplied. . . . . . . . . . . . 2-3
Preparing the Reagents . . . . . . . . . . . . . . . . . . . . . . . . . . . . . . . . . . . . . . . . . 2-5
TE Buffer . . . . . . . . . . . . . . . . . . . . . . . . . . . . . . . . . . . . . . . . . . . . . . 2-5
Master Mix . . . . . . . . . . . . . . . . . . . . . . . . . . . . . . . . . . . . . . . . . . . . . 2-5
Preparing the DNA Samples . . . . . . . . . . . . . . . . . . . . . . . . . . . . . . . . . . . . . 2-7
DNA Sample Input. . . . . . . . . . . . . . . . . . . . . . . . . . . . . . . . . . . . . . . 2-7
Preparing the Samples . . . . . . . . . . . . . . . . . . . . . . . . . . . . . . . . . . . . 2-7
Performing PCR . . . . . . . . . . . . . . . . . . . . . . . . . . . . . . . . . . . . . . . . . . . . . . 2-8
Thermal Cyclers . . . . . . . . . . . . . . . . . . . . . . . . . . . . . . . . . . . . . . . . . 2-8
Amplifying the DNA . . . . . . . . . . . . . . . . . . . . . . . . . . . . . . . . . . . . . 2-8
Amplification Using Bloodstained FTA Cards . . . . . . . . . . . . . . . . . 2-9
3 Protocol for 310 Genetic Analyzer with Mac OS
Overview. . . . . . . . . . . . . . . . . . . . . . . . . . . . . . . . . . . . . . . . . . . . . . . . . . . . 3-1
About This Chapter . . . . . . . . . . . . . . . . . . . . . . . . . . . . . . . . . . . . . . 3-1
In This Chapter. . . . . . . . . . . . . . . . . . . . . . . . . . . . . . . . . . . . . . . . . . 3-1
Software Requirements. . . . . . . . . . . . . . . . . . . . . . . . . . . . . . . . . . . . . . . . . 3-2
Collection Software . . . . . . . . . . . . . . . . . . . . . . . . . . . . . . . . . . . . . . 3-2
Analysis Software . . . . . . . . . . . . . . . . . . . . . . . . . . . . . . . . . . . . . . . 3-2
Preparing the ABI PRISM 310 Genetic Analyzer . . . . . . . . . . . . . . . . . . . . . 3-3
ABI PRISM 310 Genetic Analyzer . . . . . . . . . . . . . . . . . . . . . . . . . . . 3-3
Setting Up the Instrument . . . . . . . . . . . . . . . . . . . . . . . . . . . . . . . . . 3-4
Setting Up the Run . . . . . . . . . . . . . . . . . . . . . . . . . . . . . . . . . . . . . . . . . . . 3-11
Setting the Run Temperature . . . . . . . . . . . . . . . . . . . . . . . . . . . . . . 3-11
Setting the Parameters . . . . . . . . . . . . . . . . . . . . . . . . . . . . . . . . . . . 3-11
Running Matrix Samples . . . . . . . . . . . . . . . . . . . . . . . . . . . . . . . . . 3-12
Filter Set G5 Module Files . . . . . . . . . . . . . . . . . . . . . . . . . . . . . . . . . . . . . 3-14
Overview . . . . . . . . . . . . . . . . . . . . . . . . . . . . . . . . . . . . . . . . . . . . . 3-14
Five-Dye Data Collection . . . . . . . . . . . . . . . . . . . . . . . . . . . . . . . . . . . . . . 3-15
Overview . . . . . . . . . . . . . . . . . . . . . . . . . . . . . . . . . . . . . . . . . . . . . 3-15
Creating a Five-Dye Sample Sheet and Injection List . . . . . . . . . . . 3-15
Making a Matrix File . . . . . . . . . . . . . . . . . . . . . . . . . . . . . . . . . . . . . . . . . 3-18
Matrix Standards . . . . . . . . . . . . . . . . . . . . . . . . . . . . . . . . . . . . . . . 3-18
Making a Matrix File on the ABI PRISM 310. . . . . . . . . . . . . . . . . . 3-18
iv
Running DNA Samples . . . . . . . . . . . . . . . . . . . . . . . . . . . . . . . . . . . . . . . . 3-22
Preparing Samples and AmpFl STR Identifiler Allelic Ladder . . . . 3-22
Loading Samples. . . . . . . . . . . . . . . . . . . . . . . . . . . . . . . . . . . . . . . . 3-23
Sample Electrophoresis. . . . . . . . . . . . . . . . . . . . . . . . . . . . . . . . . . . 3-24
Setting Up Software Parameters . . . . . . . . . . . . . . . . . . . . . . . . . . . . . . . . . 3-26
Setting the Analysis Parameters . . . . . . . . . . . . . . . . . . . . . . . . . . . . 3-26
GeneScan Software Results. . . . . . . . . . . . . . . . . . . . . . . . . . . . . . . . . . . . . 3-30
GeneScan Analysis Software . . . . . . . . . . . . . . . . . . . . . . . . . . . . . . 3-30
Information Provided in the Electropherogram and Table . . . . . . . . 3-30
Standards for Samples . . . . . . . . . . . . . . . . . . . . . . . . . . . . . . . . . . . 3-32
Off-Scale Data . . . . . . . . . . . . . . . . . . . . . . . . . . . . . . . . . . . . . . . . . . . . . . . 3-33
Overview. . . . . . . . . . . . . . . . . . . . . . . . . . . . . . . . . . . . . . . . . . . . . . 3-33
Off-Scale Data on the ABI PRISM 310 . . . . . . . . . . . . . . . . . . . . . . . 3-33
Shutting Down the Instrument. . . . . . . . . . . . . . . . . . . . . . . . . . . . . . . . . . . 3-34
Ending the Run . . . . . . . . . . . . . . . . . . . . . . . . . . . . . . . . . . . . . . . . . 3-34
Dedicated Equipment and Supplies . . . . . . . . . . . . . . . . . . . . . . . . . . . . . . . 3-35
Equipment Required . . . . . . . . . . . . . . . . . . . . . . . . . . . . . . . . . . . . . 3-35
Reagents Required . . . . . . . . . . . . . . . . . . . . . . . . . . . . . . . . . . . . . . 3-36
Software and User Documentation Required . . . . . . . . . . . . . . . . . . 3-37
4 Experiments and Results
Overview . . . . . . . . . . . . . . . . . . . . . . . . . . . . . . . . . . . . . . . . . . . . . . . . . . . . 4-1
About This Chapter. . . . . . . . . . . . . . . . . . . . . . . . . . . . . . . . . . . . . . . 4-1
In This Chapter . . . . . . . . . . . . . . . . . . . . . . . . . . . . . . . . . . . . . . . . . . 4-1
Experiments Performed Using the AmpFl STR Identifiler
PCR Amplification Kit . . . . . . . . . . . . . . . . . . . . . . . . . . . . . . . . . . . . . . . . . 4-2
Importance of Validation . . . . . . . . . . . . . . . . . . . . . . . . . . . . . . . . . . 4-2
Experiments . . . . . . . . . . . . . . . . . . . . . . . . . . . . . . . . . . . . . . . . . . . . 4-2
Developmental Validation . . . . . . . . . . . . . . . . . . . . . . . . . . . . . . . . . . . . . . . 4-3
8.1.1 Developmental Validation . . . . . . . . . . . . . . . . . . . . . . . . . . . . . 4-3
PCR Components . . . . . . . . . . . . . . . . . . . . . . . . . . . . . . . . . . . . . . . . 4-3
Thermal Cycler Parameters. . . . . . . . . . . . . . . . . . . . . . . . . . . . . . . . . 4-4
AmpliTaq Gold DNA Polymerase Activation . . . . . . . . . . . . . . . . . . 4-5
PCR Cycle Number . . . . . . . . . . . . . . . . . . . . . . . . . . . . . . . . . . . . . . 4-5
Accuracy, Precision, and Reproducibility . . . . . . . . . . . . . . . . . . . . . . . . . . . 4-6
8.1.2 Accuracy . . . . . . . . . . . . . . . . . . . . . . . . . . . . . . . . . . . . . . . . . . 4-6
v
Precision and Size Windows . . . . . . . . . . . . . . . . . . . . . . . . . . . . . . . 4-7
Extra Peaks in the Electropherogram . . . . . . . . . . . . . . . . . . . . . . . . . . . . . 4-18
Causes of Extra Peaks . . . . . . . . . . . . . . . . . . . . . . . . . . . . . . . . . . . 4-18
Artifacts . . . . . . . . . . . . . . . . . . . . . . . . . . . . . . . . . . . . . . . . . . . . . . 4-25
Characterization of Loci . . . . . . . . . . . . . . . . . . . . . . . . . . . . . . . . . . . . . . . 4-27
8.1.2.1 Documentation . . . . . . . . . . . . . . . . . . . . . . . . . . . . . . . . . . . 4-27
Overview . . . . . . . . . . . . . . . . . . . . . . . . . . . . . . . . . . . . . . . . . . . . . 4-27
Nature of the Polymorphisms . . . . . . . . . . . . . . . . . . . . . . . . . . . . . 4-27
Inheritance . . . . . . . . . . . . . . . . . . . . . . . . . . . . . . . . . . . . . . . . . . . . 4-27
Mapping . . . . . . . . . . . . . . . . . . . . . . . . . . . . . . . . . . . . . . . . . . . . . . 4-28
Species Specificity . . . . . . . . . . . . . . . . . . . . . . . . . . . . . . . . . . . . . . . . . . . 4-29
8.1.2.2 Species Specificity . . . . . . . . . . . . . . . . . . . . . . . . . . . . . . . . 4-29
Sensitivity . . . . . . . . . . . . . . . . . . . . . . . . . . . . . . . . . . . . . . . . . . . . . . . . . . 4-31
8.1.2.2 Sensitivity. . . . . . . . . . . . . . . . . . . . . . . . . . . . . . . . . . . . . . . 4-31
Importance of Quantitation . . . . . . . . . . . . . . . . . . . . . . . . . . . . . . . 4-31
Stability . . . . . . . . . . . . . . . . . . . . . . . . . . . . . . . . . . . . . . . . . . . . . . . . . . . . 4-33
8.1.2.2 Stability . . . . . . . . . . . . . . . . . . . . . . . . . . . . . . . . . . . . . . . . 4-33
Overview . . . . . . . . . . . . . . . . . . . . . . . . . . . . . . . . . . . . . . . . . . . . . 4-33
Differential and Preferential Amplification . . . . . . . . . . . . . . . . . . . 4-33
Effect of Inhibitors . . . . . . . . . . . . . . . . . . . . . . . . . . . . . . . . . . . . . . 4-33
Degraded DNA. . . . . . . . . . . . . . . . . . . . . . . . . . . . . . . . . . . . . . . . . 4-34
Mixture Studies. . . . . . . . . . . . . . . . . . . . . . . . . . . . . . . . . . . . . . . . . . . . . . 4-38
8.1.2.2 Mixture Studies . . . . . . . . . . . . . . . . . . . . . . . . . . . . . . . . . . 4-38
Mixed Specimen Studies . . . . . . . . . . . . . . . . . . . . . . . . . . . . . . . . . 4-38
Data Interpretation . . . . . . . . . . . . . . . . . . . . . . . . . . . . . . . . . . . . . . . . . . . 4-42
Minimum Sample Requirement . . . . . . . . . . . . . . . . . . . . . . . . . . . . 4-42
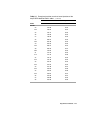
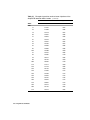
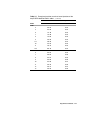
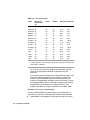
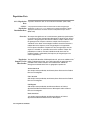
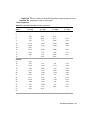
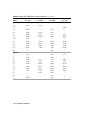
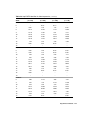
Population Data. . . . . . . . . . . . . . . . . . . . . . . . . . . . . . . . . . . . . . . . . . . . . . 4-43
8.1.2.3 Population Data . . . . . . . . . . . . . . . . . . . . . . . . . . . . . . . . . . 4-43
8.1.2.3.1 Population Distribution Data. . . . . . . . . . . . . . . . . . . . . . . 4-43
Overview . . . . . . . . . . . . . . . . . . . . . . . . . . . . . . . . . . . . . . . . . . . . . 4-43
Population Samples Used in These Studies . . . . . . . . . . . . . . . . . . . 4-43
AmpFl STR Identifiler Kit Allele Frequencies . . . . . . . . . . . . . . . . 4-44
Mutation Rate . . . . . . . . . . . . . . . . . . . . . . . . . . . . . . . . . . . . . . . . . . . . . . . 4-54
Estimating Germline Mutations . . . . . . . . . . . . . . . . . . . . . . . . . . . . 4-54
Additional Mutation Studies . . . . . . . . . . . . . . . . . . . . . . . . . . . . . . 4-54
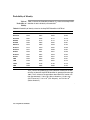
Probability of Identity . . . . . . . . . . . . . . . . . . . . . . . . . . . . . . . . . . . . . . . . . 4-55
Table of Probability of Identity . . . . . . . . . . . . . . . . . . . . . . . . . . . . 4-55
vi
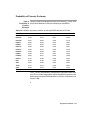
Probability of Paternity Exclusion. . . . . . . . . . . . . . . . . . . . . . . . . . . . . . . . 4-56
Table of Probability of Paternity Exclusion . . . . . . . . . . . . . . . . . . . 4-56
5 Genotyping for the Macintosh OS
Overview . . . . . . . . . . . . . . . . . . . . . . . . . . . . . . . . . . . . . . . . . . . . . . . . . . . . 5-1
About This Chapter. . . . . . . . . . . . . . . . . . . . . . . . . . . . . . . . . . . . . . . 5-1
In This Chapter . . . . . . . . . . . . . . . . . . . . . . . . . . . . . . . . . . . . . . . . . . 5-1
Using Genotyper Software for Automated Genotyping . . . . . . . . . . . . . . . . 5-2
About the Software . . . . . . . . . . . . . . . . . . . . . . . . . . . . . . . . . . . . . . . 5-2
Before Running Genotyper Software . . . . . . . . . . . . . . . . . . . . . . . . . 5-2
AmpFl STR Identifiler Kit Template . . . . . . . . . . . . . . . . . . . . . . . . . 5-3
Using the AmpFl STR Identifiler Kit Template File. . . . . . . . . . . . . . 5-4
Examining Data . . . . . . . . . . . . . . . . . . . . . . . . . . . . . . . . . . . . . . . . . 5-6
Making Tables. . . . . . . . . . . . . . . . . . . . . . . . . . . . . . . . . . . . . . . . . . . 5-7
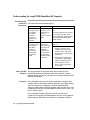
Understanding the AmpFl STR Identifiler Kit Template. . . . . . . . . . . . . . . 5-10
Troubleshooting Automated Genotyping . . . . . . . . . . . . . . . . . . . . . 5-10
About This Kit Template . . . . . . . . . . . . . . . . . . . . . . . . . . . . . . . . . 5-10
Categories . . . . . . . . . . . . . . . . . . . . . . . . . . . . . . . . . . . . . . . . . . . . . 5-10
Offset Categories. . . . . . . . . . . . . . . . . . . . . . . . . . . . . . . . . . . . . . . . 5-11
Off-Ladder Alleles and Virtual Alleles. . . . . . . . . . . . . . . . . . . . . . . 5-12
Kazam Macro . . . . . . . . . . . . . . . . . . . . . . . . . . . . . . . . . . . . . . . . . . 5-13
Kazam (20% Filter) . . . . . . . . . . . . . . . . . . . . . . . . . . . . . . . . . . . . . 5-15
Modifying the Template . . . . . . . . . . . . . . . . . . . . . . . . . . . . . . . . . . 5-15
Determining Genotypes . . . . . . . . . . . . . . . . . . . . . . . . . . . . . . . . . . . . . . . . 5-17
AmpFl STR Identifiler Allelic Ladder . . . . . . . . . . . . . . . . . . . . . . . 5-17
Genotyping Using the AmpFl STR Identifiler Allelic Ladder . . . . . 5-19
A Technical Support
Contacting Technical Support. . . . . . . . . . . . . . . . . . . . . . . . . . . . . . .A-1
To Contact Technical Support by E-Mail . . . . . . . . . . . . . . . . . . . . . .A-1
Hours for Telephone Technical Support . . . . . . . . . . . . . . . . . . . . . . .A-2
To Contact Technical Support by Telephone or Fax . . . . . . . . . . . . . .A-2
To Reach Technical Support Through the Internet . . . . . . . . . . . . . . .A-5
To Obtain Documents on Demand . . . . . . . . . . . . . . . . . . . . . . . . . . .A-6
To Obtain Customer Training Information . . . . . . . . . . . . . . . . . . . . .A-6
vii
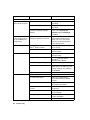
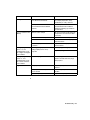
B Troubleshooting
Overview. . . . . . . . . . . . . . . . . . . . . . . . . . . . . . . . . . . . . . . . . . . . . . . . . . . . B-1
About This Appendix. . . . . . . . . . . . . . . . . . . . . . . . . . . . . . . . . . . . . B-1
In This Appendix . . . . . . . . . . . . . . . . . . . . . . . . . . . . . . . . . . . . . . . . B-1
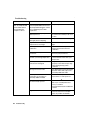
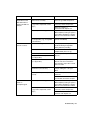
Troubleshooting . . . . . . . . . . . . . . . . . . . . . . . . . . . . . . . . . . . . . . . . . B-2
C Laboratory Setup
Overview. . . . . . . . . . . . . . . . . . . . . . . . . . . . . . . . . . . . . . . . . . . . . . . . . . . . C-1
About This Appendix. . . . . . . . . . . . . . . . . . . . . . . . . . . . . . . . . . . . . C-1
In This Appendix . . . . . . . . . . . . . . . . . . . . . . . . . . . . . . . . . . . . . . . . C-1
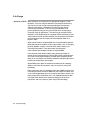
Lab Design . . . . . . . . . . . . . . . . . . . . . . . . . . . . . . . . . . . . . . . . . . . . . . . . . . C-2
Sensitivity of PCR . . . . . . . . . . . . . . . . . . . . . . . . . . . . . . . . . . . . . . . C-2
D DNA Extraction Protocols
Overview. . . . . . . . . . . . . . . . . . . . . . . . . . . . . . . . . . . . . . . . . . . . . . . . . . . . D-1
About This Appendix. . . . . . . . . . . . . . . . . . . . . . . . . . . . . . . . . . . . . D-1
In This Appendix . . . . . . . . . . . . . . . . . . . . . . . . . . . . . . . . . . . . . . . . D-1
Introduction. . . . . . . . . . . . . . . . . . . . . . . . . . . . . . . . . . . . . . . . . . . . . . . . . . D-2
Overview of DNA Sample Types. . . . . . . . . . . . . . . . . . . . . . . . . . . . D-2
DNA Extraction Methods . . . . . . . . . . . . . . . . . . . . . . . . . . . . . . . . . D-2
Warnings to Users . . . . . . . . . . . . . . . . . . . . . . . . . . . . . . . . . . . . . . . D-3
Collection and Storage of Samples for DNA Extraction . . . . . . . . . . . . . . . D-3
Proper Collection . . . . . . . . . . . . . . . . . . . . . . . . . . . . . . . . . . . . . . . . D-3
E DNA Quantitation
Overview. . . . . . . . . . . . . . . . . . . . . . . . . . . . . . . . . . . . . . . . . . . . . . . . . . . . E-1
About This Appendix. . . . . . . . . . . . . . . . . . . . . . . . . . . . . . . . . . . . . E-1
In This Appendix . . . . . . . . . . . . . . . . . . . . . . . . . . . . . . . . . . . . . . . . E-1
Importance of Quantitation . . . . . . . . . . . . . . . . . . . . . . . . . . . . . . . . . . . . . . E-2
DNA Quality . . . . . . . . . . . . . . . . . . . . . . . . . . . . . . . . . . . . . . . . . . . E-2
Quantitation and PCR Amplification . . . . . . . . . . . . . . . . . . . . . . . . . E-2
Using the QuantiBlot Kit . . . . . . . . . . . . . . . . . . . . . . . . . . . . . . . . . . . . . . . E-3
How the Kit Works. . . . . . . . . . . . . . . . . . . . . . . . . . . . . . . . . . . . . . . E-3
Specificity for Primate DNA . . . . . . . . . . . . . . . . . . . . . . . . . . . . . . . E-3
viii
Single-Stranded and Degraded DNA . . . . . . . . . . . . . . . . . . . . . . . . . E-4
Commonly Asked Questions about the QuantiBlot Kit . . . . . . . . . . . . . . . . E-5
How Much DNA? . . . . . . . . . . . . . . . . . . . . . . . . . . . . . . . . . . . . . . . . E-5
Multiple Film Exposures . . . . . . . . . . . . . . . . . . . . . . . . . . . . . . . . . . E-5
Repeating the Assay . . . . . . . . . . . . . . . . . . . . . . . . . . . . . . . . . . . . . . E-6
Performing Hybridization and Detection at a Later Time . . . . . . . . . E-6
F References
Index
ix
x
Introduction
Overview
1
1
About This This chapter describes the contents of the AmpFl STR® Identifiler™
Chapter PCR Amplification Kit, provides an overview of the kit, and provides
safety information.
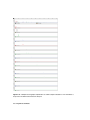
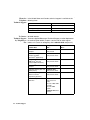
In This Chapter This chapter contains the following topics:
Topic
See Page
Overview
1-1
Product Overview
1-2
Multicomponent Analysis Overview
1-3
Materials for the Kit
1-7
Safety
1-8
Introduction 1-1
Product Overview
Purpose The AmpFl STR® Identifiler™ PCR Amplification Kit is a short tandem
repeat (STR) multiplex assay that amplifies 15 tetranucleotide repeat
loci and the Amelogenin gender determining marker in a single PCR
amplification.
All thirteen of the required loci for the Combined DNA Index System
(CODIS) loci are included in this kit for known-offender databasing
in the United States (Budowle et al., 1998a).
Two additional loci, D2S1338 and D19S433, are included. These
loci are consistent with the AmpFl STR ® SGM Plus™ PCR
Amplification Kit.
The combination of the 15 loci are consistent with several
worldwide database recommendations.
Five-Dye DNA The Identifiler kit uses a five-dye fluorescent system for automated DNA
Fragment Analysis fragment analysis. By adding an additional dye, more loci can be
multiplexed in a single PCR amplification as compared to the previous
4-dye system. Applied Biosystems PET™ and LIZ™ dyes expand the
spectral detection range that can be used on ABI PRISM ® genetic
analysis instrumentation. Together with 6-FAM™, VIC™, and NED™
dyes, the spectral emission for this five-dye set extends to 660 nm.
About the Primers The AmpFl STR Identifiler kit employs the same primer sequences as
used in all previous AmpFl STR® kits. A degenerate unlabeled primer
for the D8S1179 locus was added to the AmpFl STR® Identifiler™
Primer Set in order to address a mutation observed in a population of
Chamorros and Filipinos from Guam (Budowle et al.,1998b and
Budowle et al., 2000). The addition of the degenerate primer allows for
the amplification of those alleles in samples containing this mutation
without altering the overall performance of the AmpFl STR Identifiler
PCR Amplification Kit. The data in this user’s manual were generated
prior to the addition of the degenerate primer. Data showing
equivalence with the degenerate primer will be published.
Non-nucleotide linkers are used in primer synthesis for the following loci:
CSF1PO, D2S1338, D13S317, D16S539 and TPOX. For these primers,
non-nucleotide linkers are placed between the primer and the fluorescent
dye during oligonucleotide synthesis (Grossman et al., 1994 and Baron et
al., 1996). Non-nucleotide linkers enable reproducible positioning of the
alleles to facilitate inter-locus spacing. By combining the five-dye system
with the non-nucleotide linkers for selected loci, the same primer
sequences developed for previous AmpFl STR kits are used without
modification.
1-2 Introduction
Multicomponent Analysis Overview
About Multicomponent analysis is the process that separates the five different
Multicomponent fluorescent dye colors into distinct spectral components. The four dyes
Analysis used in the AmpFl STR® Identifiler™ PCR Amplification Kit to label
samples are 6-FAM™, VIC™, NED™ and PET™ dyes. The fifth dye,
LIZ™, is used to label the GeneScan™-500 Size Standard.
How Each of these fluorescent dyes emits its maximum fluorescence at a
Multicomponent different wavelength. During data collection on the ABI PRISM®
Analysis Works instruments, the fluorescent signals are separated by a diffraction
grating according to their wavelengths and projected onto a
charge-coupled device (CCD) camera in a predictably spaced pattern.
6-FAM dye emits at the shortest wavelength and is displayed as blue,
followed by the VIC dye (green), NED dye (yellow), PET dye (red) and
LIZ dye (orange).
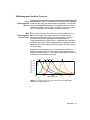
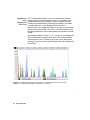
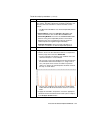
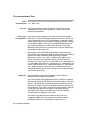
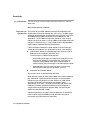
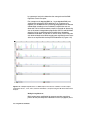
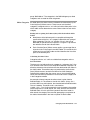
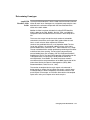
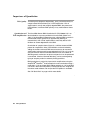
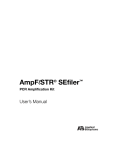
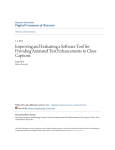
Although each of these dyes emits its maximum fluorescence at a
different wavelength, there is some overlap in the emission spectra
between the dyes (Figure 1-1). The goal of multicomponent analysis is
to effectively correct for spectral overlap.
Normalized Emission
6-FAM
VIC
NED PET
LIZ
100
80
60
40
20
0
500
550
600
650
700
Wavelength (nm)
Figure 1-1
Emission spectra of the five dyes used in the AmpFl STR
Identifiler PCR Amplification Kit
Introduction 1-3
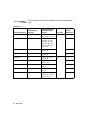
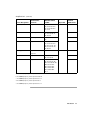
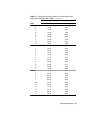
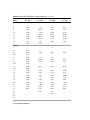
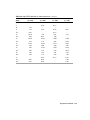
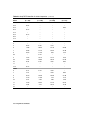
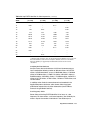
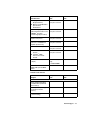
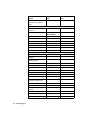
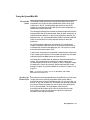
Loci Amplified by The table below shows the loci amplified and the corresponding dyes
the Kit used.
Amplified Loci:
Alleles Included in
Identifiler Allelic
Ladder
Locus Designation
Chromosome
Location
D8S1179
8
8, 9 10, 11, 12, 13,
14, 15, 16, 17, 18, 19
D21S11
21q11.2-q21
24, 24.2, 25, 26, 27,
28, 28.2, 29, 29.2,
30, 30.2, 31, 31.2,
32, 32.2, 33, 33.2,
34, 34.2, 35, 35.2,
36, 37, 38
30b
D7S820
7q11.21-22
6, 7, 8, 9, 10, 11, 12,
13, 14, 15
10, 11
CSF1PO
5q33.3-34
6, 7, 8, 9, 10, 11, 12,
13, 14, 15
10, 12
D3S1358
3p
12, 13, 14, 15, 16,
17, 18, 19
TH01
11p15.5
4, 5, 6, 7, 8, 9, 9.3,
10, 11, 13.3
8, 9.3
D13S317
13q22-31
8, 9, 10, 11, 12, 13,
14, 15
11c
D16S539
16q24-qter
5, 8, 9, 10, 11, 12,13,
14, 15
11, 12
D2S1338
2q35-37.1
15, 16, 17, 18, 19,
20, 21, 22, 23, 24,
25, 26, 27, 28
19, 23
1-4 Introduction
Dye Label
Control
DNA 9947A
6-FAM
13a
VIC
14, 15
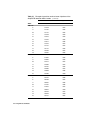
Amplified Loci:
(continued)
Alleles Included in
Identifiler Allelic
Ladder
Locus Designation
Chromosome
Location
Dye Label
Control
DNA 9947A
D19S433
19q12-13.1
9, 10, 11, 12, 12.2,
13, 13.2, 14, 14.2,
15, 15.2, 16, 16.2,
17, 17.2
NED
14, 15
vWA
12p12-pter
11,12, 13, 14, 15, 16,
17, 18, 19, 20, 21,
22, 23, 24
17, 18
TPOX
2p23-2per
6, 7, 8, 9, 10, 11, 12,
13
8d
D18S51
18q21.3
7, 9, 10, 10.2, 11, 12,
13, 13.2, 14, 14.2,
15, 16, 17, 18, 19,
20, 21, 22, 23, 24,
25, 26, 27
15, 19
Amelogenin
X: p22.1-22.3
X, Y
PET
X
Y: p11.2
D5S818
5q21-31
7, 8, 9, 10, 11, 12,
13, 14, 15, 16
11e
FGA
4q28
17, 18, 19, 20, 21,
22, 23, 24, 25, 26,
26.2, 27, 28, 29, 30,
30.2, 31.2, 32.2,
33.2, 42.2, 43.2,
44.2, 45.2, 46.2,
47.2, 48.2, 50.2,
51.2
23, 24
a. For CODIS purposes, profile reported as 13, 13.
b. For CODIS purposes, profile reported as 30, 30.
c. For CODIS purposes, profile reported as 11, 11.
d. For CODIS purposes, profile reported as 8, 8.
e. For CODIS purposes, profile reported as 11, 11.
Introduction 1-5
About This User’s This user’s manual provides users of the AmpFl STR Identifiler PCR
Manual Amplification Kit with protocols and data obtained by Applied
Biosystems. Applied Biosystems recommends that users conduct
similar experiments to evaluate in their labs the DNA typing system
consisting of AmpFl STR Identifiler PCR Amplification Kit, reagents,
software and ABI PRISM instruments. Furthermore, Applied Biosystems
suggests that users apply the standards by the community for which
this test will be used to further evaluate this DNA typing system.
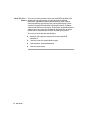
This user’s manual describes the following:
1-6 Introduction
Materials and equipment required to use the AmpFl STR
Identifiler kit
How to use the kit to amplify DNA samples
How to perform automated detection
How to analyze results
Materials for the Kit
Kit Contents The AmpFl STR Identifiler kit contains sufficient quantities of the
following reagents and the appropriate licenses to perform 200 25-µL
amplifications:
Component
Description
Volume
AmpFlSTR® PCR
Reaction Mix
Two tubes containing MgCl2,
deoxynucleotide triphosphates, and
bovine serum albumin in buffer with
0.05% sodium azide
1.1 mL/tube
AmpFlSTR
Identifiler Primer
Set
One tube containing fluorescently
labeled primers and non-labeled
primers
1.1 mL
AmpliTaq Gold®
DNA Polymerase
Two tubes of enzyme with an activity
of 5 U/µL
50 µL/tube
AmpFlSTR®
Control DNA
9947A
One tube containing 0.10 ng/µL
human female cell line DNA in
0.05% sodium azide and buffer
(refer to pages 1-4 and 1-5 for
profile)
0.3 mL
AmpFlSTR®
Identifiler™ Allelic
Ladder
One tube of AmpFlSTR Identifiler
Allelic Ladder containing amplified
alleles. See the table on pages 1-4
and 1-5 for a list of alleles included
in the allelic ladder
50 µL
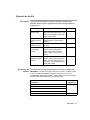
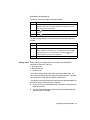
Kit Storage and The table below lists the storage temperature for the kit components.
Stability IMPORTANT The fluorescent dyes attached to the primers are light-sensitive.
Protect the AmpFlSTR Identifiler Primer Set from light when not in use.
Amplified DNA, AmpFl STR ® Identifiler™ Allelic Ladder and GeneScan™-500
LIZ™ Size Standard should also be protected from light.
Component
AmpFlSTR PCR Reaction Mix
Storage
Temperature
2 to 8 °C
AmpFlSTR Identifiler Primer Set
AmpFlSTR Control DNA 9947A
AmpFlSTR Identifiler Allelic Ladder
AmpliTaq Gold DNA Polymerase
–15 to –25 °C
Introduction 1-7
Safety
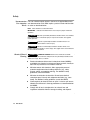
Documentation Five user attention words appear in the text of all Applied Biosystems
User Attention user documentation. Each word implies a particular level of observation
Words or action as described below.
Note
Calls attention to useful information.
IMPORTANT Indicates information that is necessary for proper instrument
operation.
! CAUTION Indicates a potentially hazardous situation which, if not avoided,
may result in minor or moderate injury. It may also be used to alert against
unsafe practices.
! WARNING Indicates a potentially hazardous situation which, if not
avoided, could result in death or serious injury.
! DANGER Indicates an imminently hazardous situation which, if not
avoided, will result in death or serious injury. This signal word is to be limited to
the most extreme situations.
Chemical Hazard ! WARNING CHEMICAL HAZARD. Some of the chemicals used with
Warning Applied Biosystems instruments and protocols are potentially hazardous and
could cause injury, illness, or death.
1-8 Introduction
Read and understand the material safety data sheets (MSDSs)
provided by the chemical manufacturer before you store, handle, or
work with any chemicals or hazardous materials.
Minimize contact with chemicals. Wear appropriate personal
protective equipment when handling chemicals (e.g., safety
glasses, gloves, or protective clothing). For additional safety
guidelines, consult the MSDS.
Minimize the inhalation of chemicals. Do not leave chemical
containers open. Use only with adequate ventilation (e.g., fume
hood). For additional safety guidelines, consult the MSDS.
Check regularly for chemical leaks or spills. If a leak or spill occurs,
follow the manufacturer’s cleanup procedures as recommended on
the MSDS.
Comply with all local, state/provincial, or national laws and
regulations related to chemical storage, handling, and disposal.
Site Preparation A site preparation and safety guide is a separate document sent to all
and Safety Guide customers who have purchased an Applied Biosystems instrument.
Refer to the guide written for your instrument for information on site
preparation, instrument safety, chemical safety, and waste profiles.
About MSDSs Some of the chemicals used with this instrument may be listed as
hazardous by their manufacturer. When hazards exist, warnings are
prominently displayed on the labels of all chemicals.
Chemical manufacturers supply a current MSDS before or with
shipments of hazardous chemicals to new customers and with the first
shipment of a hazardous chemical after an MSDS update. MSDSs
provide you with the safety information you need to store, handle,
transport and dispose of the chemicals safely.
We strongly recommend that you replace the appropriate MSDS in your
files each time you receive a new MSDS packaged with a hazardous
chemical.
! WARNING CHEMICAL HAZARD. Be sure to familiarize yourself with
the MSDSs before using reagents or solvents.
llll
Introduction 1-9
Ordering MSDSs You can order free additional copies of MSDSs for chemicals
manufactured or distributed by Applied Biosystems using the contact
information below.
To order MSDSs...
Then...
Over the Internet
a. Go to our Web site at
www.appliedbiosystems.com/techsupp.
b. Click MSDSs.
If you have...
Then...
The MSDS document
number or the
Document on Demand
index number
Enter one of these
numbers in the
appropriate field on
this page
The product part
number
Select Click Here,
then enter the part
number or keyword(s)
in the field on this
page.
Keyword(s)
c. You can open and download a PDF (using Adobe®
Acrobat Reader) of the document by selecting it,
or you can choose to have the document sent to
you by fax or email.
By automated
telephone service
Use “To Obtain Documents on Demand” on
page A-6.
By telephone in the
United States
Dial 1-800-327-3002, then press 1.
By telephone from
Canada
By telephone from
any other country
To order in...
Dial 1-800-668-6913 and...
English
Press 1, then 2, then 1 again
French
Press 2, then 2, then 1
See “To Contact Technical Support by Telephone or
Fax” on page A-2.
For chemicals not manufactured or distributed by Applied Biosystems,
call the chemical manufacturer.
1-10 Introduction
PCR Amplification 2
Overview
2
About This This chapter describes how to prepare the master mix for amplifying
Chapter sample DNA using the AmpFl STR® Identifiler™ PCR Amplification Kit,
prepare samples and controls, and perform PCR.
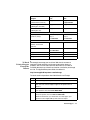
In This Chapter This chapter contains the following topics:
Topic
See Page
Overview
2-1
PCR Work Areas
2-2
PCR Equipment and Materials
2-3
Preparing the Reagents
2-4
Preparing the DNA Samples
2-6
Performing PCR
2-7
PCR Amplification 2-1
PCR Work Areas
Setup Work Area IMPORTANT These items should never leave the PCR Setup Work Area
Calculator
Microcentrifuge tube rack
Gloves, disposable
Marker pen, permanent
Microcentrifuge
Microcentrifuge tubes, 1.5-mL, or 2.0-mL, or other appropriate
clean tube (for Master Mix preparation)
Pipet tips, sterile, disposable hydrophobic filter-plugged
Pipettors
Tube decapper, autoclavable
Vortex
x
Amplified DNA IMPORTANT The GeneAmp® PCR Systems should be placed in the
Work Area Amplified DNA Work Area
GeneAmp® PCR System 9700
-or-
G
2-2 PCR Amplification
GeneAmp® PCR System 9600
PCR Equipment and Materials
Equipment and The tables below list the equipment and materials required in addition
Materials to the reagents supplied with the AmpFl STR Identifiler kit for PCR
Required But Not amplification.
Supplied Required Equipment:
Equipment
GeneAmp ®
Source
PCR System 9700
Applied Biosystems
(P/N N805-0001)
Microcentrifuge
Major laboratory supplier (MLS)
Pipettors
MLS
Vortex
MLS
Required Materials:
Materials
Source
MicroAmp® 96 Well Trays for Tubes with Caps
Applied Biosystems
(P/N N801-0541)
MicroAmp Reaction Tubes with Caps, 0.2-mL
Applied Biosystems
(P/N N801-0540)
MicroAmp Reaction Tubes (8 tubes/strip)
Applied Biosystems
(P/N N801-0580)
MicroAmp Caps (8 caps/strip)
Applied Biosystems
(P/N N801-0535)
MicroAmp 96-Well Tray/Retainer Set
Applied Biosystems
(P/N 403081)
MicroAmp 96-Well Base
Applied Biosystems
(P/N N801-0531)
MicroAmp Optical 96-Well Reaction Plate
Applied Biosystems
(P/N N801-0560)
Microcentrifuge tubes, 1.5-mL
MLS
Microcentrifuge tubes, 2.0-mL
MLS
Pipet tips, sterile, disposable hydrophobic
filter-plugged
MLS
Tape, labeling
MLS
Tube, 50-mL Falcon
MLS
Tube decapper, autoclavable
MLS
Deionized water, PCR grade
MLS
Tris-HCL, pH 8.0
MLS
0.5-M EDTA
MLS
PCR Amplification 2-3
Preparing the Reagents
TE Buffer The final concentration of TE buffer is 10 mM Tris-HCl, 0.1 mM EDTA,
pH 8.0.
To prepare TE buffer:
Step
1
Action
Mix together:
10 mL of 1 M Tris-HCl, pH 8.0
0.2 mL of 0.5 M EDTA
990 mL glass-distilled or deionized water
! CAUTION CHEMICAL HAZARD. EDTA may cause eye, skin,
and respiratory tract irritation. Please read the MSDS, and follow
the handling instructions. Wear appropriate protective eye wear,
clothing, and gloves.
Note
Adjust the volumes accordingly for specific needs.
2
Aliquot and autoclave the solutions.
3
Store at room temperature.
Master Mix Prepare the master mix by combining AmpFl STR® PCR Reaction Mix,
AmpliTaq Gold® DNA Polymerase, and AmpFl STR® Identifiler™ Primer
Set reagents.
IMPORTANT The fluorescent dyes attached to the primers are light-sensitive.
Protect the AmpFlSTR Identifiler Primer Set from light when not in use. Also
protect the AmpFl STR Identifiler Allelic Ladder, GeneScan™-500 LIZ™ Size
Standard and amplified, fluorescently labeled PCR products from light.
2-4 PCR Amplification
To prepare the master mix:
Step
Action
1
Determine the total number of samples, including controls.
2
IMPORTANT Vortex the following reagents for 5 sec:
AmpFlSTR PCR Reaction Mix
AmpliTaq Gold DNA Polymerase
AmpFlSTR Identifiler Primer Set
! CAUTION CHEMICAL HAZARD. AmpliTaq Gold DNA
Polymerase may cause eye and skin irritation. It may cause
discomfort if swallowed or inhaled. Please read the MSDS, and
follow the handling instructions. Wear appropriate protective eye
wear, clothing, and gloves.
3
Spin the tubes briefly in a microcentrifuge to remove any liquid from
the caps.
4
Select a clean, unused tube for the master mix.
5
If you are preparing...
Then use a...
≤ 84 samples and controls
1.5-mL microcentrifuge tube
85–110 samples and controls
2.0-mL microcentrifuge tube
> 110 samples and controls
tube that is appropriate
Calculate the required amount of components as shown:
Note The formulation in the list below provides a slight overfill to
allow for volume lost in pipetting.
Number of samples X 10.5 µL of AmpFl STR PCR Reaction Mix
Number of samples X 0.5 µL of AmpliTaq Gold DNA Polymerase
Number of samples X 5.5 µL of AmpFl STR Identifiler Primer Set
6
Vortex the master mix at medium speed for 5 sec.
7
Dispense 15 µL of master mix per PCR tube.
PCR Amplification 2-5
Preparing the DNA Samples
DNA Sample Input DNA amplification with the AmpFl STR® Identifiler™ kit requires 10 µL
of DNA at a recommended concentration of 0.05–0.125 ng/µL.
Preparing the Note The final volume in each PCR tube is 25 µL.
Samples To prepare the samples:
If you are preparing the
Then...
DNA test sample tube and the
sample DNA concentration is
≤ 0.125 ng/µL
Add 10 µL of sample to the PCR
tube.
DNA test sample tube and the
sample DNA concentration is
> 0.125 ng/µL
Dilute a portion of the sample with
TE buffer (see page 2-4 for
preparation) so that only 0.5–1.25 ng
of total DNA is in a volume of 10 µL
(final sample concentration is
0.05–0.125 ng/µL).
Positive Control Tube
a. Vortex the AmpFlSTR® Control
DNA 9947A tube (0.10 ng/µL).
b. Spin the tube briefly in a
microcentrifuge to remove any
liquid from the cap.
c. Add 10 µL (1 ng) of AmpFl STR
Control DNA 9947A to the
Positive Control Tube.
Negative Control Tube
2-6 PCR Amplification
Add 10 µL of TE buffer (see
page 2-4 for preparation) to the
labeled Negative Control Tube.
Performing PCR
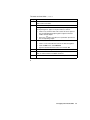
Thermal Cyclers Use either of the following thermal cyclers to amplify loci using the
AmpFl STR Identifiler kit:
GeneAmp® PCR System 9700
GeneAmp® PCR System 9600
Amplifying the To amplify the DNA:
DNA
Step
1
Action
Program the thermal cycling conditions.
IMPORTANT If using the GeneAmp PCR System 9700, select the
9600 Emulation Mode.
Initial
Incubation
Step
Denature
HOLD
Anneal
Extend
Final
Extension
CYCLE (28 cycles)
95 °C
11 min
94 °C
1 min
59 °C
1 min
72 °C
1 min
Final
Step
HOLD
HOLD
60 °C
60 min
4–25 °C
(forever)
Note If leaving the amplified products in the thermal cycler for
more than 18 hr., set the final step to HOLD at 4–25 °C forever. The
final step can be held anywhere in this range. Each laboratory
should determine the final time and temperature to store PCR
products in the thermal cycler.
2
Place the tray in the thermal cycler.
3
Close the heated cover.
4
Start the thermal cycler.
5
Remove the tubes from the instrument block after the PCR is
completed.
6
Store the amplified DNA.
If you are storing the DNA...
Then place at...
<2 weeks
2 to 6 °C.
>2 weeks
–15 to –25 °C.
IMPORTANT Protect the amplified products from light.
PCR Amplification 2-7
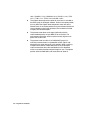
Amplification
Using
Bloodstained
FTA Cards
FTA™-treated DNA collection cards can be useful for the collection,
storage, and processing of biological samples. A small punch of the
bloodstained card can be placed directly into an amplification tube,
purified, and amplified without transferring the evidence. Our studies
have indicated that a 1.2-mm bloodstained punch contains
approximately 5–20 ng DNA. Accordingly, an appropriate cycle number
for this high quantity of DNA is 25 cycles. It is recommended that each
laboratory determine the cycle number based upon individual validation
studies.
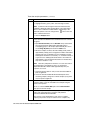
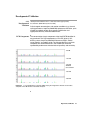
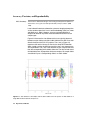
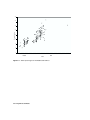
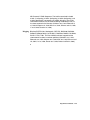
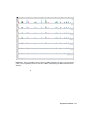
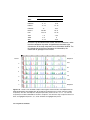
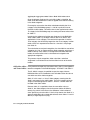
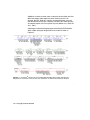
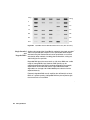
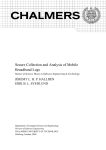
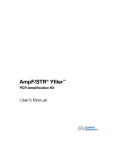
In the example shown in Figure 2-1, a 1.2-mm punch of a bloodstained
FTA card was purified using one wash with FTA Purification Reagent
and two washes with 1X TE buffer. After drying at room temperature
overnight, the punch was then amplified directly in the MicroAmp® tube
for 25 cycles.
Figure 2-1 AmpFlSTR Identifiler kit results from a 1.2-mm FTA bloodstain punch (25 cycle
amplification), analyzed on the ABI PRISM 310 Genetic Analyzer
2-8 PCR Amplification
Protocol for 310 Genetic
Analyzer with Mac OS 3
Overview
3
About This AmpFl STR® Identifiler™ PCR Amplification Kit products are
Chapter electrophoretically separated using a capillary filled with POP-4™
(Performance Optimized Polymer 4) and detected on the
ABI PRISM ® 310 Genetic Analyzer. Protocols for analyzing samples on
the ABI PRISM 310 Genetic analyzer are described in this chapter.
In This Chapter This chapter contains the following topics:
Topic
See Page
Overview
3-1
Software Requirements
3-2
Preparing the ABI PRISM 310 Genetic Analyzer
3-3
Setting Up the Run
3-11
Filter Set G5 Module Files
3-14
Five-Dye Data Collection
3-15
Making a Matrix File
3-18
Running DNA Samples
3-22
Setting Up Software Parameters
3-26
GeneScan Software Results
3-30
Off-Scale Data
3-33
Shutting Down the Instrument
3-34
Dedicated Equipment and Supplies
3-35
Protocol for 310 Genetic Analyzer with Mac OS 3-1
Software Requirements
Collection Data Collection Software v2.1 must be installed before AmpFl STR
Software Identifiler PCR Amplification Kit products can be run in order to properly
collect five-dye data. Additionally, before running AmpFl STR Identifiler
PCR products on the instrument, a matrix file must be made using the
6-FAM™, VIC™, NED™, PET™ and LIZ™ matrix standards run using
the GS STR POP 4 (1 mL) G5 module.
Analysis Software This chapter was written for use with GeneScan Analysis 3.1 Software
or higher. Refer to the ABI PRISM 310 Genetic Analyzer User’s Manual
(P/N 903565) and GeneScan Analysis Software Version 3.1 User’s
Manual (P/N 403001) for more detailed information on the instrument
and software used with these protocols. Genotyper® software v2.5.2 or
higher must be used to analyze Identifiler kit data (see Chapter 5).
3-2 Protocol for 310 Genetic Analyzer with Mac OS
Preparing the ABI PRISM 310 Genetic Analyzer
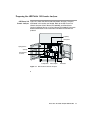
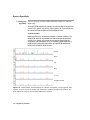
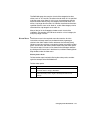
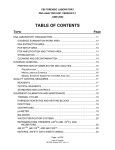
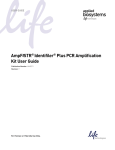
ABI PRISM 310 Figure 3-1 shows the ABI PRISM® 310 Genetic Analyzer. The parts
Genetic Analyzer mentioned in this section are labeled. Refer to the ABI PRISM 310
Genetic Analyzer User’s Manual (P/N 903565) and GeneScan ®
Analysis Software Version 3.1 User’s Manual (P/N 4306157) for more
detailed information on the instrument and software used with this
protocol.
Capillary
Heat plate
Syringe drive
0.05 0.1
0.15 0.2
0.25
Syringe
ABI PRISM
Pump block
Figure 3-1
Autosampler
GR0422
Anode buffer
reservoir
Electrode
ABI PRISM 310 Genetic Analyzer
Protocol for 310 Genetic Analyzer with Mac OS 3-3
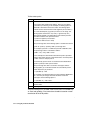
Setting Up the Installing a New Electrode
Instrument Installing and trimming a new electrode is usually necessary only when
the instrument is first set up or if the electrode was or has been bent
severely.
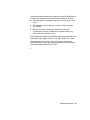
IMPORTANT A new electrode must be trimmed to the correct length. Refer to
Figure 3-2 for trimming the electrode.
Note
Not all electrodes need to be trimmed. Trim only as needed.
To install a new electrode:
Step
Action
1
Install the new electrode on the instrument as described in the
ABI PRISM 310 Genetic Analyzer User’s Manual.
2
Under the Manual Control menu, select Home Z-Axis.
3
a. Use the flush-cutting wire cutter (P/N T-6157) provided in the
instrument packing kit.
b. Hold the cutters with the flat cutting face toward the top of the
instrument.
4
Cut a small amount off the end of the electrode until it is flush with
the lower surface of the stripper plate.
Be careful not to flex the stripper plate upwards while cutting. Do
not cut off more than 1mm beyond the lower surface of the stripper
plate (Figure 3-2).
Figure 3-2
Trimming the electrode
3-4 Protocol for 310 Genetic Analyzer with Mac OS
Cleaning the Electrode
To clean the electrode:
Step
Action
1
Wipe the electrode with a Kim wipe tissue that has been dampened
with distilled, deionized water.
2
Dry the electrode with a fresh Kim wipe tissue.
Note The autosampler should be recalibrated after cleaning
the electrode, as described in “Calibrating the Autosampler” of the
ABI PRISM 310 Genetic Analyzer User’s Manual.
Removing the Syringe
To remove the syringe:
Step
Action
1
Launch the ABI PRISM 310 Data Collection software.
2
a. Under the Window menu, select Manual Control.
b. Select Syringe Home from the Function pop-up menu.
c. Click Execute.
Note For all commands in the Manual Control window, the
Execute button must be selected to complete the task.
3
Open the instrument doors and move the syringe drive toggle to the
left.
4
Unscrew the syringe from the pump block.
Checking the Syringe
Verify that the 1.0-mL glass syringe (P/N 4304471) has a small O-ring
(P/N 221102) inside the syringe, and that another O-ring is placed
around the ferrule-shaped seal. The ferrule should be firmly seated in
the end of the 1.0-mL syringe. If the syringe is dirty, it must be cleaned
before use.
Cleaning the Syringe
To clean the syringe:
Step
1
Action
Remove the plunger by slowly drawing it from the glass barrel
(count to 5, this should take approximately 5 sec.) while keeping the
entire syringe submerged in water.
IMPORTANT Moving the dry plunger quickly can damage it,
resulting in premature failure or leakage around the plunger.
Protocol for 310 Genetic Analyzer with Mac OS 3-5
To clean the syringe:
Step
2
Action
Remove the ferrule from the syringe.
a. Soak the ferrule in warm (not boiling) water for as long as it
takes to remove crystals (if any) in the ferrule.
b. Rinse the ferrule with deionized water.
3
Clean the glass barrel with warm water. Dissolve any crystals.
4
Rinse the glass barrel with distilled, deionized water.
IMPORTANT Remove all residual water from the syringe by
blowing compressed air through it.
5
Inspect the O-ring in the stainless steel hub of the syringe for
damage, and replace it if necessary.
IMPORTANT Make sure the O-ring does not block the hole in the
stainless steel hub.
6
Inspect the O-ring on the ferrule and replace it if necessary.
7
Place the ferrule back onto the syringe.
IMPORTANT The Teflon™ tip of the plunger must be damp when
inserting it into the barrel (place a drop of distilled deionized water
on the Teflon), or the Teflon™ tip could be damaged.
Note For syringe storage, the plunger should remain in the
syringe barrel.
3-6 Protocol for 310 Genetic Analyzer with Mac OS
Loading the Syringe
To load the syringe:
Step
Action
1
Prime the syringe with approximately 0.1 mL of POP-4 polymer.
2
Fill the 1.0-mL syringe manually with a maximum of 0.8 mL of
POP-4 polymer.
Note The polymer should not stay in the syringe longer than
3 days. Do not return unused polymer to the bottle.
Note Before use, the POP-4 polymer should be allowed to
equilibrate to room temperature. If precipitate is present in the
bottle when removed from cold storage, it should go back into
solution at room temperature. Gently mix the polymer thoroughly by
inversion before using.
3
Wipe the outside of syringe with a Kim wipe tissue to dry.
4
Remove any air bubbles by inverting the syringe and pushing a
small amount of polymer out of the tip.
Removing and Cleaning the Pump Block
Before setting up the instrument for a run, make sure that the pump
block is clean of all polymer, especially if the polymer in the syringe has
been sitting at room temperature for more than three days. Urea
decomposition during this interval causes transient current increases
(spikes) during electrophoresis.
To remove and clean the pump block, see “Cleaning and Maintaining
the Instrument” in the ABI PRISM 310 Genetic Analyzer User’s Manual.
Follow the instructions in the sections titled “Removing the Pump
Block,” “Rinsing the Pump Block,” and “Replacing the Pump Block.” We
do not recommend following the section titled “Rinsing the Pump Block
on the Instrument” for this application.
IMPORTANT Remove all residual water from the pump block and fittings by
blowing canned compressed air through the channels. Make sure the can is
held upright or the propellant in the can may be shot into the gel block. This can
result in poor resolution or high baseline.
Reinstall the pump block on the instrument after cleaning.
Installing the Syringe on the Pump Block
To install the syringe on the pump block:
Step
1
Action
Move the syringe drive toggle on the instrument to the left in order
to be able to attach the syringe to the pump block.
Protocol for 310 Genetic Analyzer with Mac OS 3-7
To install the syringe on the pump block:
Step
2
(continued)
Action
Place the 1.0-mL syringe through the right-hand port of the plastic
syringe guide plate and screw the syringe into the pump block.
The syringe should be finger-tight in the block.
3
Hand-tighten the valves on the pump block to the left of and below
the syringe.
Note Overtightening can cause microscopic fractures in the
pump block. Undertightening may result in “syringe leak detected”
message.
Installing the Capillary
To install the capillary :
Step
1
Action
a. Clean capillary window with 95% ethanol on a lint-free tissue.
b. Do not touch capillary window after cleaning.
2
a. Install the 47-cm, 50-µm i.d. capillary (P/N 402839, green mark)
as described in the ABI PRISM 310 Genetic Analyzer User’s
Manual.
b. Follow the instructions in the section titled “Installing the
Capillary.”
c. If a new capillary has been installed, select Change Capillary
under the Instrument menu.
d. Select OK in the Reset window to set the injection counter to
zero.
3
After installing the capillary, secure it into place by pressing a piece
of thermal tape over it onto the heat plate just above the electrode.
Note The capillary should be approximately flush with, or less
than 1 mm below, the end of the electrode.
4
Calibrate the autosampler.
Make sure that it is calibrated in the X, Y, and Z directions. The
capillary should almost touch the metal calibration points. Refer
to “Calibrating the Autosampler” in the ABI PRISM 310 Genetic
Analyzer User’s Manual.
IMPORTANT The sample tray must be removed before
calibrating the autosampler. If the sample tray is not removed, the
electrode may bend.
3-8 Protocol for 310 Genetic Analyzer with Mac OS
Filling the Buffer Reservoirs
To fIll the buffer reservoirs:
Step
Action
1
Dilute 5 mL of 10X Genetic Analyzer Buffer with EDTA
(P/N 402824) to 1X concentration (50 mL) with distilled, deionized
water. Change to fresh buffer every 48 hours or 96 injections,
whichever comes first.
2
a. Fill the anode buffer reservoir to the red line with 1X Genetic
Analyzer Buffer.
b. Secure the reservoir on the pump block.
! CAUTION CHEMICAL HAZARD. 10X Genetic Analyzer
Buffer with EDTA. May cause eye, skin and respiratory tract
irritation. Please read the MSDS, and follow handling instructions.
Wear appropriate protective eye wear, clothing, and gloves.
3
a. Fill a 4-mL glass buffer vial (P/N 401955) to the fill line with 1X
Genetic Analyzer Buffer.
b. Insert the plastic vial lid with attached septum (P/N 402059) into
the glass vial.
c. Place the buffer vial into position 1 on the autosampler. This will
serve as the cathode buffer.
Note Overfilling and underfilling one or both buffer reservoir and
vial can cause siphoning. Pay close attention to the red fill line.
4
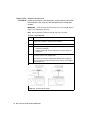
a. Fill a second 4-mL glass buffer vial to the fill line with distilled
water.
b. Insert the plastic vial lid with attached septum into the glass vial.
c. Place the vial into position 2 on the autosampler.
5
a. Fill a 1.5-mL Eppendorf tube full with distilled water.
b. Place it into position 3 on the autosampler.
Note Do not use a screw-cap tube. The lids on screw-cap tubes
are too high to clear the electrode and capillary. Use a 1.5-mL
Eppendorf tube with the lid clipped off.
Priming the Pump Block
To prime the pump block:
Step
1
Action
a. From the Window menu, select Manual Control.
b. Select Buffer Valve Close from the pop-up menu.
c. Click Execute.
2
Partly unscrew the capillary filling ferrule.
Protocol for 310 Genetic Analyzer with Mac OS 3-9
To prime the pump block:
Step
3
(continued)
Action
Manually press down on the 1.0-mL syringe plunger until the ferrule
space is filled with polymer.
Note
This will remove the air bubbles at the ferrule site.
4
Tighten the ferrule to close.
5
Partly unscrew the waste valve on the pump block (below the
syringe).
6
Manually press down on the 1.0-mL syringe plunger until the valve
space is filled with polymer.
Note This will remove the air bubbles at this valve site, and
should use about 0.1 mL of polymer.
7
Tighten the waste valve to close.
8
To open the pin valve at the anode buffer reservoir on the pump
block,
a. From the Manual Control window, select Buffer Valve Open.
b. Click Execute.
9
Manually press down on the 1.0-mL syringe plunger to push
enough gel through the block so that all of the air bubbles are
removed from the polymer channel in the block. (This process
should use about 0.2 mL of polymer).
IMPORTANT There should be no air bubbles in the pump block
channels.
10
a. Close the pin valve by selecting Buffer Valve Close from the
pop-up menu in the Manual Control window.
b. Click Execute.
11
12
Move the syringe drive toggle to the right so that it is positioned
over the syringe plunger.
a. From the Manual Control window select Syringe Down.
b. Select 50-step intervals. Execute until the toggle almost makes
contact with the syringe plunger.
c. Click Execute.
d. Select smaller step intervals until the toggle makes contact with
the syringe plunger.
3-10 Protocol for 310 Genetic Analyzer with Mac OS
Setting Up the Run
Setting the Run Setting the run temperature prior to starting a run is optional; however,
Temperature this step saves time. This heating step occurs automatically at the
beginning of the GS STR POP4 (1 mL) G5 run module.
To set the run temperature:
Step
Action
1
Close the instrument doors.
2
Return to the ABI PRISM 310 Collection Software.
3
a. From the Window menu, select Manual Control.
b. Select Temperature Set from the pop-up menu.
4
a. Set the temperature to 60 °C.
b. Click Execute.
Note It takes up to 30 min for the instrument to reach the 60 °C
run temperature. Samples can be prepared while the instrument is
heating.
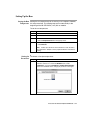
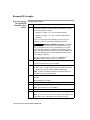
Setting the To choose a five-dye sample sheet:
Parameters
Step
1
Action
This is an optional step: Launch the 310 Genetic Analyzer Data
Collection software v2.1. From the Window menu, under
Preferences, choose the GeneScan™ Sample Sheet Defaults.
Set the size standard color to orange (O) as shown in the figure.
Protocol for 310 Genetic Analyzer with Mac OS 3-11
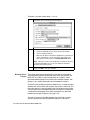
To choose a five-dye sample sheet:
(continued)
2
Select GeneScan Injection List Defaults from the Page
drop-down menu. The following window appears.
3
Make the following selections in the above window:
a.
Select GS STR POP4 (1 mL) G5 for the five-dye module.
b.
Choose a default matrix file.
c.
Make sure the Genescan Analysis application is selected if you
wish to autoanalyze. If you do not wish to autoanalyze your
data, deselect the box next to the Autoanalyze with option.
Note When you create a new sample sheet, a portion of the form
is automatically filled in for you. You can modify the automatic
defaults in the Preferences file.
4
Once you have finished making changes to the Preferences
pages, click OK to save your changes.
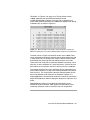
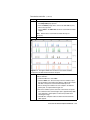
Running Matrix The precise spectral overlap between the five dyes is measured by
Samples analyzing DNA fragments labeled with each of the dyes (6-FAM, VIC,
NED, PET or LIZ dye) in separate injections on a capillary. These
dye-labeled DNA fragments are called matrix standard samples. See
Chapter 1 for a general description of multicomponent analysis.
The ABI PRISM ® GeneScan® Analysis Software v3.1 or higher analyzes
the data from each of these five samples and creates a matrix file. The
matrix file contains a table of numbers with five columns and five rows.
These numbers are normalized fluorescence intensities and represent
a mathematical description of the spectral overlap that is observed
between the five dyes (Figure 3-3 on page 3-13).
The rows in the matrix file table represent the virtual filters and the
columns represent the dye-labeled DNA fragments, indicated as
3-12 Protocol for 310 Genetic Analyzer with Mac OS
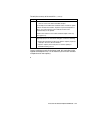
“Reactions” in Figure 3-4 on page 3-19. The top left-hand value,
1.0000, represents the normalized fluorescence of blue
(6-FAM-labeled) DNA fragments in the blue filter. It follows that all
matrix tables should have values of 1.0000 on the diagonal from top left
to bottom right, as shown in Figure 3-3.
Figure 3-3 Matrix file table, indicating the values obtained on a particular
ABI PRISM 310 System. The values obtained will be unique for each instrument.
The other values in Figure 3-3 should all be less than 1.0000. These
values represent the amount of spectral overlap observed for each dye
in each virtual filter. For example, the values in the first column reflect
quantitatively the amount of blue dye detected in each virtual filter.
These matrix file values will vary between different instruments, virtual
filter sets, and run conditions on a single instrument. A matrix file must
be made for each instrument and for a particular set of run conditions.
The appropriate matrix file can be applied to data on subsequent runs
on the same instrument, as long as the running conditions are constant
from run to run. This is because the spectral overlap between the five
dyes is reproducible under constant run conditions. However, it is
recommended that a new matrix be made once a month for use with the
AmpFl STR products or when changing lots of polymer, capillaries, and
buffer.
Multicomponent analysis is accomplished automatically by the
GeneScan Analysis software, which applies a mathematical matrix
calculation (using the values in the matrix file) to all sample data.
Protocol for 310 Genetic Analyzer with Mac OS 3-13
Filter Set G5 Module Files
Overview The ABI PRISM ® 310 Data Collection Software v2.1 collects light
intensities from five specific areas on the CCD camera, each area
corresponding to the emission wavelength of a particular fluorescent
dye. Each of these areas on the CCD camera is referred to as a “virtual”
filter since no physical filtering hardware (e.g., band pass glass filter) is
used.
The information that specifies the appropriate virtual filter settings for a
particular set of fluorescent dyes is contained in each approprate
ABI PRISM Data Collection Software module file.
The module file that must be installed and used for dye set DS-33
(6-FAM™, VIC™, NED™, PET™, LIZ™ dyes) on the ABI PRISM 310
Genetic Analyzer is the following:
Instrument
Configuration
Module File
ABI PRISM 310
POP-4™ polymer
with 1-mL syringe
GS STR POP4 (1 mL) G5
IMPORTANT Filter Set G5 module files must be installed on the instrument’s
computer before making a matrix file using the 6-FAM, VIC, NED, PET, and LIZ
matrix standards. Filter Set G5 module files must also be used on all
subsequent runs. Samples that are run on a capillary using Filter Set G5 must
be analyzed using a matrix file that was created using Filter Set G5.
3-14 Protocol for 310 Genetic Analyzer with Mac OS
Five-Dye Data Collection
Overview The ABI PRISM ® 310 Data Collection Software v2.1 enables collection
of five-dye data for DNA fragment analysis applications. This section
provides detailed information on sample sheet and injection lists.
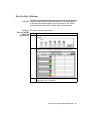
Creating a To create a five-dye sample sheet:
Five-Dye Sample
Step
Action
Sheet and
1
From the File menu, choose New. The Create new window
Injection List
appears.
2
Choose the icon corresponding to an appropriate GeneScan
Sample Sheet configuration. A Sample Sheet window appears.
3
Choose the 5 Dyes option from the drop-down menu in the
upper-right corner of the window.
Protocol for 310 Genetic Analyzer with Mac OS 3-15
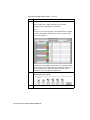
To create a five-dye sample sheet:
Step
4
(continued)
Action
In the five-dye Sample Sheet:
Enter sample name, sample information and comments.
Designate color for appropriate size standard.
Save.
Be sure to select the orange dye as the designated size standard
for all five-dye samples. Under Preferences, this feature can be
preset. See page 3-11.
Setting up five-dye samples requires the use of a five-dye sample
sheet. You may not set up both four-dye and five-dye samples in a
five-dye sample sheet. All four-dye samples must be set up
separately in a four-dye specific sample sheet.
5
To create a new injection list, choose New from the File menu. The
Create new window appears.
6
Choose the GeneScan™ Injection List icon.
3-16 Protocol for 310 Genetic Analyzer with Mac OS
To create a five-dye sample sheet:
Step
7
(continued)
Action
From the Sample Sheet drop-down menu (in the GeneScan
Injection List), import the appropriate sample sheet.
Note To access five-dye modules, you must first import a five-dye
sample sheet into the injection list.
8
After setting the appropriate injection parameters, save the injection
list.
9
To start the sequence of injections, click the Run option in the
Injection List window.
Protocol for 310 Genetic Analyzer with Mac OS 3-17
Making a Matrix File
Matrix Standards The matrix standards are supplied in the Matrix Standard Set DS-33
(6-FAM™, VIC™, NED™, PET™ and LIZ™) for use with the 310/377
system (P/N 4318159).
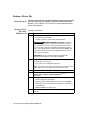
Making a Matrix To make the matrix file:
File on the
Step
Action
ABI PRISM 310
1
Combine 1 µL of each matrix standard with 25 µL of Hi-Di™
.
Formamide (P/N 4311320).
Prepare one tube for each matrix standard sample.
! WARNING CHEMICAL HAZARD. Formamide is harmful if
absorbed through the skin and may cause irritation to the eyes,
skin, and respiratory tract. It may cause damage to the central
nervous system and the male and female reproductive systems,
and is a possible birth defect hazard. Please read the MSDS, and
follow the handling instructions. Wear appropriate protective eye
wear, clothing, and gloves.
IMPORTANT Do not include the GeneScan-500 LIZ Size
Standard in the preparation of the matrix standards.
2
a. Denature the samples at 95 °C for 3 min.
b. Quick chill on ice for 3 min.
c. Place tubes in the appropriate sample tray.
Note Be careful not to carry-over any water on the outside of the
tubes. Water on the autosampler tray may promote arcing.
3
Launch the ABI PRISM 310 Collection application.
4
Under the File menu, select New and click the GeneScan Smpl
Sheet 48 Tube or GeneScan Smpl Sheet 96 Tube icon, as
appropriate.
5
a. Complete the sample sheet as described in the ABI PRISM 310
Genetic Analyzer User’s Manual.
b. Enter the sample names/numbers for each row in the Sample
Name column. This will identify which sample is in which tube of
the sample tray.
c. Close and Save the sample sheet.
6
Under the File menu, select New and click the GeneScan Injection
List icon.
3-18 Protocol for 310 Genetic Analyzer with Mac OS
To make the matrix file:
Step
7
(continued)
Action
a. In the Injection List, select the appropriate sample sheet from
the Sample Sheet pop-up menu.
b. From the Module pop-up menu, choose GS STR POP4 (1 mL)
G5 for every injection.
c. Choose None in the Matrix File column for each matrix standard
sample.
Note Review data of each matrix standard. Re-inject if
necessary.
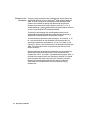
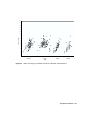
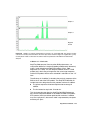
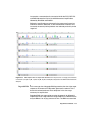
8
Click Run.
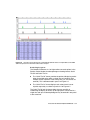
Figure 3-4 This figure exhibits the raw data of each matrix standard,
analyzed on the ABI PRISM 310 Genetic Analyzer.
9
When the injections are done, follow these steps in the GeneScan
Analysis Software:
a. Under the File menu, select New.
b. Click the Matrix icon. Select five dyes from the number of dyes
pop-up window. In the window that appears, indicate the sample
files that correspond to each matrix standard dye color.
c. Select starting scan numbers for each sample to exclude the
primer peak, as represented in Figure 3-4.
d. Select the number of points such that at least these five peaks
are contained in the scanned region (this is approximately 2500
scan data points). Avoid spikes or artifacts if possible when
selecting the range.
e. Click OK. The computer makes the matrix and the matrix file
table appears.
Protocol for 310 Genetic Analyzer with Mac OS 3-19
To make the matrix file:
Step
10
(continued)
Action
Save the matrix file in the ABI folder within the System folder.
To verify the accuracy of the matrix file:
Step
1
Action
Apply the new matrix file to the Matrix Standard Sample Files as
follows:
a. In the Analysis Control window, highlight the Sample File column
by clicking in the Sample File title row.
b. Under the Sample menu, select Install New Matrix.
c. Choose the new matrix file (located in the ABI folder within the
System folder) and click Open.
2
Analyze the matrix standard samples as follows:
a. Under the Settings menu, select Analysis Parameters, and verify
that the settings are correct.
b. In the Analysis Control window, select all five colors in each
sample row for all of the matrix standard samples.
c. Click the Analyze button.
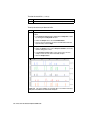
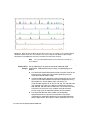
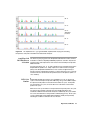
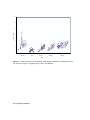
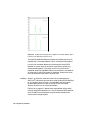
Figure 3-5 This figure exhibits the analyzed data of each matrix standard,
analyzed on the ABI PRISM 310 Genetic Analyzer.
3-20 Protocol for 310 Genetic Analyzer with Mac OS
To verify the accuracy of the matrix file:
Step
3
(continued)
Action
a. In the Results Control window, examine the results for all five
colors for each of the matrix standard samples.
For example, the 6-FAM matrix standard results should have peaks
for Blue. Evaluate the baseline. A pattern of pronounced peaks or
dips in any of the other four colors indicates that the color
separation may not be optimal.
Examine the results for each matrix standard sample in this way
(see Figure 3-5).
4
If this verification test fails, then the capillary may not have been
aligned properly in the instrument during the run. Do the following:
a. Repeat the experiment, making sure that the capillary is placed
carefully in the laser detection window.
b. Tape the capillary to the heat plate so that the capillary is
immobilized during the run.
Once a satisfactory matrix file has been made, this matrix file can be
applied to subsequent runs. It is not necessary to run matrix standard
samples for each new capillary.
Protocol for 310 Genetic Analyzer with Mac OS 3-21
Running DNA Samples
Preparing Samples To prepare the samples:
and AmpFl STR
Step
Action
Identifiler Allelic
1
Combine the necessary amount of Hi-Di™ Formamide and
Ladder
GeneScan™-500 LIZ™ Size Standard (P/N 4322682) in a single
microcentrifuge tube as shown:
(Number of samples + 2) × 24.5 µL Hi-Di Formamide
(Number of samples + 2) × 0.5 µL GeneScan-500 LIZ Size
Standard
If you are using a multi-channel pipettor or processing many
samples, you may want to prepare additional master mix.
! WARNING CHEMICAL HAZARD. Formamide is harmful if
absorbed through the skin and may cause irritation to the eyes,
skin, and respiratory tract. It may cause damage to the central
nervous system and the male and female reproductive systems,
and is a possible birth defect hazard. Please read the MSDS, and
follow the handling instructions. Wear appropriate protective eye
wear, clothing, and gloves.
Be sure to include at least one injection of AmpFl STR®
Identifiler™ Allelic Ladder per run in the calculations.
2
a. Vortex the tube to mix.
b. Spin the tube briefly in a microcentrifuge.
3
a. Label tubes as appropriate.
b. Aliquot 25 µL of Hi-Di Formamide/GeneScan-500 LIZ solution
into 0.2-mL or 0.5-mL Genetic Analyzer sample tubes.
Note To pipet the Hi-Di Formamide/size standard solution, we
recommend using a repeating pipettor.
4
Add 1.5 µL of PCR product or AmpFlSTR Identifiler Allelic Ladder
per tube.
Mix by pipetting up and down.
5
Seal each tube with a septum.
6
Vortex the sample tray and spin briefly in a microcentrifuge.
Note
Ensure that there are no bubbles.
7
Denature each sample for 3 min at 95 °C.
8
Chill tubes for at least 3 min on ice.
Note Be careful not to carry-over any water on the outside of the
tubes. Water on the autosampler tray may promote arcing.
3-22 Protocol for 310 Genetic Analyzer with Mac OS
Loading Samples To load samples:
Step
Action
1
Open the instrument door and press the Tray button to present the
autosampler.
2
Place a 48-well or 96-well sample tray on the autosampler. For a
48-well autosampler tray, tube #1 will go into sample tray position
A1, tube #2 into sample tray position A3, etc. For a 96-well
autosampler tray, tube #1 will go into sample tray position A1, tube
#2 into sample tray position A2, etc.
3
Press the Tray button on the instrument to retract the autosampler.
4
Close the instrument door.
Protocol for 310 Genetic Analyzer with Mac OS 3-23
Sample To run the samples:
Electrophoresis
Step
Action
1
If not already open, launch the ABI PRISM 310 Data Collection
Software v2.1.
2
From the File menu, select New and click the appropriate
GeneScan Smpl Sheet icon.
Note The 310 Genetic Analyzer Data Collection Software v 2.1
must be installed for use with the AmpFl STR Identifiler PCR
Amplification Kit.
3
Complete the sample sheet. The sample sheet can be prepared at
any time before the preparation of samples and saved in the
Sample Sheet folder.
a. Select 5-dyes from the drop-down menu.
b. Enter sample names/numbers for each injection in the Sample
Name column. This will later indicate which sample is in which
tube of the sample tray.
c. Enter the sample description for each row in the Sample Info
column (for Blue, Green, Yellow and Red for each sample). This
is necessary for the AmpFl STR® Identifiler™ Template File to
build tables containing the genotypes for each sample.
Type the word Ladder for the Blue, Green, Yellow and Red rows
for the AmpFl STR® Identifiler™ Allelic Ladder injection.
Note
Software requires the word “Ladder.” See page 5-10.
Note
Alternatively,
a. Select 5-dyes from the drop-down menu.
b. Enter the sample names and numbers for each injection in the
Sample Name column.
c. Using copy feature under Edit menu, copy all sample names at
one time by highlighting the “Sample Name” header and paste
by highlighting the “Sample Info” header. The sample name will
appear in the blue, green, yellow, red and orange Sample Info
column for each sample.
4
From the File menu, select New and click on the GeneScan
Injection List icon.
5
Choose the appropriate sample sheet from the Sample Sheet
pop-up menu (at the top left of the Injection List window).
3-24 Protocol for 310 Genetic Analyzer with Mac OS
To run the samples:
Step
6
(continued)
Action
From the Module pop-up menu, choose Module
GS STR POP4 (1 mL) G5 for every injection.
a. Click the arrow in the Module column for the first
sample/injection to view the pop-up menu and choose the
GS STR POP4 (1 mL) G5 module file.
b. Select the entire Module column by clicking the Module column
heading and choosing Fill Down (from the Edit menu).
Note This function will not need to be performed if the
preferences were set as described on page 4-12.
7
From the Matrix file pop-up menu, choose the appropriate matrix
file for every injection.
a. Click the arrow in the Matrix column for the first sample/injection
to view the pop-up menu and choose the appropriate matrix file.
Select the entire Matrix column by clicking the Matrix column
heading and choosing Fill Down (from the Edit menu).
IMPORTANT The matrix file must be one that was made using
the 6-FAM, VIC, NED, PET and LIZ matrix standards and Filter Set
G5 module. Furthermore, if you wish to autoanalyze, a copy of the
matrix file must be placed in the ABI folder located in the System
Folder.
8
Click the Run button.
Note If you have not preheated the heat plate, the module has an
initial step in which the plate is heated to 60 °C before running the
first sample. This step takes up to 30 min. Once the plate reaches
60 °C, the run will begin.
Protocol for 310 Genetic Analyzer with Mac OS 3-25
Setting Up Software Parameters
Setting the Perform the following steps in GeneScan Software v3.1 or higher.
Analysis
To set the analysis parameters:
Parameters
Step
Action
1
Launch the GeneScan Software v 3.1.
2
From the Settings menu, select Analysis Parameters.
Note A more detailed discussion can be found for each of the six
“Analysis Parameters” in the GeneScan Analysis 3.1 User’s
Manual.
3
Fill in the dialog box.
a. Analysis Range:
– Choose This Range (Data Points) radio button.
– Enter Start and Stop data point numbers in the entry fields.
The Start data point should be a selected data point just before
the first peak of interest, the 75 bp size standard peak. At a
minimum, the Stop data point should be a selected data point
just after the last peak of interest, the 450 bp size standard
peak.
– Look at the raw data and enter the values that will be
appropriate for all sample files in the project. These data
points will affect what data is displayed in the results display.
b. Data Processing:
– The Baseline and the MultiComponent check boxes should
be selected.
– Choose a Smooth Option. Smooth Options can affect peak
height and peak definition.
– The “Light smoothing option” is recommended for use with the
AmpFlSTR products on the Macintosh® computer.
c. Peak Detection:
– Choose a Peak Amplitude Threshold (PAT) for each dye color.
– Use the active scroll bar to input the PATs for each of the five
colors.
– After analysis, the GeneScan table will contain data for all
peaks with a height above that specified by the PAT.
3-26 Protocol for 310 Genetic Analyzer with Mac OS
To set the analysis parameters:
Step
(continued)
Action
Note We suggest that you determine the PATs appropriate for
your analysis. Sensitivity experiments should be conducted in your
laboratory with each instrument to evaluate the PATs used for
analysis.
– The Min Peak Half Width for use with the AmpFl STR products
is 3 Pts.
d. Size Call Range: Choose the This Range (Base Pairs) radio
button and enter the value of 75 for Min and 450 for Max.
e. Size Calling Method: Choose the Local Southern Method radio
button for sizing of the AmpFlSTR products. This method
determines the sizes of fragments by using the reciprocal
relationship between fragment length and mobility.
f. Split Peak Correction: Choose the None radio button; no
correction is needed for use with the AmpFl STR products.
4
Click OK when done.
5
Assign a size standard:
a. Click the arrow in the Size Standard column for a sample file to
view the pop-up menu and select Define New.
– For more information on defining a size standard, refer to the
GeneScan Analysis 3.1 User’s Manual.
– Do not assign a size for the 250-bp peak for data generated on
the ABI PRISM ® 310 Genetic Analyzer (i.e., assign a size of
zero). This peak can be used as an indicator of precision
within a run. Twelve size standard peaks should be viewed at
this step, as shown below.
– Save the size standard for this sample in the GS Standards
Folder within the ABI PRISM GeneScan Version 3.1 Software
folder.
b. To apply this standard to all injections, choose the appropriate
standard in the Size Standard column header (above sample 1)
in the Analysis Control window.
Protocol for 310 Genetic Analyzer with Mac OS 3-27
To set the analysis parameters:
Step
6
(continued)
Action
Analyze sample files:
a. Highlight the blue, green, yellow, red and orange columns.
Note Confirm that the orange box has been indicated as the
standard (a diamond symbol should appear in all orange boxes
where a size standard is included with the sample files). If the
diamond symbol is not in the orange boxes,
-mouse click will
place a diamond in the box.
b. Click the Analyze button.
7
After the analysis is complete, confirm that the sizes for the peaks
in the GeneScan™-500 LIZ™ Size Standard have been correctly
assigned.
a. Open Results Control (from the Window menu) and examine
the orange GeneScan-500 LIZ Size Standard peaks in
overlapping groups of 16 samples (Quick Tile Off). Be sure to
use the Align By Size option under the View menu.
b. While the samples are tiled, check the 250-bp peaks (sized as
approximately 246 bp) in the enlarged view window. Remember
that this peak was not defined in the size standard. The tiled
250-bp peaks should size consistently, i.e., should all overlap. In
a typical run, the 250-bp peaks all fall within a size window of
approximately 1 bp. Temperature fluctuations in the laboratory
may cause variations > 1 bp.
Note Laboratory temperature variations can cause size shifts. If
the temperature of the laboratory varies, try injecting the
AmpFlSTR Identifiler Allelic Ladder approximately every 10
injections, or 5 hours.
c. Scroll through the tables to verify correct GeneScan-500 LIZ
peak assignments.
d. Check the GeneScan-500 LIZ Size Standard peaks in the
remaining samples, taking note of which samples (if any) have
incorrect peak assignments.
8
If the size standard peak assignments are incorrect for one
injection, define a new size standard for that sample using the
peaks in that injection.
To do so, select the Define New option in the Size Standard
pop-up menu for that sample.
9
Re-analyze any incorrectly sized samples (select the blue, green,
yellow, red and orange boxes) using the newly defined
GeneScan-500 LIZ Size Standard file.
This creates a new standard file for each of these samples,
replacing the previous analysis results for those samples only.
3-28 Protocol for 310 Genetic Analyzer with Mac OS
To set the analysis parameters:
Step
(continued)
Action
10
Confirm that the GeneScan-500 LIZ Size Standard peaks are now
correctly assigned in the re-analyzed samples.
11
View AmpFl STR Identifiler kit results (using the Results Control
window).
Refer to the GeneScan Analysis 3.1 User’s Manual for printing
options.
Protocol for 310 Genetic Analyzer with Mac OS 3-29
GeneScan Software Results
GeneScan Analysis After the sample files have been analyzed, the Results Control window
Software is used to display the results from each lane of a gel or each injection
into a capillary. The Results Control window displays the newly
analyzed sample files and allows the user to specify the format of the
results. Selecting both the Electropherogram and Tabular Data icons is
recommended for reviewing the results. For more information on
displaying the results, refer to the GeneScan Analysis Software v3.1
User’s Manual (P/N 903565).
Information
Provided in the
Electropherogram
and Table
Both the electropherogram and the tabular data can be displayed, see
Figure 3-6 on page 3-31.
The electropherogram is a chromatographic display with fluorescence
intensity indicated as relative fluorescence units (RFU) on the y-axis.
After the internal lane size standard has been defined and applied, the
electropherogram can be displayed with the base pair size on the
x-axis.
Peaks of all heights within the Analysis Range specified in the Analysis
Parameters are displayed on the electropherogram, but those peaks
below the Peak Amplitude Threshold (minimum peak height) that are
defined in the Analysis Parameters will not be listed in the tabular data.
The columns in the table list the following:
Column 1 lists the Dye/Sample and Peak (e.g., “4B, 1” indicates the
first blue peak in project sample 4).
Column 2 lists the time it took the dye-labeled fragment to reach the
detector
Column 3 lists the base pair size of the peak, as calculated using
the GeneScan™-500 LIZ™ Size Standard curve.
Column 4 lists the height in RFU of the peak.
Column 6 lists the data point (scan number) of the dye labeled
fragment at its maximum peak height; the data point correlates with
the number of laser scans (or data points collected) from the
beginning of the run until the time that the peak maximum is
detected.
Column 5 lists the relative peak area, which is the integral of the
RFU times the data point (scan number). This value depends on
the velocity of the dye labeled fragment as it passes the detector.
3-30 Protocol for 310 Genetic Analyzer with Mac OS
Figure 3-6 GeneScan electropherogram of AmpFlSTR Identifiler alleles in AmpFl STR Control DNA
9947A analyzed on the ABI PRISM 310 Genetic Analyzer
Results Display Options
The GeneScan Software v3.1 or higher offers two main options in the
Results Control window for electropherogram viewing formats: Quick
Tile Off and Quick Tile On.
The “Quick Tile Off” format provides the option of displaying results
either for multiple colors within a single lane or injection or from
multiple lanes or injections in the same panel, (i.e., the results are
overlaid). This is demonstrated in panel 1 of Figure 3-7.
The “Quick Tile On” format displays each color of each lane or
injection separately, as shown in panels 2–5 of Figure 3-7.
The Quick Tile Off and On feature offers the user versatility in
customizing the display of results. Up to eight panels can be tiled at a
single time and up to 16 electropherogram may be overlaid in one panel
at the same time.
Protocol for 310 Genetic Analyzer with Mac OS 3-31
A
B
C
D
E
F
Figure 3-7 Quick Tile Off and Quick Tile On options. Panel A is an example of one sample displayed
with Quick Tile Off. Panels B–F are examples of the same sample file with Quick Tile On using the
AmpFlSTR Control DNA 9947 analyzed on the ABI PRISM 310 Genetic Analyzer
Note
For a more detailed description see the GeneScan Software v3.1
User’s Manual.
Standards for For the Identifiler kit, the panel of standards needed for PCR
Samples amplification, PCR product base pair sizing, and genotyping are as
follows:
The AmpFlSTR Control DNA 9947A provides a positive control for the
efficiency of the amplification step and STR genotyping using the
AmpFlSTR Identifiler Allelic Ladder.
GeneScan-500 LIZ Size Standard is used for obtaining base pair sizing
results. The GeneScan-500 LIZ Size Standard is designed for sizing
DNA fragments in the 35–500 bp range, and contains 16
single-stranded fragments of 35, 50, 75, 100, 139, 150, 160, 200, 250
(not assigned when used on the ABI PRISM 310 Genetic Analyzer),
300, 340, 350, 400, 450, 490, and 500 bases. This standard has been
evaluated as an internal lane size standard and yields extremely
precise sizing results of AmpFlSTR Identifiler kit PCR products.
The AmpFlSTR Identifiler Allelic Ladder was developed by
Applied Biosystems for accurate characterization of the alleles
amplified by the AmpFlSTR Identifiler kit. The AmpFlSTR Identifiler
Allelic Ladder contains the majority of alleles reported for the 15 loci.
3-32 Protocol for 310 Genetic Analyzer with Mac OS
Off-Scale Data
Overview If too much sample DNA is added to the PCR reaction mixtures, the
fluorescence intensity from the PCR products may exceed the linear
dynamic range for detection by the instrument. This is referred to as
“off-scale” data. Multicomponent analysis cannot be performed
accurately on data that is off-scale. Samples with off-scale peaks will
exhibit raised baselines and/or excessive “pull-up” of one or more
colors under the off-scale peaks.
Analyzed data from off-scale peaks should not be used for quantitative
comparisons. For example, the stutter peak that corresponds to an
off-scale main peak is likely to be overestimated.
Off-Scale Data on To determine if data is off-scale on the ABI PRISM ® 310 Genetic
the ABI PRISM 310 Analyzer:
Step
1
Action
In the GeneScan Analysis Software, highlight the sample file row
for the questionable sample in the Analysis Control window.
Alternatively, under View, select Show Offscale Regions to
highlight off-scale data with a red bar. The width of the red bar
corresponds to the amount of data that is off-scale.
2
Under the Sample menu, choose Raw Data.
3
Examine the fluorescence intensity for the raw data peaks.
Any peaks that are greater than 8191 relative fluorescence units
(RFU) are off-scale.
4
Re-amplify the sample, if necessary.
Note DNA samples with off-scale data should be diluted and
re-amplified.
Protocol for 310 Genetic Analyzer with Mac OS 3-33
Shutting Down the Instrument
Ending the Run If the instrument is not going to be in use for 3 or more consecutive
days, it is recommended that the instrument be cleaned and shut down.
To shut down the instrument:
Step
Action
1
Remove and clean the syringe and block as previously described.
2
Discard unused polymer in the proper waste container.
Note Do not put unused polymer back into the bottle. Polymer in
the syringe decomposes over time at room temperature.
3
In the Manual Control window, select Autosampler Home X, Y
Axis and click Execute.
4
Select Autosampler Home Z Axis and click Execute.
5
Turn off the instrument.
3-34 Protocol for 310 Genetic Analyzer with Mac OS
Dedicated Equipment and Supplies
Equipment The following are equipment and supplies necessary or recommended
Required for running AmpFl STR Identifiler kit data on the ABI PRISM 310 Genetic
Analyzer.
Note Amplified DNA, equipment, and supplies used to handle amplified DNA
should not be taken out of the amplified DNA work area. Samples that have not
yet been amplified should never come into contact with these supplies and
equipment.
Equipment Required:
Equipment
ABI PRISM 310 Genetic Analyzer
ABI PRISM 310 Genetic Analyzer Accessories:
ABI PRISM 310 Genetic Analyzer Capillary, Lt
= 47 cm, Ld = 36 cm, i.d. = 50 µm
(P/N 402839), labeled with a green mark
ABI PRISM 310 Genetic Analyzer Vials, 4.0
mL (P/N 401955)
ABI PRISM 310 Genetic Analyzer 0.5-mL
Sample Tubes (P/N 401957)
ABI PRISM 310 Genetic Analyzer Septa for
0.5-mL Sample Tubes (P/N 401956)
Syringe, Kloehn 1.0-mL (P/N 4304471)
Benchkote absorbent protector sheets
Flush-cutting wire cutter (P/N T-6157)
Freezer, –15 to –25 °C, non-frost-free
Gloves, disposable, powder-free
Glassware
Ice bucket
Kim Wipes
Lab coat
Microcentrifuge tubes, 1.5-mL
Microtube racks
Nalgene filter apparatus, 150–mL, 0.2-µm CN
filter
Permanent ink pen
Pipette bulb
Pipettes, serological
Protocol for 310 Genetic Analyzer with Mac OS 3-35
Equipment Required:
(continued)
Equipment
Pipette tips, sterile, disposable hydrophobic
filter-plugged
Pipettors, adjustable, 1–10 µL, 2–20 µL,
20–200 µL, and 200–1000 µL
Refrigerator
Repeat pipettor and Combitips that dispense
25–125 µL (optional)
Sink
Syringe, 35 cc (optional)
Tape
Thermal cycler
Tube, 50 mL Falcon
Tube decapper, autoclavable
Reagents Required
Reagents Required:
Reagents
ABI PRISM 310 10X Genetic Analyzer Buffer with
EDTA (P/N 402824)
AG501 X8 ion exchange resin (Bio-Rad)
Deionized water, PCR grade
Hi-Di™ Formamide (P/N 4311320)
GeneScan™-500 LIZ™ Size Standard
(P/N 4322682)
Matrix Standard Set DS-33 [ 6-FAM, VIC, NED,
PET, LIZ] for use with the 310/377 system
(P/N 4318159)
Performance Optimized Polymer 4 (POP-4),
(P/N 402838)
3-36 Protocol for 310 Genetic Analyzer with Mac OS
Software and User
Documentation Software and User Documentation:
Required Software and User Documentation
ABI PRISM 310 Collection Software, version 2.1
or higher
ABI PRISM 310 Genetic Analyzer User’s Manual
(P/N 903565)
ABI PRISM 310 Module GS STR POP4 (1 mL) G5
GeneScan Software v3.1 or higher
Protocol for 310 Genetic Analyzer with Mac OS 3-37
Experiments and
Results
4
Overview
4
About This This chapter describes various experiments performed and results
Chapter obtained using the AmpFl STR® Identifiler™ PCR Amplification Kit.
In This Chapter This chapter contains the following topics:
Topic
See Page
Overview
4-1
Experiments Performed Using the AmpFl STR Identifiler PCR
Amplification Kit
4-2
Developmental Validation
4-3
Accuracy, Precision, and Reproducibility
4-6
Extra Peaks in the Electropherogram
4-19
Characterization of Loci
4-28
Species Specificity
4-30
Sensitivity
4-32
Stability
4-34
Mixture Studies
4-39
Data Interpretation
4-43
Population Data
4-44
Mutation Rate
4-55
Probability of Identity
4-56
Probability of Paternity Exclusion
4-57
Experiments and Results 4-1
Experiments Performed Using the AmpFl STR Identifiler PCR
Amplification Kit
Importance of Validation of a DNA typing procedure for human identification
Validation applications is an evaluation of the procedure’s efficiency, reliability, and
performance characteristics. By challenging the procedure with
samples commonly encountered in forensic and parentage
laboratories, the validation process uncovers attributes and limitations,
which are critical for sound data interpretation in casework (Sparkes,
Kimpton, Gilbard, et al., 1996; Sparkes, Kimpton, et al., 1996; Wallin et
al., 1998).
Experiments Experiments to evaluate the performance of AmpFl STR Identifiler PCR
Amplification Kit were performed at Applied Biosystems. Some of these
experiments were performed according to the DNA Advisory Board
(DAB) Quality Assurance Standards, effective October 1, 1998 (DNA
Advisory Board, 1998). The DNA Advisory Board issued quality
assurance standards for forensic DNA testing laboratories.
These DAB standards describe the quality assurance requirements that
a laboratory should follow to ensure the quality and integrity of the data
and competency of the laboratory. DAB defines a laboratory as a facility
in which forensic DNA testing is performed.
Based on these standards, Applied Biosystems has conducted
experiments which comply with Standards 8.1.1 and 8.1.2 and its
associated subsections. Whereas this DNA methodology is not novel,
Standard 8.1.2 and its related subsections have been addressed (Holt
et al., 2001 and Wallin et al., 2001). This chapter will discuss many of
the experiments performed by Applied Biosystems and examples of
results obtained. Conditions were chosen which produced maximum
PCR product yield and a window in which reproducible performance
characteristics were met. These experiments while not exhaustive are
appropriate for a manufacturer, in our opinion. Each laboratory using
the AmpFl STR Identifiler PCR Amplification kit should perform
appropriate validation studies.
4-2 Experiments and Results
Developmental Validation
8.1.1 “Developmental validation that is conducted shall be appropriately
Developmental documented.” (DNA Advisory Board, 1998).
Validation Critical reagent concentrations and reaction conditions (e.g., thermal
cycling parameters, AmpliTaq Gold® DNA polymerase activation, cycle
number) to produce reliable, locus-specific amplification and
appropriate sensitivity have been determined.
PCR Components The concentration of each component of the AmpFl STR Identifiler kit
was examined. The PCR components are Tris-HCl (pH 8.3), KCl,
dNTPs, primers, AmpliTaq Gold DNA Polymerase, MgCl2, bovine
serum albumin, and sodium azide. The concentration for a particular
component was established to be in the window that meets the
reproducible performance characteristics of specificity and sensitivity.
1.0 mM
1.15 mM
1.25 mM
Standard
Concentration
1.35 mM
1.50 mM
Figure 4-1 A 1 ng amplification of genomic DNA varying the magnesium chloride concentration,
analyzed on the ABI PRISM ® 310 Genetic Analyzer
Experiments and Results 4-3
Thermal Cycler Thermal cycling parameters were established for amplification of the
Parameters AmpFl STR Identifiler kit in the GeneAmp® PCR Systems 9600 and
9700. Thermal cycling times and temperatures of GeneAmp PCR
systems were verified. Annealing and denaturation temperature
windows were tested around each stipend to verify that a ±1.5 °C
window produced a specific PCR product with the desired sensitivity of
at least 1 ng of AmpFl STR® Control DNA 9947A.
The effects of denaturation and annealing temperatures on the
amplification of AmpFl STR Identifiler kit loci were examined using
AmpFl STR Control DNA 9947A and two DNA samples.
The denaturation temperatures tested were 92.5, 94, and 95.5 °C, all
for 1-minute hold times on the GeneAmp PCR System 9700. The
annealing temperatures tested were 55, 57, 59, 61, and 63 °C (see
Figure 4-2), also for 1-minute hold times in the GeneAmp PCR System
9700. The PCR products were analyzed using the ABI PRISM 310
Genetic Analyzer.
Neither preferential nor differential amplification was observed in the
denaturation temperature experiments. Of the tested annealing
temperatures, 55, 57, 59, and 61 °C produced robust profiles. At 63 °C,
the yield of the majority of loci was significantly reduced. This should
pose no problem with routine thermal cycler calibration and when
following the recommended amplification protocol. Preferential
amplification was not observed at any of the tested annealing
temperatures.
4-4 Experiments and Results
55 °C
57 °C
59 °C
Standard
Protocol
61 °C
63 °C
Figure 4-2 An amplification of 1 ng of genomic DNA, amplified while varying the annealing
temperature, analyzed on the ABI PRISM 310 Genetic Analyzer
AmpliTaq Gold The thermal cycler program for the AmpFl STR Identifiler kit includes an initial
DNA Polymerase incubation to allow for AmpliTaq Gold DNA polymerase activation. Polymerase
Activation activation times and temperatures were tested in the GeneAmp PCR Systems
9600 and 9700.
Five activation times (5, 8, 11, 14 and 17 minutes) were tested previously for the
AmpFlSTR kits (Wallin et al., 1998). A plateau in relative fluorescent signal
(RFU) of the AmpFlSTR Identifiler kit loci was reached at approximately 8
minutes and was maintained through the 17–minute time point. The 11–minute
activation time was determined to be optimal based on this plateau (within a ±
>25% window).
PCR Cycle AmpFlSTR Identifiler kit reactions were amplified for 27, 28, 29, 30, and 31
Number cycles on the GeneAmp PCR System 9700 using 1.0 ng of three DNA samples.
As expected, PCR product increased with the number of cycles. A full profile
was generated at 27 cycles; off-scale data were collected for several allele
peaks at 31 cycles.
While none of the cycle numbers tested produced nonspecific peaks, 28 cycles
was found to give optimal sensitivity when the amplified products were
examined on ABI PRISM 310 Genetic Analyzers. Additionally, the cycle number
was set to avoid detection of low quantities of DNA (20 pg or less). At 28 cycles,
1.0 ng of AmpFlSTR Control DNA 9947A amplifies reliably and specifically
following the conditions outlined in this user manual.
Experiments and Results 4-5
Accuracy, Precision, and Reproducibility
8.1.2 Accuracy “Novel forensic DNA methodologies shall undergo developmental validation to
ensure the accuracy, precision and reproducibility of the procedure.” (DAB,
1998).
Laser-induced fluorescence detection systems of length polymorphism
at short tandem repeat loci is not a novel methodology (Holt et al., 2001
and Wallin et al., 2001). However, accuracy and reproducibility of
AmpFl STR Identifiler kit profiles have been determined from various
sample types.
Figure 4-3 illustrates the size differences that are typically observed
between sample alleles and allelic ladder alleles on the ABI PRISM 310
Genetic Analyzer with POP-4™ polymer. The x-axis in Figure 4-5
represents the nominal base pair sizes for the AmpFl STR Identifiler
Allelic Ladder, and the dashed lines parallel to the x-axis represent the
±0.5-bp windows. The y-axis is the deviation of each sample allele size
from the corresponding allelic ladder allele size. The data include a total
of 2269 alleles from 70 population database samples. All sample alleles
are within 0.5 bp of a corresponding allele in an allelic ladder.
Figure 4-3 Size deviation of 70 samples and two allelic ladders from one injection of allelic ladder on a
single ABI PRISM 310 Genetic Analyzer run
4-6 Experiments and Results
Experiments and Results 4-7
Precision and Size Sizing precision allows for determining accurate and reliable genotypes.
Windows Sizing precision was measured on the ABI PRISM 310 Genetic Analyzer.
As indicated in the Automated Genotyping section, the recommended
method for genotyping is to employ a ±0.5-bp “window” around the size
obtained for each allele in the AmpFl STR Identifiler Allelic Ladder. A
±0.5-bp window allows for the detection and correct assignment of
alleles. An allele that sizes only one base pair different from an allele in
the allelic ladder will not be incorrectly typed and will be identified as
off-ladder. Any sample allele that sizes outside a window could be
either of the following:
an “off-ladder” allele, i.e., an allele of a size that is not represented
in the AmpFl STR Identifiler Allelic Ladder
an allele that does correspond to an allelic ladder allele, but whose
size is just outside a window because of measurement error
The measurement error inherent in any sizing method can be defined
by the degree of precision in sizing an allele multiple times. Precision is
measured by calculating the standard deviation in the size values
obtained for an allele that is run in several lanes of one gel or in several
injections in one capillary run.
Table 4-1 on page 4-10 indicates typical precision results obtained from
the seven injections of the AmpFl STR Identifiler Allelic Ladder
analyzed on the ABI PRISM 310 Genetic Analyzer (47-cm capillary and
POP-4 polymer). The internal lane size standard used was
GeneScan-500 LIZ. These results were obtained within a set of
injections on a single capillary.
As indicated above, sample alleles may occasionally size outside of the
±0.5-bp window for a respective allelic ladder allele because of
measurement error. The frequency of such an occurrence is lowest in
detection systems having the smallest standard deviations in sizing.
Figure 4-3 on page 4-6 illustrates the tight clustering of allele sizes
obtained on the ABI PRISM 310 Genetic Analyzer, where the standard
deviation in sizing is typically less than 0.15 bp. The instance of a
sample allele sizing outside of the ±0.5-bp window because of
measurement error is relatively rare when the standard deviation in
sizing is approximately 0.15 bp or less (Smith, 1995).
For sample alleles that do not size within a ±0.5-bp window, the PCR
product must be rerun to distinguish between a true off-ladder allele vs.
measurement error of a sample allele that corresponds with an allele in
the allelic ladder. Repeat analysis, when necessary, provides an added
level of confidence to the final allele assignment. Genotyper® software
automatically flags sample alleles that do not size within the prescribed
window around an allelic ladder allele.
4-8 Experiments and Results
It is important to note that while the precision within a gel or set of
capillary injections is very good, the determined allele sizes vary
between platforms. Cross-platform sizing differences arise from a
number of parameters, including type and concentration of polymer
mixture, run temperature, and electrophoresis conditions. Variations in
sizing can also be found between runs on the same instrument and
between runs on different instruments because of these parameters.
We strongly recommend that the allele sizes obtained be compared to
the sizes obtained for known alleles in the AmpFl STR Identifiler Allelic
Ladder from the same run and then converted to genotypes (as
described in the Automated Genotyping section) For more information
on precision and genotyping, see Lazaruk et al., 1998 and Mansfield et
al.,1998.
1187 population database DNA samples have been typed using the
AmpFl STR Identifiler PCR Amplification Kit( see “About the Primers”
on page 1-2). These samples have been previously genotyped with
concordant results of the same loci, using other AmpFl STR kits.
Experiments and Results 4-9
T
Table 4-1 Example of precision results of seven injections of the
AmpFl STR Identifiler Allelic Ladder:
ABI PRISM 310 Genetic Analyzer
Allele
Mean
S.D.
X
107.02
0.04
Y
112.61
0.02
6
304.69
0.08
7
309.01
0.10
8
313.30
0.10
9
317.55
0.11
10
321.97
0.12
11
325.86
0.11
12
329.97
0.13
13
334.00
0.10
14
338.04
0.11
15
341.84
0.08
15
307.30
0.11
16
311.65
0.11
17
315.91
0.12
18
320.16
0.12
19
324.34
0.12
20
328.44
0.08
21
332.58
0.11
22
336.62
0.09
23
340.57
0.11
24
344.18
0.07
25
347.78
0.07
26
351.39
0.07
27
355.08
0.07
28
358.77
0.05
Amelogenin
CSF1PO
D2S1338
4-10 Experiments and Results
Table 4-1 Example of precision results of seven injections of the
AmpFl STR Identifiler Allelic Ladder: (continued)
ABI PRISM 310 Genetic Analyzer
Allele
Mean
S.D.
12
111.96
0.06
13
116.04
0.04
14
119.99
0.04
15
123.89
0.02
16
128.06
0.05
17
132.24
0.05
18
136.30
0.06
19
140.43
0.03
7
134.14
0.05
8
138.21
0.04
9
142.56
0.04
10
147.02
0.06
11
151.31
0.01
12
155.63
0.05
13
159.81
0.06
14
164.04
0.07
15
167.95
0.05
16
172.09
0.05
6
255.15
0.08
7
259.21
0.07
8
263.24
0.07
9
267.26
0.09
10
271.32
0.08
11
275.35
0.06
12
279.42
0.07
13
283.42
0.06
14
287.48
0.10
15
291.58
0.06
D3S1358
D5S818
D7S820
Experiments and Results 4-11
Table 4-1 Example of precision results of seven injections of the
AmpFl STR Identifiler Allelic Ladder: (continued)
ABI PRISM 310 Genetic Analyzer
Allele
Mean
S.D.
123.29
0.07
D8S1179
8
9
127.32
0.05
10
131.41
0.05
11
135.49
0.04
12
139.73
0.04
13
144.25
0.03
14
148.71
0.06
15
153.16
0.07
16
157.51
0.07
17
161.72
0.05
18
165.84
0.07
19
169.92
0.05
8
216.87
0.05
9
220.83
0.05
10
224.77
0.07
11
228.88
0.07
12
232.81
0.05
13
236.68
0.07
14
240.69
0.06
15
244.68
0.09
5
252.37
0.08
8
264.30
0.07
9
268.32
0.08
10
272.32
0.06
11
276.37
0.07
12
280.37
0.09
13
284.34
0.07
14
288.44
0.09
15
292.51
0.07
D13S317
D16S539
4-12 Experiments and Results
Table 4-1 Example of precision results of seven injections of the
AmpFl STR Identifiler Allelic Ladder: (continued)
ABI PRISM 310 Genetic Analyzer
Allele
Mean
S.D.
262.07
0.08
D18S51
7
9
270.22
0.06
10
274.34
0.09
10.2
276.36
0.06
11
278.41
0.08
12
282.49
0.05
13
286.57
0.06
13.2
288.63
0.05
14
290.77
0.04
14.2
292.78
0.05
15
294.91
0.07
16
299.07
0.06
17
303.50
0.07
18
307.94
0.09
19
312.40
0.11
20
316.71
0.09
21
320.99
0.14
22
325.24
0.11
23
329.40
0.11
24
333.54
0.15
25
337.67
0.11
26
341.56
0.09
27
345.24
0.08
Experiments and Results 4-13
Table 4-1 Example of precision results of seven injections of the
AmpFl STR Identifiler Allelic Ladder: (continued)
ABI PRISM 310 Genetic Analyzer
Allele
Mean
S.D.
9
101.99
0.05
10
105.88
0.05
11
109.78
0.04
12
113.64
0.02
12.2
115.61
0.02
D19S433
4-14 Experiments and Results
13
117.56
0.03
13.2
119.55
0.02
14
121.46
0.03
14.2
123.47
0.02
15
125.45
0.05
15.2
127.43
0.05
16
129.44
0.05
16.2
131.46
0.05
17
133.42
0.03
17.2
135.44
0.06
Table 4-1 Example of precision results of seven injections of the
AmpFl STR Identifiler Allelic Ladder: (continued)
ABI PRISM 310 Genetic Analyzer
Allele
Mean
S.D.
24
184.86
0.04
24.2
186.82
0.02
25
188.77
0.03
26
192.69
0.05
27
196.56
0.04
D21S11
28
200.41
0.05
28.2
202.36
0.05
29
204.32
0.03
29.2
206.31
0.02
30
208.29
0.07
30.2
210.24
0.05
31
212.23
0.05
31.2
214.14
0.06
32
216.14
0.04
32.2
218.10
0.04
33
220.14
0.05
33.2
222.07
0.04
34
224.10
0.07
34.2
226.02
0.06
35
228.07
0.06
35.2
230.01
0.07
36
232.04
0.07
37
236.00
0.03
38
239.94
0.08
Experiments and Results 4-15
Table 4-1 Example of precision results of seven injections of the
AmpFl STR Identifiler Allelic Ladder: (continued)
ABI PRISM 310 Genetic Analyzer
Allele
Mean
S.D.
17
214.81
0.07
18
218.80
0.06
19
222.79
0.07
20
226.81
0.06
21
230.76
0.08
22
234.78
0.07
23
238.81
0.05
24
242.83
0.07
25
246.88
0.06
FGA
4-16 Experiments and Results
26
250.96
0.06
26.2
253.00
0.09
27
254.97
0.08
28
259.02
0.10
29
263.12
0.08
30
267.26
0.09
30.2
269.07
0.10
31.2
273.17
0.09
32.2
277.24
0.08
33.2
281.33
0.09
42.2
319.83
0.14
43.2
324.04
0.14
44.2
328.26
0.13
45.2
332.42
0.16
46.2
336.43
0.14
47.2
340.42
0.14
48.2
344.15
0.10
50.2
351.45
0.05
51.2
355.13
0.05
Table 4-1 Example of precision results of seven injections of the
AmpFl STR Identifiler Allelic Ladder: (continued)
ABI PRISM 310 Genetic Analyzer
Allele
Mean
S.D.
4
163.29
0.04
5
167.36
0.03
6
171.40
0.05
7
175.40
0.03
8
179.38
0.04
TH01
9
183.36
0.05
9.3
186.93
0.02
10
187.29
0.04
11
191.23
0.03
13.3
201.94
0.05
6
222.07
0.04
7
226.02
0.06
8
229.91
0.03
9
233.86
0.06
10
237.88
0.07
11
241.83
0.06
12
245.77
0.07
13
249.78
0.08
TPOX
Experiments and Results 4-17
Table 4-1 Example of precision results of seven injections of the
AmpFl STR Identifiler Allelic Ladder: (continued)
ABI PRISM 310 Genetic Analyzer
Allele
Mean
S.D.
11
154.59
0.08
12
158.87
0.07
13
163.00
0.05
14
167.27
0.05
15
171.15
0.05
16
175.15
0.04
17
179.15
0.04
18
183.08
0.04
19
187.00
0.04
20
190.93
0.05
21
194.80
0.05
22
198.62
0.06
23
202.44
0.05
24
206.69
0.08
vWA
4-18 Experiments and Results
Extra Peaks in the Electropherogram
Causes of Extra To further demonstrate reproducibility, 1187 population database DNA
Peaks samples have been typed using the AmpFl STR Identifiler PCR
Amplification Kit. These samples have been previously genotyped with
concordant results of the same loci using other AmpFl STR kits.
Peaks other than the target alleles may be detected on the
electropherogram displays. Several causes for the appearance of extra
peaks, including the stutter product (found at the n–4 position),
incomplete 3´ A nucleotide addition (found at the n–1 position), artifacts
and mixed DNA samples (see 8.1.2.2).
Stutter Products
The PCR amplification of tetranucleotide STR loci typically produces a
minor product peak four bases shorter (n–4) than the corresponding
main allele peak. This is referred to as the stutter peak or product.
Sequence analysis of stutter products at tetranucleotide STR loci has
revealed that the stutter product is missing a single tetranucleotide core
repeat unit relative to the main allele (Walsh et al.,1996).
The proportion of the stutter product relative to the main allele (percent
stutter) is measured by dividing the height of the stutter peak by the
height of the main allele peak. Such measurements have been made
for amplified samples at the loci used in the AmpFl STR Identifiler kit. All
data were generated on the ABI PRISM 310 Genetic Analyzer.
Some of the general conclusions from these measurements and
observations are as follows:
For each AmpFl STR Identifiler kit locus, the percent stutter
generally increases with allele length, as shown in Figures 4-4, 4-5,
4-7 and 4-8. Smaller alleles display a lower level of stutter relative
to the longer alleles within each locus. This is reflected in
Figures 4-4 through 4-7, where minimal data points are plotted for
some smaller alleles, as stutter could not be detected for many of
these samples.
For the alleles within a particular locus, the percent stutter is
generally greater for the longer allele in a heterozygous sample
(this is related to the first point above).
Each allele within a locus displays percent stutter that is
reproducible.
The highest percent stutter observed for each allele is as follows:
CSF1PO, 9.2%; D2S1338, 11.1%; D3S1358, 10.7%; D5S818,
6.8%; D7S820, 8.2%; D8S1179, 8.2%; D13S317, 8.0%; D16S539,
Experiments and Results 4-19
10.4%; D18S51, 17.0%; D19S433, 13.3%; D21S11, 9.4%; FGA,
14.7%; TH01, 5.1%; TPOX, 4.8% and vWA, 12.6%.
The highest observed percent stutter for each locus is included as
the filtering step in Genotyper software. Peaks in the stutter position
that are above the highest observed percent stutter will not be
filtered. Peaks in the stutter position that have not been filtered and
remain labeled can be further evaluated. For evaluation of mixed
samples, see “Mixed Samples.”
The percent stutter does not change significantly with the
recommended quantity of input DNA, for on-scale data. The
measurement of percent stutter may be unusually high for main
peaks that are off-scale.
The percent stutter for allele 15 in D3S1358 (Figure 4-5) is
artificially increased due to a reproducible artifact (Figure 4-8)
observed in the green dye lanes at this position. When analyzing
samples which contain a D3S1358 allele 15, we recommend
careful examination due to the contribution that this identified
artifact may add to the observed peak height or area. The highest
percent stutter for D3S1358 is not inconclusive of allele 15.
4-20 Experiments and Results
16
15
14
13
12
11
10
Percent
Stutter
9
8
7
6
5
4
3
2
1
0
8
9 10 11 12 13 14 15 16 17
D8S1179
25 26 27 28 29 30 31 32 33 34 35 36
D21S11
8 9 10 11 12 13 14
8 9 10 11 12 13 14
D7S820
CSF1PO
Allele
Figure 4-4
Stutter percentages for the D8S1179, D21S11, D7S820, and CSF1PO loci
Experiments and Results 4-21
30
25
Percent Stutter
20
15
10
5
0
12 13 14 15 16 17 18 19
6 7 8 9 10 11
D3S1358
TH01
8 9 10 11 12 13 14
D13S317
8 9 10 11 12 13 14
D16S539
16 17 18 19 20 21 22 23 24 25 26
D2S1338
Allele
Figure 4-5 Stutter percentages for the D3S1358, TH01, D13S317, D16S539, and D2S1338 loci. See
the comment on page 4-17 regarding stutter at allele 15 of D3S1358
4-22 Experiments and Results
18
17
16
15
14
13
12
Percent Stutter
11
10
9
8
7
6
5
4
3
2
1
0
9 10 11 12 13 14 15 16 17
11 12 13 14 15 16 17 18 19 20 21
6 7 8 9 10 11 12
11 12 13 14 15 16 17 18 19 20 21 22 23
D19S433
vWA
TPOX
D18S51
Allele
Figure 4-6
Stutter percentages for the D19S433, vWA, TPOX, and D18S51 loci
Experiments and Results 4-23
16
14
12
Percent Stutter
10
8
6
4
2
0
7
8
9 10 11 12 13 14
17 18 19 20 21 22 23 24 25 26 27 28 29 30 31 32 33 34 35 36 37 38 39 40 41 42 43 44
D5S818
FGA
Allele
Figure 4-7
Stutter percentages for the D5S818 and FGA loci
4-24 Experiments and Results
A
Sample 1
B
Sample 1
C
Negative
Control
Figure 4-8 Sample 1 in panel A and panel B has a profile of 15, 16 for D3S1358. The amount of stutter
can not be accurately measured due to the VIC™ dye artifact. Note the degree of magnification (y-axis)
used in panels B and C to illustrate the artifact. Data was produced on the ABI PRISM 310 Genetic
Analyzer.
Addition of 3´ A Nucleotide
AmpliTaq Gold® enzyme, like many other DNA polymerases, can
catalyze the addition of a single nucleotide (predominately adenosine)
to the 3´ ends of double-stranded PCR products (Clark, 1988;
Magnuson et al.,1996). This non-template addition results in a PCR
product that is one base pair longer than the actual target sequence,
and the PCR product with the extra nucleotide is referred to as the “+A”
form.
The efficiency of “A addition” is related to the particular sequence of the
DNA at the 3´ end of the PCR product. The AmpFl STR Identifiler kit
includes two main design features that promote maximum A addition:
The primer sequences have been optimized to encourage A
addition.
The final extension step is 60 °C for 60 min.
This final extension step gives the AmpliTaq Gold DNA Polymerase
extra time to complete A addition to all double-stranded PCR product.
STR systems that have not been optimized for maximum A addition
may have “split peaks”, where each allele is represented by two peaks
one base pair apart.
Experiments and Results 4-25
Figure 4-9 Split peaks resulting from incomplete A nucleotide addition due to
omission of the 60-minute extension step
The AmpliTaq Gold DNA Polymerase generally requires extra time to
complete the A nucleotide addition at the 3´ end of the PCR products.
Lack of full A nucleotide addition may be observed in AmpFl STR
Identifiler kit results when the amount of input DNA is greater than
recommended protocols. The reason for this is that more time is
needed for AmpliTaq Gold DNA Polymerase to add the A nucleotide to
all molecules as more PCR product is generated. Amplification of too
much input DNA will also result in off-scale data.
Artifacts Artifacts, or anomalies, have been seen in data produced on the
ABI PRISM ® 310 Genetic Analyzer when using the AmpFl STR Identifiler
kit. The shape of these artifacts is not consistent with the shape of
labeled DNA fragments as seen on the ABI PRISM 310 Genetic
Analyzer. Artifacts may or not be reproducible.
Figure 4-10 on page 4-27 demonstrates reproducible artifacts while
using the AmpFl STR Identifiler kit. A user of the AmpFl STR Identifiler
kit on the ABI PRISM 310 Genetic Analyzer should consider these
artifacts when interpreting data.
4-26 Experiments and Results
Figure 4-10 Reproducible anomalies in the blue, green, yellow, and red dye
electropherograms when using the AmpFl STR Identifiler PCR Amplification Kit.
Genotyping may result in the detection of these artifacts as off-ladder alleles, or
“OL Alleles?”. Note the degree of magnification (y-axis) used in this figure to
illustrate these artifacts, data produced on the ABI PRISM 310 Genetic Analyzer.
Artifacts can be intermittent and are not always reproducible. In our
experience, non-reproducible artifacts can be correlated to sources
other than the kit (e.g., spikes). An intermittent artifact is not observed in
the same position upon re-injection. The Identifiler kit user should
consider these artifacts when interpreting data.
Experiments and Results 4-27
Characterization of Loci
8.1.2.1 “Documentation exists and is available which defines and characterizes the
Documentation locus.” (DAB, 1998).
Overview This section describes basic characteristics of the 16 loci that are
amplified with the AmpFl STR Identifiler kit. These loci have been
previously characterized.
Nature of the The primers for the Amelogenin locus flank a six-base pair deletion
Polymorphisms within intron 1 of the X homologue. Amplification results in 107-bp and
113-bp products from the X and Y chromosomes, respectively. (Sizes
are the actual base pair size according to sequencing results, including
3' A nucleotide addition.) The remaining AmpFl STR Identifiler kit loci
are all tetranucleotide short tandem repeat (STR) loci. The length
differences among alleles of a particular locus result from differences in
the number of 4–bp repeat units.
Some alleles in the AmpFl STR Identifiler Allelic Ladder containing
partial repeat units in population database and nonhuman primate DNA
samples have been subjected to DNA sequencing at Applied
Biosystems (Lazaruk, et al., 2001). In addition, other groups in the
forensic community have sequenced alleles at some of these loci
(Nakahori et al., 1991; Puers et al., 1993; Möller et al., 1994; Barber et
al., 1995; Möller and Brinkmann, 1995; Barber et al., 1996; Barber and
Parkin, 1996; Brinkmann et al., 1998; Momhinweg et al., 1998; Watson
et al., 1998). Among the various sources of sequence data on the
AmpFl STR Identifiler kit loci, there is consensus on the repeat patterns
and structure of the STRs.
Inheritance The AmpFl STR loci have been validated by family studies to
demonstrate their mode(s) of inheritance.
The Centre d’Etude du Polymorphisme Humain (CEPH) has collected
DNA from 39 families of Utah Mormon, French Venezuelan, and Amish
descent. These DNA sets have been extensively studied all over the
world and are routinely used to characterize the mode of inheritance of
various DNA loci. Each family set contains three generations, generally
including four grandparents, two parents, and several offspring.
Consequently, the CEPH family DNA sets are ideal for studying
inheritance patterns (Begovich et al.,1992).
Four CEPH family DNA sets were examined. One and a half
nanograms of DNA from each sample were amplified using the
AmpFl STR SGM Plus™ kit, followed by analysis using an
4-28 Experiments and Results
ABI PRISM ® 377 DNA Sequencer. The families examined included
#1331 (11 offspring), #13291 (9 offspring), #13292 (9 offspring), and
#13294 (8 offspring), representing 37 meiotic divisions. The results
confirmed that the loci are inherited according to Mendelian rules, as
has been reported in the literature (Nakahori et al.,1991; Edwards et
al.,1992; Kimpton et al.,1992; Mills et al.,1992; Sharma and Litt, 1992;
Li et al.,1993; Straub et al.,1993).
Mapping The AmpFl STR kit loci Amelogenin, CSF1PO, D2S1338, D3S1358,
D5S818, D7S820, D8S1179, D13S317, D16S539, D18S51, D19S433,
D21S11, FGA, TH01, TPOX and vWA have been mapped and the
chromosomal locations have been published (Nakahori et al., 1991;
Edwards et al.,1992; Kimpton et al.,1992; Mills et al.,1992; Sharma and
Litt,1992; Li et al.,1993; Straub et al.,1993; Barber and Parkin,1996).
Experiments and Results 4-29
Species Specificity
8.1.2.2 Species “Species specificity, sensitivity, stability and mixture studies are conducted.”
Specificity (DAB, 1998).
The AmpFl STR Identifiler kit provides the required degree of specificity
such that it is specific to primates. Other species do not amplify for the
loci tested, with the exception of the Amelogenin locus.
Nonhuman Studies
Nonhuman DNA may be present in forensic casework samples. The
AmpFl STR Identifiler kit provides the required degree of specificity
such that it is specific to primates for the species tested (with the
exception of the Amelogenin locus).The following experiments were
conducted to investigate interpretation of AmpFl STR Identifiler kit
results from nonhuman DNA sources.
Chimp
Horse
Pig
Dog
E. coli
Negative Control
Figure 4-11 Representative electropherograms of a primate, non-primates, a microorganism, and a
negative control are shown. All samples were analyzed on an ABI PRISM 310 Genetic Analyzer. The
peaks dipicted in orange are the GeneScan-500 LIZ size standard
4-30 Experiments and Results
The extracted DNA samples were amplified in AmpFl STR Identifiler kit
reactions and analyzed using the ABI PRISM 310 Genetic Analyzer.
Primates—gorilla, chimpanzee, orangutan, and macaque (1.0 ng
each).
Non primates—mouse, dog, pig, cat, horse, chicken and cow
(2.5 ng each).
Bacteria and yeast—Brochothrix, Escherichia, Neisseria,
Pseudomonas, Bacillus, Staphylococcus (approximately 5 ng
each), and Saccharomyces (1 ng).
The primate DNA samples all amplified, producing fragments within the
100–400 base pair region (Lazaruk, et al., 2001; Wallin et al.,1998).
The microorganisms, chicken, cow, cat and mouse did not yield
detectable product. Horse, dog, and pig produced a 103-bp fragment
near the Amelogenin locus in PET™ dye.
Experiments and Results 4-31
Sensitivity
8.1.2.2 Sensitivity “Species specificity, sensitivity, stability and mixture studies are conducted.”
(DAB, 1998).
Effect of DNA Quantity on Results
Importance of The amount of input DNA added to the AmpFl STR Identifiler PCR
Quantitation Amplification kit should be between 0.5 and 1.25 ng. The DNA sample
should be quantitated prior to amplification using a system such as the
QuantiBlot® Human DNA Quantitation Kit (P/N N808-0114), see
Appendix E. The final DNA concentration should be in the range of
0.05–0.125 ng/µL so that 0.5–1.25 ng of DNA will be added to the PCR
reaction in a volume of 10 µL. If the sample contains degraded DNA,
amplification of additional DNA may be beneficial.
If too much DNA is added to the PCR reaction, then the increased
amount of PCR product that is generated can result in the following:
Fluorescence intensity that exceeds the linear dynamic range for
detection by the instrument (“off-scale” data)
Off-scale data is a problem for two reasons:
–
Quantitation (peak height and area) for off-scale peaks is not
accurate. For example, an allele peak that is off-scale can
cause the corresponding stutter peak to appear higher in
relative intensity, thus increasing the calculated percent stutter.
–
Multicomponent analysis of off-scale data is not accurate,
which results in poor spectral separation (“pull-up”).
Incomplete A nucleotide addition
The sample can be re-amplified using less DNA.
When the total number of allele copies added to the PCR is extremely
low, unbalanced amplification of the two alleles of a heterozygous
individual may occur (Walsh et al.,1992; Wallin et al.,1998) due to
stochastic fluctuation in the ratio of the two different alleles
(Sensabaugh et al.,1991). The PCR cycle number and amplification
conditions have been specified to produce low peak heights for a
sample containing 20-pg human genomic DNA. Low peak heights
should be interpreted with caution.
Individual laboratories may find it useful to determine an appropriate
minimum peak height threshold based on their own results and
instruments using low amounts of input DNA.
4-32 Experiments and Results
Figure 4-12 Effect of amplifying various amounts of DNA ranging from 16 pg to 1 ng. Note that the
y-axis scale is magnified for the lower amounts of DNA, analyzed using the ABI PRISM 310 Genetic
Analyzer
Experiments and Results 4-33
Stability
8.1.2.2 Stability “Species specificity, sensitivity, stability and mixture studies are conducted.”
(DAB, 1998).
Lack of Amplification of Some Loci
Overview As with any multi-locus system, the possibility exists that not every
locus will amplify. This is most often observed when the DNA sample
contains PCR inhibitors or when the DNA sample has been severely
degraded. Since each locus is an independent marker, whose results
are not based upon information provided by the other markers, results
generally can still be obtained from the loci that do amplify.
Differential and Differential amplification can be defined as the difference in the degree
Preferential of amplification of each locus within a co-amplified system, such that
Amplification one or more loci may amplify to a greater extent compared to the other
loci. Preferential amplification is used in this manual to describe
differences in the amplification efficiency of two alleles at a single locus.
Preferential amplification of alleles in systems that distinguish alleles
based on length polymorphisms is most likely to be observed when the
alleles differ significantly in base pair size. Since most AmpFl STR
Identifiler kit loci have small size ranges, the potential for preferential
amplification of alleles is low.
Effect of Inhibitors Heme compounds have been identified as PCR inhibitors in DNA
samples extracted from bloodstains (DeFranchis et al.,1988; Akane
et al., 1994). It is believed that the inhibitor is co-extracted and
co-purified with the DNA and subsequently interferes with PCR by
inhibiting polymerase activity.
Bovine serum albumin (BSA) can prevent or minimize the inhibition of
PCR, most likely by binding to the inhibitor (Comey et al., 1994). Since
the presence of BSA can improve the amplification of DNA from
blood-containing samples, BSA has been included in the AmpFl STR®
PCR Reaction Mix at 4 µg per 25-µL amplification. BSA has also been
identified as an aid in overcoming inhibition from samples containing
dyes, such as in denim (Comey et al., 1994).
To examine the effects of hematin on the amplification results obtained
by the AmpFl STR Identifiler kit, DNA samples were amplified using the
AmpFl STR Identifiler kit reagents (including the BSA-containing PCR
reaction mix) in the presence of varying concentrations of purified
hematin. The concentrations of hematin used were 0 µM,10 µM, 12 µM,
14 µM, 16 µM, 18 µM and 20 µM. When the amount of hematin was
4-34 Experiments and Results
increased to a concentration that started to inhibit the PCR, CSF1PO
and D2S1338 were the first loci to exhibit decreased amplification,
followed by D16S539 and D18S51.
Differential amplification was observed in the presence of increasing
amounts of hematin. Moreover, as the concentration of hematin was
increased, the overall yield of products was reduced particularly for the
larger loci.
Figure 4-13 DNA amplified with the AmpFlSTR Identifiler kit in the presence of varying concentrations
of hematin: 0, 10 µM, 12 µM, 14 µM, 16 µM, 18 µM, and 20 µM, analyzed on the ABI PRISM 310 Genetic
Analyzer
Degraded DNA As the average size of degraded DNA approaches the size of the target
sequence, the amount of PCR product generated is reduced. This is
due to the reduced number of intact templates in the size range
necessary for amplification.
Degraded DNA was prepared to examine the potential for differential
amplification of loci. High molecular weight DNA was incubated with the
enzyme DNase I for varying amounts of time. The DNA was examined
Experiments and Results 4-35
by agarose gel analysis to determine the average size of the DNA
fragments at each time point.
Four nanograms of degraded DNA (or 1 ng undegraded DNA) was
amplified using the AmpFl STR Identifiler kit (all 16 primer pairs
together). As the DNA became increasingly degraded the loci became
undetectable according to size. Preferential amplification was not
observed. The loci failed to robustly amplify in the order of decreasing
size as the extent of degradation progressed: CSF1PO and D2S1338
were the first loci to exhibit decreased amplification, followed by
D16S539 and D18S51 and so forth. A similar result at each time point
was obtained whether the DNA samples were amplified for each locus
alone or co-amplified with the AmpFl STR Identifiler kit (Figure 4-14).
Figure 4-14 Multiplex amplifications of a DNA sample in the absence of DNase I and the sample
incubated for 30 sec, 1 min, 4 min, and 8 min with DNase I, analyzed using the ABI PRISM 310 Genetic
Analyzer
Multiplex Amplifications
DNA samples were amplified in 16 separate reactions containing
primers for only one AmpFl STR Identifiler kit locus (singleplex) and a
4-36 Experiments and Results
reaction containing all primers for the AmpFl STR Identifiler kit loci
(multiplex). DNA used as PCR template consisted of a sample that had
been degraded for 1 min with DNase I.
Amplified samples were analyzed using the ABI PRISM 310 Genetic
Analyzer. Similar results were obtained (genotype and peak height)
whether the DNA samples were amplified for each locus alone or
co-amplified in the AmpFl STR Identifiler kit reaction, see Figure 4-15
on page 4-38.
When degraded DNA is suspected to have compromised amplification
of one or more loci, the molecular weight of the DNA can be assessed
by agarose gel analysis. If the DNA is degraded to an average of 400
base pairs in size or less, adding more DNA template to the AmpFl STR
Identifiler kit amplification reaction may help produce a typeable signal
for the loci. Adding more DNA to the amplification may provide more of
the necessary size template for amplification.
Experiments and Results 4-37
Figure 4-15 Multiplex and singleplex amplifications of a DNA sample incubated for 1 min with DNase I,
analyzed on the ABI PRISM 310 Genetic Analyzer
4-38 Experiments and Results
Mixture Studies
8.1.2.2 Mixture “Species specificity, sensitivity, stability and mixture studies are conducted.”
Studies (DAB, 1998).
Evidence samples may contain DNA from more than one individual.
The possibility of multiple contributors should be considered when
interpreting the results. We recommend that individual laboratories
assign a minimum peak height threshold based on validation
experiments performed in each laboratory to avoid typing when
stochastic effects are likely to interfere with accurate interpretation of
mixtures.
Mixed Specimen Evidence samples that contain body fluids and/or tissues originating
Studies from more than one individual are an integral component of forensic
casework. Therefore it is essential to ensure that the DNA typing
system is able to detect DNA mixtures. In the case of STRs, stutter
peaks may be informative in the interpretation of mixed samples.
Furthermore, alleles amplified with the AmpFl STR Identifiler kit have
similar peak height values for a heterozygous genotype within a locus.
This balance can be used as an aid in detecting and interpreting
mixtures.
Detection of Mixed Samples
Each of the following can aid in determining whether a sample is a
mixture:
The presence of greater than two alleles at a locus
Significantly imbalanced alleles for a heterozygous genotype
The presence of a peak at a stutter position that is significantly
greater in percentage than what is typically observed in a
single-source sample
The peak height ratio is defined as the height of the lower peak (in
RFU) divided by the height of the higher peak (in RFU), expressed
as a percentage. Mean, median, minimum and maximum peak
height ratios observed for alleles in the AmpFl STR Identifiler kit loci
in unmixed population database samples are as follows:
Experiments and Results 4-39
Table 4-2
Allele
Peak Height Ratios
Number of
Observations
(n)
Mean*
Median*
Minimum* Maximum*
CSF1PO 84
86
88
63.6
99.8
D2S1338 93
84
86
42.8
99.7
D3S1358 91
88
90
64.3
99.7
D5S818
82
89
91
64.9
99.7
D7S820
96
89
90
66.2
99.5
D8S1179 89
90
93
57.5
99.8
D13S317 96
87
87
63.3
100.0
D16S539 92
88
91
61.5
99.9
D18S51
99
82
83
56.3
99.9
D19S433 98
88
92
48.8
100.0
D21S11
88
89
66.4
99.6
92
FGA
94
85
87
60.9
99.5
TH01
99
86
88
48.8
99.9
TPOX
87
87
92
55.9
99.8
vWA
101
86
88
62.8
99.1
*Peak height ratios were determined for those heterozygous samples with
peak heights > 200 RFU.
For all 15 loci, the mean peak height ratios indicate that the two
alleles of a heterozygous individual are generally very well
balanced.
If an unusually low peak height ratio is observed for one locus, and
there are no other indications that the sample is a mixture, the
sample may be reamplified and reanalyzed to determine if the
imbalance is reproducible. Possible causes of imbalance at a locus
are degraded DNA, presence of inhibitors, extremely low amounts
of input DNA, or the presence of an allele containing a rare
sequence that does not amplify as efficiently as the other allele.
Resolution of Genotypes in Mixed Samples
A sample containing DNA from two sources can be comprised (at a
single locus) of any of the seven genotype combinations listed below.
4-40 Experiments and Results
Heterozygote + heterozygote, no overlapping alleles (four peaks)
Heterozygote + heterozygote, one overlapping allele (three peaks)
Heterozygote + heterozygote, two overlapping alleles (two peaks)
Heterozygote + homozygote, no overlapping alleles (three peaks)
Heterozygote + homozygote, overlapping allele (two peaks)
Homozygote + homozygote, no overlapping alleles (two peaks)
Homozygote + homozygote, overlapping allele (one peak)
Specific genotype combinations and input DNA ratios of the samples
contained in a mixture determine whether it is possible to resolve the
genotypes of the major and minor component(s) at a single locus.
The ability to obtain and compare quantitative values for the different
allele peak heights on Applied Biosystems instruments provides
additional valuable data to aid in resolving mixed genotypes. This
quantitative value is much less subjective than comparing relative
intensities of bands on a stained gel.
Ultimately, the likelihood that any sample is a mixture must be
determined by the analyst in the context of each particular case,
including the information provided from known reference sample(s).
Limit of Detection of the Minor Component
Mixtures of two DNA samples were examined at various ratios (1:1 to
1:10). The total amount of genomic input DNA mixed at each ratio was
1 ng.
The samples were amplified in a GeneAmp® PCR System 9700 and
were electrophoresed and detected using an ABI PRISM 310 Genetic
Analyzer.
The results of the mixed DNA samples are shown in Figure 4-16, where
sample A and sample B were mixed according to the ratios provided.
The profiles of the samples in Figure 4-16 are the following:
Profile
Allele
Sample A
Sample B
X
X, Y
10, 12
11,12
D2S1338
17, 25
20, 23
D3S1358
15, 18
15,16
D5S818
11, 13
11
D7S820
9, 10
7,12
D8S1179
13
12,13
Amelogenin
CSF1PO
Experiments and Results 4-41
Profile
Allele
Sample A
Sample B
D13S317
11
11
D16S539
11, 12
9, 10
D18S51
17, 19
12, 15
D19S433
13
14,15
D21S11
30, 30.2
28, 31
FGA
23.2, 24
24, 26
TH01
7, 9
7, 9.3
TPOX
vWA
8, 9
8
17, 19
14,16
For these 1-ng total DNA mixture studies, the limit of detection is when
the minor component is present at approximately one-tenth of the
concentration of the major component and a threshold of 50 RFU. The
limit of detection for the minor component is influenced by the
combination of genotypes in the mixture.
Panel 1
Sample A
2
10:1
3
3:1
4
1:1
5
1:3
6
1:10
7
Sample B
Figure 4-16 Results of the two DNA samples mixed together at defined ratios and amplified with the
AmpFlSTR Identifiler PCR Amplification Kit. Sample A and Sample B are a female and male sample,
respectively. The ratios of Sample A to Sample B (A:B ratios) shown are 10:1, 3:1, 1:1, 1:3, and 1:10,
respectively. The alleles attributable to the minor component, even when the major component shares an
allele, are highlighted in panels 2, 3, 5, and 6. All alleles are highlighted in panel 4.
4-42 Experiments and Results
Data Interpretation
Minimum Sample The AmpFl STR Identifiler PCR Amplification Kit has been optimized to
Requirement amplify and type approximately 0.5–1.25 ng of sample DNA reliably.
The PCR cycle number and amplification conditions have been
specified to produce low peak heights for a sample containing 20 pg
human genomic DNA. Thus, the overall sensitivity of the assay has
been adjusted to avoid or minimize stochastic effects. Applied
Biosystems has successfully typed samples containing less than 0.5 ng
DNA.
Note Individual laboratories may find it useful to determine an appropriate
minimum peak height threshold based on their own results/instruments using
low amounts of input DNA.
Experiments and Results 4-43
Population Data
8.1.2.3 Population “Population distribution data are documented and available.” (DAB, 1998).
Data
8.1.2.3.1 “The population distribution data would include the allele and genotype
Population distributions for the locus or loci obtained from relevant populations. Where
Distribution Data appropriate, databases should be tested for independence expectations.”
(DAB, 1998).
Overview To interpret the significance of a match between genetically typed samples,
it is necessary to know the population distribution of alleles at each locus in
question. If the genotype of the relevant evidence sample is different from
the genotype of the suspect’s reference sample, then the suspect is
“excluded” as the donor of the biological evidence tested. An exclusion is
independent of the frequency of the two genotypes in the population.
If the suspect and evidence samples have the same genotype, then the
suspect is “included” as a possible source of the evidence sample. The
probability that another, unrelated, individual would also match the
evidence sample is estimated by the frequency of that genotype in the
relevant population(s).
Population The AmpFlSTR Identifiler PCR Amplification Kit, prior to the addition of the
Samples Used in D8S1179 degenerate primer, was used to generate the population data
These Studies provided in this section. Samples were collected from individuals
throughout the United States with no geographical preference.
African-American
357 samples were provided by the Kentucky State Police and the Federal
Bureau of Investigation.
U.S. Caucasian
349 samples were provided by the Kentucky State Police and the Federal
Bureau of Investigation.
U.S. Hispanic
290 samples were provided by the Minnesota Bureau of Criminal
Apprehension/Memorial Blood Center of Minneapolis and the Federal
Bureau of Investigation.
Native American
191 samples were provided by the Minnesota Bureau of Criminal
Apprehension/Memorial Blood Center of Minneapolis.
4-44 Experiments and Results
AmpFl STR Table 4-3 shows the AmpFl STR Identifiler kit allele frequencies in four
Identifiler Kit populations, listed as percentages.
Allele Frequencies
Table 4-3 AmpFl STR Identifiler kit allele frequencies
African-American
(n = 357)
U.S. Caucasian
(n = 349)
U.S. Hispanic
(n = 290)
Native American
(n = 191)
6
*
*
*
*
7
4.62
0.14*
0.34*
*
8
7.56
0.29*
0.17*
0.52*
Allele
CSF1PO
9
3.78
1.72
0.86*
8.38
10
27.87
24.21
23.10
30.89
11
20.59
31.81
28.28
21.99
11.3
0.14*
*
*
*
12
29.13
32.81
39.66
32.72
13
5.32
7.31
6.38
4.71
14
0.98
1.43
0.86*
0.79*
15
*
0.29*
0.34*
*
15
0.14*
*
*
*
16
5.32
4.73
2.41
2.62
17
10.78
17.34
21.21
9.95
D2S1338
18
5.60
6.30
4.14
7.07
19
14.15
13.75
22.76
29.58
20
6.02
14.61
13.79
9.69
21
14.01
2.58
2.59
2.36
22
13.17
4.01
7.41
15.18
23
10.78
11.46
11.38
11.78
24
9.80
11.75
8.45
7.85
25
8.12
10.60
5.17
3.14
26
1.96
2.72
0.69*
0.79*
27
0.14*
0.14*
*
*
28
*
*
*
*
Experiments and Results 4-45
Table 4-3 AmpFl STR Identifiler kit allele frequencies
(continued)
African-American
(n = 357)
U.S. Caucasian
(n = 349)
U.S. Hispanic
(n = 290)
Native American
(n = 191)
0.42*
0.14*
*
*
11
*
*
*
0.26*
12
0.56*
*
0.17*
*
13
0.70*
0.29*
0.17*
*
14
12.04
15.76
7.41
6.81
15
30.53
25.36
39.14
40.84
15.2
0.14*
*
*
*
16
28.57
22.78
26.72
32.98
17
19.47
18.19
16.03
9.95
18
6.72
16.48
8.97
8.38
19
0.84
1.00
1.03
0.79*
20
*
*
0.34*
*
Allele
D3S1358
<11
D5S818
7
0.14*
*
6.72
15.71
8
5.46
*
0.69*
*
9
1.68
4.15
5.17
6.02
10
6.72
5.44
5.17
4.19
11
25.49
39.26
39.14
41.10
12
36.41
35.24
29.31
23.30
13
21.57
15.47
12.59
9.42
14
2.38
0.14*
0.69*
0.26*
15
*
0.29*
0.18*
*
16
*
*
0.17*
*
17
0.14*
*
0.17*
*
4-46 Experiments and Results
Table 4-3 AmpFl STR Identifiler kit allele frequencies
Allele
(continued)
African-American
(n = 357)
U.S. Caucasian
(n = 349)
U.S. Hispanic
(n = 290)
Native American
(n = 191)
*
0.14*
0.17*
*
D7S820
6
7
0.42*
1.29
1.72
0.52*
8
18.77
16.48
11.72
13.09
9
13.73
17.62
6.21
8.12
10
34.45
27.22
27.41
21.99
11
19.89
18.05
28.79
28.80
12
10.78
14.76
20.17
24.08
13
1.54
3.72
3.45
3.40
14
0.42*
0.72
0.34*
*
15
*
*
*
*
8
0.42*
2.29
0.34*
0.52*
9
0.42*
1.15
0.34*
0.26*
10
2.38
9.74
8.45
4.71
11
3.92
6.02
5.86
3.40
12
13.31
14.04
12.07
11.52
13
23.25
32.52
32.93
37.43
14
30.11
21.35
26.21
30.63
15
20.17
9.89
10.86
9.42
16
4.62
2.72
2.41
1.57
17
1.12*
0.29*
0.52*
0.52*
18
0.28*
*
*
*
19
*
*
*
*
8
3.08
12.18
9.66
4.97
9
2.52
7.74
21.72
17.80
10
3.78
4.44
9.14
13.61
11
24.51
29.80
23.10
24.35
12
46.22
30.80
20.86
23.04
13
15.41
11.17
10.17
7.85
14
4.34
3.72
5.34
8.12
15
0.14*
0.14*
*
0.26*
D8S1179
D13S317
Experiments and Results 4-47
Table 4-3 AmpFl STR Identifiler kit allele frequencies
Allele
(continued)
African-American
(n = 357)
U.S. Caucasian
(n = 349)
U.S. Hispanic
(n = 290)
Native American
(n = 191)
*
*
*
*
D16S539
5
8
3.22
1.72
1.72
0.79*
9
19.05
10.46
9.31
12.30
10
10.92
5.59
15.69
15.45
11
31.51
31.95
30.17
30.89
12
18.77
30.23
29.48
27.75
13
14.85
16.76
11.55
10.73
14
1.54
3.01
2.07
2.09
15
0.14*
0.29*
*
*
7
*
*
*
*
9
0.14*
*
*
*
10
0.28*
0.86
0.52*
0.79*
10.2
0.14*
*
*
*
11
0.28*
1.15
1.21*
*
12
7.00
13.90
10.34
14.92
13
4.34
12.18
14.48
9.16
13.2
0.42*
*
*
*
14
6.86
16.76
15.52
26.96
14.2
0.28*
*
*
*
15
19.47
13.61
16.55
12.04
16
16.53
13.61
11.72
10.73
17
18.21
12.32
14.14
14.66
18
11.90
7.74
6.72
2.62
19
6.02
4.44
4.14
3.93
20
4.90
1.72
2.24
1.83
21
2.10
1.00
1.03
1.31
22
0.70*
0.43*
0.52*
0.79*
23
0.42*
0.14*
0.52*
0.26*
24
*
0.14*
0.17*
*
25
*
*
0.17*
*
26
*
*
*
*
27
*
*
*
*
D18S51
4-48 Experiments and Results
Table 4-3 AmpFl STR Identifiler kit allele frequencies
(continued)
African-American
(n = 357)
U.S. Caucasian
(n = 349)
U.S. Hispanic
(n = 290)
Native American
(n = 191)
9
*
0.14*
0.17*
*
10
1.54
*
*
*
11
7.14
0.72
0.52*
0.52*
11.2
0.14*
*
0.17*
*
12
10.78
7.74
6.21
3.14
Allele
D19S433
12.2
6.30
0.57*
1.90
*
13
29.83
28.94
16.03
17.80
13.2
5.74
1.72
8.62
15.45
14
21.01
34.10
31.72
24.87
14.2
4.20
0.86
5.00
3.66
15
4.76
15.76
13.45
13.35
15.2
3.36
2.72
8.79
10.73
16
2.38
4.15
4.31
3.93
16.2
2.38
1.72
2.93
1.83
*
0.29*
0.17*
0.79*
17.2
0.28*
0.29*
*
2.88
18.2
0.14*
0.29*
*
1.05*
17
Experiments and Results 4-49
Table 4-3 AmpFl STR Identifiler kit allele frequencies
(continued)
African-American
(n = 357)
U.S. Caucasian
(n = 349)
U.S. Hispanic
(n = 290)
Native American
(n = 191)
*
*
*
*
24.2
0.14*
0.43*
0.17*
*
24.3
0.28*
*
*
*
25
*
*
*
*
25.2
*
0.14*
0.17*
*
26
0.14*
0.14*
0.17*
*
27
5.04
4.58
1.21
0.52*
28
22.97
16.76
9.14
6.28
*
*
*
*
29
19.33
20.49
21.21
16.75
29.2
0.14*
*
0.52*
0.26*
29.3
0.14*
*
*
*
30
17.23
25.21
29.31
34.29
30.2
1.40
3.30
2.93
1.83
31
7.98
7.16
6.72
5.76
31.2
7.98
9.46
8.62
18.85
32
1.12
1.43
1.55
0.79*
32.2
5.88
7.16
12.93
9.69
33
0.56*
*
*
0.52*
33.2
3.78
3.30
4.14
3.66
34
1.26
*
*
*
34.1
0.14*
*
*
*
34.2
0.14*
0.29*
0.86*
0.79*
35
2.94
*
0.34*
*
35.1
0.14*
*
*
*
Allele
D21S11
24
28.2
35.2
*
0.14*
*
*
36
0.84
*
*
*
37
0.28*
*
*
*
38
0.14*
*
*
*
4-50 Experiments and Results
Table 4-3 AmpFl STR Identifiler kit allele frequencies
Allele
(continued)
African-American
(n = 357)
U.S. Caucasian
(n = 349)
U.S. Hispanic
(n = 290)
Native American
(n = 191)
*
0.14*
*
*
FGA
16
16.1
0.14*
*
*
*
*
0.29*
0.17*
*
17.2
0.14*
*
*
*
18
0.70*
2.72
0.52*
1.31
18.2
1.40
*
*
*
19
6.72
6.16
7.07
10.21
19.2
0.28*
*
*
*
20
7.00
13.90
7.41
12.30
17
20.2
*
0.14*
*
*
12.89
16.91
14.66
12.83
*
0.29*
0.17*
*
21.57
16.91
17.24
10.47
22.2
0.28*
1.29
0.34*
0.26*
22.3
0.14*
*
*
*
23
14.99
15.19
11.90
15.97
23.2
0.14*
*
0.86*
0.26*
24
17.51
13.75
15.34
15.71
*
0.14*
0.17*
*
25
7.98
8.60
14.14
14.14
26
3.50
2.72
6.90
4.45
21
21.2
22
24.2
26.2
*
*
*
0.52
27
1.82
0.72
2.41
0.79*
28
1.40
0.14*
0.69*
0.52*
29
0.56*
*
*
*
30
*
*
*
*
30.2
0.14*
*
*
*
31.2
*
*
*
*
32.2
*
*
*
*
33.2
*
*
*
*
34.2
0.14*
*
*
*
42.2
*
*
*
*
43.2
*
*
*
*
Experiments and Results 4-51
Table 4-3 AmpFl STR Identifiler kit allele frequencies
Allele
(continued)
African-American
(n = 357)
U.S. Caucasian
(n = 349)
U.S. Hispanic
(n = 290)
Native American
(n = 191)
0.28*
*
*
*
FGA, con’t
44.2
45.2
*
*
*
0.26*
46.2
0.14*
*
*
*
47.2
*
*
*
*
48.2
0.14*
*
*
*
50.2
*
*
*
*
51.2
*
*
*
*
*
*
*
*
TH01
4
5
0.28*
0.43*
0.17*
*
6
11.06
20.49
22.76
20.68
7
42.86
21.78
33.62
43.98
8
20.73
11.46
8.45
5.24
8.3
*
0.14*
*
*
9
12.32
16.19
14.14
6.28
9.3
11.62
29.08
20.34
23.56
10
0.98
0.43*
0.52*
0.26*
11
13.3
*
*
*
*
0.14*
*
*
*
6.72
0.14*
0.34*
*
TPOX
6
7
2.24
*
0.34*
0.26*
8
36.13
53.30
49.66
37.96
9
21.15
11.60
7.24
4.19
10
9.24
4.30
4.66
3.40
11
21.43
25.93
27.24
39.27
12
3.08
4.73
10.52
14.92
13
*
*
*
*
4-52 Experiments and Results
Table 4-3 AmpFl STR Identifiler kit allele frequencies
Allele
(continued)
African-American
(n = 357)
U.S. Caucasian
(n = 349)
U.S. Hispanic
(n = 290)
Native American
(n = 191)
0.28*
*
0.17*
*
vWA
11
12
*
*
*
0.26*
13
1.26
0.43*
*
0.26*
14
7.14
8.31
6.90
4.45
15
20.03
11.32
10.00
7.07
16
26.75
23.35
34.31
32.98
17
20.59
24.50
21.55
33.51
18
14.71
22.49
18.45
15.45
19
6.72
8.31
7.07
4.71
20
1.96
1.15
1.38
1.05*
21
0.28*
*
0.17*
0.26*
22
0.28*
*
*
*
23
*
*
*
*
24
*
0.14*
*
*
*A minimum allele frequency (0.7% for the African-American database, 0.7% for the U.S.
Caucasian database, 0.9% for the U.S. Hispanic database, and 1.3% for the Native
American database) is suggested by the National Research Council in forensic
calculations.
Analyzing the Four Databases
Analysis across the four databases of 2274 total chromosomes per
locus revealed the following number of different alleles: 10 CSF1PO
alleles, 13 D2S1338 alleles, at least 12 D3S1358 alleles, 11 D5S818
alleles, 9 D7S820 alleles, 11 D8S1179 alleles, 8 D13S317 alleles, 8
D16S539 alleles, 20 D18S51 alleles, 17 D19S433 alleles, 26 D21S11
alleles, 31 d FGA alleles, 9 TH01 alleles, 7 different TPOX alleles, and
13 vWA alleles.
In addition to the alleles that were observed and recorded in the
Applied Biosystems databases, other known alleles have been
published or reported to us by other laboratories (see STRBase,
www.cstl.nist.gov/div831/strbase).
Low Frequency Alleles
Some alleles of the AmpFl STR Identifiler kit loci occur at a low
frequency. For these alleles, a minimum frequency (five divided by 2n,
where n equals the number of individuals in the database) was
Experiments and Results 4-53
assigned for the AmpFl STR Identifiler kit African-American, U.S.
Caucasian, U.S. Hispanic and Native American databases, as
suggested in the 1996 report of the Committee on DNA Forensic
Science (National Research Council, 1996). These databases are
summarized in Table 4-3. The minimum reportable genotype frequency
at each locus is as follows: 1.19 x 10⁻⁴ for the African-American
database; 1.19 x 10⁻⁴ for the U.S. Caucasian database; 1.70 x 10⁻⁴ for
the U.S. Hispanic database; and 2.97 x 10⁻⁴ for the Native American
database [p2 + p(1–p) θ, where θ = 0.01]. Hence, the minimum
combined multilocus genotype frequency at 15 loci is as follows:
1.36 x 10–59 for the African-American database; 1.36 x 10–59 for the
U.S. Caucasian database; 2.86 x 10–57 for the U.S. Hispanic database;
and 1.23 x 10–53 for the Native American database.
4-54 Experiments and Results
Mutation Rate
Estimating Estimation of spontaneous or induced germline mutation at genetic loci
Germline may be achieved through comparison of the genotypes of offspring to
Mutations those of their parents. From such comparisons the number of observed
mutations are counted directly.
In previous studies, genotypes of ten STR loci amplified by the
AmpFl STR SGM Plus PCR Amplification Kit were determined for a
total of 146 parent-offspring allelic transfers (meioses) at the Forensic
Science Service, Birmingham, England. One length-based STR
mutation was observed at the D18S11 locus; mutation was not detected
at any of the other nine STR loci. The D18S11 mutation was
represented by an increase of one 4-bp repeat unit, a 17 allele was
inherited as an 18 (single-step mutation). The maternal/paternal source
of this mutation could not be distinguished.
Additional Additional studies (Edwards et al.,1991; Edwards et al.,1992; Weber
Mutation Studies and Wong, 1993; Hammond et al.,1994; Brinkmann et al.,1995;
Chakraborty et al.,1996; Chakraborty et al.,1997; Brinkmann
et al.,1998; Momhinweg et al.,1998; Szibor et al.,1998) of direct
mutation rate counts produced:
Larger sample sizes for some of the AmpFl STR Identifiler kit loci.
Methods for modifications of these mutation rates (to infer mutation
rates indirectly for those loci where these rates are not large
enough to be measured directly and/or to account for those events
undetectable as Mendelian errors).
Experiments and Results 4-55
Probability of Identity
Table of Table 4-4 shows the Probability of Identity (PI) values of the AmpFl STR
Probability of Identifiler kit loci individually and combined.
Identity
Table 4-4 Probability of Identity values for the AmpFl STR Identifiler kit STR loci
Locus
African-American
U.S. Caucasian
U.S. Hispanic
Native American
CSF1PO
0.079
0.132
0.141
0.123
D2S1338
0.023
0.027
0.038
0.043
D3S1358
0.097
0.076
0.112
0.158
D5S818
0.104
0.147
0.115
0.110
D7S820
0.085
0.063
0.083
0.081
D8S1179
0.074
0.064
0.089
0.104
D13S317
0.132
0.079
0.056
0.056
D16S539
0.077
0.097
0.090
0.082
D18S51
0.033
0.031
0.031
0.046
D19S433
0.042
0.087
0.049
0.044
D21S11
0.037
0.044
0.047
0.074
FGA
0.034
0.035
0.032
0.031
TH01
0.109
0.079
0.097
0.134
TPOX
0.089
0.188
0.168
0.159
vWA
0.066
0.066
0.080
0.103
Combined
1.31 x
10–18
5.01 x
10–18
7.65 x
10–18
3.62 x 10⁻¹⁷
The PI value is the probability that two individuals selected at random
will have an identical AmpFl STR Identifiler kit genotype (Sensabaugh,
1982). The PI values for the populations described in this section are
then approximately 1/7.64 x 1017 (African-American), 1/2.00 x 1017
(U.S. Caucasian), 1/1.31 x 1017 (U.S. Hispanic), and 1/2.76 x 1016
(Native American).
4-56 Experiments and Results
Probability of Paternity Exclusion
Table of Table 4-5 shows the Probability of Paternity Exclusion (PE) values of the
Probability of AmpFl STR Identifiler kit STR loci individually and combined.
Paternity
Exclusion
Table 4-5 Probability of paternity exclusion for the AmpFl STR Identifiler kit STR loci
Locus
African-American
U.S. Caucasian
U.S. Hispanic
Native American
CSF1PO
0.545
0.496
0.450
0.409
D2S1338
0.748
0.725
0.671
0.399
D3S1358
0.591
0.630
0.495
0.510
D5S818
0.506
0.440
0.525
0.601
D7S820
0.591
0.582
0.574
0.492
D8S1179
0.580
0.680
0.599
0.601
D13S317
0.383
0.487
0.638
0.370
D16S539
0.649
0.566
0.567
0.428
D18S51
0.760
0.731
0.767
0.329
D19S433
0.601
0.531
0.678
0.360
D21S11
0.737
0.708
0.586
0.399
FGA
0.760
0.766
0.739
0.309
TH01
0.492
0.566
0.618
0.646
TPOX
0.521
0.329
0.392
0.687
vWA
0.709
0.625
0.555
0.528
0.9999996
0.9999992
0.9999990
0.9999527
Combined
The PE value is the probability, averaged over all possible mother-child
pairs, that a random alleged father will be excluded from paternity after
DNA typing of the AmpFl STR Identifiler kit STR loci (Chakraborty and
Stivers, 1996).
Experiments and Results 4-57
4-58 Experiments and Results
Genotyping for the
Macintosh OS
5
Overview
5
About This This chapter describes the use of ABI PRISM® Genotyper® Software
Chapter v2.5.2 in conjunction with the AmpFl STR® Identifiler™ Kit Template
and the Macintosh® OS to automatically genotype samples.
In This Chapter This chapter contains the following topics:
Topic
See Page
Overview
5-1
Using Genotyper Software for Automated Genotyping
5-2
Understanding the AmpFlSTR Identifiler Kit Template File
5-10
Determining Genotypes
5-17
Genotyping for the Macintosh OS 5-1
Using Genotyper Software for Automated Genotyping
About the Genotyper® software is used to convert allele sizes obtained from
Software ABI PRISM ® GeneScan® Analysis Software into allele designations
automatically and to build tables containing the genotype information.
Genotypes are assigned by comparing the sizes obtained for the
unknown sample alleles with the sizes obtained for the alleles in the
allelic ladder.
A Genotyper software template file that contains macros specifically
written for use with the AmpFl STR® Identifiler™ PCR Amplification Kit
is provided with this manual and should be used with AmpFl STR
Identifiler kit data. Install the template onto your computer following the
instructions in the “READ_ME” file.
Note You must have Genotyper Software v2.5.2 or higher to run the
AmpFlSTR Identifiler Kit Template. It is recommended that this version of
Genotyper software be run on a Power Macintosh computer with Macintosh OS
8.x or 9.1. Refer to the Genotyper Software User’s Manual (Electronic
Document #904648) and Genotyper Applications Tutorials (Electronic
Document #904649) for more detailed information about the Genotyper
software. The Human Identification Tutorial and HID template file included with
the Genotyper software v2.5.2 software package are for tutorial purposes only.
Before Running GeneScan Analysis Software sample data (particularly the allelic
Genotyper ladder) must meet a few specific requirements before the macros in the
Software AmpFl STR Identifiler Kit Template can be used. These requirements
are described in this section.
Sample Info
All samples must have a unique sample description in the Sample Info
column of the GeneScan software sample sheet so that the macros in
the AmpFl STR Identifiler Kit Template can build a table. Samples with
an empty Sample Info field will not be incorporated into the table of
genotypes. Also, lanes or injections that contain the AmpFl STR
Identifiler Allelic Ladder must have the word “ladder” in the Sample Info.
The first lane or injection of “ladder” that is found is the one that is used
by the Kazam macro in the AmpFl STR Identifiler Kit Template to
determine the sizes in the allele categories that will be used for
genotyping.
It is possible to skip the first lane or injection of allelic ladder and use
the second lane or injection of allelic ladder for genotyping instead.
After importing the sample files, but before running the Kazam macro,
remove the word “ladder” from the Sample Info in all four sample dye
colors for the first lane or injection of allelic ladder in the Dye/lanes
5-2 Genotyping for the Macintosh OS
window. Make sure that the word “ladder” is entered for Sample Info in
the second lane or injection of allelic ladder. See step 3 on page 5-4 for
a description of how to access the Sample Info field in the Dye/lanes
window.
GeneScan Analysis Software Peak Recognition
All allele peaks in the allelic ladder for each locus must be “recognized”
(labeled) in the GeneScan Analysis Software (i.e., each allele peak
must have an entry in the GeneScan table). Thus, all allele peaks in
each allelic ladder must have a peak height value in relative
fluorescence units (RFU) that is greater than the Peak Amplitude
Threshold (PAT) that was specified in the GeneScan software Analysis
Parameters. Also, all allele peaks in each allelic ladder must be
resolved. For example, the FGA 26, 26.2 and 27 alleles must be
resolved such that each peak has an entry in the GeneScan software
table.
Sample allele peak heights must also be greater than the GeneScan
Software PAT in order to be recognized (labeled) by Genotyper
software. Note that the PAT value specified in the GeneScan software
Analysis Parameters is not necessarily the same as the RFU value that
may be used by the forensic analyst as the “interpretational threshold”.
The “Low Signal” column of the appropriate Genotyper software table
(see page 5-8) can be used to identify peaks that are greater than the
GeneScan software PAT, but less than a specified minimum threshold
(default 150 RFU in the table macro).
AmpFl STR The AmpFl STR Identifiler Kit Template contains macros that perform
Identifiler Kit the following steps automatically:
Template Finds the lane or injection containing the allelic ladder
Creates allele size categories that are centered on the sizes
obtained for the allelic ladder alleles
Assigns the appropriate allele label to sample alleles that size
within the allele size categories
Removes labels from stutter peaks by applying a filter
Builds a table containing genotypes for all samples
Genotyping for the Macintosh OS 5-3
Using the Use the following procedure to assign genotypes to AmpFl STR
AmpFl STR Identifiler kit alleles automatically.
Identifiler Kit
To use the AmpFl STR Identifiler Kit Template:
Template File
Step
1
Action
Double-click the IDENTIFILER icon to launch the Genotyper
software application and open the template file simultaneously.
Note The AmpFlSTR Identifiler Kit Template is a Stationery pad,
which means that a new document is created when the template file
is opened. The original template file is not overwritten.
2
Set preferences to import raw data, Blue, Green, Yellow, Red and
Orange.
3
To import the GeneScan sample files:
a. Under the File menu, choose Import GeneScan File(s).
b. Select the project file and click Import.
4
If each sample does not already have Sample Info completed in the
sample sheet, this can be accomplished in Genotyper software as
follows:
a.
Under the Views menu, choose Show Dye/lanes window.
b.
Select the first sample row by clicking on the row.
c.
Click the mouse cursor in the Sample Info box at the top of the
window, and type the sample designation or description.
d.
Repeat steps b and c to enter a sample description for every
dye/lane in the list. Enter the same sample description for all
dye colors of a single sample.
5
From the Macro list at the bottom left of the Main window, select
Check GS500.
6
Under the Macro menu, choose Run Macro.
In the plot window that appears, scroll through each sample to verify
that each GeneScan-500 peak (from 75–450 bp) was assigned the
correct size in the GeneScan Analysis Software.
7
From the Macro list at the bottom left of the Main window, select
Kazam.
8
Under the Macro menu, choose Run Macro.
This macro may take a few minutes to run. When it is finished, a plot
window opens with the blue allelic ladder (D8S1179, D21S11,
D7S820, and CSF1PO) and sample allele peaks labeled.
9
Examine data and edit peaks.
10
Print the electropherograms in the plot window by choosing Print
from the File menu.
5-4 Genotyping for the Macintosh OS
To use the AmpFl STR Identifiler Kit Template:
Step
11
(continued)
Action
a. In the Main Window, click the green G button at the top left.
b. From the Views menu, select Show Plot Window.
c. Repeat steps 8 and 9.
12
a. In the Main Window, click the yellow Y button at the top left.
b. From the Views menu, select Show Plot Window.
c. Repeat steps 8 and 9.
13
a. In the Main Window, click the red R button at the top left.
b. From the VIews menu, select Show Plot Window.
c. Repeat steps 8 and 9.
Genotyping for the Macintosh OS 5-5
Examining Data Check that the peaks in the allelic ladder are labeled correctly. Scroll
through the samples below the allelic ladder to examine the peak labels
in each electropherogram.
Peak Labeling
Allele categories (which appear as dark gray bars in the Plot
window) are defined to be ±0.5 bp wide. Peaks that size within
±0.5 bp of an allele category will have a label indicating the allele
designation.
Note
The categories for TH01 alleles 9.3 and 10 are ± 0.4 bp wide.
Peaks that do not size within an allele category will have a label
indicating “OL Allele?” (off-ladder allele).
The Kazam macro includes a step that removes labels from stutter
peaks by applying a percentage filter. Labels are removed from
peaks that are followed by a (specified percent difference) higher,
labeled peak within 3.25 to 4.75 bp. The specified filter percentages
for these loci are 1861% for TH01, 1983% for TPOX, 987% for
CSF1PO, 1371% for D5S818, 1150% for D13S317, 835% for
D3S1358, 694% for vWA, 580% for FGA, 1120% for D8S1179 and
D7S820, 862% for D16S539, 964% for D21S11, 801% for
D2S1338, 652% for D19S433 and 488% for D18S51. These filter
percentages correspond to the upper-limit stutter percent values
observed for each locus (see Figures 4-4 through 4-7).
A sample allele peak must have been “recognized” by GeneScan
software before it can be recognized by Genotyper software. Thus,
sample allele peaks that are below the PAT that was specified in
the GeneScan software Analysis Parameters cannot be labeled by
Genotyper software.
Also, because no information is imported for peaks that are not
recognized by GeneScan software, such peaks will not align
exactly by size relative to the x-axis size scale in the Genotyper
software plot window.
Peak Editing
Clicking on a labeled peak removes the label. Clicking again on the
same peak defaults to the placement of bp size of that peak. A
dialog box with a field to enter the requested text may be accessed
by Edit menu, set click options. Type the allele designation and/or
desired text, then click OK.
5-6 Genotyping for the Macintosh OS
Plot Window Viewing Options
To zoom in and out on regions of the plot window:
Step
Action
1
Click and drag in a region of an electropherogram in the Plot
window to draw a box around the desired size range (the vertical
size of the box is not important).
2
Type
R (hold down the command key and type the letter R) to
zoom in.
3
Type
H to zoom out completely.
To view electropherograms from more than one dye color in the Plot
window:
Step
Action
1
Under the Views menu, choose Show Dye/Lanes Window.
2
Click on the desired Dye/lane rows.
Note Hold down the Shift key on the keyboard to select multiple
adjacent Dye/lane rows. Hold down the Command (
) key to
select Dye/lane rows that are not adjacent.
3
Under the Views menu, choose Show Plot Window.
Making Tables Three macros for making tables are included in the AmpFl STR
Identifiler Kit Template. They are:
a. Make Allele Table
b. Make CODIS Table
c. 310: Make Table
Two of these tables, Make Allele Table and Make CODIS Table, are
very simple and contain only Sample Info and genotype data. The other
table, 310: Make Table contains additional information.
The contents and unique features of each table are described below. All
four of the tables have two features in common:
A locus that has no labeled peaks will have zeros in the cells of the
table for that locus.
Loci that have homozygous alleles will have the allele designation
indicated twice in the table.
Genotyping for the Macintosh OS 5-7
Make Allele Table
This table has Sample Info in the first column, and allele designations
for each locus in columns 2–23. The first two labeled peaks within each
locus appear in the table.
Make CODIS Table
This table has Sample Info in the first column, locus name in the second
column, and allele designations in columns 3–4. This alternative table is
to facilitate laboratories that will be importing data into the Combined
DNA Index System (CODIS).
310: Make Table
This table can be used if the data was generated on the ABI PRISM 310
Genetic Analyzer. This table has Sample Info in the first column,
Sample Comment in the second column, locus name in the third
column, and allele designations in columns 4–7. Four columns are
provided for allele designations to accommodate mixed samples. The
first four labeled peaks within each locus appear in the table. The
remaining five table columns are as follows:
Overflow: If more than two peaks are labeled at one locus, the text
“> two labels” will appear in this column.
Low Signal: If the height of any peak at a locus is greater than the
PAT specified in the GeneScan Analysis Parameters but less than
150 RFU, the text “< 150 RFU” will appear in this column.
Saturation: If the raw data signal for any peak at a locus is greater
than 8191 RFU, the text “310: off-scale” will appear in this column.
Edited Label: The text “Edited” will appear in this column for any
loci where the peak labels were edited manually. For example,
clicking on an unlabeled peak in the Plot window to add a label
constitutes an edit.
Edited Row: The text “Edited” will appear in this column for any
rows in the table that contain table cells that have been edited after
initial creation of the table.
IMPORTANT Before making a table, all electropherograms should be
examined and their peaks edited as described in the previous section.
To create and use tables:
Step
Action
1
From the Macro list at the bottom of the Genotyper software Main
Window, click on one of the three table macros.
2
From the Macro menu, choose Run Macro.
5-8 Genotyping for the Macintosh OS
To create and use tables:
Step
(continued)
Action
3
Under the Views menu, select Show Table Window to view the
table in full screen mode.
4
For all tables except the Make Allele Table:
Clicking in a cell of the table causes the corresponding sample
electropherogram to appear in the plot window, as follows:
5
a.
Click on any cell in the table. This causes this locus region of
the corresponding electropherogram to appear in the Plot
window for that sample.
b.
Zoom out (
H) to view all loci for a particular dye color for
the corresponding sample.
To edit the cells of the table:
a.
Click in a cell of the table that contains an allele designation.
b.
From the Edit menu, select Edit Cell
c.
Type the desired information in the box and click OK.
6
Print the table by selecting Print from the File menu.
7
Optional: From the Table menu, select Export to File to save the
table as a Microsoft Excel-readable document.
8
From the File menu, select Save to save the template file with data.
Genotyping for the Macintosh OS 5-9
Understanding the AmpFl STR Identifiler Kit Template
Troubleshooting
Automated To Troubleshoot Automated Genotyping:
Genotyping Observation
Probable Cause
Recommended Action
Warning
message: “Could
not complete
‘Run Macro’
command
because no
dye/lanes are
selected”.
The word
“ladder” is not in
Sample Info for
the lane or
injection of allelic
ladder.
Type the word Ladder in Sample
Info.
Warning
message: “Could
not complete
‘Run Macro’
command
because the
labeled peak
could not be
found”.
One or more
peaks in the
allelic ladder are
below the Peak
Amplitude
Threshold that
was specified in
the GeneScan
software Analysis
Parameters.
Use another allelic ladder in the
project, or
The word Ladder must be entered
for each dye color (Blue, Green,
Yellow, and Red) in Sample Info for
the AmpFlSTR Identifiler Allelic
Ladder sample.
a.
In the GeneScan Analysis
Software, lower the Peak
Amplitude Threshold values
for Blue, Green, Yellow and
Red dye colors in the Analysis
Parameters.
b.
Reanalyze the sample file(s)
containing the allelic ladder.
c.
Import all sample files into a
new Genotyper software
project, and run the Kazam
macro again.
About This Kit This section describes the organization and functionality of the
Template AmpFl STR Identifiler Kit Template. Read this section for a greater
understanding of the macros and steps that are used in the AmpFl STR
Identifiler Kit Template.
Categories In the Genotyper software, each allele is defined by a category. Each
category contains information about the allele size, size range, and dye
color. To view the list of categories in the AmpFl STR Identifiler
Template, choose Show Categories window, under the View menu. The
categories for each locus are listed together under the locus name. The
locus is called a group.
In the Categories window, each locus actually has two sets of
categories. For example, the D3S1358 locus has one list of categories
under the group “D3S1358” and another list of categories under the
5-10 Genotyping for the Macintosh OS
group “D3S1358.os.” The categories in the D3S1358 group are allele
categories and are used for allele assignment.
Offset Categories As noted above, the offset values are determined automatically by the
Calculate [locus] Offsets macros. These macros use the offset
categories (categories with an “.os” suffix) to find the allele peaks in the
allelic ladder and to determine the correct offset values for each allele
category.
Finding and recognizing the Leftmost (first) Allele Peak in Each Allelic
Ladder
Identification of the leftmost peak is accomplished through the
specifications of the first “.os” category listed within each group of
offset categories. This first “.os” category (12.os in the case of
D3S1358) is specified to find all peaks in a range of ±7 bp around
the reference size for the indicated allele.
Each Calculate [locus] Offsets macro applies a percentage filter to
all peaks in the ±7-bp range in the allelic ladder. This avoids the first
stutter peak in each allelic ladder and thus identifies the first allele
peak as the leftmost peak.
Calculating the Offset Values
Categories with the “.os” suffix are called offset categories and are
described below.
The base pair size indicated in each category is a “reference size.” One
main function of the macros in the AmpFl STR Identifiler Template is to
offset the reference sizes relative to the sizes obtained for the alleles in
the allelic ladder. These offset steps are performed by the Calculate
[locus] Offsets macros, located in the Macro list of the Genotyper
software Main window. After the macros are run, the calculated offset
values are indicated in parentheses near the end of each category line
in the Categories window.
An example of how to interpret the offset values is given here for
D3S1358 allele 14. The reference size for this allele is 122 bp. On a
particular ABI PRISM 310 injection, the size obtained for D3S1358 allele
14 was 119.06 bp. The offset value is calculated as
119.06 – 122 = –2.94. In this example, the actual category size used for
allele assignment is 119.06 (equals 122–2.94), which is the size of the
D3S1358 allele 14 in this particular injection of the allelic ladder. In
other words, the category sizes used for genotyping are equivalent to
the allele sizes obtained in the lane or injection of allelic ladder.
Genotyping for the Macintosh OS 5-11
Applying the Appropriate Offset Value to Each Allele in Succession
Once the leftmost allele peak in each allelic ladder is identified, the
offset value determined for this allele is applied to the relevant allele(s)
in the allele categories.
For example, assume that the offset value determined by the 12.os
category in the D3S1358.os group is –3.01 for a particular lane or
injection of allelic ladder. This offset value is then applied to the allele
12 category in the D3S1358 group, thus setting the correct offset value
for allele 12.
In order for the software to find the next allele peak in the D3S1358
allelic ladder (allele 13), the offset value for the 12.os allele is also
applied to the 13.os category. The result of this operation is that the
13.os category size will be 4 bp longer than the 12.os category. In other
words, allele 13 is expected to be found at a size that is 4 bp longer
than allele 12.
To maximize the ease of peak recognition, the size width for most offset
categories is ±1 bp, as compared to the allele categories, which have a
width of ±0.5 bp. Once allele 13 is recognized in the D3S1358 allelic
ladder, the correct offset value is calculated and assigned to the
appropriate categories.
This process of peak recognition, offset calculation, and offset
assignment is carried out for each of the alleles in each of the allelic
ladders.
Off-Ladder Alleles In the previous example, the 12.os offset value (-3.01) is also applied to
and Virtual Alleles two other categories in the D3S1358 group: “OL Allele?” and allele 11.
The OL Allele? category is specified to span the range of known
D3S1358 alleles and is intended to catch off-ladder alleles that do not
size within one of the allele categories.
Allele 11 in this case is a “virtual” allele category, meaning that this
allele is not present in the allelic ladder. The virtual category exists to
assign an allele designation to allele 11, which is a known allele not
included in the allelic ladder.
Because allele 11 is specified to have the same offset value as
allele 12, the allele category sizes for these two alleles will differ by
exactly 4 bp, which is the same as the difference in their reference
sizes. Specifying a size for allele 11 that is 4 bp shorter than allele 12 is
generally expected to be a reasonable estimate since alleles 11 and 12
differ by a single repeat unit (4 bp).
5-12 Genotyping for the Macintosh OS
The D3S1358 group also contains virtual allele categories for other
alleles, such as 15.2 and 20. The offset value for allele 15.2 is specified
to be the same as for allele 15. In this case, since reference sizes for
these two alleles differ by 2 bp, the category size used for allele 15.2
will be 2 bp longer than for allele 15. Likewise, the offset for allele 20 is
specified to be the same as for allele 19, so the allele category size for
allele 20 will be 4 bp longer than for allele 19.
Many of the loci in the Categories window contain virtual allele
categories. For example, the FGA locus contains a virtual category for
many 2-bp length variants.
Kazam Macro The Kazam macro is the top level macro that contains all of the
instructions and steps necessary for determination of genotypes
relative to the allelic ladder. Kazam references the Calculate [locus]
Offsets macros for each locus, and contains further instructions to label
peaks at each locus and to filter (remove labels from) the stutter peaks.
The various steps in Kazam can be viewed in the Genotyper software
by clicking on the Kazam line in the Macro list, and then choosing Show
Step window, under the View menu.
Filtering Stutter Peaks
To illustrate the steps involved in filtering the stutter peaks, consider
again the example of the D3S1358 locus:
To filter stutter peaks:
Step
Action
1
In the Step Window for the Kazam macro, scroll down to the line
that reads “Select category: D3S1358”.
2
Five rows below, click on the line that reads “Remove labels from
peaks followed by a 835% higher, labeled peak within 3.25 to
4.75 bp”.
Genotyping for the Macintosh OS 5-13
To filter stutter peaks:
Step
3
Action
From the Macro menu, choose Edit Step.
In the Filter Labels window that appears, there are four options
(check boxes) for filtering. In this example, the filtering option for
D3S1358 is denoted in the last check box. This filtering option
includes another check box that reads “(higher by at least 835%).”
For each labeled peak (e.g. peak A) in the locus size range, this
filtering option examines the very next (i.e. greater in bp size)
labeled peak (peak B). The label will be removed from peak A if
peak B meets both of the specified criteria:
a. peak B is higher by at least 835%
b. peak B is within 3.25 to 4.75 bp
The percentage value in this filtering option is calculated as follows:
[(peak B – peak A) / peak A] x 100 = percentage value
For example, if peak A = 175 RFU and peak B = 2500 RFU, then
the percentage value is calculated as follows:
[(2500 – 175) / 175] x 100 = 1329%
In this example, the label will be removed from peak A, provided
that the filter option specifies a threshold of 835% and that peak B
is within 3.25 to 4.75 bp of peak A.
Conventionally, percent stutter is calculated as described below:
(peak A / peak B) x 100 = percent stutter
The percentage value that is used in the Genotyper software
filtering option (F) can be derived from the conventional percent
stutter expression (S) as follows:
F = (10,000 / S) – 100
For example, if the desired stutter percent threshold for D3S1358 is
11%, then the percentage value that should be used in the
Genotyper software filtering option is:
F = (10,000 / 11) – 100 = 835%
4
To use a filter value different than 835% for D3S1358, simply input
another value.
5
Click Replace.
The peak filtering that is included in the Kazam macro is intended only
as a tool and guideline. Final conclusions should be based on careful
examination of the STR profiles.
5-14 Genotyping for the Macintosh OS
Kazam The standard Kazam macro is written so that a different filter threshold
(20% Filter) can be used for each locus (the steps for each locus are written
separately in the macro). The Kazam macro thus provides maximum
flexibility and the opportunity to customize the filter that is used for each
locus.
A different version of the Kazam macro called “Kazam (20% filter)” is
also provided in the Macro list. This macro is simpler than the Kazam
macro in that a 20% stutter filtering step is specified for all loci. To view
the various steps in the Kazam (20% filter) macro, click on the Kazam
(20% filter) line in the Macro list, and then choose “Show Step Window”
from the “Views” menu. The first filter step for this macro (which applies
to the sample alleles) reads, “Remove labels from peaks whose height
is less than 20% of the highest peak in a category’s range.”
Note that this particular option does not include any condition regarding
the bp size of the filtered peak relative to a higher peak. Indeed, this
second filtering option will remove labels from all peaks that are less
than a specified percentage of the highest peak observed anywhere in
the locus range.
To edit the filter value:
Step
Action
1
Click on this step in the Step window.
2
Choose Edit Step from the Macro menu.
Note This macro uses the second filter option in the Filter Labels
window.
3
If desired, change the value from 20% to some other value
4
Click Replace.
The Kazam (20% filter) macro is provided as an option for laboratories
that would like to use one general filter value for all loci. This macro can
also be used when a high level of filtering specificity is not required, as
in the typing of single source samples, e.g., database samples.
Modifying the The original AmpFl STR Identifiler Template File can be modified so
Template that the changes made to the macros or settings are used as the
default:
To modify the template:
Step
1
Action
Close all Genotyper windows, but do not quit the application.
Genotyping for the Macintosh OS 5-15
To modify the template:
Step
Action
2
Find the AmpFlSTR Identifiler Kit Template icon. Click on the
icon to select it.
3
From the File menu, select Get Info.
4
a. Deselect the check box for Stationery pad at the bottom of the
window.
b. Close the Get Info window.
5
Open the AmpFl STR Identifiler Kit Template by double-clicking
on its icon.
6
Make any desired changes.
7
Save the template file by choosing Save from the File menu.
8
Repeat steps 2 and 3.
9
a. Select the check box for Stationery pad at the bottom of the
window.
b. Close the Get Info window.
5-16 Genotyping for the Macintosh OS
Determining Genotypes
AmpFl STR The AmpFl STR® Identifiler™ Allelic Ladder contains the most common
Identifiler Allelic alleles for each locus. Genotypes are assigned by comparing the sizes
Ladder obtained for the unknown samples with the sizes obtained for the
alleles in the allelic ladder.
Additional alleles have been included in the AmpFl STR Identifiler
Allelic Ladder for the FGA, D18S51, D21S11,TH01, and vWA loci
compared to those included for these same loci in other AmpFl STR
kits.
The macro size ranges include the actual number of nucleotides
contained in the smallest and largest allelic ladder alleles for each
locus, as well as those alleles reported in STRBase
(www.cstl.nist.gov/div831/strbase) as of September 2000. The size
range also includes 3´ A nucleotide addition and any shifts due to
non-nucleotide linkers (Grossman et al., 1994 and Baron et al., 1996).
The non-nucleotide linkers enable reproducible positioning of the alleles
to facilitate inter-locus spacing. The loci which incorporate these
non-nucleotide linkers are as follows: CSF1PO, D2S1338, D13S317,
D16S539 and TPOX. The AmpFl STR Identifiler PCR Amplification Kit
is designed so that a majority of the PCR products contain the
non-templated 3´ A nucleotide. The alleles have been named in
accordance with the recommendations of the DNA Commission of the
International Society for Forensic Haemogenetics (ISFH) (DNA
Recommendations, 1994; Bar et al., 1997).
The number of complete four base pair repeat units observed is
designated by an integer. Variant alleles that contain a partial repeat
are designated by a decimal followed by the number of bases in the
partial repeat. For example, an FGA 26.2 allele contains 26 complete
repeat units and a partial repeat unit of two base pairs.
Genotyping for the Macintosh OS 5-17
Additional variation has been seen at some loci where alleles exist that
differ from integer allele lengths by one or three base pairs. For
example, D21S11 allele 33.1 contains 33 complete repeat units and
one nonconsensus base pair. Likewise, a D21S11 29.3 allele contains
29 complete repeat units and a partial 3-bp unit (Moller et al., 1994; Gill
et al., 1997).
A Genotyper software electropherogram of the AmpFl STR Identifiler
Allelic Ladder listing the designation for each allele is shown in
Figure 5-1.
Figure 5-1 Genotyper® software plot of the AmpFl STR Identifiler Allelic Ladder, indicating the
designation for each allele. These results were obtained on an ABI PRISM 310 Genetic Analyzer
5-18 Genotyping for the Macintosh OS
Genotyping Using
the AmpFl STR
Identifiler Allelic
Ladder
When interpreting AmpFl STR Identifiler kit results, genotypes are
assigned to sample alleles by comparison of their sizes to those
obtained for the known alleles in the AmpFl STR Identifiler Allelic
Ladder. Genotypes, not sizes, are used for comparison of data between
runs, instruments, and laboratories.
We strongly recommend that laboratories use an AmpFl STR Identifiler
Allelic Ladder from each project to convert the allele sizes to genotypes.
The main reasons for this approach are:
The size values obtained for the same sample can differ between
instrument platforms because of differences in the type and
concentration of the gel/polymer matrices and in electrophoretic
conditions.
Sizes may differ between protocols for the same instrument
platform because of differences in gel or polymer concentration, run
temperature, gel or capillary thickness, and well-to-read length.
Slight procedural and reagent variations between gels or between
single and multiple capillaries result in greater size variation than
that found between samples on the same gel or between samples
injected in the same capillary in a single run.
Size Standard
The GeneScan-500 LIZ Size Standard should be used with the
AmpFl STR Identifiler kit. Common alleles for all AmpFl STR Identifiler
kit loci are less than 400 base pairs. The recommended sizing method,
Local Southern, utilizes two internal lane size standard peaks larger
than each allele and two smaller than each allele to be sized. Thus,
when size standard peaks are defined in routine analyses, inclusion of
the 400 base pair and 450 base pair peaks in the GeneScan-500 LIZ
Size Standard is recommended.
The internal lane size standard is run with every sample (AmpFl STR
Identifiler kit PCR products and AmpFl STR Identifiler Allelic Ladder)
and is used to normalize lane-to-lane or injection-to-injection migration
differences, thereby providing excellent sizing precision within a gel or
within a set of capillary injections. Size windows based on the allelic
ladder are used to assign allele designations to the samples. The
procedure for running the allelic ladder and determining genotypes is
described on the following page.
Genotyping for the Macintosh OS 5-19
Analyzing AmpFl STR Identifiler Allelic Ladder
To size the AmpFl STR Identifiler Allelic Ladder alleles:
Step
1
Action
Analyze the lanes/injections containing allelic ladder using the
same parameters used for samples.
Results
To compare the lanes or injections of AmpFl STR Identifiler Allelic
Ladder:
Step
Action
1
Compare the base pair sizes of one lane or injection of allelic ladder
to those obtained for the other lanes or injections of allelic ladder.
All corresponding peaks (peaks at the same position in the allelic
ladder) should be within ±0.5 bp of each other.
2
If one or more corresponding peaks are not within ±0.5 bp of each
other: check the GeneScan-500 LIZ Size Standard peaks in all
allelic ladder lanes or injections to confirm that all GeneScan-500
LIZ Size Standard peaks have been assigned the correct size
and/or that all peaks are clearly resolved.
Genotyping Samples Manually
To manually genotype samples:
Step
1
Action
Select one lane or injection of allelic ladder to use for genotyping.
Note Our studies have shown that it does not matter which lane
or injection of allelic ladder is selected if the alleles in the allelic
ladder samples are within ±0.5 bp of each other.
2
Compare the base pair size obtained for each sample allele peak to
the sizes obtained for the allelic ladder peaks.
3
Assign genotypes to those sample allele peaks falling within
±0.5 bp of the corresponding allelic ladder peak. The allele
designation for each allelic ladder peak is given in Figure 5-1 on
page 5-18.
The AmpFl STR Identifiler Allelic Ladder contains the majority of alleles
for the Amelogenin, CSF1PO, D2S1338, D3S1358, D5S818, D7S820,
D8S1179, D13S317,D16S539, D18S51, D19S433, D21S11, FGA,
TH01, TPOX and vWA loci. However, alleles not found in the
5-20 Genotyping for the Macintosh OS
AmpFl STR Identifiler Allelic Ladder do exist. These “off-ladder” alleles
may contain full and/or partial repeat units. An “off-ladder” allele should
flag itself by not falling inside the ±0.5 bp window of any known allelic
ladder allele.
Note
If a sample allele peak is found to be ≥0.5 bp from the corresponding
allelic ladder peak, then the sample must be rerun to verify the result.
Genotyping for the Macintosh OS 5-21
Technical Support
A
A
Contacting You can contact Applied Biosystems for technical support by telephone
Technical Support or fax, by e-mail, or through the Internet. You can order Applied
Biosystems user documents, MSDSs, certificates of analysis, and other
related documents 24 hours a day. In addition, you can download
documents in PDF format from the Applied Biosystems Web site
(please see the section “To Obtain Documents on Demand” following
the telephone information below).
To Contact Contact technical support by e-mail for help in the following product
Technical Support areas:
by E-Mail
Product Area
E-mail address
Genetic Analysis
[email protected]
Sequence Detection Systems and
PCR
[email protected]
Protein Sequencing,
Peptide and DNA Synthesis
[email protected]
Biochromatography
PerSeptive DNA, PNA and
[email protected]
Peptide Synthesis systems
FMAT™ 8100 HTS System
CytoFluor® 4000 Fluorescence
Plate Reader
Voyager™Mass Spectrometers
Mariner™ Mass Spectrometers
Applied Biosystems/MDS Sciex
[email protected]
Chemiluminescence (Tropix)
[email protected]
Technical Support A-1
Hours for In the United States and Canada, technical support is available at the
Telephone following times:
Technical Support
To Contact
Technical Support
by Telephone or
Fax
Product
Hours
Chemiluminescence
8:30 a.m. to 5:30 p.m. Eastern Time
Framingham support
8:00 a.m. to 6:00 p.m. Eastern Time
All Other Products
5:30 a.m. to 5:00 p.m. Pacific Time
In North America
To contact Applied Biosystems Technical Support, use the telephone or
fax numbers given below. (To open a service call for other support
needs, or in case of an emergency, dial 1-800-831-6844 and press 1.)
Product or
Product Area
Telephone
Dial...
Fax
Dial...
ABI PRISM® 3700 DNA
Analyzer
1-800-831-6844,
then press 8
1-650-638-5981
Fluorescent Fragment
Analysis (includes
GeneScan® applications)
1-800-831-6844,
then press 2, then 3
1-650-638-5981
Integrated Thermal Cyclers
(ABI PRISM ® 877 and
Catalyst 800 instruments)
1-800-831-6844,
then press 2, then 4
1-650-638-5981
ABI PRISM ® 3100 Genetic
Analyzer
1-800-831-6844,
then press 2, then 6
1-650-638-5981
Peptide Synthesis (433 and
43X Systems)
1-800-831-6844,
then press 3, then 1
1-650-638-5981
Protein Sequencing
(Prociseâ Protein
Sequencing Systems)
1-800-831-6844,
then press 3, then 2
1-650-638-5981
PCR and Sequence
Detection
1-800-762-4001,
then press 1 for
1-240-453-4613
PCR,
2 for the 7700, 7900
or 5700,
6 for the 6700
or dial
1-800-831-6844, then
press 5
A-2 Technical Support
Product or
Product Area
Telephone
Dial...
Fax
Dial...
Voyagerä MALDI-TOF
1-800-899-5858,
then press 1, then 3
1-508-383-7855
Biochromatography
(BioCADâ Workstations and
POROSâ Perfusion
Chromatography Products)
1-800-899-5858,
then press 1, then 4
1-508-383-7855
Expediteä Nucleic acid
Synthesis Systems
1-800-899-5858,
then press 1, then 5
1-508-383-7855
Peptide Synthesis
(Pioneerä and 9050 Plus
Peptide Synthesizers)
1-800-899-5858,
then press 1, then 5
1-508-383-7855
PNA Custom and Synthesis
1-800-899-5858,
then press 1, then 5
1-508-383-7855
FMATä 8100 HTS
1-800-899-5858,
then press 1, then 6
1-508-383-7855
Chemiluminescence
(Tropix)
1-800-542-2369 (U.S.
1-781-275-8581
LC/MS
Applied Biosystems/MDS
Sciex
1-800-952-4716
1-650-638-6223
Telephone
Dial...
Fax
Dial...
Biospectrometry
Marinerä ESI-TOF Mass
Spectrometry
Workstations
System
Cytofluorâ 4000
Fluorescence Plate
Reader
only),
or 1-781-271-0045
Outside North America
Region
Africa and the Middle East
Africa (English Speaking)
and West Asia (Fairlands,
South Africa)
27 11 478 0411
27 11 478 0349
Africa (French Speaking;
Courtaboeuf Cedex,
France)
33 1 69 59 85 11
33 1 69 59 85 00
South Africa
(Johannesburg)
27 11 478 0411
27 11 478 0349
Technical Support A-3
Region
Middle Eastern Countries
and North Africa (Monza,
Italia)
Telephone
Dial...
Fax
Dial...
39 (0)39 8389 481
39 (0)39 8389 493
Eastern Asia, China, Oceania
Australia (Scoresby,
Victoria)
61 3 9730 8600
61 3 9730 8799
China (Beijing)
86 10 64106608 or
86 800 8100497
86 10 64106617
Hong Kong
852 2756 6928
852 2756 6968
India (New Delhi)
91 11 653 3743/3744
91 11 653 3138
Korea (Seoul)
82 2 593 6470/6471
82 2 593 6472
Malaysia (Petaling Jaya)
60 3 79588268
603 79549043
Singapore
65 896 2168
65 896 2147
Taiwan (Taipei Hsien)
886 2 2358 2838
886 2 2358 2839
Thailand (Bangkok)
66 2 719 6405
66 2 319 9788
Austria (Wien)
43 (0)1 867 35 75 0
43 (0)1 867 35 75 11
Belgium
32 (0)2 532 4484
32 (0)2 582 1886
Czech Republic and
Slovakia (Praha)
420 2 35365189
420 2 35364314
Denmark (Naerum)
45 45 58 60 00
45 45 58 60 01
Finland (Espoo)
358 (0)9 251 24 250
358 (0)9 251 24 243
France (Paris)
33 (0)1 69 59 85 85
33 (0)1 69 59 85 00
Germany (Weiterstadt)
49 (0) 6150 101 0
49 (0) 6150 101 101
Hungary (Budapest)
36 (0)1 270 8398
36 (0)1 270 8288
Italy (Milano)
39 (0)39 83891
39 (0)39 838 9492
Norway (Oslo)
47 23 12 06 05
47 23 12 05 75
Poland, Lithuania, Latvia,
and Estonia (Warszawa)
48 (22) 866 40 10
48 (22) 866 40 20
Portugal (Lisboa)
351 (0)22 605 33 14
351 (0)22 605 33 15
Russia (Moskva)
7 502 935 8888
7 502 564 8787
South East Europe (Zagreb,
Croatia)
385 1 34 91 927/838
385 1 34 91 840
Spain (Tres Cantos)
34 (0)91 806 1210
34 (0)91 806 1206
Sweden (Stockholm)
46 (0)8 619 4400
46 (0)8 619 4401
Switzerland (Rotkreuz)
41 (0)41 799 7777
41 (0)41 790 0676
Europe
A-4 Technical Support
Telephone
Dial...
Fax
Dial...
The Netherlands
(Nieuwerkerk a/d IJssel)
31 (0)180 392400
31 (0)180 392409 or
31 (0)180 392499
United Kingdom
(Warrington, Cheshire)
44 (0)1925 825650
44 (0)1925 282502
All other countries not listed
(Warrington, UK)
44 (0)1925 282481
44 (0)1925 282509
Region
Japan
Japan (Hacchobori,
Chuo-Ku, Tokyo)
81 20 477392 (Toll
81 20 477120 (Toll
free) or
free) or
81 3 5566 6230
81 3 5566 6507
Latin America
To Reach
Technical Support
Through the
Internet
Caribbean countries,
Mexico, and Central
America
52 55 35 3610
52 55 66 2308
Brazil
0 800 704 9004 or
55 11 5070 9654
55 11 5070 9694/95
Argentina
800 666 0096
55 11 5070 9694/95
Chile
1230 020 9102
55 11 5070 9694/95
Uruguay
0004 055 654
55 11 5070 9694/95
We strongly encourage you to visit our Web site for answers to
frequently asked questions and for more information about our
products. You can also order technical documents or an index of
available documents and have them faxed or e-mailed to you through
our site. The Applied Biosystems Web site address is
http://www.appliedbiosystems.com/techsupp
To submit technical questions from North America or Europe:
Step
Action
1
Access the Applied Biosystems Technical Support Web site.
2
Under the Troubleshooting heading, click Support Request Forms,
then select the relevant support region for the product area of
interest.
3
In the Personal Assistance form, enter the requested information and
your question, then click Ask Us RIGHT NOW.
4
In the Customer Information form, enter the requested information
and your question, then click Ask Us RIGHT NOW.
Within 24 to 48 hours, you will receive an e-mail reply to your
question from an Applied Biosystems technical expert.
Technical Support A-5
To Obtain Free, 24-hour access to Applied Biosystems technical documents,
Documents on including MSDSs, is available by fax or e-mail or by download from our
Demand Web site.
To order
documents...
Then...
by index
number
a. Access the Applied Biosystems Technical Support Web
site at
http://www.appliedbiosystems.com/techsupp
b. Click the Index link for the document type you want,
then find the document you want and record the index
number.
c. Use the index number when requesting documents
following the procedures below.
by phone for
fax delivery
a. From the U.S. or Canada, call 1-800-487-6809, or
from outside the U.S. and Canada, call 1-858-712-0317.
b. Follow the voice instructions to order the documents
you want.
Note
through the
Internet for fax
or e-mail
delivery
There is a limit of five documents per request.
a. Access the Applied Biosystems Technical Support Web
site at
http://www.appliedbiosystems.com/techsupp
b. Under Resource Libraries, click the type of document
you want.
c. Enter or select the requested information in the
displayed form, then click Search.
d. In the displayed search results, select a check box for
the method of delivery for each document that matches
your criteria, then click Deliver Selected Documents Now
(or click the PDF icon for the document to download it
immediately).
e. Fill in the information form (if you have not previously
done so), then click Deliver Selected Documents Now to
submit your order.
Note There is a limit of five documents per request for
fax delivery but no limit on the number of documents you
can order for e-mail delivery.
To Obtain
Customer
Training
Information
A-6 Technical Support
The Applied Biosystems Training web site at
www.appliedbiosystems.com/techsupp/training.html
provides course descriptions, schedules, and other training-related
information.
Troubleshooting
Overview
B
B
About This Troubleshooting information addresses possible causes of a number of
Appendix certain observations. By following the recommended actions, these
observations described in this appendix may be further understood
and/or eliminated.
In This Appendix Appendix B contains the following topics:
Topic
See Page
Overview
B-1
Troubleshooting
B-2
Troubleshooting B-1
Troubleshooting
Observation
Possible Causes
Recommended Actions
Faint or no signal from
both the AmpFl STR®
Control DNA 9947A
and the DNA test
samples at all loci.
Incorrect volume or absence of
either AmpFlSTR® PCR Reaction
Mix, AmpFlSTR Identifiler™ Primer
Set, or AmpliTaq Gold® DNA
Polymerase.
Repeat amplification.
No activation of AmpliTaq Gold
DNA Polymerase.
Repeat amplification, making sure
to hold reactions initially at 95 °C for
11 min.
PCR Master Mix not vortexed
thoroughly before aliquoting.
Vortex PCR Master Mix thoroughly.
AmpFlSTR Identifiler Primer Set
exposed to too much light.
Store Primer Set protected from
light.
GeneAmp® PCR System
malfunction.
Refer to the thermal cycler user’s
manual and check instrument
calibration.
Incorrect thermal cycler
parameters.
Check the protocol for correct
thermal cycler parameters.
Tubes not seated tightly in the
thermal cycler during amplification.
Push reaction tubes firmly into
contact with block after first cycle.
Repeat test.
GeneAmp PCR System 9600
heated cover misaligned.
Align GeneAmp 9600 heated cover
properly so that white stripes align
after twisting the top portion
clockwise.
Wrong PCR reaction tube.
Use Applied Biosystems MicroAmp
Reaction Tubes with Caps for the
GeneAmp 9600 and 9700.
MicroAmp® Base used with
tray/retainer set and tubes in
GeneAmp 9600 and 9700.
Remove MicroAmp Base from
tray/retainer set and repeat test.
Insufficient PCR product
electrokinetically injected.
For ABI PRISM® 310 runs:
Degraded formamide.
B-2 Troubleshooting
Mix 1.5 µL of PCR product and
24.5 µ L of Hi-Di™
Formamide/GeneScan™-500 LIZ™
solution.
Check the storage of formamide; do
not thaw and re-freeze multiple
times. Try Hi-Di™ Formamide.
Observation
Possible Causes
Recommended Actions
Positive signal from
AmpFlSTR Control
DNA 9947A but no
signal from DNA test
samples
Quantity of test DNA sample is
below assay sensitivity
Quantitate DNA and add
0.5–1.25 ng of DNA. Repeat test.
Test sample contains PCR inhibitor
(e.g., heme compounds, certain
dyes)
Quantitate DNA and add minimum
necessary volume. Repeat test.
Test sample DNA is degraded
If possible, evaluate the quality of
DNA sample by running an agarose
gel. If DNA is degraded, re-amplify
with an increased amount of DNA.
Dilution of test sample DNA in H2O
or wrong buffer (e.g., wrong EDTA
concentration)
Re-dilute DNA using TE Buffer
(with 0.1-mM EDTA).
Presence of exogenous DNA
Use appropriate techniques to
avoid introducing foreign DNA
during laboratory handling.
Too much DNA in reaction
Use recommended amount of
template DNA (0.5–1.25 ng).
Mixed sample
See Chapter 4, “Experiments and
Results.”
More than two alleles
present at a locus
Amplification of stutter product
(n-4 bp position)
Wash the sample in a
Centricon®-100. Repeat test.
Incomplete 3´ A base addition
(n-1 bp position)
See Chapter 4, “Experiments and
Results.” Be sure to include the
final extension step of 60 °C for 60
min in the PCR.
Signal exceeds dynamic range of
instrument (off-scale data).
Quantitate DNA and re-amplify
sample, adding 0.5–1.25 ng of
DNA.
Poor spectral separation (bad
matrix).
Follow the steps for creating a
matrix file.
Confirm that Filter Set G5 modules
are installed and used for analysis.
Some but not all loci
visible on
electropherogram
Test sample DNA is degraded
If possible, evaluate the quality of
DNA sample by running an agarose
gel. If DNA is degraded, re-amplify
with an increased amount of DNA.
Test sample contains PCR inhibitor
(e.g., heme compounds, certain
dyes)
Quantitate DNA and add minimum
necessary volume. Repeat test.
Wash the sample in a
Centricon-100. Repeat test.
Troubleshooting B-3
Observation
Possible Causes
Recommended Actions
ABI PRISM 310 Genetic Analyzer
Data was not
automatically analyzed
Sample sheet not completed
Complete sample sheet as
described.
Injection list not completed
Complete injection list as
described.
Preferences not set correctly in
ABI PRISM ® 310 Data Collection
Software
In Preferences under the Window
menu, select Injection List
Defaults and the Autoanalyze
checkbox.
Extra peaks visible
when sample is known
to contain DNA from a
single source
Incomplete denaturation before
loading onto detection instrument
Heat samples to 95 °C for 3 min in
deionized formamide solution.
Snap cool on ice. Use Genetic
Analyzer 0.5-mL Sample Tubes
and a thermal cycler.
Current too high
Decomposition of urea in the
POP-4™ polymer solution
Add fresh POP-4 polymer solution
to the syringe.
Incorrect buffer concentration
Replace buffer with 1X Genetic
Analyzer Buffer.
No 1X Genetic Analyzer buffer
Refill buffer vials with 1X Genetic
Analyzer buffer.
Pump block channel blockage
Remove and clean block. Refer to
the ABI PRISM 310 Genetic
Analyzer User’s Manual.
Loose valve fittings or syringe
Tighten valve fittings and syringe.
Capillary not flush with electrode
Tape capillary securely to heat
plate. Refer to the ABI PRISM 310
Genetic Analyzer User’s Manual
(P/N 903565).
Electrode bent
Check calibration of autosampler.
Capillary misaligned with electrode
Align capillary and electrode.
No PCR product added
Add 1.5-µL PCR product to
formamide/GeneScan-500 LIZ
mixture.
Capillary bent out of sample tube
Align capillary and electrode.
Recalibrate autosampler.
Autosampler not calibrated
correctly
Calibrate autosampler in X, Y, and
Z directions.
PCR product not at bottom of tube
Spin sample tube in
microcentrifuge.
Air bubble at bottom of sample tube
Spin tube in microcentrifuge to
remove air bubbles.
Sealed sample tube septum
Replace septum.
No current
No signal
B-4 Troubleshooting
Observation
Possible Causes
Recommended Actions
Low signal
PCR product added to
non-deionized formamide
Always use deionized formamide
for sample preparation. Verify
conductivity is < 30-µ siemens.
PCR product not mixed well with
formamide/GeneScan-500 LIZ
mixture
Mix PCR product with
formamide/GeneScan-500 LIZ
mixture by pipetting up and down
several times.
Excess salt in sample
Do not concentrate PCR product by
evaporation. Use Centricon-100 if
necessary.
Too much DNA in sample
Treat and dilute the PCR product.
Bad water
Use autoclaved or freshly prepared
deionized water.
Incorrectly prepared and/or old
solutions
Replace buffer and polymer with
fresh solutions.
Runs get progressively
slower, i.e., size
standard peaks come
off at higher and higher
scan numbers
Leaking syringe: polymer is not
filling capillary before every
injection
Clean syringe thoroughly.
Runs get progressively
faster, i.e., size
standard peaks come
off at lower and lower
scan numbers
Water in syringe
Prime syringe with small volume of
polymer and discard. Fill syringe
with polymer.
High baseline
Dirty capillary window
Clean capillary window with 95%
ethanol.
Capillary moved out of position in
laser window.
Position capillary in front of laser
window.
Cracked capillary
Replace the capillary
Loss of resolution after
100 bp
Replace syringe.
Troubleshooting B-5
Laboratory Setup
Overview
C
C
About This This appendix provides some references for laboratories preparing to
Appendix implement PCR technology. Careful planning and design of the
laboratory, and training of all laboratory personnel, are necessary to
ensure that exogenous DNA and PCR products are confined to
designated areas.
In This Appendix Appendix C contains the following topics:
Topic
See Page
Overview
C-1
Lab Design
C-2
Laboratory Setup C-1
Lab Design
Sensitivity of PCR Many resources are available for the appropriate design of a PCR
laboratory. If you are using the Identifiler kit for forensic DNA testing,
you may want to refer to http://www.ojp.usdoj.gov/nij/scidocs.htm,
“Forensic Laboratories: Handbook for Facility Planning, Design,
Construction and Moving.” If you are using the Identifiler kit for
parentage DNA testing, you may want to refer to the “Standards for
Parentage Testing Laboratories.” The sensitivity of the AmpFl STR®
Identifiler™ PCR Amplification Kit (and other PCR-based tests) permits
amplification of minute quantities of DNA. This necessitates precautions
to avoid contamination of samples yet to be amplified (Kwok and
Higuchi, 1989).
While contamination of amplified DNA with unamplified DNA (genomic
DNA) does not pose a problem, ordinary precautions, such as changing
pipet tips between samples, should be taken when handling and
analyzing PCR product. These precautions should prevent
cross-contamination between samples of amplified DNA.
Care should be taken while handling and processing samples to
prevent chance contamination by human DNA. Gloves should be worn
at all times and changed frequently. Sample tubes should be closed
when not in use. Dispersal of aerosols should be limited through careful
handling of sample tubes and reagents.
Applied Biosystems does not intend these references for laboratory
design to constitute all precautions and care necessary using PCR
technology.
Extra precautions and care should be taken during DNA extraction and
PCR setup to prevent transfer of DNA from one sample to another. Use
a new, filter-plugged pipet tip for each sample, open tubes carefully, and
keep sample tubes closed when not in use. Applied Biosystems does
not intend these references for laboratory design to constitute all
precautions and care necessary when using PCR technology.
C-2 Laboratory Setup
DNA Extraction
Protocols
D
Overview
D
About This Appendix D describes some extraction methods for various DNA
Appendix samples.
In This Appendix Appendix D contains the following topics:
Topic
See Page
Overview
D-1
Introduction
D-2
Collection and Storage of Samples for DNA Extraction
D-3
DNA Extraction Protocols D-1
Introduction
Overview of DNA Many DNA extraction procedures have been developed. Both manual
Sample Types and automated extraction procedures can be further divided into
organic and non-organic procedures. Depending upon the material
received, the scientist will need to determine which procedure is
appropriate for each piece of evidence.
DNA for PCR amplification and analysis using the AmpFl STR®
Identifiler™ PCR Amplilfication Kit may be extracted from fresh or
frozen whole blood, peripheral blood lymphocytes, blood stains, sperm
cells, paraffin blocks, teeth, hair, tissue, bone, and other biological
samples.
DNA Extraction There are numerous procedures that are currently being used for DNA
Methods extraction. Some of these extraction procedures include Chelex®,
phenol-chloroform and FTA™ paper. Regardless of the method used
for DNA extraction, all samples must be handled carefully to prevent
sample-to-sample contamination or contamination by extraneous DNA.
Also, when possible, we recommend that the samples should be
processed at a separate time from reference samples.
Phenol-Chloroform Method
The phenol-chloroform method removes proteins and other cellular
components from nucleic acids, resulting in relatively purified DNA
preparations. This method results in double-stranded DNA that is
suitable for AmpFl STR Identifiler kit amplifications. DNA extracted by
the phenol-chloroform method is also suitable for RFLP analysis
provided it is not significantly degraded. This method is also
recommended when extracting DNA from relatively large samples (i.e.,
when the amount of DNA in a sample is expected to be greater than
100 ng).
Chelex Method
The Chelex method of DNA extraction is more rapid than the
phenol-chloroform method. It involves fewer steps, resulting in fewer
opportunities for sample-to-sample contamination. This method
produces single-stranded DNA that is suitable for AmpFl STR Identifiler
kit amplification. DNA extracted with Chelex cannot be used for RFLP
analysis.
D-2 DNA Extraction Protocols
FTA Paper Extraction
The FTA paper extraction begins immediately when blood is spotted on
FTA paper. The cells are lysed and the DNA is immobilized within the
matrix of the paper. The DNA is purified by performing a series of
washes, after which the DNA is ready for PCR amplification.
Warnings to Users Read the Material Safety Data Sheet (MSDS) and label warning
furnished by the supplier of each chemical or reagent for the correct
handling and the proper use of protective equipment. For additional
copies of an MSDS call 1-800-327-3002.
Collection and Storage of Samples for DNA Extraction
Proper Collection Storage of various DNA specimens is an essential step to insuring that
the DNA profiles obtained are accurate and meaningful. Proper chain of
custody is vital to maintaining the integrity of each particular specimen.
DNA Extraction Protocols D-3
DNA Quantitation
E
Overview
E
About This This appendix discusses the importance of quantitating DNA samples
Appendix prior to amplification. The QuantiBlot® Human DNA Quantitation Kit is
described and can be used for the quantitation of samples.
In This Appendix Appendix E contains the following topics:
Topic
See Page
Overview
E-1
Importance of Quantitation
E-2
Using the QuantiBlot Kit
E-3
Commonly Asked Questions about the QuantiBlot Kit
E-5
DNA Quantitation E-1
Importance of Quantitation
DNA Quality The DNA quality (degree of degradation), purity, and total quantity in a
sample influences the efficiency of a PCR amplification. Lack of
amplification is usually due to highly degraded DNA, the presence of
PCR inhibitors, insufficient DNA quantity, or any combination of these
factors.
Quantitation and The QuantiBlot Human DNA Quantitation Kit (P/N N808-0114) is an
PCR Amplification ideal method for accurate quantitation of human DNA (Walsh et al.,
1992). If the QuantiBlot kit determines that sufficient DNA is present in
the extracted sample (greater than approximately 0.05-ng/µL
concentration), then lack of amplification is most likely due to PCR
inhibitors or severe degradation of the DNA.
Quantitation of samples shows if there is a sufficient amount of DNA
present for amplification. Also, PCR inhibition can be minimized by
adding the smallest volume of DNA extract necessary for successful
amplification (volume containing approximately 0.5–1.25 ng). Lastly, by
using the minimal volume of extracted DNA for PCR, the number of
different genetic marker tests or repeat analyses that can be performed
is maximized. Likewise, informed decision(s) can be made regarding
typing of samples present in extremely limiting quantities.
DNA quantitation is particularly important for amplifications using the
AmpFl STR® Identifiler™ kit where optimal results are obtained using a
range of 0.5–1.25 ng of input DNA. Adding greater than 1.25 ng of DNA
can result in too much PCR product, such that the dynamic range of the
instrument used to detect and analyze the PCR product is exceeded.
See “Off-Scale Data” on page 3-34 for more details.
E-2 DNA Quantitation
Using the QuantiBlot Kit
How the Kit The method of DNA quantitation using the QuantiBlot Human DNA
Works Quantitation Kit is based on probe hybridization to the human alpha
satellite locus, D17Z1. A biotinylated probe specific for the D17Z1
sequence is hybridized to sample DNA that has been immobilized via
slot blot onto a nylon membrane.
The subsequent binding of horseradish peroxidase/streptavidin enzyme
conjugate (HRP-SA) to the bound probe allows for either colorimetric or
chemiluminescent detection. In the case of colorimetric detection, the
oxidation of 3,3´,5,5´-tetramethylbenzidine (TMB) catalyzed by HRP-SA
results in the formation of a blue precipitate directly on the nylon
membrane.
For chemiluminescent detection, the oxidation of a luminol-based
reagent catalyzed by HRP-SA results in the emission of photons that
are detected on standard autoradiography film. This process is called
enhanced chemiluminescence (ECL).
In both cases, the quantity of sample DNA is determined by comparison
of the sample signal intensity to human DNA standards that have been
calibrated against two DNA controls of known quantity.
The colorimetric method allows for detection and quantitation down to
150 pg. The chemiluminescent method can detect 150 pg with a
15-minute exposure to film and can detect as little as 20 pg with longer
film exposures (3 hours to overnight). Results obtained from various
biological samples using the QuantiBlot Kit are shown in Figure E-1 on
page E-4.
Note For specific procedures, refer to the QuantiBlot Human DNA
Quantitation Kit product insert.
Specificity for One significant advantage offered by the QuantiBlot kit is that the probe
Primate DNA is highly specific for human/primate DNA. When tested, 300-ng
quantities of several non-primate DNA samples (E. coli, yeast, dog, cat,
mouse, rat, pig, cow, chicken, fish, and turkey) were found to give either
no signals or signals that were less than or equal to that obtained for
0.15 ng of human DNA. This high degree of specificity for
human/primate DNA allows for the accurate quantitation of target
human DNA in samples that also contain significant amounts of
microbial or other non-primate DNA.
DNA Quantitation E-3
10 ng
10 ng
5
5
2.5
2.5
1.2
1.2
0.6
0.6
0.3
0.3
0.15
0.15
Figure E-1
QuantiBlot Human DNA Quantitation Kit results (ECL detection)
Single-Stranded Another advantage of the QuantiBlot kit method is that single-stranded
and and/or non-purified DNA samples can be quantitated. DNA samples
Degraded DNA extracted using the Chelex method can be quantitated, as can those
extracted by other methods, including phenol-chloroform, salting out,
and binding to silica particles.
Degraded DNA gives the same results as fully intact DNA over a wide
range of average DNA sizes. However, DNA quantity can be
underestimated when the DNA is extremely degraded. For example,
experimental results indicated that the signal obtained for DNA
degraded to an average size of 500–2000 bp was about half of the
expected intensity.
Extremely degraded DNA usually amplifies less efficiently than intact
DNA, so a greater quantity of degraded DNA may be required to give
the same results as intact DNA.
E-4 DNA Quantitation
Commonly Asked Questions about the QuantiBlot Kit
How Much DNA? How much of the DNA extract should be added to the amplification reaction if a sample gives no signal for the QuantiBlot assay?
As an example, assume that 5 µL of the DNA extract is spotted, and the
lowest DNA standard tested is 150 pg. So, the DNA concentration in
the sample must be less than 150 pg/5 µL or 30 pg/µL. The quantity of
DNA in 10 µL of extract, which is the maximum that can be added to an
AmpFl STR Identifiler kit amplification, would therefore be less than
0.3 ng.
The possible approaches that can be taken for such a sample include
the following:
Attempt amplification using 10 µL of the extract.
Concentrate the sample to a smaller volume using a
Centricon®-100 before amplification.
Multiple Film Is it possible to perform multiple film exposures with the ECL detection
Exposures method?
Yes. In fact, a wise strategy is to perform a 15-minute film exposure
first, which gives sensitivity down to at least 150 pg. Then place the film
on the membrane for 3 hours or as long as overnight. The longer
exposure will give sensitivity down to about 20 pg.
The photon emission kinetics of ECL are such that many exposures can
be taken in a relatively short period of time. The light output is the
greatest in the first hour, gradually decreasing over the next several
hours with a half-life of about 60 minutes. The results of one
experiment, for example, indicated that six exposures could be taken in
the first 2.5 hours of photon emission, with each exposure detecting
80–150 pg of DNA. A seventh exposure with the film on the membrane
overnight was easily able to detect the 80 pg DNA sample.
Sometimes it is beneficial to perform a very short exposure (about
5 minutes) to facilitate quantitation of samples having intense signals in
the range of 5–10 ng DNA.
DNA Quantitation E-5
Repeating the Can the probe be stripped off the membrane so that the QuantiBlot assay
Assay can be repeated if a mistake is made during the hybridization/detection
steps?
Yes, for the ECL method. This procedure can be used with the TMB
method only if no blue precipitate was deposited on the membrane.
The procedure is as follows:
Step
Action
1
Heat 150 mL of the Wash Solution (1.5X SSPE, 0.5% SDS) to
approximately 90 °C in a glass bowl.
2
Take the Wash Solution off the heat source and place the nylon
QuantiBlot membrane (containing the spotted samples) into the
solution.
3
Rotate on an orbital shaker at room temperature for 20 min.
4
Remove the membrane from the Wash Solution.
IMPORTANT Do not let the QuantiBlot membrane dry out at any
time.
5
Begin the QuantiBlot kit protocol starting at the hybridization step
(refer to the QuantiBlot Human DNA Quantitation Kit product
insert).
Performing Is it possible to spot the samples onto the membrane and then perform the
Hybridization and hybridization and detection steps at a later time?
Detection at a Yes. Proceed as follows:
Later Time
Step
Action
1
Immediately after spotting the samples onto the membrane, place
the membrane in 100 mL of 5X SSPE (without SDS).
2
Store at 2–6 °C protected from light.
3
Resume the protocol beginning with the pre-hybridization step
(Section 4.1 in the QuantiBlot Human DNA Quantitation Kit product
insert).
For best sensitivity, resume the protocol within 24 hr.
E-6 DNA Quantitation
References
F
F
Akane, A., Matsubara, K., Nakamura, H., Takahashi, S., and Kimura, K.
1994. Identification of the heme compound copurified with
deoxyribonucleic acid (DNA) from bloodstains, a major inhibitor of
polymerase chain reaction (PCR) amplification. J. Forensic Sci.
39:362–372.
American Association of Blood Banks. 1999. Standards for Parentage
Testing Laboratories.
Amorin, A., Alves, C., Gusmao. L. 2000. Somatic and Germinal
Mutations in STRs. Progress in Forensic Genetics 8, Eds. G.F.
Sensabaugh, et al; Elsevier Science; pp. 37–39.
Andersen, J.F., Greenhalgh M.J., Butler, H.R., Kilpatrick, S.R., Piercy,
R.C., Way, K.A., Myhill, H.S., Wright, J.C., Hallett, R., and Parkin, B.H.
1996. Further validation of a multiplex STR system for use in routine
forensic identity testing. Forensic Sci. Int. 78:47–64.
Bär, W., Brinkmann, B., Budowle, B., Carracedo, A., Gill, P., Lincoln, P.,
Mayr, W., and Olaisen, B. 1997. DNA recommendations. Further report
of the DNA Commission of the ISFH regarding the use of short tandem
repeat systems. Intl. J. Legal Med. 110:175–176.
Barber, M.D., Piercy, R.C., Andersen, J.F., and Parkin, B.H. 1995.
Structural variation of novel alleles at the Hum vWA and Hum FES/FPS
short tandem repeat loci. Intl. J. Legal Med. 108:31–35.
Barber, M.D., McKeown, B.J., and Parkin, B.H. 1996. Structural
variation in the alleles of a short tandem repeat system at the human
alpha fibrinogen locus. Intl. J. Legal Med. 108:180–185.
Barber, M.D., and Parkin, B.H. 1996. Sequence analysis and allelic
designation of the two short tandem repeat loci D18S51 and D8S1179.
Intl. J. Legal Med. 109:62–65.
Baron, H., Fung, S., Aydin,A., Bahring,S., Luft, F.C., Schuster,H.1996.
Oligonucleotide ligation assay (OLA) for the diagnosis of familial
hypercholesterolemia. Nat Biotechnol.14(10):1279-82.
References F-1
Begovich, A.B., McClure, G.R., Suraj, V.C., Helmuth, R.C., Fildes, N.,
Bugawan, T.L., Erlich, H.A., and Klitz, W. 1992. Polymorphism,
recombination, and linkage disequilibrium within the HLA Class II
region. J. Immunol. 148:249–258.
Brinkmann, B., Moller, A., and Wiegand, P. 1995. Structure of new
mutations in 2 STR systems. Int. J. Legal Med. 107:201–203.
Brinkmann, B., Junge, A., Meyer, E., and Wiegand, P. 1998. Population
genetic diversity in relation to microsatellite heterogeneity. Hum. Mutat.
11:135–144.
Brinkmann, B., Klintschar, M., Neuhuber, F., Huhne, J., and Rolf, B.
1998. Mutation rate in human microsatellites: Influence of the structure
and length of the tandem repeat. Am. J. Hum. Genet. 62:1408–1415.
Brown, A.H.D., Feldman, M.W., and Nevo, E. 1980. Multilocus structure
of natural populations of Hordeum spontaneum. Genetics 96:523–536.
Budowle, B. et al. 1995. D1S80 population data in African-Americans,
Caucasians, Southeastern Hispanics, Southwestern Hispanics, and
Orientals. J. Forensic Sci. 40:38–44.
Budowle, B. et al. 1998a. CODIS and PCR-Based Short Tandem
Repeat Loci: Law Enforcement Tools. Second European Symposium
on Human Identification. 73-88.
Budowle, B., Baechkel, F., Fejeren, R. 1998b. Polymarker, HLA-DQAQ,
and D1S80 allele frequency data in Chamorro and Filipino populations
from Guam. Journal Forensic Science. 43(6):1195-1198.
Budowle, B., DeFenbaugh, D.A., Keys, K.M. 2000. Genetic variation at
nine short tandem repeat loci in Chammorros and Filipinos. Legal
Medicine. 2(1):26-30.
Buel, E., Wang, G., and Schwartz, M. 1995. PCR amplification of
animal DNA with human X-Y amelogenin primers used in gender
determination. J. Forensic Sci. 40:641–644.
Buel, E., Schwartz, M.B., and LaFountain, M.J.1998. Capillary STR
analysis: Comparison to gel-based systems. J. Forensic Sci.
43(1):164–170.
Buel, E., LaFountain, M., Schwartz, M., and Walkinshaw, M. 2001
Evaluation of capillary electrophoresis performance through resolution
measurements. J. Forensic Sci. 46(2):341–345.
Butler, J. 2001. Forensic DNA Typing. Academic Press. San Diego, CA.
Chakraborty, R., Smouse, P.E., and Neel, J.V. 1988. Population
amalgamation and genetic variation: observations on artificially
F-2 References
agglomerated tribal populations of Central and South America. Am. J.
Hum. Genet. 43:709–725.
Chakraborty, R., Fornage, M., Guegue, R., and Boerwinkle, E. 1991.
Population genetics of hypervariable loci: analysis of PCR based VNTR
polymorphism within a population. In: Burke, T., Doif, G., Jeffreys, A.J.,
and Wolff, R., eds. DNA Fingerprinting: Approaches and Applications.
Birkhauser Verlag, Berlin, pp. 127–143.
Chakraborty, R., and Stivers, D.N. 1996. Paternity exclusion by DNA
markers: effects of paternal mutations. J. Forensic Sci. 41:671–677.
Chakraborty, R., Stivers, D., and Zhong, Y. 1996. Estimation of
mutation rates from parentage exclusion data: applications to STR and
VNTR loci. Mutat. Res. 354:41–48.
Chakraborty, R., Kimmel, M., Stivers, D., Davison, L., and Deka, R.
1997. Relative mutation rates at di-, tri-, and tetranucleotide
microsatellite loci. Proc. Natl. Acad. Sci. USA 94:1041–1046.
Clark, J.M. 1988. Novel non-templated nucleotide addition reactions
catalyzed by prokaryotic and eukaryotic DNA polymerases. Nucleic
Acids Res. 16:9677–9686.
Comey, C.T., Koons, B.W., Presley, K.W., Smerick, J.B., Sobieralski,
C.A., Stanley, D.M., and Baechtel, F.S. 1994. DNA extraction strategies
for amplified fragment length polymorphism analysis. J. Forensic Sci.
39:1254–1269.
Cone, R.W., and Fairfax, M.R. 1993. Protocol for ultraviolet irradiation
of surfaces to reduce PCR contamination. PCR Methods Appl.
3:S15–S17.
Cotton, E., Allsop, R., Guest, J., Frazier,R., Koumi, P., Callow. I.,
Seager, A., and Sparkes, R. 2000. Validation of the AmpFl STR® SGM
Plus™ system for use in forensic casework. Forensic Sci. Int.
112(2–3):151–161.
D2S1338. Cooperative Human Linkage Center (CHLC) accession
number 41445. GenBank accession number G08202.
D16S539. Cooperative Human Linkage Center (CHLC) accession
number 715. GenBank accession number G07925.
D19S433 Cooperative Human Linkage Center (CHLC) accession
number 135. GenBank accession number G08036.
DeFranchis, R., Cross, N.C.P., Foulkes, N.S., and Cox, T.M. 1988. A
potent inhibitor of Taq DNA polymerase copurifies with human genomic
DNA. Nucleic Acids Res. 16:10355.
References F-3
DNA Advisory Board, Federal Bureau of Investigation, U.S. Department
of Justice. 1998. Quality assurance standards for forensic DNA testing
laboratories.
DNA Recommendations. 1994. Report concerning further
recommendations of the DNA Commission of the ISFH regarding
PCR-based polymorphisms in STR (short tandem repeat) systems. Intl.
J. Legal Med. 107:159–160.
Edwards, A., Civitello, A., Hammond, H., and Caskey, C. 1991. DNA
typing and genetic mapping with trimeric and tetrameric tandem
repeats. Am. J. Hum. Genet. 49:746–756.
Edwards, A., Hammond, H.A., Lin, J., Caskey, C.T., and Chakraborty,
R. 1992. Genetic variation at five trimeric and tetrameric tandem repeat
loci in four human population groups. Genomics 12:241–253.
Fitzco Inc. Product Bulletin. Procedure for the processing of blood
samples spotted on FTA™ paper for PCR amplification. Maple Plain,
MN.
Frank, W.E. and Llewellyn, B.E. 1999. A time course study on STR
profiles derived from human bone, muscle, and bone marrow. J.
Forensic Sci. 44(4):778–782.
Frégeau, C.J., and Fourney, R.M. 1993. DNA typing with fluorescently
tagged short tandem repeats: a sensitive and accurate approach to
human identification. Biotechniques 15:100–119.
Fregeau, C.J., Leclair, B., Bowen, K., Elliott, J., Borys, S., and Fourney,
R. 2000. The Swissair Flight 111 disaster: Short tandem repeat
mutations observed. Progress in Forensic Genetics 8, Eds. G.F.
Sensabaugh, et al; Elsevier Science; pp. 40–42.
Fregeau, C.J., Germain, O., and Fourney, R.M. 2000. Fingerprint
enhancement revisited and the effects of blood enhancement
chemicals on subsequent Profiler Plus™ fluorescent short tandem
repeat DNA analysis of fresh and aged bloody fingerprints. J. Forensic
Sci. 45(2):354–380.
Gill, P., Urquart, A., Millican, E., Oldroyd, N., Watson, S., Sparkes, R.,
and Kimpton, C.P. 1996. A new method of STR interpretation using
inferential logic—development of a criminal intelligence database. Int. J.
Leg. Med. 109:14–22.
Gill, P., d’Aloja, E., Andersen, J., Dupuy, B., Jangblad, M., Johnsson,
V., Kloosterman, A.D., Kratzer, A., Lareu, M.V., Meldegaard, M.,
Phillips, C., Pfitzinger, H., Rand, S, Sabatier, M., Scheithauer, R.,
Schmitter, H., Schneider, P., and Vide, M.C. 1997. Report of the
F-4 References
European DNA Profiling Group (EDNAP): an investigation of the
complex STR loci D21S11 and HUMFIBRA (FGA).
Grossman, P.D., Bloch, W., Brinson, E., Chang, C.C., Eggerding, F.A.,
Fung, S., Iovannisci, D.M., Woo, S., Win-Deen, E.S.1994. High-density
miltiplex detection of nucleic acid sequences: oligonucleotide ligation
assay and sequence-coded separation. Nucleic Acids Res.
22(21):4527-34.
Guo, S.W., and Thompson, E.A. 1992. Performing the exact test of
Hardy-Weinbergproprtion for multiple alleles. Biometrics 48:361–372.
Hartl, D.L., and Clark, A.G. 1989. Principles of population genetics, 2nd
edition. Sunderland, MA: Sinauer Associates, Inc.
Hammond, H., Jin, L., Zhong, Y, Caskey, C., and Chakraborty, R.
1994. Evaluation of 13 short tandem repeat loci for use in personal
identification applications. Am. J. Hum. Genet. 55:175–189.
Holt, C., Stauffer, C., Wallin, J., Lazaruk, L., Nguyen, T., Budowle, B.,
and Walsh, P. 2000. Practical applications of genotypic surveys for
forensic STR testing. Forensic Sci. Int. 112(2,3):91–109.
Holt, C. et al. 2001. TWGDAM validation of AmpFlSTR PCR
Amplification Kits for Forensic DNA Casework. Journal of Forensic
Sciences; in press.
Karlin, S., Cameron, E.C., and Williams, P.T. 1981. Sibling and parent
offspring correlation estimation with variable family size. Proc. Natl.
Acad. Sci. (USA) 78:2664–2668.
Kimpton, C., Walton, A., and Gill, P. 1992. A further tetranucleotide
repeat polymorphism in the vWF gene. Hum. Mol. Genet. 1:287.
Kimpton, C.P., Gill, P., Walton, A., Urquhart, A., Millican, E.S., and
Adams, M. 1993. Automated DNA profiling employing multiplex
amplification of short tandem repeat loci. PCR Methods Appl. 3:13–22.
Kimpton, C.P., Oldroyd, N.J., Watson, S.K., Frasier, R.R.E., Johnson,
P.E., Millican, E.S., Urquhart, A., Sparkes, R.L., and Gill, P. 1996.
Validation of highly discriminating multiplex short tandem repeat
amplification systems for human identification. Electrophoresis
17:1283–1293.
Kinsey, P., and Hormann, S. 2000. Modification of the stutter position
label-filtering macro in the PE Biosystems Genotyper® Version 2.5
software package: Resolution of stutter-filter back talk. Forensic
Science Communications 2(3).
References F-5
Kwok, S., and Higuchi, R. 1989. Avoiding false positives with PCR.
Nature 339:237–238.
Lazaruk, K., Walsh, P.S., Oaks, F., Gilbert, D. Rosenblum, B.B.,
Menchen, S. Scheibler, D. Wenz, H.M., Holt, C., and Wallin, J. 1998.
Genotyping of forensic short tandem repeat (STR) systems based on
sizing precision in a capillary electrophoresis instrument.
Electrophoresis 19(1):86–93.
Lazaruk, K. et al. 2001. Sequence variation in humans and other
primates at six short tandem repeat loci used in forensic identity testing.
Forensic Science International 119 (1): 1–12.
Lareu, M.-V., Barral, S., Salas, A., Rodriguez, M., Pestoni, C., and
Carracedo, A. 1998. Further exploration of new STRs of interest for
forensic genetic analysis. In: Olaisen, B., Brinkmann, B., and Lincoln,
P.J., eds. Progress in Forensic Genetics 7: Proceedings of the 17th
International ISFH Congress, Oslo 2-6 September 1997. Elsevier,
Amsterdam, pp. 192–200.
Leclair, B., Fregeau, C.J., Bowen, K.L., Borys, S.B., Elliott, J., and
Fourney, R.M. 2000. Enhanced kinship analysis and STR-based DNA
typing for human identification in mass disasters. Progress in Forensic
Genetics 8, Eds. G.F. Sensabaugh, et al; Elsevier Science; pp. 46–48.
Li, H., Schmidt, L., Wei, M.-H., Hustad, T., Lerman, M.I., Zbar, B., and
Tory, K. 1993. Three tetranucleotide polymorphisms for loci: D3S1352;
D3S1358; D3S1359. Hum. Mol. Genet. 2:1327.
Liu, C.Y., Takayanagi, K., Asamura, H., Ota, M., Fukushima, H., 2000.
Study on ACTBP2 Mutations in Japanese. Progress in Forensic
Genetics 8, Eds. G.F. Sensabaugh, et al; Elsevier Science; pp. 46–48.
Luna, L.G., ed. Manual of Histologic Staining Methods of the Armed
Forces Institute of Pathology, McGraw-Hill Book Co., New York (1968).
Magnuson, V.L., Ally, D.S., Nylund, S.J., Karanjawala, Z.E., Rayman,
J.B., Knapp, J.I., Lowe, A.L., Ghosh, S., and F.S. Collins (1996)
Substrate nucleotide-determined non-templated addition of adenine by
Taq DNA polymerase: Implications for PCR-based genotyping and
cloning. BioTechniques 21:700–709.
Mancuso, D.J., Tuley, E.A., Westfield, L.A., Worrall, N.K.,
Shelton-Inloes, B.B., Sorace, J.M., Alevy, Y.G., and Sadler, J.E. 1989.
Structure of the gene for human von Willebrand factor. J. Biol. Chem.
264:19514–19527.
Mansfield, E.S., Robertson, J.M., Vainer, M., Isenberg, A.R., Frazier,
R.R., Ferguson, K., Chow, S., Harris, D.W., Barker, D.L., Gill, P.D.,
Budowle, B., and McCord, B.R. 1998. Analysis of multiplexed short
F-6 References
(STR) systems using capillary array electrophoresis. Electrophoresis
19(1):101–107.
Meyer, E., Wiegand, P., Rand, S., Kuhlmann, D., Brack, M., and
Brinkmann, B. 1995. Microsatellite polymorphisms reveal phylogenetic
relationships in primates. J. Mol. Evol. 41(1):10–4.
Mills, K.A., Even, D., and Murray, J.C. 1992. Tetranucelotide repeat
polymorphism at the human alpha fibrinogen locus (FGA). Hum. Mol.
Genet. 1:779.
Möller, A., Meyer, E., and Brinkmann, B. 1994. Different types of
structural variation in STRs: HumFES/FPS, HumVWA, and
HumD21S11. Intl. J. Legal Med. 106:319–323.
Möller, A., and Brinkmann, B. 1995. PCR-VNTRs (PCR—Variable
Number of Tandem Repeats) in forensic science. Cell. Molec. Biol.
41:715–724.
Momhinweg, E., Luckenbach, C., Fimmers, R., and Ritter, H. 1998.
D3S1358: sequence analysis and gene frequency in a German
population. Forensic Sci. Int. 95:173–178.
Nakahori, Y., Takenaka, O., and Nakagome, Y. 1991. A human X-Y
homologous region encodes "amelogenin." Genomics 9:264–269.
National Research Council. 1996. The evaluation of forensic DNA
evidence. National Academy Press, Washington, D.C.
Nei, M., and Roychoudhury, A.K. 1974. Sampling variances of
heterozygosity and genetic distance. Genetics 76:379–390.
Nei, M. 1978. Estimation of average heterozygosity and genetic
distance from a small number of individuals. Genetics 89:583–590.
Oldroyd, N.J., Urquhart, A.J., Kimpton, C.P., Millican, E.S., Watson,
S.K., Downes, T., and Gill, P.D. 1995. A highly discriminating octoplex
short tandem repeat polymerase chain reaction system suitable for
human individual identification. Electrophoresis 16:334–337.
Oppitz, E. 1969. Eine neue farbemethode zum nachweis der spermein
bei sittlichkeitsdelicten. Arch Kriminol 144:145–148.
Prince, A.M., and Andrus, L. 1992. PCR—How to kill unwanted DNA.
Biotechniques 12:358.
Puers, C., Hammond, H., Jin, L., Caskey, C., and Schumm, J. 1993.
Identification of repeat sequence heterogeneity at the polymorphic short
tandem repeat locus HUMTH01 [AATG]n and reassignment of alleles in
population analysis using a locus-specific allelic ladder. Am. J. Hum.
Genet. 53:953–958.
References F-7
Sambrook, J., Fritsch, E.F., and Maniatis, T., eds. 1989. Molecular
Cloning: A Laboratory Manual, 2nd Edition, Volume 2. Cold Spring
Harbor Laboratory Press, New York, pp. E10–E14.
Sensabaugh, G.F. 1982. Biochemical markers of individuality. In:
Saferstein, R., ed. Forensic Science Handbook. Prentice-Hall, Inc.,
New York, pp. 338–415.
Sensabaugh G.F., von Beroldingen C. The polymerase chain reaction:
application to the analysis of biological evidence. In: Farley, MA,
Harrington, JJ, editors. Forensic DNA Technology. Michigan: Lewis,
1991:63–82.
Sharma, V., and Litt, M. 1992. Tetranucleotide repeat polymorphism at
the D21S11 locus. Hum. Mol. Genet. 1:67.
Singer-Sam, J., and Tanguay, R. 1989. Use of Chelex to improve the
PCR signal from a small number of cells. Amplifications 3:11.
Smith, R.N. 1995. Accurate size comparison of short tandem repeat
alleles amplified by PCR. Biotechniques 18:122–128.
Sparkes, R., Kimpton, C., Gilbard, S., Carne, P., Andersen, J., Oldroyd,
N., Thomas, D. Urquhart, A., and Gill, P. 1996. The validation of a
7-locus multiplex STR test for use in forensic casework (II) Artefacts,
casework studies and success rates. Int. J. Legal Med. 109:195–204.
Sparkes, R., Kimpton, C., Watson, S., Oldroyd, N., Clayton, T., Barnett,
L., Arnold, J., Thompson, C. Hale, R., Chapman, J., Urquhart, A., and
Gill, P. 1996. The validation of a 7-locus multiplex STR test for use in
forensic casework (I) Mixtures, ageing, degradation and species
studies. Int. J. Legal Med. 109:186–194.
Straub, R.E., Speer, M.C., Luo, Y., Rojas, K., Overhauser, J., Ott, J.,
and Gilliam, T.C. 1993. A microsatellite genetic linkage map of human
chromosome 18. Genomics 15:48–56.
Sullivan, K.M., Mannucci, A., Kimpton, C.P., and Gill, P. 1993. A rapid
and quantitative DNA sex test: fluorescence-based PCR analysis of
X-Y homologous gene amelogenin. Biotechniques 15:636–641.
Sweet, D., and Hildebrand, D. 1999. Saliva from cheese bite yields
DNA profile of burglar: A case report. Int. J. Legal Med. 112(3):201-203.
Szibor, R., Lautsch, S., Plate, I., Bender, K., and Krause, D. 1998.
Population genetic data of the STR HumD3S1358 in two regions of
Germany. Int. J. Legal Med. 111:160–161.
Tanaka, M., Yoshimoto, T., Nozawa, H., Ohtaki, H., Kato, Y., Sato, K.,
Yamamoto, T., Tamaki, K., and Katsumata, Y. 2000. Usefulness of a
F-8 References
toothbrush as a source of evidential DNA for typing. J. Forensic Sci.
45(3):674–676.
Technical Working Group on DNA Analysis Methods. 1995. Guidelines
for a quality assurance program for DNA analysis. Crime Lab. Digest
22:21–43.
Urquhart, A., Oldroyd, N.J., Kimpton, C.P., and Gill, P. 1995. Highly
discriminating heptaplex short tandem repeat PCR system for forensic
identification. Biotechniques 18:116–121.
U.S. Department of Health and Human Services. 1993. Biosafety in
Microbiological and Biomedical Laboratories, 3rd edition, U.S.
Government Printing Office.
U.S. Department of Health and Human Services. OSHA Bloodborne
Pathogen Standard 29 CFR, part 1910.1030.
Wallin, J., Buoncristiani, M., Lazaruk, K., Fildes, N., Holt, C., and
Walsh, P. 1998. TWGDAM validation of the AmpFlSTR Blue PCR
Amplification Kit for forensic casework analysis. J. Forensic Sci.
43(4):854–870.
Wallin, J. et al. 2001.Constructing universal multiplex PCR systems for
comparative genotyping. Journal of Forensic Sciences; in press.
Walsh, P.S., Metzger, D.A., and Higuchi, R. 1991. Chelex 100 as a
medium for simple extraction of DNA for PCR-based typing from
forensic material. Biotechniques 10:506–518.
Walsh, P.S., Erlich, H.A., and Higuchi, R. 1992. Preferential PCR
amplification of alleles: mechanisms and solutions. PCR Methods Appl.
1: 241–250.
Walsh, P.S., Varlaro, J., and Reynolds, R. 1992. A rapid
chemiluminescent method for quantitation of human DNA. Nucleic
Acids Res. 20:5061–5065.
Walsh, P.S., Fildes, N.J., and Reynolds, R. 1996. Sequence analysis
and characterization of stutter products at the tetranucleotide repeat
locus vWA. Nucleic Acids Res. 24:2807–2812.
Watson, S., Kelsey, Z., Webb, R., Evans, J., and Gill, P. 1998. The
development of a third generation STR multiplex system (TGM). In:
Olaisen, B., Brinkmann, B., and Lincoln, P.J., eds. Progress in Forensic
Genetics 7: Proceedings of the 17th International ISFH Congress, Oslo
2-6 September 1997. Elsevier, Amsterdam, pp. 192–194.
References F-9
Watson, S., Allsop. R., Foreman. L., Kelsey, Z., and Gill.P. 2001.
Sequenced allelic ladders and population genetics of a new STR
multiplex system. Forensic Sci. Int. 115(3):207–217.
Weber, J., and Wong, C. 1993. Mutation of human short tandem
repeats. Hum Mol. Genet. 2:1123–1128.
Weir, B.S. 1996. Genetic data analysis II. Sunderland, MA: Sinauer
Associates, Inc.
Weir, B.S. 1992. Independence of VNTR alleles defined by fixed bins.
Genetics 130:873–887.
Ziegle, J.S., Su, Y., Corcoran, K.P., Nie, L., Mayrand, P.E., Hoff, L.B.,
McBride, L.J., Kronick, M.N., and Diehl, S.R. 1992. Application of
automated DNA sizing technology for genotyping microsatellite loci.
Genomics 14:1026–1031.
F-10 References
Index
A
A nucleotide
addition by AmpliTaq Gold to 3´ end of
amplicon 4-24
ABI PRISM 310 Genetic Analyzer
protocol 3-3 to 3-37
data analysis 3-26 to 3-29
ending the run 3-34
preparing and loading samples 3-22 to
3-23
sample electrophoresis 3-24 to 3-25
setting up a run 3-5 to 3-11
setting up the instrument 3-4 to 3-5
using Performance Optimized Polymer 4 for
analysis 3-2 to 3-34
agarose gel, using to examine DNA 4-35
allele frequencies in the population
databases 4-44 to 4-53
AmpFlSTR Allelic Ladders
calculating precision data using the allelic
ladders 4-7 to 4-17
using to determine genotypes 5-19 to 5-21
AmpFlSTR Identifiler
loci
allele frequencies in the population
databases 4-44 to 4-53
Probability of Exclusion (PE) from
Paternity 4-56
Probability of Identity (PI) 4-55
AmpFlSTR Identifiler Kit Template 5-3 to 5-16
examining data 5-6 to 5-7
making tables 5-7 to 5-9
troubleshooting genotyping 5-10
understanding the template kit 5-10 to 5-16
using the kit 5-4 to 5-5
amplification
differential amplification of loci 4-34
AmpliTaq Gold DNA Polymerase
catalyzing the addition of a 3´ A
nucleotide 4-24
automated genotyping
about the software 5-2
AmpFlSTR Identifiler Kit Template
examining data 5-6 to 5-7
making tables 5-7 to 5-9
troubleshooting genotyping 5-10
understanding the template kit 5-10 to
5-16
using the kit 5-4 to 5-5
AmpFlSTR Identifiler Kit Template 5-3 to
5-16
before running Genotyper 5-2 to 5-3
C
contamination C-2
customer support. See technical support
A-1
D
degraded DNA 4-34 to 4-35
differential amplification
of loci 4-34
DNA
amplification using bloodstained FTA
cards 2-9
effect of DNA quantity on results 2-7 to 2-9,
4-31 to 4-32
extraction protocols D-2 to D-3
collecting and storing samples D-3
how degraded DNA affects which loci
amplify 4-34 to 4-35
mixed samples causing extra peaks 4-38 to
4-41
detecting 4-38 to 4-39
detection limit 4-40 to 4-41
resolving 4-39 to 4-41
quantitation E-2 to E-6
using agarose gel analysis to examine the
DNA 4-35
Documents on Demand A-6
E
effect of DNA quantity on results
effect of inhibitors 4-33 to 4-34
electropherogram
2-7 to 2-9
Index-1
causes for extra peaks 4-40 to 4-41
addition of a 3´ A nucleotide 4-24
DNA from more than one
individual 4-38 to 4-41
stutter peak 4-18 to 4-23
viewing the results 3-30 to 3-32
e-mail, address for technical support A-1
evidence
exclusion of suspects 4-43
extraction protocols D-2 to D-3
collecting and storing samples D-3
F
Five-Dye Analysis 1-2 to 1-5
FTA cards
using bloodstained FTA cards for
amplification 2-9
G
gels
using an agarose gel to examine DNA 4-35
GeneScan Analysis software
viewing results 3-30
GeneScan-500 LIZ Internal Lane Size
Standard 3-22, 3-30, 4-7, 5-19 to 5-20
genetics 4-43 to 4-52
allele frequencies 4-44 to 4-53
populations and samples used in
studies 4-43
probability of identity 4-55
probability of paternity exclusion 4-56
genotype
determining 4-6
AmpFlSTR Allelic Ladders 5-19 to 5-21
calculating precision data using the allelic
ladders 4-7 to 4-17
exclusion of suspects 4-43
resolving in mixed samples 4-40 to 4-41
guidelines
laboratory setup C-1
validation studies 4-2 to 4-36
H
help. See technical support A-2
hematin, effect on DNA samples 4-33 to 4-34
Index-2
I
Internet address
customer training information A-6
Documents on Demand A-6
L
laboratory setup C-1
loci
allele frequencies in the population
databases 4-44 to 4-53
differential amplification 4-34
lack of amplification
effect of DNA quantity on results 4-31
to 4-32
population data 4-43 to 4-53
allele frequencies 4-44 to 4-53
probability of identity 4-55
probability of paternity exclusion 4-56
samples used in studies 4-43
locus. See loci
M
matrix file 3-12
P
PCR
amplification of tetranucleotide STR loci
(stutter peak) 4-18 to 4-23
inhibitor
causing lack of amplification 4-33 to
4-34
minimizing E-2
troubleshooting B-1 to B-5
PCR product
precautions when handling the PCR
product C-2
using too much PCR product E-2
See Also PCR
phenol-chloroform DNA extraction D-2
population
genetics 4-43 to 4-52
allele frequencies 4-44 to 4-53
populations and samples used in the
studies 4-43
Probability of Exclusion (PE) from
Paternity 4-56
probability of identity 4-55
Probability of Identity (PI) 4-55
probability of paternity exclusion 4-56
See Also allele
protocols
ABI PRISM 310 Genetic Analyzer 3-3 to
3-37
data analysis 3-26 to 3-29
ending the run 3-34
preparing and loading samples 3-22 to
3-23
sample electrophoresis 3-24 to 3-25
setting up a run 3-5 to 3-11
setting up the instrument 3-4 to 3-5
using Performance Optimized Polymer 4
for analysis 3-2 to 3-34
DNA extraction D-2 to D-3
collecting and storing samples D-3
Q
QuantiBlot Human DNA Quantitation Kit
commonly asked questions E-5 to E-6
using for quantitation of human DNA E-2
using the kit E-3 to E-4
quantitation E-2 to E-6
commonly asked questions E-5 to E-6
QuantiBlot analysis E-3 to E-4
R
results. See viewing results
S
samples
collecting and storing for extraction of
DNA D-3
DNA from more than one individual 4-38 to
4-41
detecting 4-38 to 4-39
detection limit 4-40 to 4-41
resolving genotypes in mixed
samples 4-40 to 4-41
setting up laboratories. See laboratory setup
STRBase 4-52
stutter peak or product 4-18 to 4-23
T
tables
allele frequencies of AmpFlSTR Identifiler
loci 4-44 to 4-53
precision results from the two instrument
platforms 4-10 to 4-15
troubleshooting B-1 to B-5
technical support A-1 to A-6
e-mail address A-1
Internet address A-5
regional sales offices A-3 to A-5
telephone/fax (North America) A-2
training
obtaining information A-6
troubleshooting B-1 to B-5
automated genotyping 5-10
V
validation of the AmpFl STR Identifiler kit
loci 4-2
kit reproducibility 4-6
minimum sample requirement 4-42
mixed specimen studies 4-42
mode of inheritance 4-27
optimizing PCR components 4-3
thermal cycler parameters 4-4
validation studies
general considerations 4-2 to 4-36
viewing results 3-31 to 3-32
GeneScan Analysis software 3-30
information provided in the
electropherogram 3-30 to 3-32
W
WWW address
Applied Biosystems A-5
Documents on Demand A-6
Index-3
Worldwide Sales Offices
Applied Biosystems vast distribution and service
network, composed of highly trained support and
applications personnel, reaches into 150 countries on
six continents. For international office locations, please
call our local office or refer to our web site at
www.appliedbiosystems.com.
Headquarters
850 Lincoln Centre Drive
Foster City, CA 94404 USA
Phone: +1 650.638.5800
Toll Free: +1 800.345.5224
Fax: +1 650.638.5884
www.appliedbiosystems.com
Applera Corporation is committed to providing the
world’s leading technology and information for life
scientists. Applera Corporation consists of the
Applied Biosystems and Celera Genomics
businesses.
Printed in the USA, 05/2001
Part Number 4323291 Rev. B