1
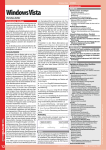
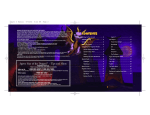
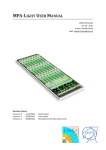
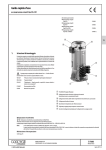
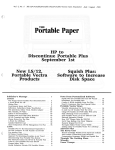
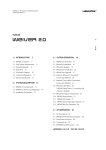
Fatpigdog Industries
Real Time FFT Spectrum Analyzer
User’s Manual
Revision 4.06
March 2013
Copyright 2009-2013, Spyro Gumas
All Rights Reserved
Spectrogram of little girl saying "Uh No"
Fatpigdog Industries
Real Time FFT Spectrum Analyzer
Legal Notice and Disclaimer
Fatpigdog's Real Time FFT Spectrum Analyzer software is intended for hobbyist and
casual use only. It is not a calibrated software instrument, and therefore any results
produced cannot and must not be used to provide quantified spectral and power
measurements for commercial, medical, military, government, or any other official use.
Under no circumstances shall Fatpigdog's Real Time FFT Spectrum Analyzer software be
used in a safety or life critical application.
No warranty is expressed or implied for the operation, usefulness, accuracy, or
appropriateness of Fatpigdog's Real Time FFT Spectrum Analyzer. Neither Spyro
Gumas, Fatpigdog Industries, Blueberry Technology, nor any affiliates or associates shall
be held accountable, responsible, or liable for any consequences resulting from the use of
Fatpigdog's Real Time FFT Spectrum Analyzer software.
License Agreement
The unregistered Free Trial version of the Real Time FFT Spectrum Analyzer may be
freely distributed and used by anyone. There is a nag that appears every few minutes to
remind the user of the right thing to do. Other than the nag, the Trial Version is fully
functional, except restricts the ability to save configuration, default configuration, or
BMP files of the display.
The Registered Professional Version of the Real Time FFT Spectrum Analyzer is
licensed for use only by the person that paid for it and received the Registration Code.
That lucky sole may install the software on up to two machines and even run them
simultaneously ... Waaaa Hoooo. No sharing ... the kids gotta eat.
2
Fatpigdog Industries
Real Time FFT Spectrum Analyzer
1.
SYSTEM REQUIREMENTS................................................................................................................. 4
2.
THE USER INTERFACE. ..................................................................................................................... 5
3.
DESCRIPTION OF FUNCTION BUTTONS AND THEIR SOFT KEYS ........................................................ 7
4.
APPENDIX A - USING PHASE SPECTRUM MODE IN ZERO SPAN ..................................................... 24
5.
APPENDIX B - SWEEP TIME AND RESOLUTION BANDWIDTH ......................................................... 25
6.
TROUBLE SHOOTING ..................................................................................................................... 26
3
Fatpigdog Industries
Real Time FFT Spectrum Analyzer
1. System Requirements
Operating Systems:
Processors:
Windows XP Sk 2 or 3
Intel Pentium 4 and above
Windows Server 2003 SP 2 or R2 Intel Celeron*
Windows Vista SP 1
Intel Xeon
Windows Server 2008
Intel Core
AMD Athlon 64*
AMD Opteron
AMD Sempron*
Hard Disk:
680 MB**
RAM :
512 MB
* Processor must support SSE2 instruction set.
** Disk space requirement varies depending on size of partition. The Runtime
installer will inform you of the hard disk space requirement for your
particular partition. Installation size will be determined by the installer and
can vary for NTFS and FAT formats.
Graphics:
16-, 24-, or 32-bit OpenGL capable graphics adapter
4
Fatpigdog Industries
Real Time FFT Spectrum Analyzer
2. The User Interface.
Pretty self-explanatory. Click on a Function (see Figure 1) button to select category.
(such as Frequency, Amplitude, or Trigger).
Figure 1 - Function Buttons and Soft Keys (F1 thru F6)
For most Function buttons, but not all Function Buttons, function option Soft Key
descriptors will appear on the right hand side boundary of the display. The Soft Keys
(F1, F2, ... F6) are to the right of the descriptors. Some of these Soft Keys will act on
their own, others will require additional input.
5
Fatpigdog Industries
Real Time FFT Spectrum Analyzer
If a Soft Key requires additional numerical value input, the Field Entry box (see Figure 2)
will open up on the left side boundary of the display with the current value already
highlighted and ready to be overwritten. At this point, the user can simply type and the
value will overwrite the existing value in the edit box. This mechanism is provided as a
short cut so the user need not click in the Field Entry box. A Function button may have
some or all of its sub-menu Soft Keys as click-only, no Field Entry required.
Figure 2 - Field Entry Box accepts user numeric input
6
Fatpigdog Industries
Real Time FFT Spectrum Analyzer
3. Description of Function Buttons and their Soft Keys
The user selects a function from one of the Function Buttons provided on the Control
Panel, shown in Figure 3. At that point, Soft Key options may appear on the right side
display boundary, depending on the function selected. A detailed description of each
Function Button and Soft Key follows.
Figure 3 - Control Panel with Function Buttons
Config -
The Config Function provides Soft Keys which the typical user may never
want or need to use. However, these features can be useful for the
advance user.
Tstupid -
When data capture is initiated with the audio capture card in My PC, the
initial gain response is zero, or pretty close to it. My audio card takes
approximately 100 ms for its recording gain to stabilize. Tstupid is an
advance in the amount of time that the spectrum analyzer captures data for
a Single sweep, or for the first sweep of a Free Run. The captured data
7
Fatpigdog Industries
Real Time FFT Spectrum Analyzer
during the Tstupid interval is discarded. The user has access to this
parameter to use at his peril. The default value is 100.
WFSwps -
The default number of sweeps in Waterfall Plot Mode is 100. WFSwps
provides the user with the ability to change the number of sweeps captured
in the time history of the waterfall.
Span/RBW - The default ratio of Span to Resolution Bandwidth (RBW) is 500. This is
the value used in calculating the RBW in auto mode, relative to the
selected span. Span/RBW provides the user with the ability to change this
ratio.
Buffer -
Clicking on the Buffer Soft Key opens up a new Soft Key menu shown in
the following Buffer function section.
Memory -
Clicking on Memory opens up three text fields underneath the display area
(after a spectrum sweep). These three text fields are Max Array, Free
Mem, and Mem Used and are primarily used for debug. The numbers
reported here are in units of MBytes. MaxArray indicates the largest
single consecutive block of memory available for an array, Free Mem is
the number of MB free, and Mem Used is the number of MB currently
used by the spectrum analyzer program.
Version -
This provides a brief text screen with program identification, version, and
copyright info.
Buffer -
The Buffer function does not have its own function button, but instead is
invoked by the Buffer Soft Key under the Config function. However,
once invoked, it has Soft Keys just like other functions do. The Buffer
referred to by this functionality is the audio FIFO (First In First Out)
buffer in the audio card hardware. For those aware of the functioning of
FIFOs, the functionality provided by the Buffer Soft Keys may be of
interest. For the majority of users, the Buffer Soft Keys may be an area to
stay away from. Note that the FIFO buffer is only operational for Live
Input Mode.
ShowFifo -
This causes a FIFO display to appear, showing real time status of the FIFO
usage. The FIFO graphic shows the dynamic FIFO fill status between 0%
to 100% percent. If and when the FIFO is flushed to 0%, this can be
plainly seen.
AgeLimit -
AgeLimit provides, in seconds, the amount of time for which audio may
reside in the FIFO before it is to be considered Stale. Once data is stale,
the FIFO buffer is flushed empty. This can occur when short FFTs are
being executed (fast sweeps) imposing a large computational load on the
processor. Of course, higher performance processors will suffer less than
older, slower processors.
Blk Info -
Clicking on Blk Info opens up three text fields underneath the display area
(after a spectrum sweep). These three text fields are Age Limit, Block
8
Fatpigdog Industries
Real Time FFT Spectrum Analyzer
Size, and Blocks and these are primarily used for debug. Age Limit is the
user specified AgeLimit parameter previously described. Block Size and
Blocks are parameters that the user cannot control, and they are
descriptors of the Digital Acquisition FIFO (First In First Out) Buffer.
The total number of samples in the FIFO is equal to Block Size x Blocks.
The FIFO management subsystem automatically controls these parameters
such that the FIFO never Overflows. It should be noted that for a given
program instantiation (run), these parameters can only grow.
Back -
Takes the menu system back to the Config function screen.
File -
The File function provides the user with the ability to save and recall
customized spectrum analyzer configurations. Configuration files are
saved as type *.fpd.
Recall All -
Recall opens a browser and lets the user select a previously saved
spectrum analyzer configuration file (*.fpd). If the spectrum analyzer is
in Free Run mode before the Recall operation, it will continue in Free Run
after the recall operation. Of course, all of the spectrum analyzer settings
will be in the newly recalled configuration. Note that the saved audio
sample data is also recalled and displayed on the spectrum or waterfall
plot. If the Single function button is pressed before the Recall operation,
then the saved data will available for trace operations, such as Hold or A>B (see Trace function button for trace operations). For example: press
Single, then recall the configuration file, then click Trace, then select the
desired trace (A or B) and select Hold. Then Free run with the other trace
in Write mode. The real time trace can now be compared to the recalled
trace.
Save All -
Save opens a browser and lets the user save the current spectrum analyzer
configuration to a configuration file (*.fpd). If the spectrum analyzer is in
Free Run mode before the Save operation, it will continue in Free Run
after the Save operation. Note that the most recently sampled audio data is
also saved.
Default? -
The Default function is a specialized version of the Save function. The
Default function asks the user to confirm that he wants to save the current
spectrum analyzer configuration as the Default spectrum analyzer
configuration. If a Default spectrum analyzer configuration file exists
(default.fpd) in the startup directory when the Real Time FFT Spectrum
Analyzer program is started, the spectrum analyzer will start up with the
configuration that is defined by the saved default configuration. If the
default.fpd file does not exist, the spectrum analyzer will start up in the
factory default configuration, which is the same configuration that the
Preset function invokes. Note that the most recently sampled audio data
is also saved.
9
Fatpigdog Industries
Real Time FFT Spectrum Analyzer
Save Audio - Save Audio opens a browser and lets the user save the most recently
captured audio samples to an audio WAV file (*.wav). If the spectrum
analyzer is in Free Run mode before the Save Audio operation, it will
continue in Free Run after the Save Audio operation. Saved audio files
can later be used as input data by selecting File Input from the Input
function button.
Save CSV -
Save the currently display data points as a CSV file [The saved data
includes the entire set of data captured and processed in one time update,
regardless of the span setting of the analyzer]. Three columns of data are
written to the CSV file. The left most column matches the Trace A data,
the next column matches the Trace B data, and the third column matches
the DSP or the MATH data, if selected, or Trace A data otherwise. The
type of data represented by the saved data points depends on the selected
mode of the spectrum analyzer, matching the type of data being displayed
by the spectrum analyzer at the time of the Save CSV operation.
SetImage -
SetImage opens a browser and lets the user select a BMP image file that is
used as a background image underlying the spectrum plot. This image is
only used in the Spectrum Plot Mode, not in the Waterfall Plot Mode.
Preset -
The Preset function provides the user with a simple means to restore the
configuration of the spectrum analyzer to the factory default settings,
regardless of the existence of a default.fpd configuration file, and without
necessitating that the program be closed and restarted. When the Preset
function button is pressed, the spectrum analyzer is forced into Run mode.
Frequency - Change center start and or stop frequencies. For Live audio input, the
frequency limits of the spectrum analyzer are between 0 and 22.05 KHz,
determined by ½ of the system’s sample clock frequency (Fs). For File
Input, the sample clock is extracted from the file when it is opened. The
Frequency range of the spectrum analyzer in File Input mode will be from
0 to ½ Fs Hz.
Center -
The Center Frequency (Fc) defines the frequency presented at the center
of spectrum display.
Start -
Start frequency of a displayed Sweep (Far Left)
Stop -
Stop Frequency (Far Right)
Linear -
Select between Linear, Logarithmic, Octave or 1/3 Octave frequency scale
for the horizontal frequency axis when the Spectrum Plot Mode is
selected. This feature is not available on the Waterfall display.
Show -
Show or Hide the horizontal frequency axis labels in Spectrum Plot Mode.
Not available in waterfall Plot Mode..
10
Fatpigdog Industries
Real Time FFT Spectrum Analyzer
Span -
Change the displayed frequency span. For Live audio input, the span
limits of the spectrum analyzer are between 0 and 22.05 KHz, determined
by ½ of the system’s sample clock frequency (Fs). For File Input, the
sample clock is extracted from the file when it is opened. The Span limits
of the spectrum analyzer in File Input mode will be from 0 to ½ Fs Hz.
Span -
Displayed frequencies will range from Center Frequency +/- ½ Span
Full -
Displayed Span will be fullest capability (Fs/2), where Fs default is 44100
Hz.
Zero -
Zero Span. Signal is displayed as a Time / Amplitude plot (Oscilloscope
mode). Note that the signal displayed will be filtered to satisfy the RBW
constraint.
Fine -
For narrow Span settings, The spectrum plot may appear jagged. The user
can select Fine mode (default is off) to generate more points for a
smoother spectral plot on the display. Fine mode may result in a reduce
display update rate. If you experience “Out of Memory” conditions,
restart the program and insure that Fine is off.
Level -
The user enters a reference level for the top grid line of the display.
Division increments of the display can be selected from 10 dB per
division, to 1 dB per division, or linear sampling. It is important to note
that the amplitude levels indicated on the display are relative amplitudes,
resulting from an uncalibrated microphone, amplifier, and analog to digital
converter subsystem. The set Reference level is indicated at the top left
boundary of the display.
Reference -
Sets the signal displayed at the top of the screen, the reference level.
10 dB/div -
Each vertical grid represents 10 dB (default)
5 dB/div -
Each vertical grid represents 5 dB
1 dB/div -
Each vertical grid represents 1 dB
Linear (P) -
The vertical grid represents linear variation of power from Reference
Level down to zero.
Linear (V)-
The vertical grid represents linear variation of voltage from Reference
Level down to negative Reference Level. In this mode, if the Span is not
Zero, two different color traces are simultaneously plotted. The Blue trace
represents the I or In-Phase channel while the Red trace represents the Q,
or Quadrature channel. If Zero Span, then a single trace is plotted which
is representative of signal voltage as a function of time.
Peak -
The Peak function places a small red symbol on the display at a frequency
location where a peak amplitude is found. The Marker symbol “rides” the
spectrum amplitude at the determined frequency. After selecting the Peak
function, the Marker can be turned Off (and On again) using the Marker
function Soft Keys. The Marker position can be moved by using the left
11
Fatpigdog Industries
Real Time FFT Spectrum Analyzer
and right arrow functions. The Marker Frequency and Amplitude are
indicated at the top right boundary of the display. All Peak functionality
operates on the Selected Active Trace as defined by the Trace (A) B Soft
Key.
Find -
Finds the peak amplitude within the displayed sweep and sets the marker
to this position.
-> CF
Sets the frequency of the indicated peak (where the marker is) to center.
Next R -
Steps the marker right to the next signal peak which exceeds peak finding
threshold to the right of the current peak.
Next L -
Steps the marker left to the next signal peak which exceeds peak finding
threshold to the left of the current peak.
Thresh -
The peak finding threshold. Peaks below this value will not be found by
the Find, Next R or Next L functions. By default this value is set to -1000
dB. When the Peak function is selected, the Peak Threshold is indicated
on the bottom center boundary of the display.
Marker -
The Marker function places a small red symbol on the display at a
frequency location determined by the user. The Marker symbol “rides”
the spectrum amplitude at the selected frequency. The Marker can be
turned On and Off. The Marker position is set by using the left and right
arrow functions. The Marker Frequency and Amplitude are indicated at
the top right boundary of the display. All Marker functionality operates
on the Selected Active Trace as defined by the Trace (A) B Soft Key.
Off -
Turns off the marker
On -
Turns on the marker
-> CF -
Sets the spectrum analyzer Center Frequency to the frequency value of the
current marker.
< (left) -
Steps the Marker along the display towards the Left.
> (right) -
Steps the Marker along the display towards the Right.
Sweep -
Sweep is the interval of time used to collect the raw data, upon which
spectral analysis is performed to produce the displayed power spectrum.
A traditional swept spectrum analyzer sweeps its local oscillator from the
start frequency to the stop frequency over the Sweep time interval. The
result for these traditional analyzers is that activity may be missed at a
specific frequency if it happens to be inactive during the moment when
the local oscillator sweeps through that specific frequency. The Real Time
FFT Spectrum Analyzer works differently. Data is collected into a buffer
12
Fatpigdog Industries
Real Time FFT Spectrum Analyzer
over the duration of the Sweep time interval. Then the entirety of the data
is processed with a Fast Fourier Transform (FFT). With this approach, the
complete spectral content of the data captured during the Sweep time
interval is determined and displayed (nice). The Sweep time interval is
shown on the bottom right boundary of the display.
Auto -
Lets the spectrum analyzer chose the optimal Sweep Time.
Appendix B for how Sweep Time is determined.
Time -
Manually sets the sweep time in milliseconds.
ResBw -
Resolution Bandwidth (RBW) defines the frequency resolving limit, or
frequency resolution of the spectrum analysis. The user should take care
to insure that the RBW is small enough to provide spectrum plots with
sufficient spectral (frequency) granularity for the desired purpose. The
RBW is shown on the bottom left boundary of the display.
Auto -
Lets the spectrum analyzer chose the optimal Resolution Bandwidth.
Refer to Appendix B for how Bandwidth is determined.
RBW -
Manually sets the resolution bandwidth in Hz.
Hamming -
When Hamming is selected (Hamming!) a Hamming taper is applied to
the raw analog input data prior to computing the spectrum. This has the
effect of reducing the spurious side lobes of the displayed spectrum.
However it also has a broadening effect on the desired spectral
components of the display.
Overlap-
With Overlap selected (Overlap!), the FFT Overlap feature is enabled.
Normally there is an inverse relationship between Sweep Time and RBW.
FFT Overlap allows simultaneous setting of short Sweep Times with small
RBW values. This is done at the expense of time smearing. See
discussion of FFT Overlap in the last section of this document.
Trigger -
Trigger is that which makes the spectrum analyzer "go". When the
spectrum analyzer starts up, the default is for it to be in Free Run mode.
The user can change this through the use of the Trigger, Single, and Free
Run functions. All Trigger functionality operates on the Selected Active
Trace as defined by the Trace (A) B Soft Key.
Free -
The spectrum analyzer continually triggers, generating a sweep as fast as it
can. This speed (or revisit time) is determined by the value of Sweep time
plus the time it takes for the software to process and display the sweep
result.
Video -
The spectrum analyzer only triggers a new sweep if a signal level is
detected equal to or greater than the trigger threshold, set by clicking the
video button and entering the threshold in the input field. When the
Trigger function is selected, the Video Trigger threshold level is indicated
13
Refer to
Fatpigdog Industries
Real Time FFT Spectrum Analyzer
on the bottom center boundary of the display. By default this value is set
to the minimum displayed Amplitude level.
Show -
Shows a dotted horizontal line on the display, at the Video Trigger
threshold level. The line is only displayed when Video trigger mode is
selected. If the trigger level is achieved and the spectrum display is
updated, the line is Yellow. If no trigger occurs, the line is drawn in Blue.
Trace -
The Trace function provides the user with the ability to modify displayed
trace data. Up to three traces can simultaneously be displayed in
Spectrum Plot Mode. Initially the user can display traces A and B. If the
DSP menu is selected, Trace C is added as an optional trace. If the Math
menu is selected, than Trace C is replaced with the Math trace. The Trace
operations apply to Trace A, B and C, but not the Math Trace.
Trace (A) B - Selects Active Trace. The Trace operations listed below are performed on
the Selected Active Trace (the one in the parenthesis). Note that in
Spectrum Plot Mode, each trace is drawn in a unique trace color. In
Waterfall Plot Mode, if the Math Trace is hidden, then the selected active
trace (A, B or C) is displayed on the waterfall. If Math Trace is not
hidden, then Waterfall displays the results of the Math Trace.
Write -
A new trace is written for each sweep.
(Max)/Min - If (Max), the trace holds the maximum values. The highest amplitude is
displayed for each frequency. If (Min), the trace holds the minimum
values. The lowest amplitude is displayed for each frequency.
Average -
The displayed sweep is a running average of current and previous sweep
values. The number of averages is displayed at the top center boundary of
the display. The default averaging window is 10 sweeps, and can be
changed by the user by entering a new number after clicking the Average
Soft Key.
(Hold)/Hide - If (Hold), the trace Holds. Trace updates cease. If (Hide), the trace is
hidden from view (and for the purpose of Math operations, “holding” not
updating).
Left Chan -
Selects between Left or Right audio input channels, or DSP result channel
if DSP operations are enabled. . a new set of menu options for the third
type of trace, the Math Trace (another unique color for this trace).
Math -
Selects a new set of menu options for the third type of trace, the Math
Trace (another unique color for this trace).
Math -
Normally Math operations are disabled. By clicking the Math menu
button, Math operations are enabled, and the Math trace is shown on the
display. The Math trace is unique in that it is managed under the context
of the Math menu, not the Trace menu. Math operations are performed on
14
Fatpigdog Industries
Real Time FFT Spectrum Analyzer
the A and B trace spectrum data. Enabling Math operations disables DSP
operations.
Norm -
Normalizes the A trace by the B trace and displays the result as a new
trace in the Blue color. Normalization occurs by performing sample by
sample divide of A samples by B samples, prior to conversion to dB. This
is equivalent to subtracting the B Trace values in dB from the A trace
values in dB. Normalization is extremely useful for removing the effects
of a non-flat frequency response (stored in B Trace for example) from the
A trace.
A+B-
Computes the summation of the A trace with the B trace on a sample by
sample basis, prior to conversion to dB. Caution – this is not a sum of dB
values !
A–B -
Computes the difference, the A trace minus the B trace on a sample by
sample basis, prior to conversion to dB. Caution – this is not a difference
of dB values !
A -> B -
This operation copies the A trace values into the B Trace. The best way to
do this is to have both the A and B traces on “Hold” prior to executing the
copy. Doing so insures that the A trace is stable with the important trace
data, and also insures that once copied, the B trace will not immediately
change.
(Hold)/Hide - If (Hold), the Math trace Holds. Math trace updates cease. If (Hide), the
Math trace is hidden from view.
DSP -
Normally DSP (Digital Signal Processing) operations are disabled. By
clicking the DSP menu button, DSP operations are enabled and the DSP
trace is shown on the display. The DSP trace is managed under the Trace
menu. DSP operations are performed on the Left (L) and Right (R) input
audio channels. L and R input channels can be input to the spectrum
analyzer via a stereo microphone, line-in, or a stereo wav file when
selecting File Input. Enabling DSP operations disables Math operations.
L+R-
Left and Right input channels are added on a sample by sample basis.
L-R-
Right input channel is subtracted from Left input channel on a sample by
sample basis.
LxR-
Left and Right input channels are multiplied on a sample by sample basis.
L/R-
Left input channel is divided by Right input channel on a sample by
sample basis.
L x Fo -
Left input channel is mixed with a local oscillator at a frequency Fo
specified by the user. This is useful for heterodyning (frequency shifting)
the signal on the Left channel to a new frequency.
15
Fatpigdog Industries
Real Time FFT Spectrum Analyzer
Audio -
The resulting DSP channel is bandpass filtered to the frequency limits of
the displayed SPAN and then output as monaural audio channel (makes
for neat feedback !)
Display -
The user can customize the appearance of the spectrum analyzer. Changes
made here can be saved using the File Save All or Default operation.
Grid -
Toggles the display graticule on and off.
SplitScrn -
Enables the spectrum split screen. The spectrum split screen appears
below the main display and provides an alternate view of the spectrum,
particularly useful if the main display is showing waterfall or phase data.
In Power Spectrum Mode, the split screen displays the selected trace in
Spectrum Plot Mode, even if the spectrum analyzer is set Waterfall Plot
Mode.
In Phase Spectrum Mode, when Span is not Zero, the split screen displays
the spectrum of the left channel input source. In Zero Span, the split
screen displays the left channel input source mixed (multiplied) with Fc
and Low Pass filtered with a cut-off frequency defined by RBW.
NamePlate -
The user can override the default Nameplate (Fatpigdog) and Subtext (A
subsidiary of Blueberry Technology, LLC) with text of his or her own
choosing.
Colors -
This Soft Key opens a new menu of Soft Keys which allows the user to
define specific colors for Screen background, Annotation Text, Trace A,
Trace B, Trace C, and Nameplate.
Guitar -
This is a special feature provided to assist in guitar tuning. Pressing the
Guitar Soft Key repeatedly cycles the display through 1-E, 2-B, 3-G, 4-D,
5-A, 6-E and Off. The spectrum limits of the display are also adjusted to
go from 0 to 1 kHz. With these settings, the harmonics of a tuned guitar
string, when plucked with no fretting, should align on the highlighted
spectrum regions.
Single -
The Single function causes exactly one frequency sweep to occur and
updates the display. This is of course also governed by the Trigger
Function settings.
Free Run -
The Free Run function causes the analyzer to continuously update and
display frequency sweeps (default mode when started). To exit the Free
Run mode, select the Single function. This is of course also governed by
the Trigger Function settings.
16
Fatpigdog Industries
Real Time FFT Spectrum Analyzer
Power -
Set the spectrum analyzer to the Power Spectrum Mode. In the Power
Spectrum Mode, the signal is analyzed and displayed in the domains of
Power v.s Frequency for the Spectrum Plot, or Power vs. Frequency vs.
Time for the Waterfall Plot (see Plot Mode).
Phase -
Set the spectrum analyzer to the Phase Spectrum Mode In Phase
Spectrum Mode the signal input into the left channel is analyzed and
displayed in the domains of Phase v.s. Frequency for the Spectrum Plot, or
Phase v.s. Frequency v.s. Time for the Waterfall plot (see Plot Mode).
When Phase Spectrum Mode is selected, TRACE, MATH, and DSP menu
items are disabled. The user can select from three different references for
the phase analysis as described below [Refer to Appendix A for more detail
on using Phase Spectrum Mode].
Left:Fc -
The Left Channel Phase is referred to the Internal Phase Reference
Oscillator. The Internal Phase Reference Oscillator runs at the userdefined Center Frequency, Fc.
Left:Output - The Left Channel Phase is referred to the Output Signal generated by the
Calibration or the Tracking generator.
Left:Right -
The Left Channel Phase is referred to the Right Channel input signal
phase.
Squelch -
Signal levels below the Squelch level are plotted as zero radians in phase
plots.
Zero Ref -
The Internal Phase Reference Oscillator is continuous in phase across
sweeps. By clicking this soft key, the user forces a reset of the Internal
Phase Reference Oscillator phase to zero radians at the beginning of the
next sweep after Zero Ref button press. This button is only available
when Left:Fc phase analysis reference is selected.
Sync Ref -
The Internal Phase Reference Oscillator is continuous in phase across
sweeps. By clicking this soft key, the user forces synchronization of the
phase of the Internal Phase Ref Oscillator to that of the left channel input
signal such that the Left:Fc phase is zero at the beginning of the next
sweep after the Sync Ref button press. This button is only available when
Left:Fc phase analysis reference is selected.
Plot Mode
Spectrum -
Traditional Spectrum Analyzer display mode (Amplitude vs. Frequency)
as shown in Figure 4. In Spectrum Plot Mode, the Trace menu item lets
the user select up to three simultaneous traces to be displayed, Trace A,
Trace B, and the Math trace.
17
Fatpigdog Industries
Real Time FFT Spectrum Analyzer
Figure 4 - Spectrum Display, shown with Trace function Soft Keys
Waterfall -
Waterfall display (Frequency vs. Time) as shown in Figure 5. In this
mode the time history of the spectrum is displayed as it changes as a result
of a chirping bird, modulating voice, or what have you. The two
dimensions are employed for frequency and time, with Power being
indicated in the color dimension, utilizing a color "rainbow", which in the
case of "Jet" ranges from dark blue for the weakest signal strength to red
for the strongest signal strength. Clicking on the button to the right of the
displayed color bar causes the Color Map to cycle through the various
available options.
Figure 5 - Waterfall Display, shown with Display function Soft Keys
In Waterfall Plot Mode, only one trace can be selected to drive the display.
If the Math trace is enabled (not hidden) then it is the source of the display
data. Otherwise the active selected trace (A or B) is the source of the
waterfall display, regardless of the “Hide” status of A or B trace. the
Trace menu item lets the user select up to three simultaneous traces to be
18
Fatpigdog Industries
Real Time FFT Spectrum Analyzer
displayed, Trace A, Trace B, and the Math trace. [Note that if the
Amplitude function is set up with its Soft Keys for one of the two Linear
options, Waterfall Display is not fully worked out yet ...].
Norm -
Only shown in Waterfall Plot Mode. By default, the signal strength color
scale is mapped from the Amplitude Reference level (Red) down to 100
dB less for dark Blue. Norm maps Red, the "hottest" color, to the
maximum signal power level displayed on the screen at the time that the
user clicks the Norm Soft Key.
Expand -
Only shown in Waterfall Plot Mode. The default signal strength range for
the color scale is 100 dB. Each click of Expand expands the mapped
signal strength range which is mapped onto the Dark Blue to Red color
scale by M dB. M is determined by the mode selected under the
Amplitude function. If 10 dB is selected under the Amplitude function,
then M = 10 dB.
Compress -
Only shown in Waterfall Plot Mode. The default signal strength range for
the color scale is 100 dB. Each click of Compress compresses the mapped
signal strength range which is mapped onto the Dark Blue to Red color
scale by M dB. M is determined by the mode selected under the
Amplitude function. If 10 dB is selected under the Amplitude function,
then M = 10 dB.
Rotate -
Only shown in Waterfall Plot Mode. The default waterfall orientation is a
vertical, up scrolling display with time going along the vertical axis and
frequency along the horizontal axis. Clicking the Rotate Soft Key changes
the orientation to a left horizontal scrolling display with time going along
the horizontal axis and frequency going along the vertical axis. Each
clock of Rotate Soft Key switches back and forth between these two
choices.
Tracking -
Tracking is a swept acoustic tone that is enabled to play through the PC
speakers. The start frequency of the swept tone is the start frequency of
the displayed frequency span. Likewise the stop frequency of the swept
tone is the stop frequency of the displayed frequency span. This feature is
only enabled in Live Input mode. If file input is selected, the Tracking
tone is turned off.
(On) / Off -
Turns the Tracking Generator on and off.
Tracking Generator Caveats:
1) The design of the tracking generator is such that the swept tone loosely
follows the sweep timing programmed with the Sweep function. There is
a bit of an asynchronous relationship between the capture subsystem
(which listens to audio) and the tracking generator (which plays audio).
Therefore, there can be situations where the tracking generator starts
before the capture starts, or ends after the capture end, or both. More
19
Fatpigdog Industries
Real Time FFT Spectrum Analyzer
importantly, Tstupid (see discussion on Config function) may make things
difficult when using the Single function, as opposed to Free Run.
2) This is a monophonic tone that is played through both left and right
channels. The user should take this fact into consideration when making
any measurements since constructive and/or destructive interference will
occur between the tones from the two speakers at the location of the single
microphone, dependent on the specific locations of these three elements
.... and any reflections off of walls, ceiling, your forehead ... :-)... etc.
Hint, turn the audio balance all the way left or right.
Noise -
Noise is a white noise generator that is enabled to play through the PC
speakers. The noise generator creates flat noise power distributed
uniformly across the spectrum from 0 Hz to Fs/2 (22050 Hz). This feature
is only enabled in Live Input mode. If file input is selected, the noise is
turned off.
(On) / Off -
Turns the Tracking Generator on and off.
Noise Generator Caveats:
1) The design of the noise generator is such that the noise is uncorrelated
and non-repeating for an interval of time (1 sec).
2) This is a monophonic noise source that is played through both left and
right channels. The user should take this fact into consideration when
making any measurements since constructive and/or destructive
interference will occur between the noise sources from the two speakers at
the location of the single microphone, dependent on the specific locations
of these three elements .... and any reflections off of walls, ceiling, your
forehead ... :-)... etc. Hint, turn the audio balance all the way left or right.
Cal -
Calibration is an acoustic tone that is enabled to play through the PC
speakers. This feature is only enabled in Live Input mode. If file input is
selected, the calibration tone is turned off.
(On) / Off -
Turns the fixed acoustic calibration tone on and off. The calibration tone
frequency is specified via the Frequency Soft Key.
Frequency -
The calibration tone frequency is set with this Frequency Soft Key. The
default calibration tone frequency is 15 kHz.
Calibration Caveat:
This is a monophonic tone that is played through both left and right
channels. The user should take this fact into consideration when making
any measurements since constructive and/or destructive interference will
occur between the tones from the two speakers at the location of the single
microphone, dependent on the specific locations of these three elements
20
Fatpigdog Industries
Real Time FFT Spectrum Analyzer
.... and any reflections off of walls, ceiling, your forehead ... :-)... etc.
Hint, turn the audio balance all the way left or right.
More Hints - Have a teenage daughter? Set the Calibration tone to17 Hz
and the sweep time to1 sec. Make sure all sharp tools have been locked up
:-)
Input -
The user can chose between analysis of real time data coming in to the
spectrum analyzer through the microphone input, and pre-recorded data
coming from an audio *.wav file. The Input function button permits the
user to select between these two sources.
File Input -
Clicking this selects the Audio *.wav file input mode and causes the Soft
Key submenu options to change as indicated below. Additionally, the
Filename and Ptr text boxes appear along the bottom edge of the Spectrum
Analyzer program window.
---------------------
Live Input -
Selects the PC’s audio microphone as the real time input source.
SampleClk - When opening a .wav file, the sample frequency is known and embedded
within the .wav file. The Sample Clock (Fs) gets set automatically. This
button lets the user optionally override the sample clock frequency.
Filename -
The user clicks here to open up a file browser and select the audio wave
file to analyze. The name of the selected file appears in the Filename text
box along the bottom edge of the Spectrum Analyzer program window.
The first time the user switches to File Input mode, the spectrum analyzer
will stop since no file has yet been selected for analysis. After the user
selects a file, it will remain in effect as the user toggles back and forth
between Live Input and File input (i.e. the analyzer will not be forced to
stop running).
Pointer -
As the selected file is read in and analyzed, the file pointer is displayed in
the Ptr text box along the bottom edge of the Spectrum Analyzer program
window. The Pointer Soft Key provides the user with the ability to force
the file pointer to a particular section of the file. The user provides the
desired pointer value in percentage of complete file. So entering ‘10’ will
force the pointer to 10% mark of the file.
BMP -
BMP lets you save a BMP bitmap file of the spectrum analyzer display.
Mute -
When the spectrum analyzer Input function is used to select File Input
mode, the audio of the selected file can be heard through the speakers of
21
Fatpigdog Industries
Real Time FFT Spectrum Analyzer
the PC. The Mute Function button is provided so the user can mute the
audio easily, without needing to open the operating systems volume
control utility.
Exit -
Exits the application.
Indicators Lights
Figure 6 - Capture and Trigger Indicator Lights
Capture -
The Capture light shown in Figure 6 illuminates while the spectrum
analyzer captures data from the audio input (microphone, or file). The
Capture light will illuminate for the duration of the Sweep time interval.
Trigger -
After data is captured for each sweep, it is tested against a level threshold
to see if it meets the trigger condition set by the Trigger function button.
If the trigger condition is met, the Trigger light shown in Figure 6
illuminates briefly for that sweep.
Miscellaneous Information Fields
Figure 7 - Miscellaneous information fields
The data provided in the miscellaneous information fields shown in Figure 7 is provided
for the more curious user, and more importantly they were provided for debug purposes
for the author and now he is too attached to them to remove them. Some are more useful
than others, and some are downright esoteric.
22
Fatpigdog Industries
Real Time FFT Spectrum Analyzer
Fs -
Fs is the sample clock frequency. For Live input mode, it is forced to
44.100 KHz. For File input mode, Fs is determined by the wav file.
T-
T is the Sweep time interval in seconds.
N-
N is the number of samples captured during the Sweep time interval. N is
equal to Fs*T, rounded to the nearest integer.
Nfft -
Nfft is the number of samples used for the FFT calculation. Nfft is
determined by the required RBW.
Nswp -
Nswp is an integer multiple of Nfft. Typically the integer is 1, however
for narrow spans, if Fine is set on (under the Span menu) Nswp may
exceed Nfft to provide increased sample resolution on the display.
File -
File is the filename that was selected by the user and that is used for File
Input mode.
Ptr -
In File Input Mode, as the analyzer reads in the selected file, Ptr
increments to provide an indication of what portion of the file is currently
being read. The unit of measure for the indicated Ptr is blocks.
FFT Overlap - FFT Overlap is an indicator message that comes on in Waterfall Plot
Mode if the selected RBW is finer than can normally be supported by the
selected Sweep time interval. If the RBW is too fine, than the spectrum
analyzer enters into Overlapped FFT mode, whereby Nfft is greater than N
to provide the necessary frequency resolution. Each Nfft point FFT is
stepped in overlapping time segments, where the percentage of time
overlap is equal to 100*(Nfft-N)/Nfft. The net effect of overlap is that one
achieves the desired frequency resolution at the expense of reduced time
resolution. The overlap effectively smears the time resolution of the
displayed waterfall data.
23
Fatpigdog Industries
Real Time FFT Spectrum Analyzer
4. Appendix A - Using Phase Spectrum Mode in Zero Span
Using the Phase Spectrum Mode in Zero Span provides a real time view of the phase
variation of the signal being input into the left channel. The easiest way to describe
might be by way of an example. For the example, we’ll use the provided
“StereoPhaseTest.wav’ audio file. This file has a slowly varying (phase shifting) 300 Hz
sine wave tone on the left channel and a fixed 300 Hz sine wave tone on the right channel
as an optional reference. The left channel variation is subtle, going through a full +/- 2.2
radians sinusoidal phase shift in 10 seconds
Start the Spectrum Analyzer software and select the ‘Input’ menu and then the ‘File
Input’ soft key. Select ‘Filename’ and then browse to the ‘StereoPhaseTest.wav’ audio
file. Click ‘Run’ . Set ‘Frequency’ ‘Center’ to 300. Select the ‘Phase’ menu button.
Then select the ‘Left:Fc’ soft key. Finally, set the ‘Span’ to ‘Zero’.
If you set the sweep to larger values (try 100 for 100 ms) you can reduce the chop at the
beginning of the trace.
So what you see now is the relative phase of the left channel signal compared to the
phase of the fixed oscillator within the Spectrum Analyzer, which we also set to 300 Hz
(when you clicked on ‘Left:Fo’).
At any time, you can click the ‘Sync Ref’ soft key under the ‘Phase’ menu to synchronize
the phase of the internal reference with that of the input signal. Doing so will cause the
beginning of the next trace to be at phase = 0 radians (or very close to 0).
Likewise, at any time, you can click the ‘Zero Ref’ soft key under the ‘Phase’ menu to
force the phase of the internal reference to zero radians. Doing so will cause the
beginning of the next trace to be at the instantaneous phase of the input signal. (I leave it
as an exercise for the student to determine why you might actually want to do this).
24
Fatpigdog Industries
Real Time FFT Spectrum Analyzer
5. Appendix B - Sweep Time and Resolution Bandwidth
Sweep Time and Resolution Bandwidth (RBW) are tightly coupled through signal
processing theory. The best frequency resolution that one can achieve is limited and
determined by the inverse of the time duration of the captured sample data. What this
means is that if you have need a RBW of 10 Hz, you need to set Sweep Time to at least
1/10 or 100 ms. Attempting to achieve finer time resolution (faster Sweep Times) will
cause an inversely proportional degradation in RBW.
The Spectrum Analyzer software allows the user to select Auto or user input modes for
both Sweep Time and RBW, while doing its darndest to satisfy the laws of physics. In
Spectrum Plot Mode (and assuming Non-Zero Span), the following logic is applied in
determining the operating parameters:
Sweep = Auto
RBW
=
|
RBW = Auto
SPAN / "SPAN/RBW"
(See Config Function)
SWEEP = 1/RBW
Sweep = Auto
RBW
=
|
RBW = User Input
User Input
SWEEP = 1/RBW
Sweep = User Input
|
RBW = Auto
SWEEP = User Input
If
1/SWEEP
RBW
>
SPAN / "SPAN/RBW"
=
1/SWEEP
=
SPAN / "SPAN/RBW"
(See Config Function)
Else
RBW
Sweep = User Input
|
(See Config Function)
RBW = User Input
SWEEP = User Input
If
1/SWEEP
RBW
>
RBW
=
1/SWEEP
=
User Input
Else
RBW
In Waterfall Plot Mode, and if only FFT Overlap is enabled (see Bandwidth Function),
then if the selected RBW is finer than can normally be supported by the selected Sweep
Time, the spectrum analyzer enters into Overlapped FFT mode, whereby Nfft is greater
than N to provide the necessary frequency resolution. Each Nfft point FFT is stepped in
overlapping time segments, where the percentage of time overlap is equal to 100*(NfftN)/Nfft. The net effect of overlap is that one achieves the desired frequency resolution at
the expense of reduced time resolution. The overlap effectively smears the time
resolution of the displayed waterfall data.
25
Fatpigdog Industries
Real Time FFT Spectrum Analyzer
6. Trouble Shooting
*** Missing mclmcrrt79.dll *** - Maybe you forgot to run Runtime.exe first to install
runtime? If runtime install worked, mclmcrrt.dll should exist in C:\Program
Files\MATLAB\Matlab Compiler Runtime\v79\runtime\win32
*** Runtime.exe does not run, or crashes *** - The most common problem is that the
264 MB file download did not complete. Trying to execute a partially downloaded
program (less than 264 MB) yields bad results.
*** Error initializing Sound Card *** - Windows 7 and Windows VISTA added security
features which get twitchy about this software touching the sound card. You must do one
of the following: 1) Disable UAC or 2) Run the application "As Administrator" each time
you run it, or 3) Mark the application to always run "As Administrator". Here is a link
with more detail on this subject: http://www.vistaclues.com/always-run-an-applicationas-an-administrator/
*** unknown Windows exception of type=c000001d was not caught.1 assert/signal
failures have occurred; MATLAB will abort in 10 seconds.*** - This problem is usually
caused by using unsupported hardware such as a processor that does not support the
Streaming SIMD Extensions 2 (SSE2) instruction set (e.g. Intel Pentium III, AMD
Athlon 32-bit). Check Specified System Requirements.
*** Error 1335 Data1.cab is corrupt *** - This can occur due to conflicts with antivirus
software. Disable antivirus software, disconnect from the LAN, WiFi, or other network
connections, and retry the install. Reference the following:
http://www.annoyances.org/exec/forum/winxp/1128905680
*** VCREDIST_X86 could not be found *** - This can occur due to conflicts with
antivirus software. Disable antivirus software, disconnect from the LAN, WiFi, or other
network connections, and retry the install. Reference the following:
http://www.mathworks.com/support/solutions/en/data/16LU4O5/index.html?product=CO&solution=1-6LU4O5
*** During the install of the Runtime (Runtime.exe), I have seen (rarely) an error
message regarding .NET. Click past it and continue the install and things should work
ok.
26
Fatpigdog Industries
Real Time FFT Spectrum Analyzer
*** Trying to run SpectrumAnalyzer_xxx.exe from the CD will not work! When you try
to enter the registration code, the Spectrum Analyzer software tries to write to the current
drive. It cannot succeed with this write operation if the current drive is the CD drive, and
program execution terminates.
*** You are running under Windows VISTA and after starting SpectrumAnalyzer.exe,
the program immediately terminates. *** Check that you are running the program as
Administrator (Read notes regarding VISTA on my spectrum analyzer web page).
*** After starting SpectrumAnalyzer.exe, You enter the Registration Code and then the
program terminates. *** This is normal behavior if the wrong registration code is
entered. The registration code is CASE SENSITIVE. If you enter the correct registration
code, you will get a "Congratulations" dialog box.
*** After starting SpectrumAnalyzer.exe, the program immediately terminates (before
the program asks for the Registration Code). *** Make sure that you have a sound card
and that the software drivers for the card are loaded, otherwise when the program goes to
access the sound data, it crashes.
*** Fatal error loading library C:\Program Files (x86)\MATLAB\MATLAB Compiler
Runtime\v79\bin\win32\mclmcr.dll Error: The application has failed to start because its
side-by-side configuration is incorrect. Please see the application event log or use the
command-line sxstrace.exe tool for more detail. *** You may see this error message
when trying to run the software on a 64 bit version of Windows. To run this program
under 64 bit versions of Windows, you must have the Microsoft Visual C++ 2005 32 bit
redistributable installed on your PC. You can download the 2005, 32 bit VC++
redistributable from the Microsoft Download Center here:
http://www.microsoft.com/download/en/details.aspx?id=5638.
*** InconsistentLocale - The system locale setting, <Language 1>, is different from the
user locale setting, <Language 2> *** This warning indicates that your User Locale does
not match your System Local. To eliminate this warning, make your User Locale match
your System Locale. You will need to restart your PC in order for changes to take effect.
Reference the following two sites:
http://www.mathworks.com/support/solutions/en/data/1-5T95VI/index.html?solution=15T95VI
and
http://www.mathworks.com/support/solutions/en/data/14TKQUB/index.html?solution=1-4TKQUB
27