1
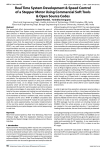
MULTITANK SYSTEM
MATLAB R2008a/b, R2009a/b,
R2010a/b, R2011a/b
PCI version
User’s Manual
www.inteco.com.pl
INTECO
www.inteco.com.pl
NOTES
Multitank System - User’s Manual
2
INTECO
www.inteco.com.pl
SAFETY OF THE EQUIPMENT
The equipment, when used in accordance with the supplied instructions, within the parameter set for its
mechanical and electrical performance, should not cause any danger to health or safety if normal engineering
applications are observed.
If, in specific cases, circumstances exist in which a potential hazard may be brought about by careless or
improper use, these will be pointed out and the necessary precautions emphasised.
Some National Directives require to indicate on our equipment certain warnings that require attention by the
user. These have been indicated in the specified way by labels. The meaning of any labels that may be fixed to
the equipment instrument are explained in this manual.
Risk of electric shock
PRODUCT IMPROVEMENTS
The Producer reserves a right to improve design and performance of the product without prior notice.
All major changes are incorporated into up-dated editions of manuals and this manual is believed to be correct at
the time of printing. However, some product changes which do not affect the capability of the equipment, may
not be included until it is necessary to incorporate other significant changes.
Multitank System - User’s Manual
3
INTECO
www.inteco.com.pl
ELECTROMAGNETIC COMPABILITY
This equipment, when operated in accordance with the supplied documentation, does not cause electromagnetic
disturbance outside its immediate electromagnetic environment.
COPYRIGHT NOTICE
© Inteco Sp zo.o.
All rights reserved. No part of this manual may be reproduced, stored in a retrieval system, or transmitted, in any
form or by any means, electronic, mechanical, photocopying, recording or otherwise, without the prior
permission of Inteco Ltd.
ACKNOWLEDGEMENTS
Inteco Sp z o.o. acknowledges all trademarks.
IBM, IBM - PC are registered trademarks of International Business Machines.
MICROSOFT, WINDOWS are registered trademarks of Microsoft Corporation.
MATLAB and Simulink are registered trademarks of Mathworks Inc.
Multitank System - User’s Manual
4
INTECO
www.inteco.com.pl
CONTENTS
1. INTRODUCTION AND DESCRIPTION....................................................................................................... 7
1.1 SYSTEM OVERVIEW ....................................................................................................................................... 8
1.2 HARDWARE INSTALLATION ......................................................................................................................... 10
1.3 SOFTWARE INSTALLATION .......................................................................................................................... 10
2. STARTING AND TESTING PROCEDURES ............................................................................................. 11
2.1 STARTING PROCEDURE ................................................................................................................................ 11
2.2 BASIC TESTS ................................................................................................................................................ 12
2.3 TROUBLESHOOTING..................................................................................................................................... 15
2.4 STOPPING PROCEDURE................................................................................................................................. 15
3. MULTITANK CONTROL WINDOW ......................................................................................................... 16
3.1 TOOLS ......................................................................................................................................................... 16
3.2 SIMULATION MODELS .................................................................................................................................. 20
3.3 RTWT DEVICE DRIVER................................................................................................................................ 22
3.4 DEMO CONTROLLERS .................................................................................................................................. 25
4. MATHEMATICAL MODEL OF THE TANK SYSTEM ........................................................................... 28
4.1 LAMINAR OUTFLOW OF THE IDEAL FLUID .................................................................................................... 30
4.2 MODEL OF A CASCADE OF N-TANKS ............................................................................................................ 30
4.3 NONLINEAR MODEL OF THE THREE TANK SYSTEM: PUMP CONTROLLED SYSTEM ......................................... 31
4.4 LINEAR MODEL OF THE TANK SYSTEM ......................................................................................................... 33
4.5 DEFINITIONS OF CONTROL TASKS ................................................................................................................ 35
5. IDENTIFICATION ........................................................................................................................................ 37
5.1 SENSOR CHARACTERISTIC CURVE ................................................................................................................ 37
5.2 IDENTIFICATION OF VALVES ........................................................................................................................ 39
5.3 IDENTIFICATION OF PUMP ............................................................................................................................ 40
5.4 IDENTIFICATION OF PARAMETERS OF THE TANKS ........................................................................................ 41
6. REAL-TIME CONTROL EXPERIMENTS ................................................................................................ 44
6.1 DESIGN OF LINEAR CONTROLLER................................................................................................................. 44
Simulation ................................................................................................................................................................ 46
Real-time experiment ............................................................................................................................................... 48
6.2 FUZZY CONTROLLER ................................................................................................................................... 49
Simulation ................................................................................................................................................................ 52
Real-time Experiment ............................................................................................................................................... 54
7. PROTOTYPING AN OWN CONTROLLER IN RTWT ENVIRONMENT ............................................ 56
7.1 CREATING A MODEL .................................................................................................................................... 57
7.2 CODE GENERATION AND BUILD PROCESS ..................................................................................................... 59
8. DESCRIPTION OF THE TANK CLASS PROPERTIES .......................................................................... 62
8.1 BASEADDRESS ............................................................................................................................................ 64
8.2 BIAS ............................................................................................................................................................ 65
8.3 BITSTREAMVERSION ................................................................................................................................... 65
8.4 PWM .......................................................................................................................................................... 65
8.5 PWMPRESCALER ........................................................................................................................................ 66
8.6 PWMMODE ................................................................................................................................................ 67
8.7 VALVE......................................................................................................................................................... 67
8.8 PUMP ........................................................................................................................................................... 68
8.9 SCALECOEFF ............................................................................................................................................... 68
8.10 TIME.......................................................................................................................................................... 69
Multitank System - User’s Manual
5
8.11 SAFETYFLAG ............................................................................................................................................. 69
8.12 SAFETYMAX ............................................................................................................................................. 70
8.13 SAFETYMIN............................................................................................................................................... 70
8.14 SAFETYALERT........................................................................................................................................... 70
8.15 THE TANK CLASS QUICK REFERENCE TABLE .............................................................................................. 72
9. REFERENCES ................................................................................................................................................ 73
1. INTRODUCTION AND DESCRIPTION
upper tank (1)
middle tank (2)
controlled
valves
manual valves
lower tank (3)
pump
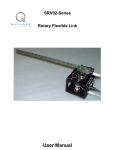
Fig. 1.1 Multitank system
The Multitank System (Fig. 1.1) comprises a number of separate tanks fitted with drain
valves. The separate tank mounted in the base of the set-up acts as a water reservoir for the
system. Some of the tanks have a constant cross section, while others are spherical or conical, so
having variable cross section. This creates main nonlinearities of the system. A variable speed
pump is used to fill the upper tank. The liquid outflows the tanks due to gravity. The tank valves
act as flow resistors. The area ratio of the valves is controlled and can be used to vary the outflow
characteristic. Each tank is equipped with a level sensor based on hydraulic pressure measurement.
The Multitank System relates to liquid level control problems commonly occurring in industrial
storage tanks. For example, steel producing companies around the world have repeatedly
confirmed that substantial benefits are gained from accurate mould level control in continuous
bloom casting. Mould level oscillations tend to stir foreign particles and flux powder into molten
metal, resulting in surface defects in the final product [1].
The goal of the Multitank System design is to study and verify in practice linear and nonlinear
control methods. The general objective of the control is to reach and stabilise the level in the tanks
by an adjustment of the pump operation or/and valves settings. This control problem can be
solved by a number of level control strategies ranging from PID to adaptive and fuzzy logic
controls [2], [3], [4].
The Multitank System has been designed to operate with an external, PC-based digital
controller. The control computer communicates with the level sensors, valves and pump by a
dedicated I/O board and the power interface. The I/O board is controlled by the real-time
software which operates in MATLAB/Simulink RTW/RTWT rapid prototyping
environment.
This manual describes:
♦ the system,
♦ the installation of the multitank software,
♦ the mathematical models and theory related to control experiments,
♦ the identification procedures,
♦ how to use the library of ready-to-use real-time controllers,
♦ step-by-step how to design and apply ones own controller in the
MATLAB/Simulink/RTWT environment.
This is assumed that a user has an experience with MATLAB and Simulink from MathWorks
Inc.
1.1 SYSTEM OVERVIEW
The tank system consists of a number of tanks placed above each other (Fig. 1.1). Some of the
tanks have a constant cross section, while others are spherical or prismatic, so having variable
cross section. Liquid is pumped into the upper tank from the supply tank by the pump driven
by a DC motor. The liquid outflows the tanks only due to gravity. The output orifices act as
flow resistors, but can also be controlled from the computer.
The levels in the tanks are measured with pressure transducers. The frequency signals of the
level sensors are connected to the digital inputs of the RT-DAC/PCI multipurpose I/O board.
There are four control signals send out from the board to the multitank system: three valve
controls and one pump control signal. The appropriate PWM control signals are transmitted
from digital outputs of the I/O board to the power interface, and next to the valves and to the
DC motor. The speed of the pump motor is controlled by a sequence of PWM pulses
configured and generated by the logic of XILINX chip of the RT-DAC board.
The liquid levels in the tanks are the system states. The general objective of the tank system
control is to reach and stabilise a desired levels in the tanks by an adjustment of the pump
operation and/or valves settings. For the real system the levels in the tanks as well as the flow
rates of the pump are limited.
To use the multitank system the following software and hardware components are required:
•
Intel Pentium compatible PC with:
⇒ Windows XP/W7,
⇒ MATLAB version R2008a/b R2009a/b, R2010a/b or R2011a/b with Simulink and
RTW/RTWT toolboxes (not included),
•
RT-DAC/PCI programmable Input/Output board to be installed in the PC (included),
•
CD-ROM including the multitank software and the e-manuals.
Manuals:
•
Installation Manual
•
User’s Manual
The experiments and corresponding to them measurements have been
conducted by the use of the standard INTECO systems. Every new system
manufactured and developed by INTECO can be slightly different to those
standard devices. It explains why a user can obtain results that are not
identical to these given in the manual.
1.2 HARDWARE INSTALLATION
Hardware installation is described in the Installation Manual.
1.3 SOFTWARE INSTALLATION
Insert the installation CD and proceed step by step the displayed commands.
2. STARTING AND TESTING PROCEDURES
2.1 STARTING PROCEDURE
Invoke MATLAB by double clicking on the MATLAB icon. The MATLAB command
window opens. Then simply type:
Tank3
MATLAB brings up the Multitank Control Window (see Fig. 2.2).The user has a rapid access
to all basic functions of the Multitank control and simulation systems from the Multitank
Control Window. It includes tests, drivers, models and application examples.
Fig. 2.2 Multitank Control Window of the tanks system
The Servo Control Window contains testing tools, drivers, models and demo applications. See
section 4 for detailed description.
2.2 BASIC TESTS
This section explains how to perform the basic tests checking if mechanical assembling and
wiring has been done correctly. The tests have to be performed obligatorily after assembling
of the system. They are also necessary if any incorrect operation of the system was detected.
The tests have been designed to validate the existence and sequence of measurements and
controls. They do not relate to accuracy of the signals.
Fig. 2.4 Message windows for Step1 and Step 2
Fig. 2.3 The Basic Tests window
Seven testing steps are applied. The procedures allow user to check the pump operation, three
controlled valves, three level sensors and overflow limits.
•
Double click the Basic Tests button. The window given in Fig. 2.3 appears.
•
The Step 1 and Step 2 prepare system for testing. You must start tests with empty tanks
and closed valves. After clicking on Step 1 and Step 2 buttons the messages shown in
Fig. 2.4 are displayed.
•
In the Step 3 you can check if the pump works properly and if level in the tank 1 is
measured correctly. After clicking Test Pump and Tank 1 Level button the pump starts
and works 20 seconds. Then the pump is stopped and the liquid level in the tank 1 is
plotted ( Fig. 2.5 ).
•
In the Step 4 the valve in the tank 1 opens and the levels in the tanks 1 and 2 are
measured. The measurements are plotted (Fig. 2.6).
Fig. 2.5 The proper operation of the sensors: level in the tank 1 (the pump works and valve 1
is closed)
Fig. 2.6 Levels in the tanks 1 and 2 (valve 1 is opened)
•
In the Step 5 the valve 2 is opened and the levels in the tanks 2 and 3 are measured.
Results are shown in Fig. 2.7.
Fig. 2.7 Levels in the tank2 and 3 (valve 2 is opened)
•
In the Step 6 the valve 3 is opened and the level in the tank 3 is measured. The results are
shown in Fig. 2.8.
Fig. 2.8 Level in tank 3 (valve 3 is opened)
•
In the step 7 the logical limit switches built into the FPGA chip structure (RT-DAC 4 I/O
board) are tested. The task of these “emergency” switches is to turn off the pump if the
overflow in any of the tanks occurs. When the pump is turned off and the level in the tank
falls down under the emergency limit the pump starts again. Close the manual valve in the
tank 1 and click Overflow limits button. The pump starts and works until the level in tank
1 becomes equal to the value pre-set in the FPGA chip.
To finish the tests click the Pump off button in the MultiTank Main Window to set the pump
control to zero.
2.3 TROUBLESHOOTING
Problem
System does not work
Pump does not work
Solution
Check if the RTDAC/PCI board is properly
installed.
Check if the power interface is “on”. Check if
hardware stop button is released.
Check the cable connection between the pump
and the power interface.
Overflow alert – empty the water out of tank.
Valve does not open
Check the cable connection between the valve
and the power interface.
Overflow alert – empty the water out of tank.
Level measurements are not correct
Check the cable connection between the level
sensors and the power interface. Check if the
rubber pipe is connected to the sensor and to
the metal pipe in the tank.
2.4 STOPPING PROCEDURE
The system is equipped with the hardware stop pushbutton. It cuts off the transfer of control
signals to the tanks. The pushbutton does not terminate the real-time process running in the
background on PC. Therefore, to stop the task you have to use Simulation/Stop real-time code
pushbutton from the pull-down menus in the model window.
3. MULTITANK CONTROL WINDOW
The user has a quick access to all basic functions of the multitank system from the Multitank
Control Window. It includes tests, drivers, models and application examples.
Type at Matlab prompt Tank3 command and Multitank Control Window presented in Fig. 2.2
opens.
The Multitank Control Window contains menu items divided into four groups:
•
•
•
•
Tools - Basic tests and Manual Setup,
Simulation Models,
RTWT Device Driver,
Demo Controllers.
3.1 TOOLS
The respective buttons in the TOOLS column perform the following tasks:
Basic Tests - checks the fluid levels measurements, DC pump operation and
controlled valves operation. The Basic Tests tool is described in details in
section 3.2.
Valve 1 ON – fully opens the valve of the first (upper) tank,
Valve 1 OFF – fully closes the valve of the first (upper) tank,
Valve 2 ON – fully opens the valve of the second (middle) tank,
Valve 2 OFF – fully closes the valve of the second (middle) tank,
Valve 3 ON – fully opens the valve of the third (lower) tank,
Valve 3 OFF – fully closes the valve of the third (lower) tank,
Manual Setup – opens the window giving access to the basic parameters of the laboratory 3tank setup. The most important data transferred from the RT-DAC/PCI board and the
measurements of the multitank system as well as status signals and flags may be
shown. Moreover, the control signals of three valves and the pump may be set
manually (Fig. 3.9).
The application contains four frames:
• RT-DAC/PCI board
• Control
• Levels
• Safety levels and flags
The RT-DAC/PCI board frame presents the main parameters of the PCI board. The Control
frame allows to change the control signals. The current liquid levels are given in the Levels
frame. The Safety levels and flags frame contains the maximum and minimum liquid levels,
the state of the safety flag and the state of the overflow alert.
The Display I/O pushbutton activates the window that presents the contents of all RTDAC/4PCI input registers.
All the data presented by the Tank Manual Setup program are updated 10 times per second.
Fig. 3.9 The Manual Setup window
•
RT-DAC4/PCI board
The frame contains the parameters of the RT-DAC/PCI boards detected by the computer.
No of detected boards
Presents the number of detected RT-DAC/PCI boards. If the number is equal to zero it means
that the software has not detect any RT-DAC/PCI board. When more then one board is
detected the pull-down board list must be used to select the board connected with the
program.
Board
Contains the list applied for selection of the board currently used by the program. The list
contains a single entry for each RT-DAC/PCI board installed in the computer. A new
selection executed at the list automatically changes values of the remaining parameters within
the frame. If more then one RT-DAC/PCI board is detected the selection at the list must point
to the board applied to control the multitank system. Otherwise the program is not able to
operate in a proper way.
Bus number
Shows the number of the PCI bus where the current RT-DAC/PCI board is plugged-in. The
parameter may be useful to distinguish boards, when more then one board is used and the
computer system contains more then single PCI bus.
Slot number
It is the number of the PCI slot where the current RT-DAC/PCI board is plugged-in. The
parameter may be useful to distinguish boards, when more then one board is used.
Base address
Contains the base address of the current RT-DAC/PCI board. The RT-DAC/PCI board
occupies 256 bytes of the I/O address space of the microprocessor. The base address is equal
to the beginning of the occupied I/O range. The I/O space is assigned to the board by the
computer system and may differ from computer to computer. The base address is given in the
decimal and hexadecimal forms.
Logic version
Displays the number of the configuration logic of the on-board FPGA chip. A logic version
corresponds to the configuration of the RT-DAC/PCI board defined by this logic and depends
on the version of the tank model.
Application
The name of the application taken from the on-board FPGA chip. A name of the application
corresponds to the configuration of the RT-DAC/PCI board.
I/O driver status
Shows the status of the driver that allows the access to the I/O address space of the
microprocessor. The status has to be OK string. In other case the Multi-Tank software HAS
TO BE REINSTALLED.
•
Control
The frame allows to set the control signals of three valves and to set the control signal for the
pump.
Valve 1, Valve 2, Valve 3, Pump
The control signals of the valves and the pump may be set by entering a new value into the
corresponding edit fields or by moving the corresponding slider. The control values may vary
from 0.0 to +1.0. The value of 0.0 and +1 mean respectively: the zero control and the
maximum control. If the valves are considered the zero control means that the valve is closed
however the maximum control fully opens the corresponding valve. For the pump the flow
increases when the control value changes from 0.0 to 1.0. If a new control value is entered
into the edit field the corresponding slider changes respectively its value. If a slider is moved
the value in the corresponding edit field changes as well.
STOP
The pushbutton is applied to switch off all the control signals. When pressed all the control
values are set to zero.
•
Levels
The frame presents the levels of liquid in three tanks. The levels are scaled in centimeters.
Within this frame the safety system parameters are given as well.
Safety levels and flags
There are maximum and minimum liquid levels associated with each tank. If in any tank the
liquid level is higher then the maximum level the RT-DAC/PCI board automatically activates
the overflow alert. If the overflow alert is active the RT-DAC/PCI board switches off all the
control signals. During the overflow alert the valves are closed and the pump is off regardless
of the control signals.
The overflow alert is disabled if the levels in all tanks are lower then the minimum levels. As
during the overflow alert the automatic valves remain closed it is required to open manual
valves to lower the liquid level below the minimum level.
Max level, Min level
The maximum and minimum levels of the liquid in the tanks. The levels are given in
centimeters.
Activity flag
The state of the flags that enable the safety system for the respective tank.
Overflow alert
The state of the overflow alert. It displays the SAFE message if the overflow flag is inactive.
The ALERT message indicates that the alert system is active.
Deactivate / Activate
The pushbutton deactivates the safety flags of all tanks for 15 seconds. If the safety flags are
inactive the pumps and the valves operate regardless the liquid levels. The deactivation allows
manual decreasing of the levels below the minimum safety levels. When the deactivation is in
progress the caption of the button changes from “Deactivate” to “Activate”. The safety flags
are activated back immediately after the “Activate” button is pressed.
3.2 SIMULATION MODELS
In this group some examples of simulation models are given. These models can be used to
familiarise the user with the tank system operation and give templates for developing and
testing the user-defined control algorithms. Only one model is described below. Other
examples are given in Section 7.
After clicking on the Open-Loop button the model appears (Fig. 3.10).
Fig. 3.10 The triple tanks system simulation model
The mask of the Tank3 Model block is given in Fig. 3.11. All parameters of the tank system
model significant for control are available in this window. They correspond to the
mathematical model of the tank system.
The description of the parameters is given in the Section 5. Notice, that some parameters are
fixed (e.g. geometry of tanks), while other must be identify and introduced , according to the
current setting of the valves.
Fig. 3.11 Parameters of the model of tank system
An example of the step response of the tank system simulation model is given in Fig. 3.12.
3.5
x 10
-5
0.08
3
0.07
2.5
Pu
mp
co
2
ntr
ol
[m 1.5
3/s
]
1
0.06
0.05
H1
[m]
0.04
0.03
0.5
0.02
0
-0.5
0.01
0
100
200
300
Time [s]
400
500
600
0
0
100
200
300
Time [s]
400
500
600
0
100
200
300
Time [s]
400
500
600
0.14
0.12
0.12
0.1
H2
[m]
0.1
0.08
H3 0.08
[m]
0.06
0.06
0.04
0.04
0.02
0.02
0
0
100
200
300
Time [s]
400
500
600
0
Fig. 3.12 Example of the step response simulation
3.3 RTWT DEVICE DRIVER
The main driver is located in the RTWT Device Driver group. The driver integrates
MATLAB/Simulink environment and RT-DAC/PCI board transforming and transmitting
measurement and control signals from/to the tanks system. If a user wants to build his own
application he must copy this driver to a new model.
After clicking the Tank System Device Drivers button the window shown in Fig. 3.13 opens.
Fig. 3.13 Tanks system Device Drivers
The driver has four PWM inputs. The first input (Pump) controls the DC pump. The inputs
Valve1, Valve2 and Valve3 control the valves of the upper, middle and lover tanks. There are
three analog outputs of the driver: Level1, Level2, Level3 and one digital output: Alert. Each
analog output represents the liquid level in the tank displayed in metric units.
The frequency signal of the level sensor is prescaled to the metric units inside the device
driver block (Fig. 3.14). Each level sensor is described by two parameters: Gain and Bias (see
Section 5.1). These parameters should not be changed inside the device driver. To modify a
parameter of the level sensor characteristic curve the following commands should be type in
MATLAB command window:
>> aux = tank;
% Creating object aux of the tank class
>> set(aux,’ScaleCoeff’,[0.0380 0.0380 0.0380 0.0 0.0]);
% Changing the Gain
parameters. The first value of the vector corresponds to the Gain parameter of the upper level
sensor characteristic, etc (see section 5).
>> set(aux,’Bias’,[0.0020 0.0020 0.0020 0.0 0.0]);
% Changing the Bias parameters.
The first value of the vector corresponds to the Bias parameter of the upper level sensor
characteristic, etc.
Example. Change Gain parameter of the upper level sensor characteristic to 0.034 and Bias
parameter of the lower level sensor characteristic to 0.0021.
>> aux = tank;
>> OldGain = get(aux,’ScaleCoeff’);
% Reading the old Gain parameters
>> OldGain (1) = 0.034;
% Modifying the first Gain
>> set(aux,’ScaleCoeff’,OldGain);
% Writing the new parameters
>> OldBias = get(aux,’Bias’);
% Reading the old Bias parameters
>> OldBias(3) = 0.0021;
% Modifying the third Bias
>> set(aux,’Bias’,OldBias);
% Writing the new parameters
This way can change parameters only temporary. To change them permanent the parameters
must be saved in the TankV2PU_Coeff.m4 file. This file is located in the
matlabroot/toolbox/Multitank/m/ directory. The parameters are read from this file. To see the
variables stored in this file type the commands:
>> load -mat TankV2PU_Coeff.m4
>> who
Your variables are: TankBias
TankScaleCoeff
>>size(TankBias)
ans = 1
5
Length of the TankBias and TankScaleCoeff variables is 5. Only three elements are used but
five must be stored (the two last elements are prepared for future using).
The command to store permanently new parameters is as follows:
save matlabroot/toolbox/Multitank/m/TankV2PU_Coeff.m4 TankBias TankScaleCoeff -V4;
-K-CTank 1 Bias
Tank 1 Scale
-K-CTank 2 Bias
[imp/10ms]
Tank 2 Scale
-K-C-
RT-DAC
Frequencies
Tank 3 Bias
Tank 3 Scale
1
Level 1
2
Level 2
3
Level 3
-K-CTank 4 Bias
Tank 4 Scale
Level 4
-K-CTank 5 Bias
Tank 5 Scale
Level 5
Fig. 3.14 The level sensor characteristic curve built into the device driver (Tank4 and Tank5
are not used)
Do not make any changes inside the original driver. They should be made
only inside its copy.
The C source code of the all components of the driver is included in the DevDriv directory.
3.4 DEMO CONTROLLERS
In this group the preprogrammed examples of the tank control systems are given. These
demos can be used to familiarize the user with the tank system operation and help to create
the user-defined control algorithms. Before starting an experiment real-time executable file
must be created by pressing Tools/Real-Time Workshop/Build Model item in the Tools pulldown menu.
Due to similarity of the examples we focus our attention on one of them.
After clicking on the Relay button the model of simple, relay-controlled tank system appears
(Fig. 3.15).
Fig. 3.15 Control system with relay controllers
Notice, that this model looks like a typical Simulink model. The device driver given in Fig.
3.15 is applied in the same way as other blocks from the Simulink library. The only difference
consists in applying the Real Time Windows Target (RTWT) to create the executable library
which runs in the real-time mode.
The only goal of the control is to stabilize the liquid level in the upper tank by the relay
controller. The valves control signals for the upper, middle and lower tanks are set to: 0.6, 1.0,
1.0 respectively. The mask of the Relay block is given in Fig. 3.16. The characteristic
corresponding to the relay controller is presented in Fig. 3.17.
PWM control signal
1
0
0.14 0.15
Fig. 3.16 Relay controller parameters
Level [m]
Fig. 3.17 Relay controller characteristic
curve
Notice, that the control generated by the controller takes two values: 0 and 1. The switching
limits are 0.15 m and 0.14 m. It means that the liquid level will be changed between these
limits (except beginning of experiment, relative to initial conditions) with the speed
corresponding to the operation of DC pump and Valve1 fixed settings. (equal to 1 and 0.6
respectively).
•
To prepare data acquisition click the Tools/External Mode Control Panel… item, after
click the Signal Triggering button. The window given in Fig. 3.18 opens.
•
Select XT Tank , set Source as the manual option, mark Arm when connect to Target
option and close the window.
•
To start experiment choose the Tools pull-down menus in the Simulink model window.
The pop-up menus provide a choice between predefined items. Choose the RTW Build
item. A successful compilation and linking process is finished with the following
message:
Successful completion of Real-Time Workshop build procedure for model Tank3_Relay
If any error occurs then the message corresponding to the error is displayed in the MATLAB
command window.
•
Return to the model window and click the Simulation/Connect to Target option. Next,
click the Simulation/Start real-time code item.
Fig. 3.18 External Signal & Triggering window
•
After while observe the plots in the scope and click Stop Simulation after some time.
The results of the experiment are shown in Fig. 3.19.
-5
10
x 10
0.16
9
0.14
7
0.12
6
0.1
H1 [m]
Pump control [m3/s]
8
5
4
0.08
0.06
3
0.04
2
1
0.02
0
0
10
20
30
40
50
Time [s]
60
70
80
0
0
10
20
30
40
50
Time [s]
60
70
80
Fig. 3.19 Results of the relay controller demo real-time-experiment.
The liquid in the upper tank starts from 0.0 m level and oscillates between 0.14 m and 0.15 m
levels. The DC pump control signal is the square wave in the range [0, 1].
Parameters, characteristic curves and plots given in the manual and introduced
into Simulink demo models are only examples.
Therefore, it is recommended to identify the current system parameters before starting own
experiments.
4. MATHEMATICAL MODEL OF THE TANK
SYSTEM
Modern methods of design of advanced controllers usually require high quality models of the
process. The classical procedure of a model development consists of the following steps:
♦ development of the mathematical model based on physics of the process,
♦ simplification of the model and/or its transformation into a standard form,
♦ development of a simulation model,
♦ tuning of the model parameters (identification),
♦ practical verification of the model.
q
inflow
PS1
H1
C1
PS2
H2
C2
PS3
H3
DC pump
C3
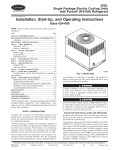
Fig. 4.20 Configuration of the multitank system
In the next sections we will execute the steps given above for the multitank system.
Liqiud levels H 1 , H 2 , H 3 in the tanks are the state variables of the system (Fig. 4.20). For the
tank system there are four controlled inputs: liquid inflow q and valves settings C1 ,C 2 ,C3 .
Therefore, several models of the tanks system can be analysed (Fig. 4.21), classified as pumpcontrolled system, valve-controlled system and pump/valve controlled system.
a)
q
H1 ,
H2
H3
Tank system
input
output
C1
C2
C3
parameters
b)
C1
C2
C3
Tank system
parameters
H1
H2
H3
q
c)
q
C1
C2
C3
Tank system
H1
H2
H3
Fig. 4.21 Models of the tank system as: a) pump-controlled system, b) valve-controlled
system c)pump/valve controlled system.
Several issues have been recognised as potential impediments to high accuracy control of
level or flow in the tanks:
♦ nonlinearities (smooth and nonsmooth) caused by shapes of tanks,
♦ saturation-type nonlinearities, introduced by maximum or minimum level allowed in tanks,
♦ nonlinearities introduced by valve geometry and flow dynamics,
♦ nonlinearities introduced by pump and valves input/output characteristic curve.
4.1 LAMINAR OUTFLOW OF THE IDEAL FLUID
The laminar outflow rate of an “ideal fluid” from a tank (Fig. 4.22) is governed by the
Bernoulli law. This equation is obtained by a simple calculation of the potential and kinetic
energy of the fluid [5]
Qr = µS 2 gH 0
(4.1)
where:
S – is the output area of the orifice,
µ - is the orifice outflow coefficient.
inflow
q0=const
H0
level 0
S, p , q
Fig. 4.22 Outflow of “ideal fluid”
4.2 MODEL OF A CASCADE OF N-TANKS
Assuming the laminar outflow of an “ideal fluid” for a cascade of n-tanks, the model
describing dynamics of the process can be obtained by means of mass balance
dV1
= q − C1 H 1
dt
dV2
= C1 H 1 − C 2 H 2
dt
…………………………..
dVn
= C n−1 H n−1 − C n H n ,
dt
where:
V1, V2, K, Vn – fluid volumes in the tanks,
C1, C2, K, Cn – resistance of the output orifice,
H1, H2, K, Hn – fluid levels in the tanks,
(4.2)
q – inflow to the upper tank.
From equations (5.2) we obtain
dV1 dH 1
= q − C1 H1α1 ,
dH 1 dt
dV2 dH 2
= C1 H 1α1 − C 2 H 2α 2 ,
dH 2 dt
(4.3)
……………………………….
dVn dH n
= Cn−1 H nα−n1−1 − C n H nα n .
dH n dt
As mentioned above, for the laminar flows the outflow rate from a tank is governed by the
Bernoulli law. In this case αi=1/2. For the real configuration of tanks, tubes and valves, if
turbulence and acceleration of the liquid in the tube can not be neglected, a more general
coefficients αi are applied.
4.3 NONLINEAR MODEL OF THE THREE TANK SYSTEM:
PUMP CONTROLLED SYSTEM
Using the equations (4.3) for n=3 the nonlinear model of tank system from Fig. 4.21 is
obtained
dH 1
1
1
=
q−
C1 H 1α1
dt
β1 ( H 1 )
β1 ( H 1 )
dH 2
1
1
=
C1 H1α1 −
C2 H 2α 2
β 2 (H 2 )
β 2 (H 2 )
dt
dH 3
1
1
=
C2 H 2α 2 −
C3 H 3α 3
dt
β3 (H 3 )
β3 (H 3 )
where:
Hi - fluid level in the i tank, i = 1,2,3.
βi(Hi) - cross sectional area of i tank at the level Hi, defined as:
β 1 (H 1 ) = aw - constant cross-sectional area of the upper tank,
β 2 ( H 2 ) = cw +
H2
bw - variable cross sectional area for the middle tank,
H 2 max
β 3 (H 3 ) = w R 2 − (R − H 3 ) - variable cross sectional area of the lower tank,
2
CI - resistance of the output orifice of i tank,
α i - flow coefficient for i tank.
Geometrical parameters [cm] of the tanks are given in Fig. 4.23.
(4.4)
H1max=35
w=3.5
a=25
b=34.5
H2max=35
w=3.5
c=10
R=36.4
w=3.5
H=35
Fig. 4.23 Geometrical parameters of the tanks
Let us assume that pump-control system is considered.
Rewrite the right sides of equations (4.4) in the form F ( x , q ) = [ F1 , F2 , F3 ] , where
F1 (q, H 1 ) =
1
1
q−
C1 H1α1
β1 ( H 1 )
β1 ( H 1 )
F2 ( H 1 , H 2 ) =
1
1
C1 H 1α1 −
C 2 H 2α 2
β 2 (H 2 )
β 2 (H 2 )
F3 ( H 2 , H 3 ) =
1
1
C 2 H 2α 2 −
C3 H 3α3
β3 (H 3 )
β3 (H 3 )
(4.5)
The model (5.4), for given initial conditions and control, describes the dynamics of the process on
the set of model-admissible states
ℵiM = {H i :β i ( H i ) ≠ 0, H i ≥ 0}, i = 1,2,3 ,
while process-admissible states of the process are usually determined as
ℵP = {H i :0 ≤ H i ≤ H i max } i = 1,2,3 .
i
Remark 1. The shapes of the tanks are such regular that the functions F1 , F2 , F3 are continuous and
differentiable on ℵi .
M
The admissible set of the control is given in the form
Q = {q : 0 ≤ q ≤ q max }.
Remark 2. In the most cases the set of process-admissible states can be obtained as a closure of the
P
M
set of admissible states of the model : ℵi = ℵi .
For the model (5.4), for fixed q = q0 we can define an equilibrium state (steady-state points),
given by
(
)
(
)
H 0 = {H i : F1 q0 , H1 = 0,..Fi H i −1 , H i = 0, i = 2..3}, q0 ∈ Q, H i ∈ ℵiP
The equilibrium states can be calculated from the equations
α2
q0 = C1 H 10α1 = C2 H 20
= ... = C n H nα0n ,
(4.6)
or
1
1
α1
α1
q
q
0
0
C1
C
1
H 10
α1
1
H C α2
q α2
1
0
H 0 = 20 = H 10 =
M C2
C2
M
M
1
α n −1
H n0
C n −1 α n
q0 α n
C H n −1,0 C
n
n
.
Assumption 1
Any admissible q0 the corresponding H 0 is state-admissible.
In the laboratory practice this assumption can be achieved by a proper setting of C1 ..C3
parameters.
4.4 LINEAR MODEL OF THE TANK SYSTEM
Taking into account the Remark 2, the linearized model is obtained by the Taylor expansion
of (4.5) around the assumed equilibrium state
dh
= J H h + J qu
dt
where:
h=H-H0 is the modified state vector (deviation from the equilibrium state H 0 ),
(4.7)
u=q- q0 is deviation of the control, relative to q0 ,
Jq, JH are Jacobians of the function (4.5):
∂F ( H , q )
∂F ( H , q )
JH =
Jq =
.
∂H H = H0 ,q=q0
∂q
H = H0 ,q =q0
The n x n matrix JH takes the following general form for the cascade of n- tanks
JH
∂F1
∂H
1
∂F2
∂H 1
=
0
M
0
0
0
0
.
0
M
∂fFn
K
∂H n H = H
0
K
0
∂F2
∂H 2
∂F3
∂H 2
∂F3
∂H 3
0
0
0
For n-tank system the Jacobian matrices are in the following form
− C1
α1
1−α 1
β1 ( H 10 )
( H 10 )
α1
C1
J H = ( H 10 )1−α1 β 2 ( H 20 )
M
0
1
β ( H
1 10
0
Jq =
0
M
0
K
0
− C2
α2
1−α 2
β
( H 20 )
2 ( H 20 )
0
0
K
C n−1
( H ( n−1) 0 )
1−α n −1
0
M
− Cn
αn
( H n 0 )1−α n β n ( H n 0 )
0
α n−1
β n ( H n0 )
)
.
The linear model can be used for the local stability analysis and for the design of local controllers
of the pump-controlled system.
4.5 DEFINITIONS OF CONTROL TASKS
Under the Assumptions 1 the following example control problems can be formulated.
Pump-controlled system, open loop control
For a defined objective function find a control q(t) transferring the system from a given initial state
H 0 to a given target state H f in a minimum time, while satisfying:
0 < q( t ) ≤ qmax
0 ≤ H i ( t ) ≤ H i max .
Example: time-optimal control [6].
Close-loop control of pump-controlled system (Fig. 4.24)
For
a
defined
objective
function
find
a
feedback
control
(linear,
q( H 1 , H 2 , H 3 ) stabilizing the system at the given desired state H , while satisfying:
f
0 < q( t ) ≤ qmax
0 ≤ H i ( t ) ≤ H i max .
Controller
H
q
Tank system C1
C2
C3
Fig. 4.24 Pump controlled system, closed loop
H1,
H2
H3
nonlinear)
Valve – controlled system (Fig. 4.25)
Controller
f
H
C1
C2
C3
Tank system
q=const
H1,
H2
H3
Fig. 4.25 Valve-controlled system, closed loop
For a defined objective function find a feedback control C1 ( H 1 ), C2 ( H 2 ), C3 ( H 3 ), stabilizing
the system at the given desired state H f , while satisfying:
0 < Ci ( t ) ≤ Ci max
0 ≤ H i ( t ) ≤ H i max .
The target (desired) state is usually selected as the steady-state (equilibrium) point of the
process.
5. IDENTIFICATION
The identification of the triple tank system consist of the following steps:
•
liquid level sensors characteristic curves,
•
DC pump characteristic curve,
•
proportional valves characteristic curves,
•
identification of parameters of the mathematical model.
The identified parameters and characteristic curves are used in simulation and real-time
experiments (see Section 7).
Parameters and characteristic curves given below and introduced into
Simulink demo models are only examples.
Therefore, it is recommended to identify the current system parameters
before starting experiments.
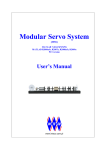
5.1 SENSOR CHARACTERISTIC CURVE
All three tanks are equipped with piezo-resistive pressure transducer (and the appropriate
electronic interface) for measuring the level of the liquid. The pressure sensors provide a very
accurate and linear frequency output — proportional to the applied pressure of liquid. The
characteristic curve of the level sensor which describe liquid level versus frequency can be
essential consider as linear:
Level = Gain*(Freq – freq_bias)
(5.1)
The parameter of the sensor characteristic curve can be obtained by measuring the liquid level
and the corresponding frequency output for at least two points and fitting the characteristic
curve.
For instance, the measured levels of liquid and corresponding output frequencies of three
sensors (Tank1, Tank 2 and Tank 3) are shown in
Table 1.
Fig. 5.26 presents an example of approximation obtained by identification methods for sensor
1 data given in Table 1.
Table 1
Level
sensor 1
sensor 2
sensor 3
[m]
freq1 [Hz]
freq2 [Hz]
freq3 [Hz]
0.05
2805
2795
2743
0.15
3507
3486
3419
0.25
4192
4177
4084
Sensor 1 characteristic
0.3
0.25
Level [m]
0.2
0.15
0.1
0.05
0
-0.05
2400
2600
2800
3000
3200
3400
3600
Sensor output [Hz]
3800
4000
4200
Fig. 5.26 Pressure sensor characteristic. Red points–measurements, solid line–fitting line
When Table 1 is transferred to MATLAB the command polyfit(freq1,Level,1) for sensor 1
gives: a = 0.00014418888640 b = -0.35485335425418 in the linear fitting equation: Level =
a*Frequency +b. Comparison to equation 5.1 results:
Gain_ 1 = 0. 0001441888864 and Bias_ 1 = 2461.03124248978
Similar procedure gives for sensor 2 and sensor 3 following values:
Gain_2 = 0. 00014471780029 and Bias_2 = 2449.5
Gain_3 = 0. 00014913908601 and Bias_3 = 2409.56077554064.
To store permanently the identified parameters the following commands must be executed:
TankScaleCoeff = [Gain_1 Gain_2 Gain_3 1 1]; TankBias=[Bias_1 Bias_2 Bias_3 0 0];
save matlabroot/toolbox/Multitank/m/TankV2PU_Coeff.m4 TankBias TankScaleCoeff -V4;
5.2 IDENTIFICATION OF VALVES
The bottom outflow of each tank is equipped with the controlled valve. The valves are
adjusted using the PWM signal from the power interface. Fig. 5.27 shows characteristic curve
of one of the valves. Fig. 5.28 demonstrates how the outflow depends on the level, for a given
control signals.
5.5
x 10
-5
Valve characteristic
Measured outflow
[m3/s] 5
4.5
4
3.5
3
2.5
2
1.5
1
0.65
0.7
0.75
0.8
0.85
PW M control signal [-]
0.9
0.95
Fig. 5.27 Controlled valve characteristic
Fig. 5.28 Time characteristic curve of the valve
1
5.3 IDENTIFICATION OF PUMP
The system is equipped with DC pump providing liquid transportation from the lowest tank to
the upper tank. The goal of the DC pump is to adjust the inflow to the upper tank according to
the control signals.
The DC pump is supplied from the power interface by an appropriate PWM control signal.
The frequency and pulse width of the PWM signal can be set using the PWM function from
the Tank Class in MATLAB (see section 9) or by setting parameters of the DC driver in
Simulink.
The DC pump experimental characteristic curve (Fig. 5.29) represents dependence between
outflow and (in m3/s) and the pulse width value of the PWM control signal.
The inverse averaged experimental DC pump characteristic curve can be applied in the
control-loop “look-up table” of LQR real-time controller example, (Section 7)
-4
1.8
Pump characteristic
x 10
1.6
1.4
Volume [m3/s]
1.2
1
0.8
0.6
0.4
0.2
0
0.4
0.5
0.6
0.7
PWM control [--]
0.8
0.9
1
Fig. 5.29 DC pump characteristic curves measured for PWM frequency 4.8 kHz
(PWMPrescaler=1 and 12-bit mode)
5.4 IDENTIFICATION OF PARAMETERS OF THE TANKS
For fixed valves settings the following parameters of the mathematical models of the tank
system (Section 4) have to be identified experimentally:
Ci -
resistance of the output orifice of i tank,
αi -
flow coefficient for i tank, i = 1,2,3 .
For each tank the outflow experiment has been performed, the data are collected and the
characteristic curves has been fitted to the data (Fig. 5.30). For this purpose FMINS procedure
from MATLAB Optimization Toolbox was applied for the objective function given as
3
N
k =1
i =1
J = ∑ wk ∑ ( H k ( i ) − H km ( i ))2
where:
H k ( i ) -are the measurements for k-tank at i-time point,
H km ( i ) -are the simulation results for k-tank,
wk – is a weighting coefficient for k-tank.
Hm(0)
Model
Hm(t)
Experimental
data
H(t)
Identification
criteria
J
Optimisation
FMINS
C0
α0
C
α
Initial value
Fig. 5.30 Principle of tank parameters identification
Finally, the parameters given in Fig. 5.31, Fig. 5.32 and Fig. 5.33 were found (example).
C1
0.35
0.3
Fitted line
Experimental data
H1 level [m]
0.25
0.2
0.15
0.1
0.05
0
0
10
20
30
40
50
Time [s]
60
70
80
90
Fig. 5.31 The upper tank identification: C1 = 5.6578e-005, Alfa1 = 0.2900
C2
0.35
Fitted line
Experimental data
0.3
H2 level [m]
0.25
0.2
0.15
0.1
0.05
0
0
10
20
30
40
Time [s]
50
60
70
80
Fig. 5.32 The middle tank identification: C2 = 5.5800e-005, Alfa2 = 0.2256
C3
0.35
0.3
Fitted line
Experimental data
H3 level [m]
0.25
0.2
0.15
0.1
0.05
0
0
10
20
30
40
Time [s]
50
60
70
80
Fig. 5.33 The lower tank identification: C3 = 7.4102e-005, Alfa3 = 0.2487
6. REAL-TIME CONTROL EXPERIMENTS
In the following section a number of control experiments is described. Each experiment
consists of the simulation phase and real-time phase.
The consistence of simulation and experimental results are achieved only if a
proper identification procedures has been applied (including both the static and
dynamic characteristic curves of the process).
6.1 DESIGN OF LINEAR CONTROLLER
The tank system demo presented in this section deals with the control task: reach and stabilize
the levels in tanks at steady-state point H0 by an adjustment of the pump operation.
The steady-state points can be calculated using the formula from Section 4. The design of the
continuous LQ controller is presented below. For a very small value of the sampling time the
response of the discrete system converges to the response of the corresponding continuous
system. It is just our case.
The linearised dynamical model of the triple tank system is described by the linear differential
equations (see Section 4):
dh
= Ah + Bu ,
dt
(6.1)
where the matrices A and B are as follows:
− C1α1
awH 11−α
C1α1
A=
H 2 1−α
H1
w c + b
H 2 max
0
0
1
1
− C2α 2
H 2 1−α
H 2
w c + b
H 2 max
C2α 2
0
0
2
w R 2 − ( H 3 max − H 3 )2 H 21−α
where H0 is equilibrium state of the nonlinear tanks system
− C3α 3
2
w R 2 − ( H 3 max − H 3 )2 H 31−α
3
H =H
0
1
aw
B = 0 ,
0
and h=H-H0 is the modified state vector (deviation from the equilibrium state H 0 ),
u=q- q0 is the deviation of the control relative to from q0 .
A typical quadratic cost function has the form
1∞ T
J ( u ) = ∫ [ h ( τ )Qh( τ ) + u T ( τ )Ru( τ )] dτ ,
20
(6.2)
where:
•
T
Q is a nonnegative definite matrix Q ≥ 0, Q = Q ,
•
T
R is a positive definite matrix R > 0, R = R , in our case R is a scalar,
•
The pair ( A, B ) is controllable.
The weighting matrices Q and R are selected by the designer but they must satisfy the above
conditions. This is most easily accomplished by choosing Q to be diagonal with all diagonal
elements positive or zero.
The LQR optimal scalar control u* is given then by:
u* = − K * h
(6.3)
where K* is the optimal state feedback matrix.
The optimal control problem is now defined as follows: find the gain K such that the feedback
law (7.3) minimizes the cost function (6.2) subject to the state equation (6.1). The optimal
feedback gain can be obtained by iterative solution of the associated matrix Riccati equation:
SA + AT S − SBR −1 B T S + Q = 0
To solve the LQ controller problem the lqry function can be used from the Matlab Control
System Toolbox. The synopsis of lqry is: [K,S,E] = lqry(A,B,C,D,Q,R).
The LQ control simulations and experiments were performed for the following parameters:
•
C1 = 1.0057e-004 , C2 = 1.1963e-004, C3 = 9.8008e-005. These values reffers to
fully open manual valves.
•
Desired levels and control values: H1,0 = 0.1425 m, H2,0 = 0.1007 m, H3,0 = 0.1500 m, and
the corresponding steady- state in-flow: Q0 = 3.7958e-005 m3/s.
•
The starting point: H1(0)= H2(0) = H3(0)= 0 m,
•
1 0 0
The weighting matrices Q and R: Q = 0 1 0, R = 15000000 .
0 0 1
The optimal gain matrix K for considered parameters was calculated as
K * = [0.1983e - 3 0.0765e - 3 0.0496e - 3] .
Simulation
The LQR simulation can be performed from the Tank System Multitank Control Window by
invoking LQR from the group Simulation Models. After clicking the LQR block the following
window opens (Fig. 6.34).
Tank 3 LQR Controller
Control
Level1
Level1
Level2
Control
Level2
Saturation
Level3
Level3
Levels
Tank3 Model
K3
H30
-KH10
K2
H20
-KH20
K1
H10
-KH30
Q0
Q0
Fig. 6.34 The Simulink model for the LQR controller.
Notice that the control signal is q= u + Q0
The steady-state desired value H10, H20, H30 and Q0 were introduced into constant blocks
H10, H20, H30, Q0 respectively (see equation 5.6), as well as the optimal gain vector K (gain
blocks K1, K2, K3). The identified parameters of the model as well as the starting point
(initial conditions) can be set by double clicking the Tank Model block (Fig. 6.35).
Fig. 6.35 Mask of the Tank Model block
The simulation results are given in Fig. 6.36, Fig. 6.37, Fig. 6.38 and Fig. 6.39. The levels
have achieved the desired value after 520 seconds approximately.
-5
8.5
x 10
0.16
8
0.14
7.5
0.12
0.1
6.5
H1 [m]
control [m3/s]
7
6
5.5
0.08
0.06
5
0.04
4.5
0.02
4
3.5
0
100
200
300
time [m]
400
500
600
Fig. 6.36 Pump control signal (simulation)
0
0
100
200
300
time [m]
400
500
Fig. 6.37 Level H1 (simulation)
600
0.12
0.16
0.14
0.1
0.12
0.08
H3 [m]
H2 [m]
0.1
0.06
0.08
0.06
0.04
0.04
0.02
0.02
0
0
100
200
300
time [m]
400
500
0
600
Fig. 6.38 Level H2 (simulation)
0
100
200
300
time [m]
400
500
600
Fig. 6.39 Level H3 (simulation)
Real-time experiment
The LQ experiment can be performed from the Multitank Control Window by
invoking LQR Experiment from the Demo Controllers group. After clicking on the block the
following window opens (Fig. 6.40). The Tank Model block is replaced by the drivers block
(see description in Section 3). The inverted characteristic curve of the pump is represented by
it Look_Up Table.
T an k 3 L Q R C o n tro ller
Co n t ro l
Co n t ro l
DC P u mp
C h a ra cte ristic
Lev el 1
0
Lev el 2
V a lve 1
0
Lev el 3
V a lve 2
L e ve ls
0
V a lve 3
T a n k3
Te rm in a to r
K3
H3 0
-K H3 0
K2
H2 0
-K H2 0
S a tu ra tio n
Co n t ro l
K1
H10
-K H10
Q0
Q0
Fig. 6.40 LQR real-time controller
The results of experiments are given in Fig. 6.41, Fig. 6.42, Fig. 6.43 and Fig. 6.44.
-5
8
x 10
0.16
7.5
0.14
0.12
6.5
0.1
6
H1 [m]
control [m3/s]
7
5.5
0.08
5
0.06
4.5
0.04
4
0.02
3.5
0
100
200
300
time [m]
400
500
0
600
0
100
Fig. 6.41 Pump control signal
0.16
0.09
0.14
0.08
400
500
600
500
600
0.12
0.07
0.1
0.06
H3 [m]
H1 [m]
300
time [m]
Fig. 6.42 H1 level
0.1
0.05
0.08
0.06
0.04
0.04
0.03
0.02
0.02
0.01
200
0
100
200
300
time [m]
400
500
600
Fig. 6.43 H2 level
0
0
100
200
300
time [m]
400
Fig. 6.44 H3 level
6.2 FUZZY CONTROLLER
In this section we demonstrate how to develop and edit fuzzy inference systems “by hand”,
using Fuzzy Toolbox from Mathworks. The following steps are essential in the design of a
fuzzy controller:
•
selection of input/output variables,
•
scaling the variables (if necessary),
•
definition of membership functions for all variables –“fuzzification”,
•
development of the inference mechanism – fuzzy rules,
•
selection of the “defuzzification” strategy,
•
re-scaling the variables (if necessary).
There are two methods of building a fuzzy controller: interactive using the graphical tool and
automatic using the clustering and adaptive neuro-fuzzy mechanism. There are also two types
of fuzzy inference system: Mamdani and Sugeno. In this section we focus on the Mamdani
inference system edited interactively. This approach makes possible to understand in a direct
way consequences of modifications being introduced into the inference mechanism and
membership functions.
The proposed fuzzy controller for the tank system has three inputs and one output (control).
The input variables are the following:
dH 1 = H 10 − H 1 , dH 2 = H 20 − H 2 , dH 3 = H 30 − H 3 , where:
H10
H1
H 0 = H 20 desired levels, H = H 2 current value of levels.
H 30
H 3
The presented fuzzy controller uses Mamdami inference system. The Control Surface (Fig.
6.45) is generated with three membership function for dH1, dH2, dH3 for input signals, three
membership function for control signal (Fig. 6.46) and 27 rules presented in Table. 6.1.
-5
x 10
Pump Control [m3/s]
2
1
0
-1
-2
-0.2
0
0.2
-0.2
0.2
0.1
0
-0.1
dH2 [m]
dH1 [m]
Fig. 6.45 Pump control surface versus dH1 and dH2 input signals
Minimum
1
Medium
Maximum
Minimum
1
0.6
0.4
0.6
0.4
0.2
0.2
0
0
-0.2
Maximum
0.8
Degree of membership
Degree of membership
0.8
Medium
-0.15
-0.1
-0.05
0
dH1 [m]
0.05
0.1
0.15
0.2
-0.2
-0.15
-0.1
-0.05
0
dH2 [m]
0.05
0.1
0.15
0.2
Minimum
1
Medium
Maximum
Minimum
1
0.6
0.4
0.2
0.6
0.4
0.2
0
-0.2
Maximum
0.8
Degree of membership
Degree of membership
0.8
Medium
0
-0.15
-0.1
-0.05
0
dH3 [m]
0.05
0.1
0.15
0.2
-4
-3
-2
-1
0
1
Pump Control [m3/s]
2
3
4
-5
x 10
Fig. 6.46 Membership function for dH1, dH2, dH3 and pump control signals
Table 6.1. Rules for fuzzy controller
No.
Rule
1
If (dH1 is Maximum) and (dH2 is Maximum) and (dH3 is Maximum) then (Pump Control is Minimum)
2
If (dH1 is Maximum) and (dH2 is Maximum) and (dH3 is Medium) then (Pump Control is Minimum)
3
If (dH1 is Maximum) and (dH2 is Maximum) and (dH3 is Minimum) then (Pump Control is Minimum)
4
If (dH1 is Medium) and (dH2 is Medium) and (dH3 is Maximum) then (Pump Control is Medium)
5
If (dH1 is Medium) and (dH2 is Medium) and (dH3 is Medium) then (Pump Control is Medium)
6
If (dH1 is Medium) and (dH2 is Medium) and (dH3 is Minimum) then (Pump Control is Maximum)
7
If (dH1 is Minimum) and (dH2 is Minimum) and (dH3 is Maximum) then (Pump Control is Maximum)
8
If (dH1 is Minimum) and (dH2 is Minimum) and (dH3 is Medium) then (Pump Control is Maximum)
9
If (dH1 is Minimum) and (dH2 is Minimum) and (dH3 is Minimum) then (Pump Control is Maximum)
10
If (dH1 is Maximum) and (dH2 is Medium) and (dH3 is Maximum) then (Pump Control is Minimum)
11
If (dH1 is Medium) and (dH2 is Maximum) and (dH3 is Maximum) then (Pump Control is Minimum)
12
If (dH1 is Maximum) and (dH2 is Medium) and (dH3 is Medium) then (Pump Control is Minimum)
13
If (dH1 is Medium) and (dH2 is Maximum) and (dH3 is Medium) then (Pump Control is Medium)
14
If (dH1 is Maximum) and (dH2 is Medium) and (dH3 is Minimum) then (Pump Control is Medium)
15
If (dH1 is Medium) and (dH2 is Maximum) and (dH3 is Minimum) then (Pump Control is Medium)
16
If (dH1 is Minimum) and (dH2 is Medium) and (dH3 is Maximum) then (Pump Control is Maximum)
17
If (dH1 is Medium) and (dH2 is Minimum) and (dH3 is Maximum) then (Pump Control is Medium)
18
If (dH1 is Minimum) and (dH2 is Medium) and (dH3 is Medium) then (Pump Control is Maximum)
19
If (dH1 is Medium) and (dH2 is Minimum) and (dH3 is Medium) then (Pump Control is Maximum)
20
If (dH1 is Minimum) and (dH2 is Medium) and (dH3 is Minimum) then (Pump Control is Maximum)
21
If (dH1 is Medium) and (dH2 is Minimum) and (dH3 is Minimum) then (Pump Control is Maximum)
22
If (dH1 is Minimum) and (dH2 is Maximum) and (dH3 is Minimum) then (Pump Control is Medium)
23
If (dH1 is Maximum) and (dH2 is Minimum) and (dH3 is Minimum) then (Pump Control is Medium)
24
If (dH1 is Minimum) and (dH2 is Maximum) and (dH3 is Medium) then (Pump Control is Medium)
25
If (dH1 is Maximum) and (dH2 is Minimum) and (dH3 is Medium) then (Pump Control is Medium)
26
If (dH1 is Minimum) and (dH2 is Maximum) and (dH3 is Maximum) then (Pump Control is Medium)
27
If (dH1 is Maximum) and (dH2 is Minimum) and (dH3 is Maximum) then (Pump Control is Medium)
Simulation
Simulation of the fuzzy control is performed for the following parameters:
•
Desired levels and control values: H10=0.096 m, H20=0.166 m, H30=0.172 m,
q0=34.33e-4 m3/s.
•
The start point: H1(0)= H2(0)= H3(0)=0.0 m.
Before running the simulation and experiment write in the MATLAB Command Window:
>> Tank3_Fis = readfis(‘Tank3_Fis’);
The Tank3_Fis.fis file (so called FIS matrix) is loaded to the MATLAB workspace and can
be used by Fuzzy Logic Controller block. The simulation model of the fuzzy controller is
given in Fig. 6.47 and Fig. 6.48.
Fuzzy Controller
Control
Level1
Level1
Level2
Control
Level2
Saturation
Level3
Level3
Tank3 Model
Levels
Saturation1
H10
0.096
Fuzzy Logic
Controller
Saturation2
H20
0.166
Saturation3
Q0
0.3433e-4
Fig. 6.47 Real-time fuzzy controller
H30
0.172
Fig. 6.48 Mask of the Fuzzy Logic Controller block
The examples of simulation results are given in Fig. 6.49, Fig. 6.50, Fig. 6.51 and Fig. 6.52.
-5
10
x 10
0.16
9
0.14
0.12
0.1
7
H1 [m]
Pump control [m3/s]
8
6
0.08
0.06
5
0.04
4
0.02
0
100
200
300
Time [s]
400
500
0
600
0
100
Fig. 6.49 Pump control signal
200
300
Time [s]
400
500
600
500
600
Fig. 6.50 H1 level
0.2
0.18
0.18
0.16
0.16
0.14
0.14
0.12
H3 [m]
H2 [m]
0.12
0.1
0.1
0.08
0.08
0.06
0.06
0.04
0.04
0.02
0.02
0
0
100
200
300
Time [s]
400
Fig. 6.51 H2 level
500
600
0
0
100
200
300
Time [s]
400
Fig. 6.52 H3 level
Real-time Experiment
The fuzzy control experiment can be performed from the Multitank Control Window by
invoking Fuzzy from the Demo Controllers group. In the model of the control system (Fig.
6.53) the Tank Model block was replaced by the driver block.
Before running experiment the FIS matrix must be loaded using following command in
MATLAB Workspace:
Tank3_Fis=readfis('Tank3_Fis');
Tank 3 Fuzzy Controller
Control
Lev el 1
Lev el 1
DC Pump
Characteristic1
0
Lev el 2
Valve1
0
Lev el 3
Valve2
Levels
0
Terminator
Valve3
Tank3
Saturation1
H10
0.0915
Fuzzy Logic
Controller
Saturation2
Saturation
Control
H20
0.09
Saturation3
H30
Constant3
0.0775
4.4e-5
Fig. 6.53 Tank system fuzzy controller
The results of experiments are given below (Fig. 6.54).
-5
10
x 10
0.18
9
0.16
0.14
0.12
7
H1 [m]
Pump control [m3/s]
8
6
0.1
0.08
0.06
5
0.04
4
0.02
0
50
100
150
200
250
300
Time [s]
350
400
450
0
500
0
50
100
150
0.2
0.2
0.18
0.18
0.16
0.16
0.14
0.14
0.12
0.12
0.1
0.08
0.06
0.06
0.04
0.04
0.02
0.02
0
50
100
150
200
250
300
Time [s]
H2 level
350
400
350
400
450
500
350
400
450
500
0.1
0.08
0
250
300
Time [s]
H1 level
H3 [m]
H2 [m]
Pump control signal
200
450
500
0
0
50
100
150
200
250
300
Time [s]
H3 level
Fig. 6.54 Results of fuzzy control experiment
7. PROTOTYPING AN OWN CONTROLLER IN
RTWT ENVIRONMENT
In this section the method of building your own controller is described. The Real Time
Windows Target (RTWT) toolbox is used. Section 9 shows how to use the Tank software.
Here we introduce the reader how to proceed in the RTWT environment.
Before start, test your MATLAB configuration by building and running an
example of real-time application. Real-time Windows Target Toolbox includes
the rtvdp.mdl model. Running this model will test the installation by running
Real-Time Workshop, Real-Time Windows Target, and the Real-Time
Windows Target kernel.
In the MATLAB window, type
rtvdp
Next, build and run the real-time model.
To build the system that operates in the real-time mode the user has to:
•
create a Simulink model of the control system which consists of the Tank Device
Driver and other blocks chosen from the Simulink library,
•
build the executable file under RTWT (see the pop-up menus in Fig. 7.55)
Fig. 7.55 Creating the executable file under RTWT
•
start the real-time code to run from the Simulation/Connect to target and the
Simulation/Start real-time code pull-down menus.
7.1 CREATING A MODEL
The simplest way to create a Simulink model for the tank system is to use one of the models
included in the Multitank Control Window as a template. For example, the Tank3_Relay can
be saved as the MySystem.mdl Simulink diagram. The MySystem Simulink model is shown in
Fig. 7.56 .
Fig. 7.56 The MySystem Simulink model
Now, you can modify the model. You have absolute freedom to develop your own controller.
Remember, not to delete the Tank3 driver model. This is necessary to support the data
communication with the PCI I/O board.
Though it is not obligatory, we recommend you to leave the scope (Tank block in Fig. 7.56).
You need a scope to watch how the system runs. Other blocks in the window are not
necessary for a new project.
Creating your own model on the basis of the old example ensures that all internal options of
the model are set properly. These options are required to proceed with compiling and linking
in a proper way. To put the Tank Device Driver into the real-time code a special makefile is
required. This file is included to the Tank software.
You can use the most of the blocks from the Simulink library. However, some of them can
not be used (see MathWorks references manual for details).
The scope block properties are important for appropriate data acquisition and watching how
the system runs. The Scope block properties are defined in the Scope property window (see
Fig. 7.57). This window opens after the selection of the Scope/Properties tab. You can gather
measurement data to the Matlab Workspace marking the Save data to workspace checkbox.
The data is placed under Variable name. The variable format can be set as structure or matrix.
The default Sampling Decimation parameter value is set to 1. This means that each measured
point is plotted and saved. Often we choose the Decimation parameter value equal to 5 or 10.
It is a good choice to get enough points to describe the signal behaviour and to save the
computer memory.
Fig. 7.57 Setting the parameters of the Scope block
When the Simulink model is ready, click the Tools/External Mode Control Panel option and
click the Signal Triggering button. The window given in Fig. 7.58 opens. Select XT Scope,
set Source as manual, set Duration equal to the number of samples you intend to collect, and
finally close the window.
Fig. 7.58 External Signal & Triggering window
7.2 CODE GENERATION AND BUILD PROCESS
Once a model of the system has been created the code for the real-time mode can be
generated, compiled, linked and downloaded into the target processor.
The code is generated by the use of Target Language Compiler (TLC) (see description of the
Simulink Target Language). The makefile is used to build and download object files to the
target hardware automatically.
First, you have to specify the simulation parameters of your Simulink model in the Simulation
parameters dialog box (Fig. 7.59). The Real-Time Workshop and Solver tabs contain critical
parameters.
Fig. 7.59 Solver tag
The Solver tab allows you to set the simulation parameters. Several parameters and options
are available in the window. The Fixed-step size editable text box is set to 0.01 (this is the
sampling period in seconds).
The Start time has to be set to 0 (Fig. 7.59). The solver method has to be selected. In our
example the fifth-order integration method − ode5 is chosen. The Stop time field defines the
length of the experiment. This value may be set to a large number. Each experiment can be
terminated by pressing the Stop real-time code button.
The Fixed-step solver is obligatory for real-time applications. If you use an
arbitrary block from the discrete Simulink library or a block from the drivers’
library remember, that different sampling periods must have a common
divider.
Third party compiler is not requested. The built-in Open Watcom compiler is used to create
real-time executable code for RTWT.
The RTW tag is shown in Fig. 7.60. The system target file name is rtwin.tlc. It manages the
code generation process. Notice, that rtwin.tmf template makefile is used. This file is default
one for RTWT building process.
Fig. 7.60 Configuration parameters page for MATLAB
If all the parameters are set properly you can start the real-time executable building process.
For this purpose press the Build push button at the Real Time Workshop tag (Fig. 7.59), or
simply “CRTL + B”. Successful compilation and linking processes generate the following
message:
Model MyModel.rtd successfully created
### Successful completion of Real-Time Workshop build procedure for model: MyModel
Otherwise, an error message is displayed in the MATLAB Command Window.
In this case check again your MATLAB configuration and simulation parameters.
8. DESCRIPTION OF THE TANK CLASS
PROPERTIES
The Tank is a MATLAB class, which gives the access to all the features of the RT-DAC/PCI
board equipped with the logic for the tank model. The RT-DAC/PCI board is an interface
between the control software executed by a PC computer and the power-interface of the
multitank system. The board contains the following blocks:
•
PWM generation block – the FPGA logic generates up to six signals. The PWM
prescaler for each PWM block determines the frequency of the corresponding PWM wave.
The PWM waves control up to five valves and the pump. The default prescaler value is 31
which is equivalent to the PWM wave frequency equal to 305Hz. This frequency is
recommended for the valves and for the pump. The PWM blocks can operate in two
modes: 8-bit resolution and 12-bit resolution. The 12-bit mode is selected as the default
one. In the 12-bit mode a single PWM period contains 4095 impulses of the output
prescaler frequency. The time of logic output ‘1’ is set by a number from 0 to 4095. In the
8-bit mode a PWM period contains 255 impulses of the output prescaler frequency. The
time of logic ‘1’ is set by a number from 0 to 255. The 8-bit mode is used for high speed.
The 12-bit mode gives a high accuracy,
•
Digital inputs are responsible for reading the signals from frequency sensors of a liquid
levels. The input is proportional to the liquid level. The Tank class converts the value read
from the D input to the level expressed in meters.
All the parameters and measured variables from the RT-DAC/PCI board are accessible by the
appropriate methods of the Tank class. The object of the Tank class is created by the
command:
object_name = tank;
The get method is called to read a value of the property of the object:
property_value = get( object_name, ‘property_name’ );
The set method is called to set new value of the given property:
set( object_name, ‘property_name’, new_property_value );
The display method is applied to display the property values when the object_name is entered
in the MATLAB command window.
This section describes all the properties of the Tank class. The description consists of the
following fields:
Purpose
Provides short description of the property
Synopsis
Shows the format of the method calls
Description
Describes what the property does
Arguments
Describes arguments of the set method
See
Refers to other related properties
Examples
Provides examples how the property can be used
8.1 BASEADDRESS
Purpose:
Read the base address of the RT-DAC/PCI board.
Synopsis:
BaseAddress = get( TankObj, ‘BaseAddress’ );
Description:
The base address of RT-DAC/PCI board is determined by operating system.
Each Tank object has to know the base address of the board. When a Tank
object is created the base address is detected automatically. The detection
procedure detects the base address of the first RT-DAC/PCI board plugged
into the PCI slots.
Example: Create the Tank object:
TankObj = tank;
Display its properties by typing the command:
TankObj
Type:
BaseAddress:
Bitstream ver.:
PWM:
PWMPrescaler:
PWMMode:
Valve:
Pump:
Scaling coeff.:
Zero level bias:
Frequency:
Level:
Safety max.:
Safety min.:
Safety flag:
Safety alert:
Tank Object
54272 / D400Hex
x202
[ 4095
0 4095 4095
0
0 ]
[ 1 31 31 31 31 31 ]
[ 1 1 1 1 1 1 ]
[ 1 1 0 0 0 ]
[ 1 ]
[ 0.0001 0.0001 0.0002 1.000 1.000 ]
[ 0.002 0.002 0.002 0.000 0.000 ]
[ 2430
4746
3143
0.000 0.000 ] [Hz]
[ 0.029 0.238 0.171 0.000 0.000 ] [m]
[ 0.306 0.306 0.306 0.306 0.306 ] [m]
[ 0.297 0.297 0.297 0.297 0.297 ] [m]
[ 1 1 1 1 1 ]
[ 1 ]
Read the base address:
BA = get( TankObj, ‘BaseAddress’ );
8.2 BIAS
Purpose:
The bias level of the liquid level measurements. The bias values are equal to
the levels read from the A/D converters when the tanks are empty. When a
new value of this property is set the new biases are stored in a file for future
use.
Synopsis:
B = get( TankObj, ‘Bias’ );
set( TankObj, ‘Bias’, NewBias );
Description:
The bias value is subtracted from value obtained from the A/D converter to
obtain the bias-less level value.
See:
ScaleCoeff
Examples:
see Section 3.2
8.3 BITSTREAMVERSION
Purpose:
Read the version of the logic design for the RT-DAC/PCI board.
Synopsis:
Version = get( TankObj, ‘BitstreamVersion’ );
Description:
This property determines the version of the logic design of the
RT-DAC/PCI board. The tank systems may be different and the detection of
the logic design version makes it possible to check if the logic design is
compatible with the physical model.
8.4 PWM
Purpose:
Set and get the duty cycle of the PWM waves.
Synopsis:
PWM = get( TankObj, ‘PWM’ );
set( TankObj, ‘PWM’, NewPWM );
Description:
The property determines the duty cycle of the PWM waves for the valves
and for the pump. The first PWM channel is responsible for the pump
control. The remaining five channels are applied to control the valves. The
NewPWM variable is a 1x6 vector. Each element of these vectors
determines the parameters of the single PWM wave. The values of the
elements of this vector can vary from 0 to 255 if the 8-bit mode is used, and
from 0 to 4095 if the 12-bit mode is selected. The value 0.0 means the zero
control and the maximum means the maximum control.
The values of the PWM property are equivalent to the internal
RT-DAC/PCI board values. The most convenient way to control the
pump and the valves if use the Valves and the Pump properties.
Example:
set( TankObj, ‘PWM’, [ 1024 1024 2048 0 0 ] );
See:
Pump, Valve, PWMPrescaler, PWMMode
8.5 PWMPRESCALER
Purpose:
Determine the frequency of the PWM waves.
Synopsis:
Prescaler = get( TankObj, ‘PWMPrescaler’ );
set( TankObj, ‘PWMPrescaler’, NewPrescaler );
Description:
The input frequency for the PWM channels is equal to 40MHz. This
frequency is divided by the counter (called prescaler), which creates the
PWM base period. The NewPrescaler variable is a 1x6 vector. Each element
of these vectors determines the parameters of the single PWM wave
frequency. The valid prescaler values are numbers from 0 to 65535. The
frequency of the PWM wave is calculated from the formula:
f PWM =
f xtal
for 8-bit mode,
( prescaler + 1) ∗ 255
f PWM =
f xtal
for 12-bit mode.
( prescaler + 1) ∗ 4095
The recommended working conditions of the pump and the valves
require that the PWM waves frequency is approximately equal to 300Hz.
In the 12-bit operating mode this frequency corresponds to the prescaler
value 31 and should not be changed.
See:
PWM, PWMMode
Example:
To set the prescaler value equal to 31 for all the PWM channels execute the
command:
set( TankObj, ‘PWMPrescaler’, [ 31 31 31 31 31 ] );
8.6 PWMMODE
Purpose:
Determines the 8-bit or 12-bit PWM mode.
Synopsis:
Mode = get(TankObj, ‘PWMMode’ );
set( TankObj, ‘PWMMode’, NewMode );
Description:
The PWM blocks can operate in two modes: 8-bit resolution and 12-bit
resolution. The 12-bit mode is selected as the default one. In the 12-bit mode
a single PWM period contains 4095 impulses. The time of logic output ‘1’ is
set by a number from 0 to 4095. In the 8-bit mode a PWM period contains
255 impulses. The time of logic ‘1’ is set by a number from 0 to 255. The 8bit mode is used for high speed. The 12-bit mode gives a high accuracy and is
selected as the default mode for all the tank experiments.
The NewMode variable is a 1x6 vector. Each element of these vectors
determines the operating mode of the single PWM wave. The value of 0
selects the 8-bit mode and the value of 1 selects the 12-bit mode.
See:
PWM, PWMPrescaler
Example:
To set the 12-bit PWM generation mode execute the command:
set( TankObj, ‘PWMMode’, [ 1 1 1 1 1 ] );
8.7 VALVE
Purpose:
Set and get the control value for the valves.
Synopsis:
PWM = get( TankObj, ‘Valve’ );
set( TankObj, ‘Valve’, NewValveControl );
Description:
The property determines the control value for the valves. The
NewValveControl variable is a 1x5 vector. Each element of these vectors
determines the control for a single valve starting from the upper tank. The
values of the elements of this vector can vary from 0.0 to 1.0. The value of
0.0 means the zero control and the vale of 1.0 means the maximum control.
If the control is equal to 0.0 the valve is closed. If it is equal to 1.0 the valve
is fully opened.
See:
Pump, PWM
Example:
To open only the upright valve execute the following command:
set( TankObj, ‘Valve’, [ 1 0 0 0 0 ] );
8.8 PUMP
Purpose:
Set and get the control value for the pump.
Synopsis:
PWM = get( TankObj, ‘Pump’ );
set( TankObj, ‘Valve’, NewPumpControl );
Description:
The property determines the control value for the pump. The
NewPumpControl variable is a scalar. Its value can vary from 0.0 to 1.0.
The 0.0 value means the zero control and the 1.0 value means the maximum
control. If the control is equal to 0.0 the pump is stopped. If it is equal to 1.0
the outflow from the pump is the maximum.
See:
Valve, PWM
Example:
To establish the 0.5 value control to the pump execute the following
command:
set( TankObj, ‘Pump’, 0.5 );
8.9 SCALECOEFF
Purpose:
Return and set the scaling coefficient of the liquid level measurements.
When a new value of this property is set the new scaling coefficients are
stored in a file for future use.
Synopsis:
SC = get( TankObj, ‘ScaleCoeff’ );
set( TankObj, ‘ScaleCoeff’, NewScaleCoeff );
Description:
The values obtained from the A/D converter are multiplied by the scale
coefficients to obtain the levels expressed in meters.
See:
Bias
Example:
See Section 3.2
8.10 TIME
Purpose:
Return time information.
Synopsis:
T = get( TankObj, ‘Time’ );
Description:
The Tank object contains the time counter. When a Tank object is created
the time counter is set to zero. Each reference to the Time property updates
their value. The value is equal to the number of milliseconds past since the
object was created.
8.11 SAFETYFLAG
Purpose:
Return the safety level flags.
Synopsis:
SLF = get( TankObj, ‘SafetyFlag’ );
Description:
The I/O board applied to control the multi-tank system processes the liquid
level measurements to avoid the overflow. For each tank maximum and
minimum liquid level is defined that turns on and off the safety alert flag. If
a safety flag is active the level in the appropriate tank influences the safety
alert. When the level in a safety-active tank exceeds the maximum level the
pump and the automatic valves are turned off. The control is set by the I/O
board to zero regardless of the control value sent out from the
MATLAB/Simulink environment. The system returns to the normal
operating mode if all levels in safety-active tanks fall under the minimum
level. Such a safety algorithm allows to avoid the liquid overflow only in
the case when the manual valves are closed. If they are not closed the
overflow may occur.
This property returns five safety
flags.
See:
SafetyMax, SafetyMin, SafetyAlert
8.12 SAFETYMAX
Purpose:
Return the maximum allowed liquid level.
Synopsis:
SLF = get(TankObj, ‘SafetyMax’ );
Description:
When the level in a safety-active tank exceeds the maximum level, the
pump and the automatic valves are turned off. The control is set by the I/O
board to zero regardless of the control value sent out from the
MATLAB/Simulink environment. The system returns to the normal
operating mode if all levels in safety-active tanks go below the minimum
level.
This property returns five maximum levels.
See:
SafetyFlag, SafetyMin, SafetyAlert
8.13 SAFETYMIN
Purpose:
Return the minimum liquid level that deactivates the safety alert.
Synopsis:
SLF = get( TankObj, ‘SafetyMin’ );
Description:
When the safety alert
flag is activated the system returns to the normal operating mode if all levels
in safety-active tanks fall under the minimum level.
This property returns five
minimum levels.
See:
SafetyFlag, SafetyMax, SafetyAlert
8.14 SAFETYALERT
Purpose:
Return the safety alert flag.
Synopsis:
SLF = get( TankObj, ‘SafetyAlert’ );
Description:
When the level in a safety-active tank exceeds the maximum level the pump
and the automatic valves are turned off. Such conditions trigger the safety
alert flag as well. The control is set by the I/O board to zero regardless of
the control value sent out from the MATLAB/Simulink environment. The
system returns to the normal operating mode (the safety alert flag is
inactive) if all levels in safety-active tanks go below the minimum level.
This property returns 0 value for inactive safety alert flag and 1 value
otherwise.
See:
SafetyFlag, SafetyMin, SafetyMax
8.15 THE TANK CLASS QUICK REFERENCE TABLE
Property Name
Description
BaseAddress
Read the base address of the RT-DAC/PCI board
BitstreamVersion
Read the version of the logic design of the RT-DAC/PCI board
PWM
Duty cycle of the PWM channels
PWMPrescaler
Prescaler values of the PWM channels
PWMMode
Mode of the PWM channels
Valve
Control values of the valves
Pump
Control value of the pump
ScaleCoeff
Frequency -to-level scaling coefficients
Bias
Frequency bias levels
SafetyFlag
Safety function flags for the tanks
SafetyMax
Maximum safety function levels
SafetyMin
Minimum safety function levels
SafetyAlert
Safety alert flag
Time
Return time information
9. REFERENCES
[1] Graebe S.F., Goodwin G.C., Control Design and Implementation in Continuous Steel
Casting, IEEE Control Systems, August 1995, pp. 64-71
[2] Cheung Tak-Fal, Luyben W.L., Liquid Level Control in Single Tanks and Cascade of
Tanks with Proportional-Only and Proportional-Integral Feedback Controllers, Ind. Eng.
Chem. Fundamentals, vol. 18, No. 1, 1979, pp. 15-21.
[3] Heckenthaler T., Engell S., Approximately Time-Optimal Fuzzy Control of a Two-Tank
System, IEEE Control Systems, pp.24-30, 1994.
[4] Galichet S., Foulloy L., Fuzzy Logic Control of a Floating Level in a Refinery Tank, Proc.
Of 3rd IEEE Int. Conference on Fuzzy Systems, Orlando, June 1994, pp. 1538-1542.
[5] Street R. L., Watters G. Z., Vennard J. K., Elementary Fluid Mechanics, John
Wiley&Sons Inc., 1996.
[6] Grega W., Heterogeneous Control Laws in Open Architecture Enviroment, Third
International Symposium on Methods and Models in Automation and Robotics,
Międzyzdroje, Poland, September, 1996, pp. 1097-1102.
[7] Rosol M., Control of Nonlinear Liquid Flow Process, PhD Thesis – in Polish, (Grega W.
supervisor), AGH University of Science and Technology, Department of Control, Krakow,
2001