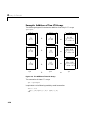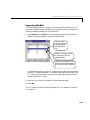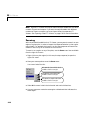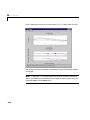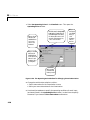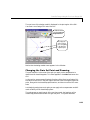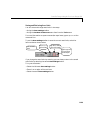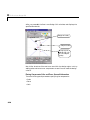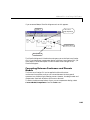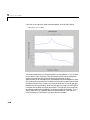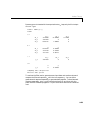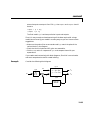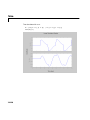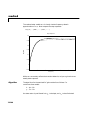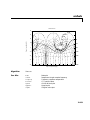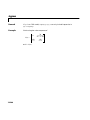
1
Control System Toolbox For Use with MATLAB ® Computation Visualization Programming User’s Guide Version 4.2 How to Contact The MathWorks: ☎ 508-647-7000 Phone 508-647-7001 Fax The MathWorks, Inc. 24 Prime Park Way Natick, MA 01760-1500 Mail http://www.mathworks.com Web Anonymous FTP server Newsgroup PHONE FAX ✉ MAIL INTERNET ftp.mathworks.com comp.soft-sys.matlab @ [email protected] [email protected] [email protected] [email protected] [email protected] [email protected] [email protected] Technical support Product enhancement suggestions Bug reports Documentation error reports Subscribing user registration Order status, license renewals, passcodes Sales, pricing, and general information Control System Toolbox User’s Guide COPYRIGHT 1992 - 1999 by The MathWorks, Inc. The software described in this document is furnished under a license agreement. The software may be used or copied only under the terms of the license agreement. No part of this manual may be photocopied or reproduced in any form without prior written consent from The MathWorks, Inc. U.S. GOVERNMENT: If Licensee is acquiring the Programs on behalf of any unit or agency of the U.S. Government, the following shall apply: (a) For units of the Department of Defense: the Government shall have only the rights specified in the license under which the commercial computer software or commercial software documentation was obtained, as set forth in subparagraph (a) of the Rights in Commercial Computer Software or Commercial Software Documentation Clause at DFARS 227.7202-3, therefore the rights set forth herein shall apply; and (b) For any other unit or agency: NOTICE: Notwithstanding any other lease or license agreement that may pertain to, or accompany the delivery of, the computer software and accompanying documentation, the rights of the Government regarding its use, reproduction, and disclosure are as set forth in Clause 52.227-19 (c)(2) of the FAR. MATLAB, Simulink, Stateflow, Handle Graphics, and Real-Time Workshop are registered trademarks and Target Language Compiler are trademarks of The MathWorks, Inc. Other product or brand names are trademarks or registered trademarks of their respective holders. Printing History: July 1992 December 1996 January 1998 January 1999 First printing Second printing Revised for MATLAB 5 Third printing Revised for MATLAB 5.2 Fourth printing Revised for Version 4.2 (Release 11) Contents Preface Installation . . . . . . . . . . . . . . . . . . . . . . . . . . . . . . . . . . . . . . . . . . . . . 3 Getting Started . . . . . . . . . . . . . . . . . . . . . . . . . . . . . . . . . . . . . . . . . 4 Typographic Conventions . . . . . . . . . . . . . . . . . . . . . . . . . . . . . . . 5 Quick Start 1 LTI Models . . . . . . . . . . . . . . . . . . . . . . . . . . . . . . . . . . . . . . . . . . . MIMO Systems . . . . . . . . . . . . . . . . . . . . . . . . . . . . . . . . . . . . . . Model Conversion . . . . . . . . . . . . . . . . . . . . . . . . . . . . . . . . . . . . LTI Arrays . . . . . . . . . . . . . . . . . . . . . . . . . . . . . . . . . . . . . . . . . . 1-3 1-4 1-5 1-6 LTI Properties . . . . . . . . . . . . . . . . . . . . . . . . . . . . . . . . . . . . . . . . 1-7 Model Characteristics . . . . . . . . . . . . . . . . . . . . . . . . . . . . . . . . 1-10 Operations on LTI Models . . . . . . . . . . . . . . . . . . . . . . . . . . . . 1-11 Continuous/Discrete Conversions . . . . . . . . . . . . . . . . . . . . . 1-13 Time and Frequency Response . . . . . . . . . . . . . . . . . . . . . . . . 1-14 The LTI Viewer . . . . . . . . . . . . . . . . . . . . . . . . . . . . . . . . . . . . . . 1-17 i System Interconnections . . . . . . . . . . . . . . . . . . . . . . . . . . . . . 1-19 Control Design Tools . . . . . . . . . . . . . . . . . . . . . . . . . . . . . . . . . 1-20 The Root Locus Design GUI . . . . . . . . . . . . . . . . . . . . . . . . . . . 1-23 LTI Models 2 Introduction . . . . . . . . . . . . . . . . . . . . . . . . . . . . . . . . . . . . . . . . . . LTI Models . . . . . . . . . . . . . . . . . . . . . . . . . . . . . . . . . . . . . . . . . . Using LTI Models in the Control System Toolbox . . . . . . . . . . . Other Uses of FRD Models . . . . . . . . . . . . . . . . . . . . . . . . . . . LTI Objects . . . . . . . . . . . . . . . . . . . . . . . . . . . . . . . . . . . . . . . . . . Creating an LTI Object: An Example . . . . . . . . . . . . . . . . . . . LTI Properties and Methods . . . . . . . . . . . . . . . . . . . . . . . . . . Precedence Rules . . . . . . . . . . . . . . . . . . . . . . . . . . . . . . . . . . . . . Viewing LTI Systems As Matrices . . . . . . . . . . . . . . . . . . . . . . . Command Summary . . . . . . . . . . . . . . . . . . . . . . . . . . . . . . . . . . 2-2 2-2 2-3 2-3 2-3 2-4 2-4 2-5 2-5 2-6 Creating LTI Models . . . . . . . . . . . . . . . . . . . . . . . . . . . . . . . . . . 2-8 Transfer Function Models . . . . . . . . . . . . . . . . . . . . . . . . . . . . . . 2-8 SISO Transfer Function Models . . . . . . . . . . . . . . . . . . . . . . . 2-8 MIMO Transfer Function Models . . . . . . . . . . . . . . . . . . . . . 2-10 Pure Gains . . . . . . . . . . . . . . . . . . . . . . . . . . . . . . . . . . . . . . . 2-11 Zero-Pole-Gain Models . . . . . . . . . . . . . . . . . . . . . . . . . . . . . . . . 2-12 SISO Zero-Pole-Gain Models . . . . . . . . . . . . . . . . . . . . . . . . . 2-12 MIMO Zero-Pole-Gain Models . . . . . . . . . . . . . . . . . . . . . . . 2-13 State-Space Models . . . . . . . . . . . . . . . . . . . . . . . . . . . . . . . . . . 2-14 Descriptor State-Space Models . . . . . . . . . . . . . . . . . . . . . . . . . 2-16 Frequency Response Data (FRD) Models . . . . . . . . . . . . . . . . . 2-17 Discrete-Time Models . . . . . . . . . . . . . . . . . . . . . . . . . . . . . . . . 2-20 Discrete-Time TF and ZPK Models . . . . . . . . . . . . . . . . . . . 2-21 Discrete Transfer Functions in DSP Format . . . . . . . . . . . . 2-22 Data Retrieval . . . . . . . . . . . . . . . . . . . . . . . . . . . . . . . . . . . . . . 2-24 ii Contents LTI Properties . . . . . . . . . . . . . . . . . . . . . . . . . . . . . . . . . . . . . . . Generic Properties . . . . . . . . . . . . . . . . . . . . . . . . . . . . . . . . . . . Model-Specific Properties . . . . . . . . . . . . . . . . . . . . . . . . . . . . . Setting LTI Properties . . . . . . . . . . . . . . . . . . . . . . . . . . . . . . . . Accessing Property Values Using get . . . . . . . . . . . . . . . . . . . . Direct Property Referencing . . . . . . . . . . . . . . . . . . . . . . . . . . . Additional Insight into LTI Properties . . . . . . . . . . . . . . . . . . . Sample Time . . . . . . . . . . . . . . . . . . . . . . . . . . . . . . . . . . . . . Input Names and Output Names . . . . . . . . . . . . . . . . . . . . . Input Groups and Output Groups . . . . . . . . . . . . . . . . . . . . 2-26 2-26 2-28 2-30 2-31 2-33 2-34 2-34 2-36 2-37 Model Conversion . . . . . . . . . . . . . . . . . . . . . . . . . . . . . . . . . . . . Explicit Conversion . . . . . . . . . . . . . . . . . . . . . . . . . . . . . . . . . . Automatic Conversion . . . . . . . . . . . . . . . . . . . . . . . . . . . . . . . . Caution About Model Conversions . . . . . . . . . . . . . . . . . . . . . . 2-42 2-42 2-43 2-43 Time Delays . . . . . . . . . . . . . . . . . . . . . . . . . . . . . . . . . . . . . . . . . Supported Functionality . . . . . . . . . . . . . . . . . . . . . . . . . . . . . . Specifying Input/Output Delays . . . . . . . . . . . . . . . . . . . . . . . . Distillation Column Example . . . . . . . . . . . . . . . . . . . . . . . . Specifying Delays on the Inputs or Outputs . . . . . . . . . . . . . . . InputDelay and OutputDelay Properties . . . . . . . . . . . . . . . Specifying Delays in Discrete-Time Models . . . . . . . . . . . . . . . Mapping Discrete-Time Delays to Poles at the Origin . . . . Retrieving Information About Delays . . . . . . . . . . . . . . . . . . . . Conversion of Models with Delays to State Space . . . . . . . . . . Padé Approximation of Time Delays . . . . . . . . . . . . . . . . . . . . . 2-45 2-45 2-46 2-47 2-50 2-51 2-52 2-53 2-54 2-54 2-55 Simulink Block for LTI Systems . . . . . . . . . . . . . . . . . . . . . . . 2-57 References . . . . . . . . . . . . . . . . . . . . . . . . . . . . . . . . . . . . . . . . . . 2-59 iii Operations on LTI Models 3 Introduction . . . . . . . . . . . . . . . . . . . . . . . . . . . . . . . . . . . . . . . . . . 3-2 Precedence and Property Inheritance . . . . . . . . . . . . . . . . . . 3-3 Extracting and Modifying Subsystems . . . . . . . . . . . . . . . . . . Referencing FRD Models Through Frequencies . . . . . . . . . . . . . Referencing Channels by Name . . . . . . . . . . . . . . . . . . . . . . . . . Resizing LTI Systems . . . . . . . . . . . . . . . . . . . . . . . . . . . . . . . . . 3-5 3-7 3-8 3-9 Arithmetic Operations . . . . . . . . . . . . . . . . . . . . . . . . . . . . . . . . Addition and Subtraction . . . . . . . . . . . . . . . . . . . . . . . . . . . . . Multiplication . . . . . . . . . . . . . . . . . . . . . . . . . . . . . . . . . . . . . . . Inversion and Related Operations . . . . . . . . . . . . . . . . . . . . . . Transposition . . . . . . . . . . . . . . . . . . . . . . . . . . . . . . . . . . . . . . . Pertransposition . . . . . . . . . . . . . . . . . . . . . . . . . . . . . . . . . . . . . Operations on State-Space Models with Delays . . . . . . . . . . . . 3-11 3-11 3-13 3-13 3-14 3-14 3-15 Model Interconnection Functions . . . . . . . . . . . . . . . . . . . . . 3-16 Concatenation of LTI Models . . . . . . . . . . . . . . . . . . . . . . . . . . 3-17 Feedback and Other Interconnection Functions . . . . . . . . . . . 3-18 Continuous/Discrete Conversions of LTI Models . . . . . . . . Zero-Order Hold . . . . . . . . . . . . . . . . . . . . . . . . . . . . . . . . . . . . . First-Order Hold . . . . . . . . . . . . . . . . . . . . . . . . . . . . . . . . . . . . Tustin Approximation . . . . . . . . . . . . . . . . . . . . . . . . . . . . . . . . Tustin with Frequency Prewarping . . . . . . . . . . . . . . . . . . . . . Matched Poles and Zeros . . . . . . . . . . . . . . . . . . . . . . . . . . . . . . Discretization of Systems with Delays . . . . . . . . . . . . . . . . . . . Delays and Continuous/Discrete Model Conversions . . . . . . . iv Contents 3-20 3-20 3-22 3-22 3-23 3-23 3-24 3-25 Resampling of Discrete-Time Models . . . . . . . . . . . . . . . . . . . 3-27 References . . . . . . . . . . . . . . . . . . . . . . . . . . . . . . . . . . . . . . . . . . 3-28 Arrays of LTI Models 4 Introduction . . . . . . . . . . . . . . . . . . . . . . . . . . . . . . . . . . . . . . . . . . When to Collect a Set of Models in an LTI Array . . . . . . . . . . . Restrictions for LTI Models Collected in an Array . . . . . . . . . . Where to Find Information on LTI Arrays . . . . . . . . . . . . . . . . . 4-2 4-2 4-2 4-3 The Concept of an LTI Array . . . . . . . . . . . . . . . . . . . . . . . . . . . 4-4 Higher Dimensional Arrays of LTI Models . . . . . . . . . . . . . . . . 4-6 Dimensions, Size, and Shape of an LTI Array . . . . . . . . . . . . 4-7 size and ndims . . . . . . . . . . . . . . . . . . . . . . . . . . . . . . . . . . . . . . . 4-9 reshape . . . . . . . . . . . . . . . . . . . . . . . . . . . . . . . . . . . . . . . . . . . . 4-11 Building LTI Arrays . . . . . . . . . . . . . . . . . . . . . . . . . . . . . . . . . . Generating LTI Arrays Using rss . . . . . . . . . . . . . . . . . . . . . . . Building LTI Arrays Using for Loops . . . . . . . . . . . . . . . . . . . . Building LTI Arrays Using the stack Function . . . . . . . . . . . . Building LTI Arrays Using tf, zpk, ss, and frd . . . . . . . . . . . . . Specifying Arrays of TF models tf . . . . . . . . . . . . . . . . . . . . . The Size of LTI Array Data for SS Models . . . . . . . . . . . . . . 4-12 4-12 4-12 4-15 4-17 4-17 4-18 Indexing Into LTI Arrays . . . . . . . . . . . . . . . . . . . . . . . . . . . . . Accessing Particular Models in an LTI Array . . . . . . . . . . . . . Single Index Referencing of Array Dimensions . . . . . . . . . . Extracting LTI Arrays of Subsystems . . . . . . . . . . . . . . . . . . . Reassigning Parts of an LTI Array . . . . . . . . . . . . . . . . . . . . . . LTI Arrays of SS Models with Differing Numbers of States Deleting Parts of an LTI Array . . . . . . . . . . . . . . . . . . . . . . . . . 4-20 4-20 4-21 4-21 4-22 4-23 4-23 Operations on LTI Arrays . . . . . . . . . . . . . . . . . . . . . . . . . . . . . 4-25 Example: Addition of Two LTI Arrays . . . . . . . . . . . . . . . . . . . 4-26 v Dimension Requirements . . . . . . . . . . . . . . . . . . . . . . . . . . . . . Special Cases for Operations on LTI Arrays . . . . . . . . . . . . . . Examples of Operations on LTI Arrays with Single LTI Models . . . . . . . . . . . . . . . . . . . . . . . . . . . . . . . . Examples: Arithmetic Operations on LTI Arrays and SISO Models . . . . . . . . . . . . . . . . . . . . . . . . . . . . . . . . Other Operations on LTI Arrays . . . . . . . . . . . . . . . . . . . . . . . . 4-27 4-27 4-28 4-29 4-30 Model Analysis Tools 5 General Model Characteristics . . . . . . . . . . . . . . . . . . . . . . . . . 5-2 Model Dynamics . . . . . . . . . . . . . . . . . . . . . . . . . . . . . . . . . . . . . . 5-4 State-Space Realizations . . . . . . . . . . . . . . . . . . . . . . . . . . . . . . . 5-7 Time and Frequency Response . . . . . . . . . . . . . . . . . . . . . . . . . 5-9 Time Responses . . . . . . . . . . . . . . . . . . . . . . . . . . . . . . . . . . . . . . 5-9 Frequency Response . . . . . . . . . . . . . . . . . . . . . . . . . . . . . . . . . 5-11 Plotting and Comparing Multiple Systems . . . . . . . . . . . . . . . 5-13 Customizing the Plot Display . . . . . . . . . . . . . . . . . . . . . . . . . . 5-17 Model Order Reduction . . . . . . . . . . . . . . . . . . . . . . . . . . . . . . . 5-20 The LTI Viewer 6 Introduction . . . . . . . . . . . . . . . . . . . . . . . . . . . . . . . . . . . . . . . . . . 6-2 Functionality of the LTI Viewer . . . . . . . . . . . . . . . . . . . . . . . . . 6-2 Getting Started Using the LTI Viewer: An Example . . . . . . 6-4 Initializing the LTI Viewer with Multiple Plots . . . . . . . . . . . . 6-5 Right-Click Menus: Setting Response Characteristics . . . . . . . 6-7 vi Contents Displaying Response Characteristics on a Plot . . . . . . . . . . . . . 6-9 Importing Models . . . . . . . . . . . . . . . . . . . . . . . . . . . . . . . . . . . . 6-11 Zooming . . . . . . . . . . . . . . . . . . . . . . . . . . . . . . . . . . . . . . . . . . . 6-12 The LTI Viewer Menus . . . . . . . . . . . . . . . . . . . . . . . . . . . . . . . The File Menu . . . . . . . . . . . . . . . . . . . . . . . . . . . . . . . . . . . . . . Importing a New Model into the LTI Viewer Workspace . . Opening a New LTI Viewer . . . . . . . . . . . . . . . . . . . . . . . . . . Refreshing Systems in the LTI Viewer Workspace . . . . . . . Printing Response Plots . . . . . . . . . . . . . . . . . . . . . . . . . . . . Getting Help . . . . . . . . . . . . . . . . . . . . . . . . . . . . . . . . . . . . . . . . Static Help . . . . . . . . . . . . . . . . . . . . . . . . . . . . . . . . . . . . . . . Interactive Help . . . . . . . . . . . . . . . . . . . . . . . . . . . . . . . . . . . 6-15 6-15 6-15 6-16 6-16 6-16 6-16 6-16 6-17 The Right-Click Menus . . . . . . . . . . . . . . . . . . . . . . . . . . . . . . . The Right-Click Menu for SISO Models . . . . . . . . . . . . . . . . . . Selecting a Menu Item . . . . . . . . . . . . . . . . . . . . . . . . . . . . . . . . The Right-Click Menu for MIMO Models . . . . . . . . . . . . . . . . . The Axes Grouping Submenu . . . . . . . . . . . . . . . . . . . . . . . . The Select I/Os Menu Item . . . . . . . . . . . . . . . . . . . . . . . . . . The Right-Click Menu for LTI Arrays . . . . . . . . . . . . . . . . . . . The Model Selector for LTI Arrays . . . . . . . . . . . . . . . . . . . . . . Indexing into the Array Dimensions of an LTI Array . . . . . Indexing into the LTI Array Using Design Specification Criteria . . . . . . . . . . . . . . . . . . . . . . . . . . . . . 6-18 6-18 6-20 6-21 6-23 6-26 6-28 6-31 6-32 The LTI Viewer Tools Menu . . . . . . . . . . . . . . . . . . . . . . . . . . . Viewer Configuration Window . . . . . . . . . . . . . . . . . . . . . . . . . Response Preferences . . . . . . . . . . . . . . . . . . . . . . . . . . . . . . . . . Setting Response Time Durations and Frequency Ranges . Customizing Step Response Specifications . . . . . . . . . . . . . Changing the Frequency Domain Plot Units . . . . . . . . . . . . Linestyle Preferences . . . . . . . . . . . . . . . . . . . . . . . . . . . . . . . . . Changing the Response Curve Linestyle Properties . . . . . . The Order in which Line Properties are Assigned . . . . . . . . 6-39 6-39 6-40 6-41 6-43 6-44 6-44 6-46 6-47 Simulink LTI Viewer . . . . . . . . . . . . . . . . . . . . . . . . . . . . . . . . . Using the Simulink LTI Viewer . . . . . . . . . . . . . . . . . . . . . . . . A Sample Analysis Task . . . . . . . . . . . . . . . . . . . . . . . . . . . . Opening the Simulink LTI Viewer . . . . . . . . . . . . . . . . . . . . . . 6-48 6-48 6-49 6-50 6-35 vii Specifying the Simulink Model Portion for Analysis . . . . . . . . Adding Input Point or Output Point Blocks to the Diagram Removing Input Points and Output Points . . . . . . . . . . . . . Specifying Open- Versus Closed-Loop Analysis Models . . . Setting the Operating Conditions . . . . . . . . . . . . . . . . . . . . . . . Modifying the Block Parameters . . . . . . . . . . . . . . . . . . . . . . . . Performing Linear Analysis . . . . . . . . . . . . . . . . . . . . . . . . . . . Importing a Linearized Analysis Model to the LTI Viewer . Analyzing the Bode Plot of the Linearized Analysis Model Specifying Another Analysis Model . . . . . . . . . . . . . . . . . . . Comparing the Bode Plots of the Two Linearized Analysis Models . . . . . . . . . . . . . . . . . . . . . . . . Saving Analysis Models . . . . . . . . . . . . . . . . . . . . . . . . . . . . . . . 6-53 6-53 6-56 6-56 6-57 6-61 6-61 6-62 6-63 6-63 6-63 6-65 Control Design Tools 7 Root Locus Design . . . . . . . . . . . . . . . . . . . . . . . . . . . . . . . . . . . . 7-3 Pole Placement . . . . . . . . . . . . . . . . . . . . . . . . . . . . . . . . . . . . . . . State-Feedback Gain Selection . . . . . . . . . . . . . . . . . . . . . . . . . . State Estimator Design . . . . . . . . . . . . . . . . . . . . . . . . . . . . . . . . Pole Placement Tools . . . . . . . . . . . . . . . . . . . . . . . . . . . . . . . . . . 7-5 7-5 7-5 7-6 LQG Design . . . . . . . . . . . . . . . . . . . . . . . . . . . . . . . . . . . . . . . . . . 7-8 Optimal State-Feedback Gain . . . . . . . . . . . . . . . . . . . . . . . . . . . 7-9 Kalman State Estimator . . . . . . . . . . . . . . . . . . . . . . . . . . . . . . . 7-9 LQG Regulator . . . . . . . . . . . . . . . . . . . . . . . . . . . . . . . . . . . . . . 7-10 LQG Design Tools . . . . . . . . . . . . . . . . . . . . . . . . . . . . . . . . . . . 7-10 viii Contents The Root Locus Design GUI 8 Introduction . . . . . . . . . . . . . . . . . . . . . . . . . . . . . . . . . . . . . . . . . . 8-2 A Servomechanism Example . . . . . . . . . . . . . . . . . . . . . . . . . . . 8-4 Controller Design Using the Root Locus Design GUI . . . . . 8-6 Opening the Root Locus Design GUI . . . . . . . . . . . . . . . . . . . . . 8-6 Importing Models into the Root Locus Design GUI . . . . . . . . . . 8-7 Opening the Import LTI Design Model Window . . . . . . . . . . 8-9 Choosing a Feedback Structure . . . . . . . . . . . . . . . . . . . . . . 8-10 Specifying the Design Model . . . . . . . . . . . . . . . . . . . . . . . . . 8-11 Changing the Gain Set Point and Zooming . . . . . . . . . . . . . . . 8-13 Dragging Closed-loop Poles to Change the Gain Set Point . 8-14 Zooming . . . . . . . . . . . . . . . . . . . . . . . . . . . . . . . . . . . . . . . . . 8-15 Storing and Retrieving Axes Limits . . . . . . . . . . . . . . . . . . . 8-19 Displaying System Responses . . . . . . . . . . . . . . . . . . . . . . . . . . 8-20 Designing a Compensator to Meet Specifications . . . . . . . . . . 8-22 Specifying Design Region Boundaries on the Root Locus . . 8-24 Placing Compensator Poles and Zeros: General Information . . . . . . . . . . . . . . . . . . . . . . . . . . . . . . 8-26 Placing Compensator Poles and Zeros Using the Root Locus Toolbar . . . . . . . . . . . . . . . . . . . . . . 8-27 Editing Compensator Pole and Zero Locations . . . . . . . . . . 8-31 Saving the Compensator and Models . . . . . . . . . . . . . . . . . . . . 8-36 Additional Root Locus Design GUI Features . . . . . . . . . . . . Specifying Design Models: General Concepts . . . . . . . . . . . . . . Creating Models Manually Within the GUI . . . . . . . . . . . . . Designating the Model Source . . . . . . . . . . . . . . . . . . . . . . . Getting Help with the Root Locus Design GUI . . . . . . . . . . . . Using the Help Menu . . . . . . . . . . . . . . . . . . . . . . . . . . . . . . Using the Status Bar for Help . . . . . . . . . . . . . . . . . . . . . . . Tooltips . . . . . . . . . . . . . . . . . . . . . . . . . . . . . . . . . . . . . . . . . . Erasing Compensator Poles and Zeros . . . . . . . . . . . . . . . . . . . Listing Poles and Zeros . . . . . . . . . . . . . . . . . . . . . . . . . . . . . . . Printing the Root Locus . . . . . . . . . . . . . . . . . . . . . . . . . . . . . . . Drawing a Simulink Diagram . . . . . . . . . . . . . . . . . . . . . . . . . . Converting Between Continuous and Discrete Models . . . . . . 8-38 8-38 8-38 8-39 8-39 8-40 8-40 8-40 8-41 8-41 8-44 8-44 8-45 ix Clearing Data . . . . . . . . . . . . . . . . . . . . . . . . . . . . . . . . . . . . . . . 8-46 References . . . . . . . . . . . . . . . . . . . . . . . . . . . . . . . . . . . . . . . . . . 8-48 Design Case Studies 9 Yaw Damper for a 747 Jet Transport . . . . . . . . . . . . . . . . . . . . 9-3 Open-Loop Analysis . . . . . . . . . . . . . . . . . . . . . . . . . . . . . . . . . . . 9-6 Root Locus Design . . . . . . . . . . . . . . . . . . . . . . . . . . . . . . . . . . . . 9-9 Washout Filter Design . . . . . . . . . . . . . . . . . . . . . . . . . . . . . . . . 9-14 Hard-Disk Read/Write Head Controller . . . . . . . . . . . . . . . . 9-20 x Contents LQG Regulation . . . . . . . . . . . . . . . . . . . . . . . . . . . . . . . . . . . . . . Process and Disturbance Models . . . . . . . . . . . . . . . . . . . . . . . . Model Data for the x-Axis . . . . . . . . . . . . . . . . . . . . . . . . . . . Model Data for the y-Axis . . . . . . . . . . . . . . . . . . . . . . . . . . . LQG Design for the x-Axis . . . . . . . . . . . . . . . . . . . . . . . . . . . . . LQG Design for the y-Axis . . . . . . . . . . . . . . . . . . . . . . . . . . . . . Cross-Coupling Between Axes . . . . . . . . . . . . . . . . . . . . . . . . . . MIMO LQG Design . . . . . . . . . . . . . . . . . . . . . . . . . . . . . . . . . . 9-31 9-31 9-34 9-34 9-34 9-42 9-43 9-47 Kalman Filtering . . . . . . . . . . . . . . . . . . . . . . . . . . . . . . . . . . . . . Discrete Kalman Filter . . . . . . . . . . . . . . . . . . . . . . . . . . . . . . . Steady-State Design . . . . . . . . . . . . . . . . . . . . . . . . . . . . . . . . . . Time-Varying Kalman Filter . . . . . . . . . . . . . . . . . . . . . . . . . . . Time-Varying Design . . . . . . . . . . . . . . . . . . . . . . . . . . . . . . . . . References . . . . . . . . . . . . . . . . . . . . . . . . . . . . . . . . . . . . . . . . . . 9-50 9-50 9-51 9-57 9-58 9-63 Reliable Computations 10 Conditioning and Numerical Stability . . . . . . . . . . . . . . . . . 10-4 Conditioning . . . . . . . . . . . . . . . . . . . . . . . . . . . . . . . . . . . . . . . . 10-4 Numerical Stability . . . . . . . . . . . . . . . . . . . . . . . . . . . . . . . . . . 10-6 Choice of LTI Model . . . . . . . . . . . . . . . . . . . . . . . . . . . . . . . . . . 10-8 State Space . . . . . . . . . . . . . . . . . . . . . . . . . . . . . . . . . . . . . . . . . 10-8 Transfer Function . . . . . . . . . . . . . . . . . . . . . . . . . . . . . . . . . . . 10-8 Zero-Pole-Gain Models . . . . . . . . . . . . . . . . . . . . . . . . . . . . . . . 10-14 Scaling . . . . . . . . . . . . . . . . . . . . . . . . . . . . . . . . . . . . . . . . . . . . . 10-15 Summary . . . . . . . . . . . . . . . . . . . . . . . . . . . . . . . . . . . . . . . . . . . 10-17 References . . . . . . . . . . . . . . . . . . . . . . . . . . . . . . . . . . . . . . . . . 10-18 Reference 11 Category Tables . . . . . . . . . . . . . . . . . . . . . . . . . . . . . . . . . . . . . . 11-3 Modal Form . . . . . . . . . . . . . . . . . . . . . . . . . . . . . . . . . . . . . 11-27 Companion Form . . . . . . . . . . . . . . . . . . . . . . . . . . . . . . . . . 11-27 Example 1 . . . . . . . . . . . . . . . . . . . . . . . . . . . . . . . . . . . . . . . 11-30 Example 2 . . . . . . . . . . . . . . . . . . . . . . . . . . . . . . . . . . . . . . . 11-31 Continuous Time . . . . . . . . . . . . . . . . . . . . . . . . . . . . . . . . . 11-57 Discrete Time . . . . . . . . . . . . . . . . . . . . . . . . . . . . . . . . . . . . 11-57 H2 Norm . . . . . . . . . . . . . . . . . . . . . . . . . . . . . . . . . . . . . . . 11-152 Infinity Norm . . . . . . . . . . . . . . . . . . . . . . . . . . . . . . . . . . . 11-152 Creation of State-Space Models . . . . . . . . . . . . . . . . . . . . 11-211 Conversion to State Space . . . . . . . . . . . . . . . . . . . . . . . . . 11-212 Example 1 . . . . . . . . . . . . . . . . . . . . . . . . . . . . . . . . . . . . . . 11-213 Example 2 . . . . . . . . . . . . . . . . . . . . . . . . . . . . . . . . . . . . . . 11-213 Creation of Transfer Functions . . . . . . . . . . . . . . . . . . . . . 11-224 Transfer Functions as Rational Expressions in s or z . . . 11-225 xi Conversion to Transfer Function . . . . . . . . . . . . . . . . . . . Example 1 . . . . . . . . . . . . . . . . . . . . . . . . . . . . . . . . . . . . . . Example 2 . . . . . . . . . . . . . . . . . . . . . . . . . . . . . . . . . . . . . . Example 3 . . . . . . . . . . . . . . . . . . . . . . . . . . . . . . . . . . . . . . Example 4 . . . . . . . . . . . . . . . . . . . . . . . . . . . . . . . . . . . . . . Creation of Zero-Pole-Gain Models . . . . . . . . . . . . . . . . . . Zero-Pole-Gain Models as Rational Expressions in s or z Conversion to Zero-Pole-Gain Form . . . . . . . . . . . . . . . . . Example 1 . . . . . . . . . . . . . . . . . . . . . . . . . . . . . . . . . . . . . . Example 2 . . . . . . . . . . . . . . . . . . . . . . . . . . . . . . . . . . . . . . Example 3 . . . . . . . . . . . . . . . . . . . . . . . . . . . . . . . . . . . . . . xii Contents 11-226 11-226 11-227 11-227 11-228 11-238 11-240 11-240 11-241 11-241 11-242 Preface Installation . . . . . . . . . . . . . . . . . . . . . 3 Getting Started . . . . . . . . . . . . . . . . . . . 4 Typographic Conventions . . . . . . . . . . . . . . . 5 Preface MATLAB® has a rich collection of functions immediately useful to the control engineer or system theorist. Complex arithmetic, eigenvalues, root-finding, matrix inversion, and FFTs are just a few examples of MATLAB’s important numerical tools. More generally, MATLAB’s linear algebra, matrix computation, and numerical analysis capabilities provide a reliable foundation for control system engineering as well as many other disciplines. The Control System Toolbox uses MATLAB matrix structures and builds upon the foundations of MATLAB to provide functions specialized to control engineering. The Control System Toolbox is a collection of algorithms, expressed mostly in M-files, which implements common control system design, analysis, and modeling techniques. Control systems can be modeled as transfer functions or in zero-pole-gain or state-space form, allowing you to use both classical and modern techniques. You can manipulate both continuous-time and discrete-time systems. Conversions between various model representations are provided. Time responses, frequency responses, and root loci can be computed and graphed. Other functions allow pole placement, optimal control, and estimation. Finally, and most importantly, tools that are not found in the toolbox can be created by writing new M-files. 2 Installation Installation Instructions for installing the Control System Toolbox can be found in the MATLAB Installation Guide for your platform. We recommend that you store the files from this toolbox in a directory named control off the main matlab directory. To determine if the Control System Toolbox is already installed on your system, check for a subdirectory named control within the main toolbox directory or folder. Five demonstration files are available. The demonstration M-file called ctrldemo.m runs through some basic control design and analysis functions and the demonstration files jetdemo.m, diskdemo.m, milldemo.m, and kalmdemo.m go through the design case studies described in Chapter 9. To start a demo, type ctrldemo, for example, at the MATLAB prompt. 3 Preface Getting Started If you are a new user, begin with Chapters 2 through 5 to learn: • How to specify and manipulate linear time-invariant models • How to analyze such models and plot their time and frequency response If you are an experienced toolbox user, see: • The New Features Guide for details on the latest release • Chapter 1 for an overview of some product features • Chapter 4 to learn about LTI arrays • Chapter 6 for an introduction to the LTI Viewer GUI • Chapter 8 for an introduction to the Root Locus Design GUI All toolbox users should use Chapter 11 for reference information on functions and tools. For functions, reference descriptions include a synopsis of the function’s syntax, as well as a complete explanation of options and operation. Many reference descriptions also include helpful examples, a description of the function’s algorithm, and references to additional reading material. For GUI-based tools, the descriptions include options for invoking the tool. 4 Typographic Conventions Typographic Conventions To Indicate This Guide Uses Example Example code Monospace type To assign the value 5 to A, enter A = 5 Function names Monospace type The cos function finds the cosine of each array element. Function syntax Monospace type for text that must appear as shown. The magic function uses the syntax M = magic(n) Monospace italics for components you can replace with any variable. Keys Boldface Press the Return key. Mathematical expressions Variables in italics. This vector represents the polynomial MATLAB output Functions, operators, and constants in standard type. Monospace type p = x2 + 2x + 3 MATLAB responds with A = 5 Menu names, menu items, and controls Boldface Choose the File menu. New terms italics An array is an ordered collection of information. 5 Preface 6 1 Quick Start LTI Models . . . MIMO Systems . Model Conversion LTI Arrays . . . . . . . . . . . . . . . . . . . . . . . . . . . . . . . . . . . . . . . . . . . . . . . . . . . . . . . . . . . . . . . . . . . . . . . . . . . 1-3 1-4 1-5 1-6 LTI Properties . . . . . . . . . . . . . . . . . . . 1-7 Model Characteristics . . . . . . . . . . . . . . . 1-10 Operations on LTI Models . . . . . . . . . . . . . . 1-11 Continuous/Discrete Conversions . . . . . . . . . . 1-13 Time and Frequency Response The LTI Viewer . . . . . . . . . . . 1-14 . . . . . . . . . . . . . . . . . . 1-17 System Interconnections . . . . . . . . . . . . . . 1-19 Control Design Tools . . . . . . . . . . . . . . . . 1-20 The Root Locus Design GUI . . . . . . . . . . . . . 1-23 1 Quick Start This chapter provides a quick overview of some features of the Control Systems Toolbox. 1-2 LTI Models LTI Models You can specify linear time-invariant (LTI) systems as transfer function (TF) models, zero/pole/gain (ZPK) models, state-space (SS) models, or frequency response data (FRD) model. You can construct the corresponding models using the constructor functions. sys sys sys sys = = = = tf(num,den) zpk(z,p,k) ss(a,b,c,d) frd(response,frequencies) % % % % transfer function zero/pole/gain state space frequency response data To find out information about LTI models, type ltimodels See also “Creating LTI Models” on page 2-8. The output sys is a model-specific data structure called a TF, ZPK, SS, or FRD object, respectively. These objects store the model data and enable you to manipulate the LTI model as a single entity; see “LTI Objects” on page 2-3 for more information. For example, type h = tf(1,[1 1]) % creates transfer function 1/(s+1) and MATLAB responds with Transfer function: 1 ----s + 1 Type 1+h MATLAB responds with Transfer function: s + 2 ----s + 1 1-3 1 Quick Start To create discrete-time models, append the sample time Ts to the previous calling sequences. sys sys sys sys = = = = tf(num,den,Ts) zpk(z,p,k,Ts) ss(a,b,c,d,Ts) frd(response,frequency,Ts) For more information, see “Discrete-Time Models” on page 2-20. For example, type sys = zpk(0.5,[–0.1 0.3],1,0.05) and MATLAB responds with Zero/pole/gain: (z–0.5) --------------(z+0.1) (z–0.3) Sampling time: 0.05 You can retrieve the model data stored in the LTI object sys with the following commands (see “Data Retrieval” on page 2-24 for more information). [num,den,Ts] = tfdata(sys) [z,p,k,Ts] = zpkdata(sys) [a,b,c,d,Ts] = ssdata(sys) [response,frequency,Ts] = frdata(sys) Alternately, you can access this data by direct structure-like referencing (see “Direct Property Referencing” on page 2-33 for more information), as in this example. sys.num sys.a sys.Ts MIMO Systems You can also create multi-input/multi-output (MIMO) models, including arbitrary MIMO transfer functions and zero/pole/gain models. MIMO transfer functions are arrays of single-input/single-output (SISO) transfer functions 1-4 LTI Models where each SISO entry is characterized by its numerator and denominator. Cell arrays provide an ideal means to specify the resulting arrays of numerators and denominators; see, “MIMO Transfer Function Models” on page 2-10 for more information. For example, num = {0.5,[1 1]} den = {[1 0],[1 2]} H = tf(num,den) % 1-by-2 cell array of numerators % 1-by-2 cell array of denominators creates the one-output/two-input transfer function H ( s ) = 0.5 -------s s+1 -----------s+2 Alternatively, you can create the same transfer function by matrix-like concatenation of its SISO entries h11 = tf(0.5,[1 0]) h12 = tf([1 1],[1 2]) H = [h11,h12] % 0.5/s % (s+1)/(s+2) MIMO zero/pole/gain systems are defined in a similar fashion. For example, the following commands specify H ( s ) above as a zero/pole/gain model Zeros = {[],–1} % Note: use [] when no zero Poles = {0 ,–2} Gains = [0.5,1] % Note: use regular matrix for gains H = zpk(Zeros,Poles,Gains) Model Conversion The functions tf, zpk, frd, and ss also perform model conversion; see “Model Conversion” on page 2-42 for more information. For example, sys_ss = ss(sys) converts some tf or zpk model sys to state space. Similarly, if you type h = tf(1,[1 2 1]) zpk(h) % transfer function 1/(s^2+2s+1) 1-5 1 Quick Start MATLAB derives the zero/pole/gain representation of the transfer function h Zero/pole/gain: 1 ------(s+1)^2 LTI Arrays You can now create multidimensional arrays of LTI models and manipulate them as a single entity. LTI arrays are useful to perform batch analysis on an entire set of models. For more information, see Chapter 4, “Arrays of LTI Models.” 1-6 LTI Properties LTI Properties In addition to the model data, the TF, ZPK, FRD, and SS objects can store extra information, such as the system sample time, time delays, and input or output names. The various pieces of information that can be attached to an LTI object are called the LTI properties. For information on LTI properties, type ltiprops See also “LTI Properties” on page 2-26 and “Time Delays” on page 2-45. Use set to list all LTI properties and their assignable values, and get to display the current properties of the system. For example, type sys = ss(–1,1,1,0,0.5) ;% 1/(z+1), sample time = 0.5 sec set(sys) a: Nx-by-Nx matrix (Nx = no. of states) b: Nx-by-Nu matrix (Nu = no. of inputs) c: Ny-by-Nx matrix (Ny = no. of outputs) d: Ny-by-Nu matrix e: Nx-by-Nx matrix (or empty) StateName: Nx-by-1 cell array of strings Ts: scalar InputDelay: Nu-by-1 vector OutputDelay: Ny-by-1 vector ioDelayMatrix: Ny-by-Nu array (I/O delays) InputName: Nu-by-1 cell array of strings OutputName: Ny-by-1 cell array of strings InputGroup: M-by-2 cell array if M input groups OutputGroup: P-by-2 cell array if P output groups Notes: array or cell array of strings UserData: arbitrary 1-7 1 Quick Start Type: get(sys) a: -1 b: 1 c: 1 d: 0 e: [] StateName: {''} Ts: 0.5 InputDelay: 0 OutputDelay: 0 ioDelayMatrix: 0 InputName: {''} OutputName: {''} InputGroup: {0x2 cell} OutputGroup: {0x2 cell} Notes: {} UserData: [] You can also use set and get to access/modify LTI properties in a Handle Graphics® fashion; see “Setting LTI Properties” on page 2-30 for more information. For example, give names to the input and output of the SISO state-space model sys. Type set(sys,'inputname','thrust','outputname','velocity') get(sys,'inputn') MATLAB responds with ans = 'thrust' Finally, you can also use a structure-like syntax for accessing or modifying a single property. For example, type sys.Ts = 0.3; % Set sample time to 0.3 sec. sys.Ts% Get sample time value 1-8 LTI Properties MATLAB returns ans = 3.0000e–01 1-9 1 Quick Start Model Characteristics The Control System Toolbox contains commands to query such model characteristics as the I/O dimensions, poles, zeros, and DC gain. See “General Model Characteristics” on page 5-2 for more information. These commands apply to both continuous- and discrete-time model. Their LTI-based syntax is summarized below (with sys denoting an arbitrary LTI model). size(sys) % ndims(sys) % isct(sys) % isdt(sys) % hasdelay(sys) % pole(sys) % zero(sys) % dcgain(sys) % norm(sys) % covar(sys,W) % pade(sys) % 1-10 number of inputs, outputs, and array dimensions number of dimensions returns 1 for continuous systems returns 1 for discrete systems true if system has delays system poles system (transmission) zeros DC gain system norms (H2 and Linfinity) covariance of response to white noise Pade approximation of input delays Operations on LTI Models Operations on LTI Models You can perform simple matrix operations, such as addition, multiplication, or concatenation on LTI models. See Chapter 3, “Operations on LTI Models” for more information. Thanks to MATLAB object-oriented programming capabilities, these operations assume appropriate functionalities when applied to LTI models. For example, addition performs a parallel interconnection. Type tf(1,[1 0]) + tf([1 1],[1 2])% 1/s + (s+1)/(s+2) and MATLAB responds: Transfer function s^2 + 2 s + 2 ------------s^2 + 2 s Multiplication performs a series interconnection. Type 2 * tf(1,[1 0])*tf([1 1],[1 2])% 2*1/s*(s+1)/(s+2) and MATLAB responds Transfer function: 2 s + 2 --------s^2 + 2 s If the operands are models of different types, the resulting model type is determined by precedence rules; see “Precedence Rules” on page 2-5 for more information. State-space models have highest precedence while transfer functions have lowest precedence. Hence the sum of a transfer function and a state-space model is always a state-space model. Other available operations include system inversion, transposition, and pertransposition; see “Inversion and Related Operations” on page 3-13. Matrix-like indexing for extracting subsystems is also supported; see “Extracting and Modifying Subsystems” on page 3-5 for more information. For instance, if sys is a MIMO system with two inputs and three outputs, sys(3,1) 1-11 1 Quick Start extracts the subsystem mapping the first input to the third output. Note that row indices select the outputs while column indices select the inputs. Similarly, sys(3,1) = tf(1,[1 0]) redefines the relation between the first input and third output as an integrator. 1-12 Continuous/Discrete Conversions Continuous/Discrete Conversions The commands c2d, d2c, and d2d perform continuous to discrete, discrete to continuous, and discrete to discrete (resampling) conversions, respectively. sysd = c2d(sysc,Ts) % discretization w/ sample period Ts sysc = d2c(sysd) % equivalent continuous-time model sysd1= d2d(sysd,Ts) % resampling at the period Ts See “Continuous/Discrete Conversions of LTI Models” on page 3-20 for more information. Various discretization/interpolation methods are available, including zero-order hold (default), first-order hold, Tustin approximation with or without prewarping, and matched zero-pole. For example, sysd = c2d(sysc,Ts,'foh')% uses first-order hold sysc = d2c(sysd,'tustin')% uses Tustin approx. 1-13 1 Quick Start Time and Frequency Response The following commands produce various time and frequency response plots for LTI models (see “Time and Frequency Response” on page 5-9 for more information). step(sys) impulse(sys) initial(sys,x0) lsim(sys,u,t,x0) % % % % step response impulse response undriven response to initial condition response to input u bode(sys) nyquist(sys) nichols(sys) sigma(sys) freqresp(sys,w) % % % % % Bode plot Nyquist plot Nichols plot singular value plot complex frequency response These commands work for both continuous- and discrete-time LTI models sys without restriction on the number of inputs or outputs. For MIMO systems, they produce an array of plots with one plot per I/O channel. For example, sys = [tf(1,[1 1]) 1 ; tf([1 5],[1 1 10]) tf(–1,[1 0])]; bode(sys) 1-14 Time and Frequency Response produces the Bode plot shown below. To superimpose and compare the responses of several LTI systems, use the syntax bode(sys1,sys2,sys3,...) You can also control the plot style by specifying a color/linestyle/marker for each system, much as with the plot command; see “Plotting and Comparing Multiple Systems” on page 5-13 for more information. For example, bode(sys1,'r',sys2,'b--') draws the response of sys1 with a red solid line and the response of sys2 with a dashed blue line. 1-15 1 Quick Start These commands automatically determine an appropriate simulation horizon or frequency range based on the system dynamics. To override the default range, type step(sys,tfinal) bode(sys,{wmin,wmax}) 1-16 % final time = tfinal % freq. range = [wmin,wmax] The LTI Viewer The LTI Viewer You can also analyze time and frequency domain responses using the LTI Viewer; see “The LTI Viewer” on page 6-1 for more information. The LTI Viewer is an interactive user interface that assists you with the analysis of LTI model responses by facilitating such functions as: • Toggling between types of response plots • Plotting responses of several LTI models • Zooming into regions of the response plots • Calculating response characteristics, such as settling time • Displaying different I/O channels • Changing the plot styles of the response plots To initialize an LTI Viewer, type ltiview ltiview can also be called with additional input arguments that allow you to specify the type of LTI model response displayed when the window is first opened. The generic syntax is ltiview(plottype,sys1,...,sysn) where sys1,...,sysn are names of LTI models in the MATLAB workspace and plottype is either a string for one of the following plot types, or a cell array, containing up to six of the following strings 'step' 'impulse' 'initial' 'lsim' 'pzmap' 'bode' 'nyquist' 'nichols' 'sigma' For example, you can initialize an LTI Viewer showing the step response of the LTI model sys by ltiview('step',sys) 1-17 1 Quick Start For more detail on the use of the LTI Viewer and how it can be integrated into a Simulink diagram, see Chapter 6, “The LTI Viewer.” 1-18 System Interconnections System Interconnections You can derive LTI models for various system interconnections ranging from simple series connections to more complex block diagrams; see “Model Interconnection Functions” on page 3-16 for more information. Related commands include append(sys1,sys2,...) parallel(sys1,sys2) series(sys1,sys2) feedback(sys1,sys2) lft(sys1,sys2) connect(sys,q) % % % % % % appends systems inputs and outputs general parallel connection general series connection feedback loop LFT interconnection (star product) state-space model of block diagram Note that simple parallel and series interconnections can be performed by direct addition and multiplication, respectively. When combining LTI models of different types (for example, state-space sys1 and transfer function sys2), the type of the resultant model is determined by the same precedence rules as for arithmetic operations. See “Precedence Rules” on page 2-5 for more information. Specifically, the ranking of the different types of LTI models from highest to lowest precedence is FRD, SS, ZPK, and TF. 1-19 1 Quick Start Control Design Tools The Control System Toolbox supports three mainstream control design methodologies: gain selection from root locus, pole placement, and linear-quadratic-Gaussian (LQG) regulation. The first two techniques are covered by the rlocus and place commands. The LQG design tools include commands to compute the LQ-optimal state-feedback gain (lqr, dlqr, and lqry), to design the Kalman filter (kalman), and to form the resulting LQG regulator (lqgreg). See “LQG Design” on page 7-8 for more information. As an example of LQG design, consider the regulation problem illustrated by Figure 1-1. The goal is to regulate the plant output y around zero. The system is driven by the white noise disturbance d , there is some measurement noise n , and the noise intensities are given by E ( d 2 ) = 1, E ( n 2 ) = 0.01 The cost function J( u ) = ∞ ∫0 ( 10y2 + u 2 ) dt is used to specify the trade-off between regulation performance and cost of control. Note that an open-loop state-space model is · x = Ax + Bu + Bd (state equations) (measurements) y n = Cx + n where ( A, B, C ) is a state-space realization of 100 ⁄ ( s 2 + s + 100 ) . 1-20 Control Design Tools Plant + u+d d + 100 -----------------------------s 2 + s + 100 y u + F(s) yn + n LQG regulator Figure 1-1: Simple Regulation Loop The following commands design the optimal LQG regulator F ( s ) for this problem. sys = ss(tf(100,[1 1 100]))% state-space plant model % Design LQ-optimal gain K K = lqry(sys,10,1) % u = –Kx minimizes J(u) % Separate control input u and disturbance input d P = sys(:,[^ ^]); % input [u;d], output y % Design Kalman state estimator KEST Kest = kalman(P,1,0.01) % Form LQG regulator = LQ gain + Kalman filter F = lqgreg(Kest,K) The last command returns a state-space model F of the LQG regulator F ( s ) . Note that lqry, kalman, and lqgreg perform discrete-time LQG design when applied to discrete plants. 1-21 1 Quick Start To validate the design, close the loop with feedback and compare the open- and closed-loop impulse responses with impulse. % Close loop clsys = feedback(sys,F,+1) % Note positive feedback % Open- vs. closed-loop impulse responses impulse(sys,'r--',clsys,'b-') Impulse Response 10 8 6 Amplitude 4 2 0 −2 −4 −6 −8 0 2 4 6 Time (sec.) 1-22 8 10 12 The Root Locus Design GUI The Root Locus Design GUI You can also design a compensator using the Root Locus Design Graphical User Interface (GUI). See Chapter 8, “The Root Locus Design GUI” for more information. The Root Locus Design GUI is an interactive graphical user interface that assists you in designing a compensator by providing the following features: • Tuning the value of the feedback or compensator gain • Adding/removing compensator poles and zeros directly on the root locus plot • Dragging compensator poles and zeros around in the root locus plane • Examining changes in the closed-loop response whenever the compensator is changed • Drawing boundaries on the root locus plane for parameters such as minimum damping ratio, etc. • Zooming in to regions of the root locus To initialize the Root Locus Design GUI, simply type rltool rltool can also be called with additional input arguments that allow you to initialize the plant and compensator used in the Root Locus Design GUI. For example, rltool(sys) initializes a Root Locus Design GUI with the linear time invariant (LTI) object sys as the plant. Adding a second input argument, as in rltool(sys,comp) also initializes the LTI object comp as the root locus compensator. When one or two input arguments are provided, the root locus of the closed-loop poles and their locations for the current compensator gain are drawn. The closed-loop model is generated by placing the compensator and design model in the forward path of a negative unity feedback system. 1-23 1 Quick Start 1-24 2 LTI Models Introduction . . . . . . . . . . . . . . . . . . . . 2-2 Creating LTI Models . . . . . . . . . . . . . . . . 2-8 LTI Properties . . . . . . . . . . . . . . . . . . . 2-26 Model Conversion . . . . . . . . . . . . . . . . . 2-42 Time Delays . . . . . . . . . . . . . . . . . . . . 2-45 Simulink Block for LTI Systems . . . . . . . . . . . 2-57 References . . . . . . . . . . . . . . . . . . . . . 2-59 2 LTI Models Introduction The Control System Toolbox offers extensive tools to manipulate and analyze linear time-invariant (LTI) models. It supports both continuous- and discrete-time systems. Systems can be single-input/single-output (SISO) or multiple-input/multiple-output (MIMO). In addition, you can store several LTI models in an array under a single variable name. See Chapter 4, “Arrays of LTI Models” for information on LTI arrays. This section introduces key concepts about the MATLAB representation of LTI models, including LTI objects, precedence rules for operations, and an analogy between LTI systems and matrices. In addition, it summarizes the basic commands you can use on LTI objects. LTI Models You can specify LTI models as: • Transfer functions (TF), for example, s+2 P ( s ) = -------------------------s 2 + s + 10 • Zero-pole-gain models (ZPK), for example, H(z) = 2 ( z – 0.5 ) ------------------------z ( z + 0.1 ) 2 (z + z + 1) --------------------------------------------( z + 0.2 ) ( z + 0.1 ) • State-space models (SS), for example, dx ------ = Ax + Bu dt y = Cx + Du where A, B, C, and D are matrices of appropriate dimensions, x is the state vector, and u and y are the input and output vectors. • Frequency response data (FRD) models FRD models consist of sampled measurements of a system’s frequency response. For example, you can store experimentally collected frequency response data in an FRD. 2-2 Introduction Using LTI Models in the Control System Toolbox You can manipulate TF, SS, and ZPK models using the arithmetic and model interconnection operations described in Chapter 3, “Operations on LTI Models,” and analyze them using the model analysis functions, such as bode and step, described in Chapter 5, “Model Analysis Tools.” FRD models can be manipulated and analyzed in much the same way you analyze the other model types, but analysis is restricted to frequency-domain methods. Using a variety of design techniques, you can design compensators for systems specified with TF, ZPK, SS, and FRD models. These techniques include root locus analysis, pole placement, LQG optimal control, and frequency domain loop-shaping. For FRD models, you can either: • Obtain an identified TF, SS, or ZPK model using system identification techniques. • Use frequency-domain analysis techniques. Other Uses of FRD Models FRD models are unique model types available in the Control System Toolbox collection of LTI model types, in that they don’t have a parametric representation. In addition to the standard operations you may perform on FRD models, you can also use them to: • Perform frequency-domain analysis on systems with nonlinearities using describing functions. • Validate identified models against experimental frequency response data. LTI Objects Depending on the type of model you use, the data for your model may consist of a simple numerator/denominator pair for SISO transfer functions, four matrices for state-space models, and multiple sets of zeros and poles for MIMO zero-pole-gain models or frequency and response vectors for FRD models. For convenience, the Control System Toolbox provides customized data structures (LTI objects) for each type of model. These are called the TF, ZPK, SS, and FRD objects. These four LTI objects encapsulate the model data and enable you to manipulate LTI systems as single entities rather than collections of data vectors or matrices. 2-3 2 LTI Models Creating an LTI Object: An Example An LTI object of the type TF, ZPK, SS, or FRD is created whenever you invoke the corresponding constructor function, tf, zpk, ss, or frd. For example, P = tf([1 2],[1 1 10]) creates a TF object, P, that stores the numerator and denominator coefficients of the transfer function s+2 P ( s ) = -------------------------s 2 + s + 10 See “Creating LTI Models” on page 2-8 for methods for creating all of the LTI object types. LTI Properties and Methods The LTI object implementation relies on MATLAB object-oriented programming capabilities. Objects are MATLAB structures with an additional flag indicating their class (TF, ZPK, SS, or FRD for LTI objects) and have pre-defined fields called object properties. For LTI objects, these properties include the model data, sample time, delay times, input or output names, and input or output groups (see “LTI Properties” on page 2-26 for details). The functions that operate on a particular object are called the object methods. These may include customized versions of simple operations such as addition or multiplication. For example, P = tf([1 2],[1 1 10]) Q = 2 + P performs transfer function addition. 2 2s + 3s + 22 Q ( s ) = 2 + P ( s ) = ---------------------------------2 s + s + 10 The object-specific versions of such standard operations are called overloaded operations. For more details on objects, methods, and object-oriented programming, see Chapter 14, “Classes and Objects” in Using MATLAB. For details on operations on LTI objects, see Chapter 3, “Operations on LTI Models.” 2-4 Introduction Precedence Rules Operations like addition and commands like feedback operate on more than one LTI model at a time. If these LTI models are represented as LTI objects of different types (for example, the first operand is TF and the second operand is SS), it is not obvious what type (for example, TF or SS) the resulting model should be. Such type conflicts are resolved by precedence rules. Specifically, TF, ZPK, SS, and FRD objects are ranked according to the precedence hierarchy. FRD > SS > ZPK > TF Thus ZPK takes precedence over TF, SS takes precedence over both TF and ZPK, and FRD takes precedence over all three. In other words, any operation involving two or more LTI models produces: • An FRD object if at least one operand is an FRD object • An SS object if no operand is an FRD object and at least one operand is an SS object • A ZPK object if no operand is an FRD or SS object and at least one is an ZPK object • A TF object only if all operands are TF objects Operations on systems of different types work as follows: the resulting type is determined by the precedence rules, and all operands are first converted to this type before performing the operation. Viewing LTI Systems As Matrices In the frequency domain, an LTI system is represented by the linear input/ output map y = Hu This map is characterized by its transfer matrix H, a function of either the Laplace or Z-transform variable. The transfer matrix H maps inputs to outputs, so there are as many columns as inputs and as many rows as outputs. If you think of LTI systems in terms of (transfer) matrices, certain basic operations on LTI systems are naturally expressed with a matrix-like syntax. 2-5 2 LTI Models For example, the parallel connection of two LTI systems sys1 and sys2 can be expressed as sys = sys1 + sys2 because parallel connection amounts to adding the transfer matrices. Similarly, subsystems of a given LTI model sys can be extracted using matrix-like subscripting. For instance, sys(3,1:2) provides the I/O relation between the first two inputs (column indices) and the third output (row index), which is consistent with y1 H ( 1, 1 ) H ( 2, 1 ) y 2 = H ( 2, 1 ) H ( 2, 2 ) u 1 u 2 H ( 3, 1 ) H ( 3, 2 ) y3 for y = Hu. Command Summary The next two tables give an overview of the main commands you can apply to LTI models. Table 2-1: Creating LTI Models or Getting Data From Them 2-6 Command Description drss Generate random discrete state-space model. dss Create descriptor state-space model. filt Create discrete filter with DSP convention. frd Create an FRD model. frdata Retrieve FRD model data. get Query LTI model properties. rss Generate random continuous state-space model. Introduction Table 2-1: Creating LTI Models or Getting Data From Them (Continued) Command Description set Set LTI model properties. size Get output/input/array dimensions or model order. ss Create a state-space model. ssdata, dssdata Retrieve state-space data (respectively, descriptor state-space data) or convert it to cell array format. tf Create a transfer function. tfdata Retrieve transfer function data. zpk Create a zero-pole-gain model. zpkdata Retrieve zero-pole-gain data. Table 2-2: Converting LTI Models Command Description c2d Continuous- to discrete-time conversion. d2c Discrete- to continuous-time conversion. d2d Resampling of discrete-time models. frd Conversion to an FRD model. pade Padé approximation of input delays. ss Conversion to state space. tf Conversion to transfer function. zpk Conversion to zero-pole-gain. 2-7 2 LTI Models Creating LTI Models The functions tf, zpk, ss, and frd create transfer function models, zero-pole-gain models, state-space models, and frequency response data models, respectively. These functions take the model data as input and produce TF, ZPK, SS, or FRD objects that store this data in a single MATLAB variable. This section shows how to create continuous or discrete, SISO or MIMO LTI models with tf, zpk, ss, and frd. Note: You can only specify TF, ZPK, and SS models for systems whose transfer matrices have real-valued coefficients. Transfer Function Models This section explains how to specify continuous-time SISO and MIMO transfer function models. The specification of discrete-time transfer function models is a simple extension of the continuous-time case (see “Discrete-Time Models” on page 2-20). In this section you can also read about how to specify transfer functions consisting of pure gains. SISO Transfer Function Models A continuous-time SISO transfer function n(s) h ( s ) = ----------d(s) is characterized by its numerator n ( s ) and denominator d ( s ) , both polynomials of the Laplace variable s. There are two ways to specify SISO transfer functions: • Using the tf command • As rational expressions in the Laplace variable s To specify a SISO transfer function model h ( s ) = n ( s ) ⁄ d ( s ) using the tf command, type h = tf(num,den) 2-8 Creating LTI Models where num and den are row vectors listing the coefficients of the polynomials n ( s ) and d ( s ), respectively, when these polynomials are ordered in descending powers of s. The resulting variable h is a TF object containing the numerator and denominator data. For example, you can create the transfer function h ( s ) = s ⁄ ( s 2 + 2s + 10 ) by typing h = tf([1 0],[1 2 10]) MATLAB responds with Transfer function: s -------------s^2 + 2 s + 10 Note the customized display used for TF objects. You can also specify transfer functions as rational expressions in the Laplace variable s by: 1 Defining the variable s as a special TF model s = tf('s'); 2 Entering your transfer function as a rational expression in s For example, once s is defined with tf as in 1, H = s/(s^2 + 2*s +10); produces the same transfer function as h = tf([1 0],[1 2 10]); Note: You need only define the variable s as a TF model once. All of the subsequent models you create using rational expressions of s are specified as TF objects, unless you convert the variable s to ZPK. See “Model Conversion” on page 2-42 for more information. 2-9 2 LTI Models MIMO Transfer Function Models MIMO transfer functions are two-dimensional arrays of elementary SISO transfer functions. There are several ways to specify MIMO transfer function models, including: • Concatenation of SISO transfer function models • Using tf with cell array arguments Consider the rational transfer matrix s–1 -----------s+1 . H(s) = s+2 --------------------------2 s + 4s + 5 You can specify H ( s ) by concatenation of its SISO entries. For instance, h11 = tf([1 –1],[1 1]); h21 = tf([1 2],[1 4 5]); or, equivalently, s = tf('s') h11 = (s–1)/(s+1); h21 = (s+2)/(s^2+4*s+5); can be concatenated to form H ( s ). H = [h11; h21] This syntax mimics standard matrix concatenation and tends to be easier and more readable for MIMO systems with many inputs and/or outputs. See “Model Interconnection Functions” on page 3-16 for more details on concatenation operations for LTI systems. Alternatively, to define MIMO transfer functions using tf, you need two cell arrays (say, N and D) to represent the sets of numerator and denominator polynomials, respectively. See Chapter 13, “Structures and Cell Arrays” in Using MATLAB for more details on cell arrays. 2-10 Creating LTI Models For example, for the rational transfer matrix H ( s ) , the two cell arrays N and D should contain the row-vector representations of the polynomial entries of N( s ) = s–1 s+2 D( s ) = s+1 s2 + 4s + 5 You can specify this MIMO transfer matrix H ( s ) by typing N = {[1 –1];[1 2]}; % cell array for N(s) D = {[1 1];[1 4 5]}; % cell array for D(s) H = tf(N,D) MATLAB responds with Transfer function from input to output... s – 1 #1: ----s + 1 #2: s + 2 ------------s^2 + 4 s + 5 Notice that both N and D have the same dimensions as H. For a general MIMO transfer matrix H ( s ), the cell array entries N{i,j} and D{i,j} should be row-vector representations of the numerator and denominator of H ij ( s ), the ijth entry of the transfer matrix H ( s ) . Pure Gains You can use tf with only one argument to specify simple gains or gain matrices as TF objects. For example, G = tf([1 0;2 1]) produces the gain matrix G = 10 21 2-11 2 LTI Models while E = tf creates an empty transfer function. Zero-Pole-Gain Models This section explains how to specify continuous-time SISO and MIMO zero-pole-gain models. The specification for discrete-time zero-pole-gain models is a simple extension of the continuous-time case. See “Discrete-Time Models” on page 2-20. SISO Zero-Pole-Gain Models Continuous-time SISO zero-pole-gain models are of the form ( s – z 1 ) ... ( s – z m ) h ( s ) = k ------------------------------------------------( s – p 1 ) ... ( s – p n ) where k is a real-valued scalar (the gain), and z 1 ,..., z m and p 1 ,..., p n are the real or complex conjugate pairs of zeros and poles of the transfer function h ( s ) . This model is closely related to the transfer function representation: the zeros are simply the numerator roots, and the poles, the denominator roots. There are two ways to specify SISO zero-pole-gain models: • Using the zpk command • As rational expressions in the Laplace variable s The syntax to specify ZPK models directly using zpk is h = zpk(z,p,k) where z and p are the vectors of zeros and poles, and k is the gain. This produces a ZPK object h that encapsulates the z, p, and k data. For example, typing h = zpk(0, [1–i 1+i 2], –2) 2-12 Creating LTI Models produces Zero/pole/gain: –2 s -------------------(s–2) (s^2 – 2s + 2) You can also specify zero-pole-gain models as rational expressions in the Laplace variable s by: 1 Defining the variable s as a ZPK model s = zpk('s') 2 Entering the transfer function as a rational expression in s. For example, once s is defined with zpk, H = –2s/((s – 2)*(s^2 + 2*s + 2)); returns the same ZPK model as h = zpk([0], [2 –1–i –1+i ], –2); Note: You need only define the ZPK variable s once. All subsequent rational expressions of s will be ZPK models, unless you convert the variable s to TF. See “Model Conversion” on page 2-42 for more information on conversion to other model types. MIMO Zero-Pole-Gain Models Just as with TF models, you can also specify a MIMO ZPK model by concatenation of its SISO entries (see “Model Interconnection Functions” on page 3-16). You can also use the command zpk to specify MIMO ZPK models. The syntax to create a p-by-m MIMO zero-pole-gain model using zpk is H = zpk(Z,P,K) 2-13 2 LTI Models where • Z is the p-by-m cell array of zeros (Z{i,j} = zeros of H ij ( s ) ) • P is the p-by-m cell array of poles (P{i,j} = poles of H ij ( s ) ) • K is the p-by-m matrix of gains (K(i,j) = gain of H ij ( s ) ) For example, typing Z = {[],–5;[1–i 1+i] []}; P = {0,[–1 –1];[1 2 3],[]}; K = [–1 3;2 0]; H = zpk(Z,P,K) creates the two-input/two-output zero-pole-gain model H(s) = –1 -----s 3(s + 5) -------------------2 (s + 1) 2 ( s 2 – 2s + 2 ) --------------------------------------------------(s – 1 )( s – 2 )( s – 3 ) 0 Notice that you use [] as a place-holder in Z (or P) when the corresponding entry of H ( s ) has no zeros (or poles). State-Space Models State-space models rely on linear differential or difference equations to describe the system dynamics. Continuous-time models are of the form dx ------ = Ax + Bu dt y = Cx + Du where x is the state vector and u and y are the input and output vectors. Such models may arise from the equations of physics, from state-space identification, or by state-space realization of the system transfer function. 2-14 Creating LTI Models Use the command ss to create state-space models sys = ss(A,B,C,D) For a model with Nx states, Ny outputs, and Nu inputs • A is an Nx-by-Nx real-valued matrix. • B is an Nx-by-Nu real-valued matrix. • C is an Ny-by-Nx real-valued matrix. • D is an Ny-by-Nu real-valued matrix. This produces an SS object sys that stores the state-space matrices A, B, C, and D. For models with a zero D matrix, you can use D = 0 (zero) as a shorthand for a zero matrix of the appropriate dimensions. As an illustration, consider the following simple model of an electric motor. dθ d2θ --------- + 2 ------ + 5θ = 3I dt dt 2 where θ is the angular displacement of the rotor and I the driving current. The relation between the input current u = I and the angular velocity y = dθ ⁄ dt is described by the state-space equations dx ------ = Ax + Bu dt y = Cx where θ x = dθ -----dt A = 0 1 –5 –2 B = 0 3 C = 0 1 This model is specified by typing sys = ss([0 1;–5 –2],[0;3],[0 1],0) 2-15 2 LTI Models to which MATLAB responds a = x1 x2 x1 0 –5.00000 x1 x2 u1 0 3.00000 y1 x1 0 y1 u1 0 x2 1.00000 –2.00000 b = c = x2 1.00000 d = In addition to the A, B, C, and D matrices, the display of state-space models includes state names, input names, and output names. Default names (here, x1, x2, u1, and y1) are displayed whenever you leave these unspecified. See “LTI Properties” on page 2-26 for more information on how to specify state, input, or output names. Descriptor State-Space Models Descriptor state-space (DSS) models are a generalization of the standard state-space models discussed above. They are of the form dx E ------ = Ax + Bu dt y = Cx + Du The Control System Toolbox supports only descriptor systems with a nonsingular E matrix. While such models have an equivalent explicit form dx ------ = ( E – 1 A )x + ( E – 1 B )u dt y = Cx + Du 2-16 Creating LTI Models it is often desirable to work with the descriptor form when the E matrix is poorly conditioned with respect to inversion. The function dss is the counterpart of ss for descriptor state-space models. Specifically, sys = dss(A,B,C,D,E) creates a continuous-time DSS model with matrix data A,B,C,D,E. For example, consider the dynamical model dω J -------- + Fω = T dt y=ω with vector ω of angular velocities. If the inertia matrix J is poorly conditioned with respect to inversion, you can specify this system as a descriptor model by sys = dss(–F,eye(n),eye(n),0,J) % n = length of vector ω Frequency Response Data (FRD) Models In some instances, you may only have sampled frequency response data, rather than a transfer function or state-space model for the system you want to analyze or control. For information on frequency response analysis of linear systems, see Chapter 8 of [1]. For example, suppose the frequency response function for the SISO system you want to model is G(w). Suppose, in addition, that you perform an experiment to evaluate G(w) at a fixed set of frequencies, w 1, w 2, …, w n. You can do this by driving the system with a sequence of sinusoids at each of these frequencies, as depicted below. sin w i t G(w) = yi ( t ) 2-17 2 LTI Models Here w i is the input frequency of each sinusoid, i = 1 ... n, and G(w) = G ( w ) exp ( j ∠G ( w ) ) . The steady state output response of this system satisfies y i ( t ) = G ( w i ) sin ( w i t + ∠G ( w i ) ) ; i = 1…n A frequency response data (FRD) object is a model form you can use to store frequency response data (complex frequency response, along with a corresponding vector of frequency points) that you obtain either through simulations or experimentally. In this example, the frequency response data is obtained from the set of response pairs: { (G ( w i ),w i) }, i = 1…n . Once you store your data in an FRD model, you can treat it as an LTI model, and manipulate an FRD model in most of the same ways you manipulate TF, SS, and ZPK models. The basic syntax for creating a SISO FRD model is sys = frd(response,frequencies,units) where • frequencies is a real vector of length Nf. • response is a vector of length Nf of complex frequency response values for these frequencies. • units is an optional string for the units of frequency: either 'rad/s' (default) or 'Hz' 2-18 Creating LTI Models For example, the MAT-file LTIexamples.mat contains a frequency vector freq, and a corresponding complex frequency response data vector respG. To load this frequency-domain data and construct an FRD model, type load LTIexamples sys = frd(respG,freq) Continuous-time frequency response with 1 output and 1 input at 5 frequency points. From input 1 to: Frequency(rad/s) ---------------1 2 4 5 output 1 -------–0.812505 –0.000312i –0.092593 –0.462963i –0.075781 –0.001625i –0.043735 –0.000390i The syntax for creating a MIMO FRD model is the same as for the SISO case, except that response is a p-by-m-by-Nf multidimensional array, where p is the number of outputs, m is the number of inputs, and Nf is the number of frequency data points (the length of frequency). The following table summarizes the complex-valued response data format for FRD models. Table 2-3: Data Format for the Argument response in FRD Models Model Form Response Data Format SISO model Vector of length Nf for which response(i) is the frequency response at the frequency frequency(i) MIMO model with Ny outputs and Nu inputs Ny-by-Nu-by-Nf multidimensional array for which response(i,j,k) specifies the frequency response from input j to output i at frequency frequency(k) S1-by-...-by-Sn array of models with Ny outputs and Nu inputs Ny-by-Nu-by-S1-by-...-by-Sn multidimensional array, for which response(i,j,k,:) specifies the array of frequency response data from input j to output i at frequency frequency(k) 2-19 2 LTI Models Discrete-Time Models Creating discrete-time models is very much like creating continuous-time models, except that you must also specify a sampling period or sample time for discrete-time models. The sample time value should be scalar and expressed in seconds. You can also use the value –1 to leave the sample time unspecified. To specify discrete-time LTI models using tf, zpk, ss, or frd, simply append the desired sample time value Ts to the list of inputs. sys1 sys2 sys3 sys4 = = = = tf(num,den,Ts) zpk(z,p,k,Ts) ss(a,b,c,d,Ts) frd(response,frequency,Ts) For example, h = tf([1 –1],[1 –0.5],0.1) creates the discrete-time transfer function h ( z ) = ( z – 1 ) ⁄ ( z – 0.5 ) with sample time 0.1 seconds, and sys = ss(A,B,C,D,0.5) specifies the discrete-time state-space model x [ n + 1 ] = Ax [ n ] + Bu [ n ] y [ n ] = Cx [ n ] + Du [ n ] with sampling period 0.5 second. The vectors x [ n ], u [ n ], y [ n ] denote the values of the state, input, and output vectors at the nth sample. By convention, the sample time of continuous-time models is Ts = 0. Setting Ts = –1 leaves the sample time of a discrete-time model unspecified. For example, h = tf([1 –0.2],[1 0.3],–1) 2-20 Creating LTI Models produces Transfer function: z – 0.2 ------z + 0.3 Sampling time: unspecified Note: Do not simply omit Ts in this case. This would make h a continuous-time transfer function. If you forget to specify the sample time when creating your model, you can still set it to the correct value by reassigning the LTI property Ts. See “Sample Time” on page 2-34 for more information on setting this property. Discrete-Time TF and ZPK Models You can specify discrete-time TF and ZPK models using tf and zpk as indicated above. Alternatively, it is often convenient to specify such models by: 1 Defining the variable z as a particular discrete-time TF or ZPK model with the appropriate sample time 2 Entering your TF or ZPK model directly as a rational expression in z. This approach parallels the procedure for specifying continuous-time TF or ZPK models using rational expressions. This procedure is described in “SISO Transfer Function Models” on page 2-8 and “SISO Zero-Pole-Gain Models” on page 2-12. For example, z = tf('z', 0.1); H = (z+2)/(z^2 + 0.6*z + 0.9); creates the same TF model as H = tf([1 2], [1 0.6 0.9], 0.1); 2-21 2 LTI Models Similarly, z = zpk('z', 0.1); H = [z/(z+0.1)/(z+0.2) ; (z^2+0.2*z+0.1)/(z^2+0.2*z+0.01)] produces the single-input, two-output ZPK model Zero/pole/gain from input to output... z #1: --------------(z+0.1) (z+0.2) #2: (z^2 + 0.2z + 0.1) -----------------(z+0.1)^2 Sampling time: 0.1 Note that: • The syntax z = tf('z') is equivalent to z = tf('z',–1) and leaves the sample time unspecified. The same applies to z = zpk('z'). • Once you have defined z as indicated above, any rational expressions in z creates a discrete-time model of the same type and with the same sample time as z. Discrete Transfer Functions in DSP Format In digital signal processing (DSP), it is customary to write discrete transfer functions as rational expressions in z – 1 and to order the numerator and denominator coefficients in ascending powers of z – 1. For example, the numerator and denominator of 1 + 0.5z –1 H ( z – 1 ) = --------------------------------------1 + 2z – 1 + 3z –2 would be specified as the row vectors [1 0.5] and [1 2 3], respectively. When the numerator and denominator have different degrees, this convention clashes with the “descending powers of z ” convention assumed by tf (see “Transfer Function Models” on page 2-8, or tf on page 11-224). For example, h = tf([1 0.5],[1 2 3]) 2-22 Creating LTI Models produces the transfer function z + 0.5 --------------------------2 z + 2z + 3 which differs from H ( z – 1 ) by a factor z . To avoid such convention clashes, the Control System Toolbox offers a separate function filt dedicated to the DSP-like specification of transfer functions. Its syntax is h = filt(num,den) for discrete transfer functions with unspecified sample time, and h = filt(num,den,Ts) to further specify the sample time Ts. This function creates TF objects just like tf, but expects num and den to list the numerator and denominator coefficients in ascending powers of z – 1 . For example, typing h = filt([1 0.5],[1 2 3]) produces Transfer function: 1 + 0.5 z^–1 ------------------1 + 2 z^–1 + 3 z^–2 Sampling time: unspecified You can also use filt to specify MIMO transfer functions in z – 1. Just as for tf, the input arguments num and den are then cell arrays of row vectors of appropriate dimensions (see “Transfer Function Models” on page 2-8 for details). Note that each row vector should comply with the “ascending powers of z –1 ” convention. 2-23 2 LTI Models Data Retrieval The functions tf, zpk, ss, and frd pack the model data and sample time in a single LTI object. Conversely, the following commands provide convenient data retrieval for any type of TF, SS, or ZPK model sys, or FRD model sysfr. [num,den,Ts] = tfdata(sys) % Ts = sample time [z,p,k,Ts] = zpkdata(sys) [a,b,c,d,Ts] = ssdata(sys) [a,b,c,d,e,Ts] = dssdata(sys) [response,frequency,Ts] = frdata(sysfr) Note that: • sys can be any type of LTI object, except an FRD model • sysfr, the input argument to frdata, can only be an FRD model You can use any variable names you want in the output argument list of any of these functions. The ones listed here correspond to the model property names described in Tables 2-2 – 2.5. The output arguments num and den assigned to tfdata, and z and p assigned to zpkdata, are cell arrays, even in the SISO case. These cell arrays have as many rows as outputs, as many columns as inputs, and their ijth entry specifies the transfer function from the jth input to the ith output. For example, H = [tf([1 –1],[1 2 10]) , tf(1,[1 0])] creates the one-output/two-input transfer function s–1 H ( s ) = ------------------------------2 s + 2s + 10 1 --s Typing [num,den] = tfdata(H); num{1,1}, den{1,1} 2-24 Creating LTI Models displays the coefficients of the numerator and denominator of the first input channel. ans = 0 ans = 1 1 –1 2 10 Note that the same result is obtained using H.num{1,1}, H.den{1,1} See “Direct Property Referencing” on page 2-33 for more information about this syntax. To obtain the numerator and denominator of SISO systems directly as row vectors, use the syntax [num,den,Ts] = tfdata(sys,'v') For example, typing sys = tf([1 3],[1 2 5]); [num,den] = tfdata(sys,'v') produces num = 0 1 3 2 5 den = 1 Similarly, [z,p,k,Ts] = zpkdata(sys,'v') returns the zeros, z, and the poles, p, as vectors for SISO systems. 2-25 2 LTI Models LTI Properties The previous section shows how to create LTI objects that encapsulate the model data and sample time. You also have the option to attribute additional information, such as the input names or notes on the model history, to LTI objects. This section gives a complete overview of the LTI properties, i.e., the various pieces of information that can be attached to the TF, ZPK, SS, and FRD objects. Type help ltiprops for online help on available LTI properties. From a data structure standpoint, the LTI properties are the various fields in the TF, ZPK, SS, and FRD objects. These fields have names (the property names) and are assigned values (the property values). We distinguish between generic properties, common to all four types of LTI objects, and model-specific properties that pertain only to one particular type of model. Generic Properties The generic properties are those shared by all four types of LTI models (TF, ZPK, SS, and FRD objects). They are listed in the table below. Table 2-4: Generic LTI Properties 2-26 Property Name Description Property Value IoDelayMatrix I/O delay(s) Matrix InputDelay Input delay(s) Vector InputGroup Input channel groups Cell array InputName Input channel names Cell vector of strings Notes Notes on the model history Text OutputDelay Output delay(s) Vector OutputGroup Output channel groups Cell array OutputName Output channel names Cell vector of strings Ts Sample time Scalar Userdata Additional data Arbitrary LTI Properties The sample time property Ts keeps track of the sample time (in seconds) of discrete-time systems. By convention, Ts is 0 (zero) for continuous-time systems, and Ts is –1 for discrete-time systems with unspecified sample time. Ts is always a scalar, even for MIMO systems. The InputDelay, OutputDelay, and ioDelayMatrix properties allow you to specify time delays in the input or output channels, or for each input/output pair. Their default value is zero (no delay). See “Time Delays” on page 2-45 for details on modeling delays. The InputName and OutputName properties enable you to give names to the individual input and output channels. The value of each of these properties is a cell vector of strings with as many cells as inputs or outputs. For example, the OutputName property is set to { 'temperature' ; 'pressure' } for a system with two outputs labeled temperature and pressure. The default value is a cell of empty strings. Using the InputGroup and OutputGroup properties of LTI objects, you can create different groups of input or output channels, and assign names to the groups. For example, you may want to designate the first four inputs of a five-input model as controls, and the last input as noise. See “Input Groups and Output Groups” on page 2-37 for more information. Finally, Notes and Userdata are available to store additional information on the model. The Notes property is dedicated to any text you want to supply with your model, while the Userdata property can accommodate arbitrary user-supplied data. They are both empty by default. For more detailed information on how to use LTI properties, see “Additional Insight into LTI Properties” on page 2-34. 2-27 2 LTI Models Model-Specific Properties The remaining LTI properties are specific to one of the four model types (TF, ZPK, SS, or FRD). For single LTI models, these are summarized in the following four tables. The property values differ for LTI arrays. See set on page 11-193 for more information on these values. Table 2-5: TF-Specific Properties Property Name Description Property Value den Denominator(s) Real cell array of row vectors num Numerator(s) Real cell array of row vectors Variable Transfer function variable String 's', 'p', 'z', 'q', or 'z^–1' Table 2-6: ZPK-Specific Properties Property Name Description Property Value k Gains Two-dimensional real matrix p Poles Cell array of column vectors Variable Transfer function variable String 's', 'p', 'z', 'q', or 'z^–1' Zeros Cell array of column vectors z Table 2-7: SS-Specific Properties 2-28 Property Name Description Property Value a State matrix A 2-D real matrix b Input-to-state matrix B 2-D real matrix c State-to-output matrix C 2-D real matrix d Feedthrough matrix D 2-D real matrix LTI Properties Table 2-7: SS-Specific Properties (Continued) Property Name Description Property Value e Descriptor E matrix 2-D real matrix StateName State names Cell vector of strings Table 2-8: FRD-Specific Properties Property Name Description Property Value Frequency Frequency data points Real-valued vector ResponseData Frequency response Complex-valued multidimensional array Units Units for frequency String 'rad/s' or 'Hz' Most of these properties are dedicated to storing the model data. Note that the E matrix is set to [] (the empty matrix) for standard state-space models, a storage-efficient shorthand for the true value E = I . The Variable property is only an attribute of TF and ZPK objects. This property defines the frequency variable of transfer functions. The default values are 's' (Laplace variable s ) in continuous time and 'z' (Z-transform variable z ) in discrete time. Alternative choices include 'p' (equivalent to s ) and 'q' or 'z^–1' for the reciprocal q = z – 1 of the z variable. The influence of the variable choice is mostly limited to the display of TF or ZPK models. One exception is the specification of discrete-time transfer functions with tf (see tf on page 11-224 for details). Note that tf produces the same result as filt when the Variable property is set to 'z^–1' or 'q'. Finally, the StateName property is analogous to the InputName and OutputName properties and keeps track of the state names in state-space models. 2-29 2 LTI Models Setting LTI Properties There are three ways to specify LTI property values: • You can set properties when creating LTI models with tf, zpk, ss, or frd. • You can set or modify the properties of an existing LTI model with set. • You can also set property values using structure-like assignments. This section discusses the first two options. See “Direct Property Referencing” on page 2-33 for details on the third option. The function set for LTI objects follows the same syntax as its Handle Graphics counterpart. Specifically, each property is updated by a pair of arguments PropertyName,PropertyValue where • PropertyName is a string specifying the property name. You can type the property name without regard for the case (upper or lower) of the letters in the name. Actually, you need only type any abbreviation of the property name that uniquely identifies the property. For example, 'user' is sufficient to refer to the Userdata property. • PropertyValue is the value to assign to the property (see set on page 11-193 for details on admissible property values). As an illustration, consider the following simple SISO model for a heating system with an input delay of 0.3 seconds, an input called “energy,” and an output called “temperature.” energy e – 0.3s 1 -----------s+1 temperature delay Figure 2-1: A Simple Heater Model You can use a TF object to represent this delay system, and specify the time delay, the input and output names, and the model history by setting the corresponding LTI properties. You can either set these properties directly when you create the LTI model with tf, or by using the set command. 2-30 LTI Properties For example, you can specify the delay directly when you create the model, and then use the set command to assign InputName, OutputName, and Notes to sys. sys = tf(1,[1 1],'Inputdelay',0.3); set(sys,'inputname','energy','outputname','temperature',... 'notes','A simple heater model') Finally, you can also use the set command to obtain a listing of all settable properties for a given LTI model type, along with valid values for these properties. For the transfer function sys created above set(sys) produces num: Ny-by-Nu cell of row vectors (Nu = no. of inputs) den: Ny-by-Nu cell of row vectors (Ny = no. of outputs) Variable: [ 's' | 'p' | 'z' | 'z^-1' | 'q' ] Ts: scalar InputDelay: Nu-by-1 vector OutputDelay: Ny-by-1 vector ioDelayMatrix: Ny-by-Nu array (I/O delays) InputName: Nu-by-1 cell array of strings OutputName: Ny-by-1 cell array of strings InputGroup: M-by-2 cell array if M input groups OutputGroup: P-by-2 cell array if P output groups Notes: array or cell array of strings UserData: arbitrary Accessing Property Values Using get You access the property values of an LTI model sys with get. The syntax is PropertyValue = get(sys,PropertyName) 2-31 2 LTI Models where the string PropertyName is either the full property name, or any abbreviation with enough characters to identify the property uniquely. For example, typing h = tf(100,[1 5 100],'inputname','voltage',... 'outputn','current',... 'notes','A simple circuit') get(h,'notes') produces ans = 'A simple circuit' To display all of the properties of an LTI model sys (and their values), use the syntax get(sys). In this example, get(h) produces num: {[0 0 100]} den: {[1 5 100]} Variable: 's' Ts: 0 InputDelay: 0 OutputDelay: 0 ioDelayMatrix: 0 InputName: {'voltage'} OutputName: {'current'} InputGroup: {0x2 cell} OutputGroup: {0x2 cell} Notes: {'A simple circuit'} UserData: [] Notice that default (output) values have been assigned to any LTI properties in this list that you have not specified. Finally, you can also access property values using direct structure-like referencing. This topic is explained in the next section. 2-32 LTI Properties Direct Property Referencing An alternative way to query/modify property values is by structure-like referencing. Recall that LTI objects are basic MATLAB structures except for the additional flag that marks them as TF, ZPK, SS, or FRD objects (see page 2-3). The field names for LTI objects are the property names, so you can retrieve or modify property values with the structure-like syntax. PropertyValue = sys.PropertyName% gets property value sys.PropertyName = PropertyValue% sets property value These commands are respectively equivalent to PropertyValue = get(sys,'PropertyName') set(sys,'PropertyName',PropertyValue) For example, type sys = ss(1,2,3,4,'InputName','u'); sys.a and you get the value of the property “a” for the state-space model sys. ans = 1 Similarly, sys.a = –1; resets the state transition matrix for sys to –1. See “LTI Arrays of SS Models with Differing Numbers of States” on page 4-23 for information on setting the properties of LTI arrays of state-space models with different numbers of states in each model. Unlike standard MATLAB structures, you do not need to type the entire field name or use upper-case characters. You only need to type the minimum number of characters sufficient to identify the property name uniquely. Thus either of the commands sys.InputName sys.inputn 2-33 2 LTI Models produces ans = 'u' Any valid syntax for structures extends to LTI objects. For example, given the TF model h ( p ) = 1 ⁄ p h = tf(1,[1,0],'variable','p'); you can reset the numerator to p + 2 by typing h.num{1} = [1 2]; or equivalently, with h.num{1}(2) = 2; Additional Insight into LTI Properties By reading this section, you can learn more about using the Ts, InputName, OutputName, InputGroup, and OutputGroup LTI properties through a set of examples. For basic information on Notes and Userdata, see “Generic Properties” on page 2-26. For detailed information on the use of InputDelay, OutputDelay, and ioDelayMatrix, see “Time Delays” on page 2-45. Sample Time The sample time property Ts is used to specify the sampling period (in seconds) for either discrete-time or discretized continuous-time LTI models. Suppose you want to specify z H ( z ) = --------------------------2 2z + z + 1 as a discrete-time transfer function model with a sampling period of 0.5 seconds. To do this, type h = tf([1 0],[2 1 1],0.5); 2-34 LTI Properties This sets the Ts property to the value 0.5, as is confirmed by h.Ts ans = 0.5000 For continuous-time models, the sample time property Ts is 0 by convention. For example, type h = tf(1,[1 0]); get(h,'Ts') ans = 0 To leave the sample time of a discrete-time LTI model unspecified, set Ts to – 1. For example, h = tf(1,[1 –1],–1) produces Transfer function: 1 ----z – 1 Sampling time: unspecified The same result is obtained by using the Variable property. h = tf(1,[1 –1],'var','z') In operations that combine several discrete-time models, all specified sample times must be identical, and the resulting discrete-time model inherits this common sample time. The sample time of the resultant model is unspecified if all operands have unspecified sample times. With this inheritance rule for Ts, the following two models are equivalent. tf(0.1,[1 –1],0.1) + tf(1,[1 0.5],–1) and tf(0.1,[1 –1],0.1) + tf(1,[1 0.5],0.1) 2-35 2 LTI Models Note that tf(0.1,[1 –1],0.1) + tf(1,[1 0.5],0.5) returns an error message. ??? Error using ==> lti/plus In SYS1+SYS2, both models must have the same sample time. Caution: Resetting the sample time of a continuous-time LTI model sys from zero to a nonzero value does not discretize the original model sys. The command set(sys,'Ts',0.1) only affects the Ts property and does not alter the remaining model data. Use c2d and d2c to perform continuous-to-discrete and discrete-to-continuous conversions. For example, use sysd = c2d(sys,0.1) to discretize a continuous system sys at a 10Hz sampling rate. Use d2d to change the sample time of a discrete-time system and resample it. Input Names and Output Names You can use the InputName and OutputName properties (in short, I/O names) to assign names to any or all of the input and output channels in your LTI model. For example, you can create a SISO model with input thrust, output velocity, and transfer function H ( p ) = 1 ⁄ ( p + 10 ) by typing h = tf(1,[1 10]); set(h,'inputname','thrust','outputname','velocity',... 'variable','p') Equivalently, you can set these properties directly by typing h = tf(1,[1 10],'inputname','thrust',... 'outputname','velocity',... 'variable','p') 2-36 LTI Properties This produces Transfer function from input "thrust" to output "velocity": 1 -----p + 10 Note how the display reflects the input and output names and the variable selection. In the MIMO case, use cell vectors of strings to specify input or output channel names. For example, type num = {3 , [1 2]}; den = {[1 10] , [1 0]}; H = tf(num,den); % H(s) has one output and two inputs set(H,'inputname',{'temperature' ; 'pressure'}) The specified input names appear in the display of H. Transfer function from input "temperature" to output: 3 -----s + 10 Transfer function from input "pressure" to output: s + 2 ----s To leave certain names undefined, use the empty string '' as in H = tf(num,den,'inputname',{ 'temperature' ; '' }) Input Groups and Output Groups In many applications, you may want to create several (distinct or intersecting) groups of input or output channels and name these groups. For example, you may want to label one set of input channels as noise and another set as controls. 2-37 2 LTI Models To see how input and output groups (I/O groups) work: 1 Create a random state-space model with one state, three inputs, and three outputs. 2 Assign the first two inputs to a group named controls, the first output to a group named temperature, and the last two outputs to a group named measurements. 2-38 LTI Properties To do this, type h = rss(1,3,3); set(h, 'InputGroup',{[1 2] 'controls'}) set(h, 'OutputGroup', {[1] 'temperature'; [2 3] 'measurements'}) h and MATLAB returns a state-space model of the following form. a = x1 x1 –0.64884 x1 u1 0.12533 y1 y2 y3 x1 1.1909 1.1892 0 y1 y2 y3 u1 0.32729 0 0 b = u2 0 u3 0 u2 0 0 2.1832 u3 –0.1364 0 0 c = d = I/O Groups: Group Name controls temperature measurements I/O I O O Channel(s) 1,2 1 2,3 Continuous-time model. 2-39 2 LTI Models Notice that the middle column of the I/O group listing indicates whether the group is an input group (I) or an output group (O). In general, to specify M input groups (or output groups), you need an M-by-2 cell array organized as follows. Group Names Vectors of Channel Indices { Channels for Group 1 , Name for Group 1; Channels for Group 2 , Name for Group 2; Channels for Group M , Name for Group M } Figure 2-2: Two Column Cell Array When you specify the cell array for input (or output) groups, keep in mind: • Each row of this cell array designates a different input (output) group. • You can add input (or output) groups by appending rows to the cell array. • You can choose not to assign any of the group names when you assign the groups, and leave off the second column of this array. In that case, - Empty strings are assigned to the group names by default. - If you append rows to a cell array with no group names assigned, you have to assign empty strings ('') to the group names. For example, h.InputGroup = [h.InputGroup; {[3] 'disturbance'}]; adds another input group called disturbance to h. 2-40 LTI Properties You can use regular cell array syntax for accessing or modifying I/O group components. For example, to delete the first output group, temperature, type h.OutputGroup(1,:) = [] ans = [1x2 double] 'measurements' Similarly, you can add or delete channels from an existing input or output group. Recalling that input group channels are stored in the first column of the corresponding cell array, to add channel three to the input group controls, type h.inputgroup{1,1} = [h.inputgroup{1,1} 3] or, equivalently, h.inputgroup{1,1} = [1 2 3] 2-41 2 LTI Models Model Conversion There are four LTI model types you can use with the Control System Toolbox: TF, ZPK, SS, and FRD. This section shows how to convert models from one type to the other. Explicit Conversion Model conversions are performed by tf, ss, zpk, and frd. Given any TF, SS, or ZPK model sys, the syntax for conversion to another model type is sys = tf(sys) % Conversion to TF sys = zpk(sys) % Conversion to ZPK sys = ss(sys) % Conversion to SS sys = frd(sys,frequency) % Conversion to FRD Notice that FRD models can’t be converted to the other model types. In addition, you must also include a vector of frequencies (frequency) as an input argument when converting to an FRD model. For example, you can convert the state-space model sys = ss(–2,1,1,3) to a zero-pole-gain model by typing zpk(sys) to which MATLAB responds Zero/pole/gain: 3 (s+2.333) ----------(s+2) Note that the transfer function of a state-space model with data ( A, B, C, D ) is –1 H ( s ) = D + C ( sI – A ) B 2-42 Model Conversion for continuous-time models, and –1 H ( z ) = D + C ( zI – A ) B for discrete-time models. Automatic Conversion Some algorithms operate only on one type of LTI model. For example, the algorithm for zero-order-hold discretization with c2d can only be performed on state-space models. Similarly, commands like tfdata expect one particular type of LTI models (TF). For convenience, such commands automatically convert LTI models to the appropriate or required model type. For example, in sys = ss(0,1,1,0) [num,den] = tfdata(sys) tfdata first converts the state-space model sys to an equivalent transfer function in order to return numerator and denominator data. Note that conversions to state-space models are not uniquely defined. For this reason, automatic conversions to state space are disabled when the result depends on the choice of state coordinates, for example, in commands like initial or kalman. Caution About Model Conversions When manipulating or converting LTI models, keep in mind that: • The three LTI model types TF, ZPK, and SS, are not equally well-suited for numerical computations. In particular, the accuracy of computations using high-order transfer functions is often poor. Therefore, it is often preferable to work with the state-space representation. In addition, it is often beneficial to balance and scale state-space models using ssbal. You get this type of 2-43 2 LTI Models balancing automatically when you convert any TF or ZPK model to state space using ss. • Conversions to the transfer function representation using tf may incur a loss of accuracy. As a result, the transfer function poles may noticeably differ from the poles of the original zero-pole-gain or state-space model. • Conversions to state space are not uniquely defined in the SISO case, nor are they guaranteed to produce a minimal realization in the MIMO case. For a given state-space model sys, ss(tf(sys)) may return a model with different state-space matrices, or even a different number of states in the MIMO case. Therefore, if possible, it is best to avoid converting back and forth between state-space and other model types. 2-44 Time Delays Time Delays Using the ioDelayMatrix, InputDelay, and OutputDelay properties of LTI objects, you can specify delays in both continuous- and discrete-time LTI models. With these properties, you can, for example, represent: • LTI models with independent delays for each input/output pair. For example, the continuous-time model with transfer function H(s) = e –0.1s 10 2 --s e e – 0.3s – 0.2s s+1 --------------s + 10 s–1 -----------s+5 • State-space models with delayed inputs and/or delayed outputs. For example, · x ( t ) = Ax ( t ) + Bu ( t – τ ) y ( t ) = Cx ( t – θ ) + Du ( t – ( θ + τ ) ) where τ is the time delay between the input u ( t ) and the state vector x ( t ) , and θ is the time delay between x ( t ) and the output y ( t ) . You can assign the delay properties ioDelayMatrix, InputDelay, and OutputDelay either when first creating your model with the tf, zpk, ss, or frd constructors, or later with the set command (see “LTI Properties and Methods” on page 2-4 for details). Supported Functionality Most analysis commands support time delays, including: • All time and frequency response commands • Conversions between model types • Continuous-to-discrete conversions (c2d) • Horizontal and vertical concatenation • Series, parallel, and feedback interconnections of discrete-time models with delays 2-45 2 LTI Models • Interconnections of continuous-time delay systems as long as the resulting transfer function from input j to output i is of the form exp ( – sτ ij ) h ij ( s ) where h ij ( s ) is a rational function of s • Padé approximation of time delays (pade) Specifying Input/Output Delays Using the ioDelayMatrix property, you can specify frequency-domain models with independent delays in each entry of the transfer function. In continuous time, such models have a transfer function of the form e – sτ 11 H(s) = h 11 ( s ) ... e – sτ 1 m : e – sτ p 1 h p1 ( s ) ... e h 1m ( s ) : – sτ p m = [ exp ( – sτ ij ) h ij ( s ) ] h pm ( s ) where the h ij ’s are rational functions of s , and τ ij is the time delay between input j and output i . See “Specifying Delays in Discrete-Time Models” on page 2-52 for details on the discrete-time counterpart. We collectively refer to the scalars τ ij as the I/O delays. The syntax to create H ( s ) above is H = tf(num,den,'iodelaymatrix',Tau) or H = zpk(z,p,k,'iodelaymatrix',Tau) where • num, den (respectively, z, p, k) specify the rational part [ h ij ( s ) ] of the transfer function H ( s ) • Tau is the matrix of time delays for each I/O pair. That is, Tau(i,j) specifies the I/O delay τ ij in seconds. Note that Tau and H ( s ) should have the same row and column dimensions. You can also use the ioDelayMatrix property in conjunction with state-space models, as in sys = ss(A,B,C,D,'iodelaymatrix',Tau) 2-46 Time Delays This creates the LTI model with the following transfer function. H(s) = exp ( – sτ ij ) r ij ( s ) Here r ij ( s ) is the ( i, j ) entry of –1 R ( s ) = D + C ( sI – A ) B Note: State-space models with I/O delays have only a frequency-domain interpretation. They cannot, in general, be described by state-space equations with delayed inputs and outputs. Distillation Column Example This example is adapted from [2] and illustrates the use of I/O delays in process modeling. The process of interest is the distillation column depicted by the figure below. This column is used to separate a mix of methanol and water (the feed) into bottom products (mostly water) and a methanol-saturated distillate. 2-47 2 LTI Models Enriched vapor Cooling water Condensate Distillate Feed Reflux Reboiler Vapor Steam flow Bottom liquid Bottom products Figure 2-3: Distillation Column Schematically, the distillation process functions as follows: • Steam flows into the reboiler and vaporizes the bottom liquid. This vapor is reinjected into the column and mixes with the feed • Methanol, being more volatile than water, tends to concentrate in the vapor moving upward. Meanwhile, water tends to flow downward and accumulate as the bottom liquid • The vapor exiting at the top of the column is condensed by a flow of cooling water. Part of this condensed vapor is extracted as the distillate, and the rest of the condensate (the reflux) is sent back to the column. • Part of the bottom liquid is collected from the reboiler as bottom products (waste). 2-48 Time Delays The regulated output variables are: • Percentage X D of methanol in the distillate • Percentage X B of methanol in the bottom products. The goal is to maximize X D by adjusting the reflux flow rate R and the steam flow rate S in the reboiler. To obtain a linearized model around the steady-state operating conditions, the transient responses to pulses in steam and reflux flow are fitted by first-order plus delay models. The resulting transfer function model is – 1s XD ( s ) XB ( s ) = – 3s 12.8e – 18.9e ------------------------ ------------------------16.7e + 1 21.0s + 1 R ( s ) – 7s – 3s S ( s ) – 19.4e 6.6e ------------------------ ------------------------10.9s + 1 14.4s + 1 Note the different time delays for each input/output pair. You can specify this MIMO transfer function by typing H = tf({12.8 –18.9;6.6 –19.4},... {[16.7 1] [21 1];[10.9 1] [14.4 1]},... 'iodelay',[1 3;7 3],... 'inputname',{'R' , 'S'},... 'outputname',{'Xd' , 'Xb'}) 2-49 2 LTI Models The resulting TF model is displayed as Transfer function from input "R" to output... 12.8 Xd: exp(–1*s) * ---------16.7 s + 1 Xb: 6.6 exp(–7*s) * ---------10.9 s + 1 Transfer function from input "S" to output... –18.9 Xd: exp(–3*s) * -------21 s + 1 Xb: –19.4 exp(–3*s) * ---------14.4 s + 1 Specifying Delays on the Inputs or Outputs While ideal for frequency-domain models with I/O delays, the ioDelayMatrix property is inadequate to capture delayed inputs or outputs in state-space models. For example, the two models · ( M 1 ) x ( t ) = – x ( t ) + u ( t – 0.1 ) y(t ) = x( t) · ( M2 ) z ( t ) = –z ( t ) + u( t ) y ( t ) = z ( t – 0.1 ) share the same transfer function – 0.1s e h ( s ) = ---------------s+1 As a result, they cannot be distinguished using the ioDelayMatrix property (the I/O delay value is 0.1 seconds in both cases). Yet, these two models have different state trajectories since x ( t ) and z ( t ) are related by z ( t ) = x ( t – 0.1 ) 2-50 Time Delays Note that the 0.1 second delay is on the input in the first model, and on the output in the second model. InputDelay and OutputDelay Properties When the state trajectory is of interest, you should use the InputDelay and OutputDelay properties to distinguish between delays on the inputs and delays on the outputs in state-space models. For example, you can accurately specify the two models above by M1 = ss(–1,1,1,0,'inputdelay',0.1) M2 = ss(–1,1,1,0,'outputdelay',0.1) In the MIMO case, you can specify a different delay for each input (or output) channel by assigning a vector value to InputDelay (or OutputDelay). For example, sys = ss(A,[B1 B2],[C1;C2],[D11 D12;D21 D22]) sys.inputdelay = [0.1 0] sys.outputdelay = [0.2 0.3] creates the two-input, two-output model · x ( t ) = Ax ( t ) + B 1 u 1 ( t – 0.1 ) + B 2 u 2 ( t ) y 1 ( t + 0.2 ) = C 1 x ( t ) + D 11 u 1 ( t – 0.1 ) + D 12 u 2 ( t ) y 2 ( t + 0.3 ) = C 2 x ( t ) + D 21 u 1 ( t – 0.1 ) + D 22 u 2 ( t ) You can also use the InputDelay and OutputDelay properties to conveniently specify input or output delays in TF, ZPK, or FRD models. For example, you can create the transfer function 1 --s H(s) = 2 -----------s+1 e – 0.1s by typing s = tf('s'); H = [1/s ; 2/(s+1)]; H.inputdelay = 0.1 % rational part 2-51 2 LTI Models The resulting model is displayed as Transfer function from input to output... 1 #1: exp(–0.1*s) * s #2: 2 exp(–0.1*s) * ----s + 1 By comparison, to produce an equivalent transfer function using the ioDelayMatrix property, you would need to type H = [1/s ; 2/(s+1)]; H.iodelay = [0.1 ; 0.1]; Notice that the 0.1 second delay is repeated twice in the I/O delay matrix. More generally, for a TF, ZPK, or FRD model with input delays [ α 1, ..., α m ] and output delays [ β 1, ..., β p ] , the equivalent I/O delay matrix is α1 + β 1 α 2 + β1 α1 + β2 α 2 + β2 : α 1 + βp : α2 + β p ... αm + β 1 αm + β 2 ... : αm + βp Specifying Delays in Discrete-Time Models You can also use the ioDelayMatrix, InputDelay, and OutputDelay properties to specify delays in discrete-time LTI models. You specify time delays in discrete-time models with integer multiples of the sampling period. The integer k you supply for the time delay of a discrete-time model specifies a time delay –k of k sampling periods. Such a delay contributes a factor z to the transfer function. For example, h = tf(1,[1 0.5 0.2],0.1,'inputdelay',3) 2-52 Time Delays produces the discrete-time transfer function Transfer function: 1 z^(–3) * ----------------z^2 + 0.5 z + 0.2 Sampling time: 0.1 Notice the z^(–3) factor reflecting the three-sampling-period delay on the input. Mapping Discrete-Time Delays to Poles at the Origin Since discrete-time delays are equivalent to additional poles at z = 0 , they can be easily absorbed into the transfer function denominator or the state-space equations. For example, the transfer function of the delayed integrator y[ k + 1 ] = y[ k] + u[k – 2] is –2 z H ( z ) = -----------z–1 You can specify this model either as the first-order transfer function 1 ⁄ ( z – 1 ) with a delay of two sampling periods on the input Ts = 1; % sampling period H1 = tf(1,[1 –1],Ts,'inputdelay',2) or directly as a third-order transfer function: H2 = tf(1,[1 –1 0 0],Ts) % 1/(z^3–z^2) While these two models are mathematically equivalent, H1 is a more efficient representation both in terms of storage and subsequent computations. When necessary, you can map all discrete-time delays to poles at the origin using the command delay2z. For example, H2 = delay2z(H1) 2-53 2 LTI Models absorbs the input delay in H1 into the transfer function denominator to produce the third-order transfer function Transfer function: 1 --------z^3 – z^2 Sampling time: 1 Note that H2.inputdelay now returns 0 (zero). Retrieving Information About Delays There are several ways to retrieve time delay information from a given LTI model sys: • Use property display commands to inspect the values of the ioDelayMatrix, InputDelay, and OutputDelay properties. For example, sys.iodelay get(sys,'inputdelay') • Use the helper function hasdelay to determine if sys has any delay at all. The syntax is hasdelay(sys) which returns 1 (true) if sys has any delay, and 0 (false) otherwise • Use the function totaldelay to determine the total delay between each input and each output (cumulative contribution of the ioDelayMatrix, InputDelay, and OutputDelay properties). Type help totaldelay or see the Reference pages for details. Conversion of Models with Delays to State Space When you use ss to convert TF or ZPK models to state-space form, the delays in the resulting state-space model are redistributed when it is possible to reduce the overall number of I/O delays, input channel delays, and output 2-54 Time Delays channel delays. The resulting model has a minimum number of delays. When this minimization takes place: • All or part of the I/O delay matrix is absorbed into the input and output delay vectors. This minimizes the total number of I/O delays. • The input delays are transferred to output delays (or vice-versa), so as to minimize the overall number of input and output channel delays. Padé Approximation of Time Delays The function pade computes rational approximations of time delays in continuous-time LTI models. The syntax is sysx = pade(sys,n) where sys is a continuous-time model with delays, and the integer n specifies the Padé approximation order. The resulting LTI model sysx is of the same type as sys, but is delay free. For models with multiple delays or a mix of input, output, and I/O delays, you can use the syntax sysx = pade(sys,ni,no,nio) where the vectors ni and no, and the matrix nio specify independent approximation orders for each input, output, and I/O delay, respectively. Set ni=[] if there are no input delays, and similarly for no and nio. For example, consider the “Distillation Column Example” on page 2-47. The two-input, two-output transfer function in this example is – 1s H(s) = – 3s – 18.9e 12.8e ------------------------ ------------------------16.7e + 1 21.0s + 1 – 7s – 3s – 19.4e 6.6e ------------------------ ------------------------10.9s + 1 14.4s + 1 To compute a Padé approximation of H(s) using: • A first-order approximation for the 1 second and 3 second delays • A second-order approximation for the 7 second delay, 2-55 2 LTI Models type pade(H,[],[],[1 1;2 1]) where H is the TF representation of H ( s ) defined in the “Distillation Column Example” on page 2-47. This command produces a rational transfer function. Transfer function from input "R" to output... –12.8 s + 25.6 Xd: --------------------16.7 s^2 + 34.4 s + 2 Xb: 6.6 s^2 – 5.657 s + 1.616 --------------------------------------10.9 s^3 + 10.34 s^2 + 3.527 s + 0.2449 Transfer function from input "S" to output... 18.9 s – 12.6 Xd: ---------------------21 s^2 + 15 s + 0.6667 Xb: 2-56 19.4 s – 12.93 -------------------------14.4 s^2 + 10.6 s + 0.6667 Simulink Block for LTI Systems Simulink Block for LTI Systems You can incorporate LTI objects into Simulink diagrams using the LTI System block shown below. This mask is linked to an LTI block in a Simulink diagram. Double-click on the block in your Simulink diagram to display or modify model information. The LTI System block can be accessed either by typing ltiblock at the MATLAB prompt or by selecting Control System Toolbox from the Blocksets and Toolboxes section of the main Simulink library. The LTI System block consists of the dialog box shown on the right in the figure above. In the editable text box labeled LTI system variable, enter either the variable name of an LTI object located in the MATLAB workspace (for example, sys) or a MATLAB expression that evaluates to an LTI object (for example, tf(1,[1 1])). The LTI System block accepts both continuous and discrete LTI objects in either transfer function, zero-pole-gain, or state-space form. Simulink converts the model to its state-space equivalent prior to initializing the simulation. Use the editable text box labeled Initial states to enter an initial state vector for state-space models. The concept of “initial state” is not well-defined for 2-57 2 LTI Models transfer functions or zero-pole-gain models, as it depends on the choice of state coordinates used by the realization algorithm. As a result, you cannot enter nonzero initial states when you supply TF or ZPK models to LTI blocks in a Simulink diagram. Note: • For MIMO systems, the input delays stored in the LTI object must be either all positive or all zero. • LTI blocks in a Simulink diagram cannot be used for FRD models or LTI arrays. 2-58 References References [1] Dorf, R.C. and R.H. Bishop, Modern Control Systems, Addison-Wesley, Menlo Park, CA, 1998. [2] Wood, R.K. and M.W. Berry, “Terminal Composition Control of a Binary Distillation Column,” Chemical Engineering Science, 28 (1973), pp. 1707-1717. 2-59 2 LTI Models 2-60 3 Operations on LTI Models Introduction . . . . . . . . . . . . . . . . . . . . 3-2 Precedence and Property Inheritance . . . . . . . . 3-3 Extracting and Modifying Subsystems . . Referencing FRD Models Through Frequencies Referencing Channels by Name . . . . . . . Resizing LTI Systems . . . . . . . . . . . . . . . . . . . . . . . . . . . . . . . . . . . 3-5 3-7 3-8 3-9 Arithmetic Operations . . . Addition and Subtraction . . . Multiplication . . . . . . . . Inversion and Related Operations Transposition . . . . . . . . Pertransposition . . . . . . . Delays and Model Operations . . . . . . . . . . . . . . . . . . . . . . . . . . . . . . . . . . . . . . . . . . . 3-11 3-11 3-13 3-13 3-14 3-14 3-15 . . . . . . . . . . . . . . . . . . . . . . . . . . . . . . . . . . . . . . . . . . Model Interconnection Functions . . . . . . . . . . 3-16 Concatenation of LTI Models . . . . . . . . . . . . . . 3-17 Feedback and Other Interconnection Functions . . . . . . 3-18 Continuous/Discrete Conversions of LTI Models Zero-Order Hold . . . . . . . . . . . . . . . . First-Order Hold . . . . . . . . . . . . . . . . Tustin Approximation . . . . . . . . . . . . . . Tustin with Frequency Prewarping . . . . . . . . Matched Poles and Zeros . . . . . . . . . . . . Discretization of Systems with Delays . . . . . . . Delays and Continuous/Discrete Model Conversions . . . . . . . . . . . . . . . . . . 3-20 . 3-20 . 3-22 . 3-22 . 3-23 . 3-23 . 3-24 . 3-25 Resampling of Discrete-Time Models . . . . . . . . . 3-27 References . . . . . . . . . . . . . . . . . . . . . 3-28 3 Operations on LTI Models Introduction You can perform basic matrix operations such as addition, multiplication, or concatenation on LTI models. Such operations are “overloaded,” which means that they use the same syntax as they do for matrices, but are adapted so as to apply to the LTI model context. These overloaded operations and their interpretation in this context are discussed in this chapter. You can read about discretization methods in this chapter as well. The following topics and operations on LTI models are covered in this chapter: • Precedence and Property Inheritance • Extracting and Modifying Subsystems • Arithmetic Operations • Model Interconnection Functions • Continuous/Discrete-Time Conversions of LTI Models • Resampling of Discrete-Time Models These operations can be applied to LTI models of different types. As a result, before discussing operations on LTI models, we discuss model type precedence and how LTI model properties are inherited when models are combined using these operations. To read about how you can apply these operations to arrays of LTI models, see “Operations on LTI Arrays” on page 4-25. To read about the available functions with which you can analyze LTI models, see Chapter 5, “Model Analysis Tools,” 3-2 Precedence and Property Inheritance Precedence and Property Inheritance You can apply operations to LTI models of different types. The resulting type is then determined by the rules discussed in “Precedence Rules” on page 2-5. For example, if sys1 is a transfer function and sys2 is a state-space model, then the result of their addition sys = sys1 + sys2 is a state-space model, since state-space models have precedence over transfer function models. To supersede the precedence rules and force the result of an operation to be a given type, for example, a transfer function (TF), you can either: • Convert all operands to TF before performing the operation • Convert the result to TF after performing the operation Suppose, in the above example, you want to compute the transfer function of sys. You can either use a priori conversion of the second operand sys = sys1 + tf(sys2); or a posteriori conversion of the result sys = tf(sys1 + sys2) Note: These alternatives are not equivalent numerically; computations are carried out on transfer functions in the first case, and on state-space models in the second case. Another issue is property inheritance, that is, how the operand property values are passed on to the result of the operation. While inheritance is partly operation-dependent, some general rules are summarized below: • In operations combining discrete-time LTI models, all models must have identical or unspecified (sys.Ts = –1) sample times. Models resulting from such operations inherit the specified sample time, if there is one. • Most operations ignore the Notes and Userdata properties. 3-3 3 Operations on LTI Models • In general, when two LTI models sys1 and sys2 are combined using operations such as +, *, [,], [;], append, and feedback, the resulting model inherits its I/O names and I/O groups from sys1 and sys2. However, conflicting I/O names or I/O groups are not inherited. For example, the InputName property for sys1 + sys2 is left unspecified if sys1 and sys2 have different InputName property values. • A model resulting from operations on TF or ZPK models inherits its Variable property value from the operands. Conflicts are resolved according the following rules: - For continuous-time models, 'p' has precedence over 's'. - For discrete-time models, 'z^–1' has precedence over 'q' and 'z', while 'q' has precedence over 'z'. 3-4 Extracting and Modifying Subsystems Extracting and Modifying Subsystems Subsystems relate subsets of the inputs and outputs of a system. The transfer matrix of a subsystem is a submatrix of the system transfer matrix. For example, if sys is a system with two inputs, three outputs, and I/O relation y = Hu then H ( 3, 1 ) gives the relation between the first input and third output. y 3 = H ( 3,1 ) u 1 Accordingly, we use matrix-like subindexing to extract this subsystem. SubSys = sys(3,1) The resulting subsystem SubSys is an LTI model of the same type as sys, with its sample time, time delay, I/O name, and I/O group property values inherited from sys. For example, if sys has an input group named controls consisting of channels one, two, and three, then SubSys also has an input group named controls with the first channel of SubSys assigned to it. If sys is a state-space model with matrices a, b, c, d, the subsystem sys(3,1) is a state-space model with data a, b(:,1), c(3,:), d(3,1). Note: • In the expression sys(3,1), the first index selects the output channel while the second index selects the input channel. • When extracting a subsystem from a given state-space model, the resulting state-space model may not be minimal. Use the command sminreal to eliminate unnecessary states in the subsystem. You can use similar syntax to modify the LTI model sys. For example, sys(3,1) = NewSubSys redefines the I/O relation between the first input and third output, provided NewSubSys is a SISO LTI model. 3-5 3 Operations on LTI Models Note: • sys, the LTI model that has had a portion reassigned, retains its original model type (TF, ZPK, SS, or FRD) regardless of the model type of NewSubSys. • If NewSubSys is an FRD model, then sys must also be an FRD model. Furthermore, their frequencies must match. • Subsystem assignment does not reassign any I/O names or I/O group names of NewSubSys that are already assigned to NewSubSys. • Reassigning parts of a MIMO state-space model generally increases its order. Other standard matrix subindexing extends to LTI objects as well. For example, sys(3,1:2) extracts the subsystem mapping the first two inputs to the third output. sys(:,1) selects the first input and all outputs, and sys([1 3],:) extracts a subsystem with the same inputs, but only the first and third outputs. For example, consider the two-input/two-output transfer function 1 ----------------s + 0.1 .T ( s ) = s–1 --------------------------2 s + 2s + 2 3-6 0 1 --s Extracting and Modifying Subsystems To extract the transfer function T 11 ( s ) from the first input to the first output, type T(1,1) Transfer function: 1 ------s + 0.1 Next reassign T 11 ( s ) to 1 ⁄ ( s + 0.5 ) and modify the second input channel of T by typing T(1,1) = tf(1,[1 0.5]); T(:,2) = [ 1 ; tf(0.4,[1 0]) ] Transfer function from input 1 to output... 1 #1: ------s + 0.5 #2: s – 1 ------------s^2 + 2 s + 2 Transfer function from input 2 to output... #1: 1 #2: 0.4 --s Referencing FRD Models Through Frequencies You can extract subsystems from FRD models, as you do with other LTI model types, by indexing into input and output (I/O) dimensions. You can also extract subsystems by indexing into the frequencies of an FRD model. To index into the frequencies of an FRD model, use the string 'Frequency' (or any abbreviation, such as, 'freq', as long as it does not conflict with existing 3-7 3 Operations on LTI Models I/O channel or group names) as a keyword. There are two ways you can specify FRD models using frequencies: • Using integers to index into the frequency vector of the FRD model • Using a Boolean (logical) expression to specify desired frequency points in an FRD model For example, if sys is an FRD model with five frequencies, (e.g., sys.Frequency=[1 1.1 1.2 1.3 1.4]), then you can create a new FRD model sys2 by indexing into the frequencies of sys as follows. sys2 = sys('frequency', 2:3); sys2.Frequency ans = 1.1000 1.2000 displays the second and third entries in the frequency vector. Similarly, you can use logical indexing into the frequencies. sys2 = sys('frequency',sys.Frequency >1.0 & sys.Frequency <1.15); sys2.freq ans = 1.1000 You can also combine model extraction through frequencies with indexing into the I/O dimensions. For example, if sys is an FRD model with two inputs, two outputs, and frequency vector [2.1 4.2 5.3], with sys.Units specified in rad/s, then sys2 = sys(1,2,'freq',1) specifies sys2 as a SISO FRD model, with one frequency data point, 2.1 rad/s. Referencing Channels by Name You can also extract subsystems using I/O group or channel names. For example, if sys has an input group named noise, consisting of channels two, four, and five, then sys(1,'noise') 3-8 Extracting and Modifying Subsystems is equivalent to sys(1,[2 4 5] Similarly, if pressure is the name assigned to an output channel of the LTI model sys, then sys('pressure',1) = tf(1, [1 1]) reassigns the subsystem from the first input of sys to the output labeled pressure. You can reference a set of channels by input or output name by using a cell array of strings for the names. For example, if sys has one output channel named pressure and one named temperature, then these two output channels can be referenced using sys({'pressure','temperature'}) Resizing LTI Systems Resizing a system consists of adding or deleting inputs and/or outputs. To delete the first two inputs, simply type sys(:,1:2) = [] In deletions, at least one of the row/column indexes should be the colon (:) selector. To perform input/output augmentation, you can proceed by concatenation or subassignment. Given a system sys with a single input, you can add a second input using sys = [sys,h]; or, equivalently, using sys(:,2) = h; where h is any LTI model with one input, and the same number of outputs as sys. There is an important difference between these two options: while concatenation obeys the precedence rules (see page 2-5), subsystem assignment does not alter the model type. So, if sys and h are TF and SS objects, respectively, the first statement produces a state-space model, and the second statement produces a transfer function. 3-9 3 Operations on LTI Models For state-space models, both concatenation and subsystem assignment increase the model order because they assume that sys and h have independent states. If you intend to keep the same state matrix and merely update the input-to-state or state-to-output relations, use set instead and modify the corresponding state-space data directly. For example, sys = ss(a,b1,c,d1) set(sys,'b',[b1 b2],'d',[d1 d2]) adds a second input to the state-space model sys by appending the B and D matrices. You should simultaneously modify both matrices with a single set command. Indeed, the statements sys.b = [b1 b2] and set(sys,'b',[b1 b2]) cause an error because they create invalid intermediate models in which the B and D matrices have inconsistent column dimensions. 3-10 Arithmetic Operations Arithmetic Operations You can apply almost all arithmetic operations to LTI models, including those shown below. Operation Description + Addition – Subtraction * Multiplication / Right matrix divide \ Left matrix divide inv Matrix inversion ' Pertransposition .' Transposition ^ Powers of an LTI model (as in s^2) To understand how these operations work on LTI models, it’s useful to keep in mind the matrix analogy for systems discussed in “Viewing LTI Systems As Matrices” on page 2-5. Addition and Subtraction As mentioned in “Viewing LTI Systems As Matrices” on page 2-5, adding LTI models is equivalent to connecting them in parallel. Specifically, the LTI model sys = sys1 + sys2 3-11 3 Operations on LTI Models represents the parallel interconnection shown below. sys1 y1 + u y + sys2 y2 sys If sys1 and sys2 are two state-space models with data A 1, B 1, C 1, D 1 and A 2, B 2, C 2, D 2 , the state-space data associated with sys1 + sys2 is A1 0 0 A2 , B1 B2 , C1 C 2 , D1 + D2 Scalar addition is also supported and behaves as follows: if sys1 is MIMO and sys2 is SISO, sys1 + sys2 produces a system with the same dimensions as sys1 whose ijth entry is sys1(i,j) + sys2. Similarly, the subtraction of two LTI models sys = sys1 – sys2 is depicted by the following block diagram. sys1 y1 + u – sys2 y2 sys 3-12 y Arithmetic Operations Multiplication Multiplication of two LTI models connects them in series. Specifically, sys = sys1 * sys2 returns an LTI model sys for the series interconnection shown below. v u sys2 sys1 y Notice the reverse orders of sys1 and sys2 in the multiplication and block diagram. This is consistent with the way transfer matrices are combined in a series connection: if sys1 and sys2 have transfer matrices H 1 and H 2 , then y = H 1 v = H 1 ( H2 u ) = ( H1 × H2 ) u For state-space models sys1 and sys2 with data A 1, B 1, C 1, D 1 and A 2, B 2, C 2, D 2 , the state-space data associated with sys1*sys2 is A1 B1 C2 0 A2 B1 D2 , B2 , C1 D1 C2 , D1 D2 Finally, if sys1 is MIMO and sys2 is SISO, then sys1*sys2 or sys2*sys1 is interpreted as an entry-by-entry scalar multiplication and produces a system with the same dimensions as sys1, whose ijth entry is sys1(i,j)*sys2. Inversion and Related Operations Inversion of LTI models amounts to inverting the following input/output relationship. y = H u → –1 u = H y This operation is defined only for square systems (that is, systems with as many inputs as outputs) and is performed using inv(sys) 3-13 3 Operations on LTI Models The resulting inverse model is of the same type as sys. Related operations include: • Left division sys1\sys2, which is equivalent to inv(sys1)*sys2 • Right division sys1/sys2, which is equivalent to sys1*inv(sys2) For a state-space model sys with data A, B, C, D , inv(sys) is defined only when D is a square invertible matrix, in which case its state-space data is –1 A – BD C , BD –1 , –1 –D C , D –1 Transposition You can transpose an LTI model sys using sys.' This is a literal operation with the following effect: • For TF models (with input arguments, num and den), the cell arrays num and den are transposed. • For ZPK models (with input arguments, z, p, and k), the cell arrays, z and p, and the matrix k are transposed. • For SS models (with model data A, B, C, D ), transposition produces the state-space model AT, CT, BT, DT. • For FRD models (with complex frequency response matrix Response), the matrix of frequency response data at each frequency is transposed. Pertransposition For a continuous-time system with transfer function H ( s ) , the pertransposed system has the transfer function G ( s ) = [ H ( –s ) ]T The discrete-time counterpart is –1 G(z ) = [H(z )] T Pertransposition of an LTI model sys is performed using sys' 3-14 Arithmetic Operations You can use pertransposition to obtain the Hermitian (conjugate) transpose of the frequency response of a given system. The frequency response of the pertranspose of H ( s ), G ( s ) = [ H ( – s ) ] T , is the Hermitian transpose of the frequency response of H ( s ): G ( jw ) = H ( jw ) H . To obtain the Hermitian transpose of the frequency response of a system sys over a frequency range specified by the vector w, type freqresp(sys', w); Operations on State-Space Models with Delays When you apply operations such as +,*,\,/,[], to state-space models, all or part of the I/O delay matrix of the resulting model is absorbed into the input and output delay vectors when it is possible to reduce the total number of I/O delays. The resulting model has a minimum number of such delays. 3-15 3 Operations on LTI Models Model Interconnection Functions The Control System Toolbox provides a number of functions to help with the model building process. These include model interconnection functions to perform I/O concatenation ([,], [;], and append), general parallel and series connections (parallel and series), and feedback connections (feedback and lft). These functions are useful to model open- and closed-loop systems. 3-16 Interconnection Operator Description [,] Concatenates horizontally [;] Concatenates vertically append Appends models in a block diagonal configuration augstate Augments the output by appending states connect Forms an SS model from a block diagonal LTI object for an arbitrary interconnection matrix feedback Forms the feedback interconnection of two models lft Produces the LFT interconnection (Redheffer Star product) of two models parallel Forms the generalized parallel connection of two models series Forms the generalized series connection of two models Model Interconnection Functions Concatenation of LTI Models LTI model concatenation is done in a manner similar to the way you concatenate matrices in MATLAB, using sys = [sys1 , sys2] % horizontal concatenation sys = [sys1 ; sys2] % vertical concatenation sys = append(sys1,sys2)% block diagonal appending In I/O terms, horizontal and vertical concatenation have the following block-diagram interpretations (with H 1 and H 2 denoting the transfer matrices of sys1 and sys2). H1 u1 H1 y1 H2 y2 + + u2 y u H2 y = H1 , H 2 u1 y1 u2 y2 Horizontal Concatenation = H1 H2 u Vertical Concatenation You can use concatenation as an easy way to create MIMO transfer functions or zero-pole-gain models. For example, H = [ tf(1,[1 0]) 1 ; 0 tf([1 –1],[1 1]) ] specifies H(s) = 1 --s 1 0 s–1 -----------s+1 3-17 3 Operations on LTI Models Use append(sys1,sys2) to specify the block-decoupled LTI model interconnection. u1 sys1 y1 sys1 0 0 sys2 u2 sys2 y2 Appended Models Transfer Function See append on page 11-12 for more information on this command. Feedback and Other Interconnection Functions The following LTI model interconnection functions are useful for specifying closed- and open-loop model configurations: • feedback puts two LTI models with compatible dimensions in a feedback configuration. • series connects two LTI models in series. • parallel connects two LTI models in parallel. • lft performs the Redheffer star product on two LTI models. • connect works with append to apply an arbitrary interconnection scheme to a set of LTI models. 3-18 Model Interconnection Functions For example, if sys1 has m inputs and p outputs, while sys2 has p inputs and m outputs, then the negative feedback configuration of these two LTI models + u sys1 y – sys2 is realized with feedback(sys1,sys2) This specifies the LTI model with m inputs and p outputs whose I/O map is ( I + sys1 ⋅ sys2 ) – 1 sys1 See Chapter 11, “Reference,” for more information on feedback, series, parallel, lft, and connect. 3-19 3 Operations on LTI Models Continuous/Discrete Conversions of LTI Models The function c2d discretizes continuous-time TF, SS, or ZPK models. Conversely, d2c converts discrete-time TF, SS, or ZPK models to continuous time. Several discretization/interpolation methods are supported, including zero-order hold (ZOH), first-order hold (FOH), Tustin approximation with or without frequency prewarping, and matched poles and zeros. The syntax sysd = c2d(sysc,Ts); sysc = d2c(sysd); % Ts = sampling period in seconds performs ZOH conversions by default. To use alternative conversion schemes, specify the desired method as an extra string input: sysd = c2d(sysc,Ts,'foh'); % use first-order hold sysc = d2c(sysd,'tustin'); % use Tustin approximation The conversion methods and their limitations are discussed next. Zero-Order Hold Zero-order hold (ZOH) devices convert sampled signals to continuous-time signals for analyzing sampled continuous-time systems. The zero-order-hold discretization H d ( z ) of a continuous-time LTI model H ( s ) is depicted in the following block diagram. y(t) u(t) u[ k ] ZOH H(s) y[k] Ts Hd ( z ) The ZOH device generates a continuous input signal u(t) by holding each sample value u[k] constant over one sample period. 3-20 Continuous/Discrete Conversions of LTI Models u( t ) = u[ k ] , kT s ≤ t ≤ ( k + 1 )T s The signal u ( t ) is then fed to the continuous system H ( s ) , and the resulting output y ( t ) is sampled every T s seconds to produce y [ k ] . Conversely, given a discrete system H d ( z ) , the d2c conversion produces a continuous system H ( s ) whose ZOH discretization coincides with H d ( z ) . This inverse operation has the following limitations: • d2c cannot operate on LTI models with poles at z = 0 when the ZOH is used. • Negative real poles in the z domain are mapped to pairs of complex poles in the s domain. As a result, the d2c conversion of a discrete system with negative real poles produces a continuous system with higher order. The next example illustrates the behavior of d2c with real negative poles. Consider the following discrete-time ZPK model. hd = zpk([],–0.5,1,0.1) Zero/pole/gain: 1 ------(z+0.5) Sampling time: 0.1 Use d2c to convert this model to continuous-time hc = d2c(hd) and you get a second-order model. Zero/pole/gain: 4.621 (s+149.3) --------------------(s^2 + 13.86s + 1035) Discretize the model again c2d(hc,0.1) 3-21 3 Operations on LTI Models and you get back the original discrete-time system (up to canceling the pole/zero pair at z=–0.5): Zero/pole/gain: (z+0.5) --------(z+0.5)^2 Sampling time: 0.1 First-Order Hold First-order hold (FOH) differs from ZOH by the underlying hold mechanism. To turn the input samples u [ k ] into a continuous input u ( t ) , FOH uses linear interpolation between samples. t – kT s u ( t ) = u [ k ] + ------------------ ( u [ k + 1 ] – u [ k ] ) , Ts kT s ≤ t ≤ ( k + 1 )T s This method is generally more accurate than ZOH for systems driven by smooth inputs. Due to causality constraints, this option is only available for c2d conversions, and not d2c conversions. Note: This FOH method differs from standard causal FOH and is more appropriately called triangle approximation (see [2], p. 151). It is also known as ramp-invariant approximation because it is distortion-free for ramp inputs. Tustin Approximation The Tustin or bilinear approximation uses the approximation z = e sT s 1 + sT s ⁄ 2 ≈ -------------------------1 – sT s ⁄ 2 to relate s-domain and z-domain transfer functions. In c2d conversions, the discretization H d ( z ) of a continuous transfer function H ( s ) is derived by 3-22 Continuous/Discrete Conversions of LTI Models H d ( z ) = H ( s' ) , where 2 z–1 s' = ------ -----------Ts z + 1 Similarly, the d2c conversion relies on the inverse correspondence H ( s ) = H d ( z' ), where 1 + sT s ⁄ 2 z' = -------------------------1 – sT s ⁄ 2 Tustin with Frequency Prewarping This variation of the Tustin approximation uses the correspondence ω z–1 s' = --------------------------------- -----------tan ( ωT s ⁄ 2 ) z + 1 H d ( z ) = H ( s' ) , This change of variable ensures the matching of the continuous- and discrete-time frequency responses at the frequency ω . H ( jω ) = H d ( e jωT s ) Matched Poles and Zeros The matched pole-zero method applies only to SISO systems. The continuous and discretized systems have matching DC gains and their poles and zeros correspond in the transformation z = e sT s See [2], p. 147 for more details. 3-23 3 Operations on LTI Models Discretization of Systems with Delays You can also use c2d to discretize SISO or MIMO continuous-time models with time delays. If Ts is the sampling period used for discretization: • A delay of tau seconds in the continuous-time model is mapped to a delay of k sampling periods in the discretized model, where k = fix(tau/Ts). • The residual fractional delay tau – k*Ts is absorbed into the coefficients of the discretized model (for the zero-order-hold and first-order-hold methods only). For example, to discretize the transfer function H(s) = e – 0.25s 10 -----------------------------2 s + 3s + 10 using zero-order hold on the input, and a 10 Hz sampling rate, type h = tf(10,[1 3 10],'inputdelay',0.25); hd = c2d(h,0.1) This produces the discrete-time transfer function Transfer function: 0.01187 z^2 + 0.06408 z + 0.009721 z^(–2) * ---------------------------------z^3 – 1.655 z^2 + 0.7408 z Sampling time: 0.1 Here the input delay in H ( s ) amounts to 2.5 times the sampling period of 0.1 seconds. Accordingly, the discretized model hd inherits an input delay of two sampling periods, as confirmed by the value of hd.inputdelay. The residual half-period delay is factored into the coefficients of hd by the discretization algorithm. 3-24 Continuous/Discrete Conversions of LTI Models The step responses of the continuous and discretized models are compared in the figure below. This plot was produced by the command step(h,'--',hd,'-') Note: The Tustin and matched pole/zero methods are accurate only for delays that are integer multiples of the sampling period. It is therefore preferable to use the zoh and foh discretization methods for models with delays. Delays and Continuous/Discrete Model Conversions When you apply c2d and d2c to state-space models, all or part of the I/O delay matrix of the resulting model is absorbed into the input and output delay 3-25 3 Operations on LTI Models vectors when it is possible to reduce the total number of I/O delays. The resulting model has a minimum number of such delays. 3-26 Resampling of Discrete-Time Models Resampling of Discrete-Time Models You can resample a discrete-time TF, SS, or ZPK model sys1 by typing sys2 = d2d(sys1,Ts) The new sampling period Ts does not have to be an integer multiple of the original sampling period. For example, typing h1 = tf([1 0.4],[1 –0.7],0.1); h2 = d2d(h1,0.25); resamples h1 at the sampling period of 0.25 seconds, rather than 0.1 seconds. You can compare the step responses of h1 and h2 by typing step(h1,'--',h2,'-') The resulting plot is shown on the figure below (h1 is the dashed line). 3-27 3 Operations on LTI Models References [1] Åström, K.J. and B. Wittenmark, Computer-Controlled Systems: Theory and Design, Prentice-Hall, 1990, pp. 48–52. [2] Franklin, G.F., J.D. Powell, and M.L. Workman, Digital Control of Dynamic Systems, Second Edition, Addison-Wesley, 1990. 3-28 4 Arrays of LTI Models Introduction . . . . . . . . . . . . . . . When to Collect a Set of Models in an LTI Array . Restrictions for LTI Models Collected in an Array Where to Find Information on LTI Arrays . . . . . . . . . . . . . . . . . . . . . . . 4-2 4-2 4-2 4-3 The Concept of an LTI Array . . . . . . . . . . . . 4-4 Higher Dimensional Arrays of LTI Models . . . . . . . . 4-6 Dimensions, Size, and Shape of an LTI Array . . . . . 4-7 size and ndims . . . . . . . . . . . . . . . . . . . . 4-9 reshape . . . . . . . . . . . . . . . . . . . . . . 4-11 Building LTI Arrays . . . . . . . . . Generating LTI Arrays Using rss . . . . . Building LTI Arrays Using for Loops . . . Building LTI Arrays Using the stack Function Building LTI Arrays Using tf, zpk, ss, and frd . . . . . . . . . . . . . . . . . . . . . . . . . . . . . . . . . . . 4-12 4-12 4-12 4-15 4-17 Indexing Into LTI Arrays . . . . . . . Accessing Particular Models in an LTI Array Extracting LTI Arrays of Subsystems . . . Reassigning Parts of an LTI Array . . . . Deleting Parts of an LTI Array . . . . . . . . . . . . . . . . . . . . . . . . . . . . . . . . . . . . . . . . . 4-20 4-20 4-21 4-22 4-23 Operations on LTI Arrays . . . . . . Example: Addition of Two LTI Arrays . . Dimension Requirements . . . . . . . Special Cases for Operations on LTI Arrays Other Operations on LTI Arrays . . . . . . . . . . . . . . . . . . . . . . . . . . . . . . . . . . . . . . . 4-25 4-26 4-27 4-27 4-30 . . . . . 4 Arrays of LTI Models Introduction You can use LTI arrays to collect a set of LTI models into a single MATLAB variable. You then use this variable to manipulate or analyze the entire collection of models in a vectorized fashion. You access the individual models in the collection through indexing rather than by individual model names. LTI arrays extend the concept of single LTI models in a similar way to how multidimensional arrays extend two-dimensional matrices in MATLAB (see Chapter 12, “Multidimensional Arrays” in Using MATLAB). Additionally, when you think about LTI arrays, it is useful to keep in mind the matrix interpretation of LTI models developed in “Viewing LTI Systems As Matrices” on page 2-5. When to Collect a Set of Models in an LTI Array You can use LTI arrays to represent: • A set of LTI models arising from the linearization of a nonlinear system at several operating points • A collection of transfer functions that depend on one or more parameters • A set of LTI models arising from several system identification experiments applied to one plant • A set of gain-scheduled LTI controllers • A list of LTI models you want to collect together under the same name Restrictions for LTI Models Collected in an Array For each model in an LTI array, the following properties must be the same: • The number of inputs and outputs • The sample time, for discrete-time models • The I/O names and I/O groups Note: You cannot specify Simulink LTI blocks with LTI arrays. 4-2 Introduction Where to Find Information on LTI Arrays The next two sections give examples that illustrate the concept of an LTI array, its dimensions, and size. To read about how to build an LTI array, go to “Building LTI Arrays” on page 4-12. The remainder of the chapter is devoted to indexing and operations on LTI Arrays. You can also apply the analysis functions in the Control System Toolbox to LTI arrays. See Chapter 5, “Model Analysis Tools,” for more information on these functions. You can also view response plots of LTI arrays with the LTI Viewer. For information, see Chapter 6, “The LTI Viewer.” 4-3 4 Arrays of LTI Models The Concept of an LTI Array To visualize the concept of an LTI array, consider the set of five transfer function models shown below. In this example, each model has two inputs and two outputs. They differ by parameter variations in the individual model components. 1.1 -----------s+1 0 1.3 ----------------s + 1.1 0 1.11 ----------------s + 1.2 0 1.15 ----------------s + 1.3 0 1.09 ----------------s + 1.4 0 0 1 -----------s+5 0 1 ----------------s + 5.2 0 1 ----------------s + 5.4 0 1 ----------------s + 5.6 0 1 ----------------s + 5.8 Figure 4-1: Five LTI Models to be Collected in an LTI Array This LTI array embodies a 1.09 ----------------0 1-by-5 list of models. s + 1.4 1.15 ----------------0 1 s + 1.3 0 ----------------s + 5.8 1.11 1 ----------------- 00 ---------------s + 1.2 s + 5.6 1.3 1 ----------------0 ----------------0 1.1s + 1.1 s + 5.4 ------------ 0 1 s+1 0 ----------------1 s + 5.2 Each element of the 0 -----------s+5 LTI array is a model. Figure 4-2: An LTI Array Containing These Five Models 4-4 The Concept of an LTI Array Just as you might collect a set of two-by-two matrices in a multidimensional array, you can collect this set of five transfer function models as a list in an LTI array under one variable name, say, sys. Each element of the LTI array is an LTI model. Individual models in the LTI array sys are accessed via indexing. The general form for the syntax you use to access data in an LTI array is sys(Outputs,Inputs,Models) The first index selects the output channels. The second index selects the input channels. The remaining indices select particular models in the LTI array by their array coordinates. For example, you can access the third model in sys with sys(:,:,3). The following illustrates how you can use indexing to select models or their components from sys. 1.09 ----------------0 1.15 s + 1.4 ----------------0 s + 1.3 1.11 1 ----------------- 00 ---------------s + 1.2 1 s + 5.8 1.3 ---------------0 ----------------0 1s + 5.6 s + 1.1 1.1 ---------------------------- 0 0 s + 5.4 s+1 1 ----------------0 1 s + 5.2 0 -----------s+5 1.11 ----------------s + 1.2 0 0 1 ----------------s + 5.4 sys(2,2,3) selects the (2,2) entry of the third model in the array. sys(:,:,3) selects the third model in the array. Figure 4-3: Using Indices to Select Models and Their Components See “Indexing Into LTI Arrays” on page 4-20 for more information on indexing. 4-5 4 Arrays of LTI Models Higher Dimensional Arrays of LTI Models You can also collect a set of models in a two-dimensional array. The following diagram illustrates a 2-by-3 array of six, two-output, one-input models called m2d. m2d(:,:,1,3) Each entry in this 2-by-3 array of models is a two-output, one-input transfer function. 3.42 -------------------s + 2.84 7.29 m2d(:,:,1,1) m2d(:,:,2,1) 3.36 ----------------s + 2.9 7.23 m2d(:,:,1,2) m2d(:,:,2,2 ) 3.4 -------------------s + 2.86 7.27 m2d(:,:,1,3) m2d(:,:,2,3) m2d(:,:,1,3) extracts the model in the (1,3) position of the array. 3.45 -------------------s + 2.81 7.32 Figure 4-4: m2d: A 2-by-3 Array of Two-Output, One-Input Models More generally, you can organize models into a 3-D or higher-dimensional array, in much the same way you arrange numerical data into multidimensional arrays (see Chapter 12, “Multidimensional Arrays” in Using MATLAB). 4-6 Dimensions, Size, and Shape of an LTI Array Dimensions, Size, and Shape of an LTI Array The dimensions and size of a single LTI model are determined by the output and input channels. An array of LTI models has additional quantities that determine its dimensions, size, and shape. There are two sets of dimensions associated with LTI arrays: • The I/O dimensions—the output dimension and input dimension common to all models in the LTI array • The array dimensions—the dimensions of the array of models itself The size of the LTI array is determined by: • The lengths of the I/O dimensions—the number of outputs (or inputs) common to all models in the LTI array • The length of each array dimension—the number of models along that array dimension 4-7 4 Arrays of LTI Models . The next figure illustrates the concepts of dimension and size for the LTI array m2d, a 2-by-3 array of one-input, two-output transfer function models. t ar r ay di m ens ion is 2 The length of the second array dimension is 3. m2d(:,:,1,2) m2d(:,:,1,3) m2d(:,:,2,2 ) m2d(:,:,2,1) m2d(:,:,2,3) T he le n gt h of th e fi rs m2d(:,:,1,1) 3.4 -------------------s + 2.86 7.27 3.45 -------------------s + 2.81 7.32 m2d(:,:,2,3) Output dimension (length 2) 3.36 ----------------s + 2.9 7.23 3.45 -------------------s + 2.81 7.32 Input dimension (length 1) Figure 4-5: Dimensions and Size of m2d, an LTI Array You can load this sample LTI array into your workspace by typing load LTIexamples size(m2d) 2x3 array of continuous-time transfer functions Each transfer function has 2 outputs and 1 input. According to the matrix analogy in “Viewing LTI Systems As Matrices” on page 2-5, the I/O dimensions correspond to the row and column dimensions of the transfer matrix. The two I/O dimensions are both of length 1 for SISO models. For MIMO models the lengths of these dimensions are given by the number of outputs and inputs of the model. 4-8 Dimensions, Size, and Shape of an LTI Array Five related quantities are pertinent to understanding the array dimensions: • N, the number of models in the LTI array • K, the number of array dimensions • S 1 S 2 …S K, the list of lengths of the array dimensions - S i is the number of models along the i th dimension. • S 1 – by – S 2 – by – … – by – S K , the configuration of the models in the array - The configuration determines the shape of the array. - The product of these integers S 1 × S 2 × … × S K is N. In the example model m2d,: • The length of the output dimension, the first I/O dimension, is 2, since there are two output channels in each model. • The length of the input dimension, the second I/O dimension, is 1, since there is only one input channel in each model. • N, the number of models in the LTI array, is 6. • K, the number of array dimensions, is 2. • The array dimension lengths are [2 3]. • The array configuration is 2-by-3. size and ndims You can access the dimensions and shape of an LTI array using: • size to determine the lengths of each of the dimensions associated with an LTI array • ndims to determine the total number of dimensions in an LTI array When applied to an LTI array, size returns [Ny Nu S1 S2 ... Sk] where • Ny is the number of outputs common to all models in the LTI array. • Nu is the number of inputs common to all models in the LTI array. • S1 S2 ... Sk are the lengths of the array dimensions of a k-dimensional array of models. Si is the number of models along the ith array dimension. 4-9 4 Arrays of LTI Models Note: • By convention, a single LTI model is treated as a 1-by-1 array of models. For single LTI models, size returns only the I/O dimensions [Ny Nu]. • For LTI arrays, size always returns at least two array dimensions. For example, the size of a 2-by-1 LTI array in [Ny Nu 2 1] • size ignores trailing singleton dimensions beyond the second array dimension. For example, size returns [Ny Nu 2 3] for a 2-by-3-by-1-by-1 LTI array of models with Ny outputs and Nu inputs. • You can use the syntax size(sys,'order') to determine the number of states in an LTI array, sys. A multidimensional array is returned if sys is an SS model such that the numbers of states in each model in sys are not the same. The function ndims returns the total number of dimensions in an LTI array: • 2, for single LTI models • 2 + p, for LTI arrays, where p (greater than 2) is the number of array dimensions Note that ndims (sys) = length(size(sys)) To see how these work on the sample 2-by-3 LTI array m2d of two-output, one-input models, type load LTIexamples s = size(m2d) s = 2 4-10 1 2 3 Dimensions, Size, and Shape of an LTI Array Notice that size returns a vector whose entries correspond to the length of each of the four dimensions of m2d: two outputs and one input in a 2-by-3 array of models. Type ndims(m2d) ans = 4 to see that there are indeed four dimensions attributed to this LTI array. reshape Use reshape to reorganize the arrangement (array configuration) of the models of an existing LTI array. For example, to arrange the models in an LTI Array sys as a w 1 × … × w p array, type reshape(sys,w1,...,wp) where w1,...,wp are any set of integers whose product is N, the number of models in sys. You can reshape the LTI array m2d into a 3-by-2, a 6-by-1, or a 1-by-6 array using reshape. For example, type load LTIexamples sys = reshape(m2d,6,1); size(sys) 6x1 array of continuous-time transfer functions Each transfer function has 2 outputs and 1 inputs. s = size(sys) s = 2 1 6 1 4-11 4 Arrays of LTI Models Building LTI Arrays There are several ways to build LTI arrays: • Using a for loop to assign each model in the array • Using stack to concatenate LTI models into an LTI array • Using tf, zpk, ss, or frd In addition, you can use the command rss to generate LTI arrays of random state-space models. Generating LTI Arrays Using rss A convenient way to generate arrays of state-space models with the same number of states in each model is to use rss. The syntax is rss(N,P,M,sdim1,...,sdimk) where • N is the number of states of each model in the LTI array. • P is the number of outputs of each model in the LTI array. • M is the number of inputs of each model in the LTI array. • sdim1,...,sdimk are the lengths of the array dimensions. For example, to create a 4-by-2 array of random state-space models with three states, one output, and one input, type sys = rss(3,2,1,4,2); size(sys) 4x2 array of continuous-time state-space models Each model has 2 outputs, 1 input, and 3 states. Building LTI Arrays Using for Loops Consider the following second-order SISO transfer function that depends on two parameters, ζ and ω ω2 . H ( s ) = -------------------------------------s 2 + 2ζωs + ω 2 4-12 Building LTI Arrays Suppose, based on measured input and output data, you estimate confidence intervals [ω 1,ω 2] , and [ζ 1,ζ 2] for each of the parameters, ω and ζ. All of the possible combinations of the confidence limits for these model parameter values give rise to a set of four SISO models. ω1 ω2 ω 12 ω 12 ζ 1 H 11 ( s ) = -------------------------------------------H ( s ) = -------------------------------------------12 s 2 + 2ζ 1 ω 1 s + ω 12 s 2 + 2ζ 2 ω 1 s + ω 12 ω 22 ω 22 ζ 2 H ( s ) = -------------------------------------------= -------------------------------------------H ( s ) 22 21 s 2 + 2ζ 2 ω 2 s + ω 22 s 2 + 2ζ 1 ω 2 s + ω 22 Figure 4-6: Four LTI Models Depending on Two Parameters You can arrange these four models in a 2-by-2 array of SISO transfer functions called H. ω1 ω2 ζ1 H(:,:,1,1) H(:,:,1,2) ζ2 H(:,:,2,1) H(:,:,2,2) Each entry of this 2-by-2 array is a SISO transfer function model. Figure 4-7: The LTI Array H Here, for i,j ∈ { 1, 2 } , H(:,:,i,j) represents the transfer function ω2 j ------------------------------------------------2 2 s + 2ζ i ω j s + ω j corresponding to the parameter values ζ = ζ i and ω = ω j . 4-13 4 Arrays of LTI Models The first two colon indices ( : ) select all I/O channels from the I/O dimensions of H. The third index of H refers to the first array dimension ( ζ), while the fourth index is for the second array dimension (ω). Suppose the limits of the ranges of values for ζ and ω are [0.66,0.76] and [1.2,1.5], respectively. Enter these at the command line. zeta = [0.66,0.75]; w = [1.2,1.5]; Since the four models have the same parametric structure, it’s convenient to use two nested for loops to construct the LTI array. for i = 1:2 for j = 1:2 H(:,:,i,j) = tf(w(j)^2,[1 2*zeta(i)*w(j) w(j)^2]); end end H now contains the four models in a 2-by-2 array. For example, to display the transfer function in the (1,2) position of the array, type H(:,:,1,2) Transfer function: 2.25 ------------------s^2 + 1.98 s + 2.25 4-14 Building LTI Arrays For the purposes of efficient computation, you can initialize an LTI array to zero, and then reassign the entire array to the values you want to specify. The general syntax for zero assignment of LTI arrays is Lengths of the output/input dimensions Lengths of the array dimensions sys = tf(zeros(Ny,Nu,S1,...,SK)) sys = zpk(zeros(Ny,Nu,S1,...,SK)) sys = ss(zeros(Ny,Nu,S1,...,SK,Nx)) sys = frd(zeros(Ny,Nu,Nf,S1,...,SK)) The number of frequency vectors in the FRD The maximum number of states in any model in the LTI array To initialize H in the above example to zero, type H = tf(zeros(1,1,2,2)); before you implement the nested for loops. Building LTI Arrays Using the stack Function Another way to build LTI arrays is using the function stack. This function operates on single LTI models as well as LTI arrays. It concatenates a list of LTI arrays or single LTI models only along the array dimension. The general syntax for stack is stack(Arraydim,sys1,sys2...) where • Arraydim is the array dimension along which to concatenate the LTI models or arrays. • sys1, sys2, ... are the LTI models or LTI arrays to be concatenated. 4-15 4 Arrays of LTI Models When you concatenate several models or LTI arrays along the jth array dimension, such as in stack(j,sys1,sys2,...,sysn) • The lengths of the I/O dimensions of sys1,...,sysn must all match. • The lengths of all but the jth array dimension of sys1,...,sysn must match. For example, if two TF models sys1 and sys2 have the same number of inputs and outputs, sys = stack(1,sys1,sys2) concatenates them into a 2-by-1 array of models. Note: • stack only concatenates along an array dimension, not an I/O dimension. • To concatenate LTI models or LTI arrays along an input or output dimension, use the bracket notation ([,] [;]). See “Model Interconnection Functions” on page 3-16 for more information on the use of bracket notation to concatenate models. See also “Special Cases for Operations on LTI Arrays” on page 4-27 for some examples of this type of concatenation of LTI arrays. Here’s an example of how to build the LTI array H using the function stack. % Set up the parameter vectors. zeta = [0.66,0.75]; w = [1.2,1.5]; % Specify the four % H11 = tf(w(1)^2,[1 H12 = tf(w(2)^2,[1 H21 = tf(w(1)^2,[1 H22 = tf(w(2)^2,[1 4-16 individual models with those parameters. 2*zeta(1)*w(1) 2*zeta(1)*w(2) 2*zeta(2)*w(1) 2*zeta(2)*w(2) w(1)^2]); w(2)^2]); w(1)^2]); w(2)^2]); Building LTI Arrays % Set up the LTI array using stack. COL1 = stack(1,H11,H21); % The first column of the 2-by-2 array COL2 = stack(1,H12,H22); % The second column of the 2-by-2 array H = stack(2, COL1, COL2); % Concatenate the two columns of models. Notice that this result is very different from the single MIMO LTI model returned by H = [H11,H12;H21,H22]; Building LTI Arrays Using tf, zpk, ss, and frd You can also build LTI arrays using the tf, zpk, ss, and frd constructors. You do this by using multidimensional arrays in the input arguments for these functions. Specifying Arrays of TF models tf For TF models, use sys = tf(num,den) where • Both num and den are multidimensional cell arrays the same size as sys (see “size and ndims” on page 4-9). • sys(i,j,n1,...,nK) is the (i, j) entry of the transfer matrix for the model located in the ( n 1, …, n K ) position of the array. • num(i,j,n1,...,nK) is a row vector representing the numerator polynomial of sys(i,j,n1,...,nK). • den(i,j,n1,...,nK) is a row vector representing denominator polynomial of sys(i,j,n1,...,nK). See “MIMO Transfer Function Models” on page 2-10 for related information on the specification of single TF models. Specifying Arrays of ZPK Models Using zpk For ZPK models, use sys = zpk(zeros,poles,gains) 4-17 4 Arrays of LTI Models where • Both zeros and poles are multidimensional cell arrays whose cell entries contain the vectors of zeros and poles for each I/O pair of each model in the LTI array. • gains is a multidimensional array containing the scalar gains for each I/O pair of each model in the array. • The dimensions (and their lengths) of zeros, poles, and gains, determine those of the LTI array, sys. Specifying Arrays of SS Models Using ss To specify arrays of SS models, use sys = ss(a,b,c,d) where a, b, c, and d are real-valued multidimensional arrays of appropriate dimensions. All models in the resulting array of SS models have the same number of states, outputs, and inputs. Note: You cannot use the ss constructor to build an array of state-space models with different numbers of states. Use stack to build such LTI arrays. The Size of LTI Array Data for SS Models The size of the model data for arrays of state-space models is summarized in the following table. Data 4-18 Size (Data) a N s N s S 1S 2 …S K b N s N u S 1 S 2 …S K c Ny Ns S 1 S 2 … SK d N y N u S 1 S 2 …S K Building LTI Arrays where • N s is the maximum of the number of states in each model in the array. • N u is the number of inputs in each model. • N y is the number of outputs in each model. • S 1, S 2, …, S K are the lengths of the array dimensions. Specifying Arrays of FRD Models Using frd To specify a K-dimensional array of p-output, m-input FRD models for which S 1, S 2, …, S K are the lengths of the array dimensions, use sys = frd(response,frequency,units) where • frequency is a real vector of n frequency data points common to all FRD models in the LTI array. • response is a p-by-m-by-n-by- S 1 -by- …-by- S K complex-valued multidimensional array. • units is the optional string specifying 'rad/s' or 'Hz'. Note that for specifying an LTI array of SISO FRD models, response can also be a multidimensional array of 1-by-n matrices whose remaining dimensions determine the array dimensions of the FRD. 4-19 4 Arrays of LTI Models Indexing Into LTI Arrays You can index into LTI arrays in much the same way as you would for multidimensional arrays to: • Access models • Extract subsystems • Reassign parts of an LTI array • Delete parts of an LTI array When you index into an LTI array sys, the indices should be organized according to the following format sys(Outputs, Inputs, n 1, …, n K ) where • Outputs are indices that select output channels. • Inputs are indices that select input channels. • n 1, …, nK are indices into the array dimensions that select one model or a subset of models in the LTI array. Note on Indexing into LTI Arrays of FRD models: For FRD models, the array indices can be followed by the keyword 'frequency' and some expression selecting a subset of the frequency points as in sys (outputs, inputs, n1,...,nk, 'frequency', SelectedFreqs) See “Referencing FRD Models Through Frequencies” on page 3-7 for details on frequency point selection in FRD models. Accessing Particular Models in an LTI Array To access any given model in an LTI array: • Use colon arguments (:,:) for the first two indices to select all I/O channels. • The remaining indices specify the model coordinates within the array. 4-20 Indexing Into LTI Arrays For example, if sys is a 5-by-2 array of state-space models defined by sys = rss(4,3,2,5,2); you can access (and display) the model located in the (3,2) position of the array sys by typing sys(:,:,3,2) If sys is a 5-by-2 array of 3-output, 2-input FRD models, with frequency vector [1,2,3,4,5], then you can access the response data corresponding to the middle frequency (3 rad/s), of the model in the (3,1) position by typing sys(:,:,3,1,'frequency',3.0) To access all frequencies of this model in the array, you can simply type sys(:,:,3,1) Single Index Referencing of Array Dimensions You can also access models using single index referencing of the array dimensions. For example, in the 5-by-2 LTI array sys above, you can also access the model located in the (3,2) position by typing sys(:,:,8) since this model is in the eighth position if you were to list the 10 models in the array by successively scanning through its entries along each of its columns. For more information on single index referencing, see the “Advanced Indexing” section of Chapter 10, “M-File Programming” in Using MATLAB. Extracting LTI Arrays of Subsystems To select a particular subset of I/O channels from all the models in an LTI array, use the syntax described in “Extracting and Modifying Subsystems” on page 3-5. For example, sys = rss(4,3,2,5,2); A = sys(1, [1 2]) or equivalently, A = sys(1,[1 2],:,:) 4-21 4 Arrays of LTI Models selects the first two input channels, and the first output channel in each model of the LTI array A, and returns the resulting 5-by-2 array of one-output, two-input subsystems. You can also combine model selection with I/O selection within an LTI array. For example, to access both: • The state-space model in the (3,2) array position • Only the portion of that model relating the second input to the first output type sys(1,2,3,2) To access the subsystem from all inputs to the first two output channels of this same array entry, type sys(1:2,:,3,2) Reassigning Parts of an LTI Array You can reassign entire models or portions of models in an LTI array. For example, sys = rss(4,3,2,5,2); % 5X2 array of state-space models H = rss(4,1,1,5,2); % 5X2 array of SISO models sys(1,2) = H reassigns the subsystem from input two to output one, for all models in the LTI array sys. This SISO subsystem of each model in the LTI array is replaced with the LTI array H of SISO models. This one-line assignment command is equivalent to the following 10-step nested for loop. for k = 1:5 for j = 1:2 sys(1,2,k,j) = H(:,:,k,j); end end Notice that you don’t have to use the array dimensions with this assignment. This is because I/O selection applies to all models in the array when the array indices are omitted. 4-22 Indexing Into LTI Arrays Similarly, the commands sys(:,:,3,2) = sys(:,:,4,1); sys(1,2,3,2) = 0; reassign the entire model in the (3,2) position of the LTI array sys and the (1,2) subsystem of this model, respectively. LTI Arrays of SS Models with Differing Numbers of States You must use an entire LTI model for reassignment if you have an LTI array sys of state-space models for which: • The numbers of states in each model in sys is not constant. • You want to change the dimensions of the a, b, and c matrices in one model as you reassign its a, b, and c properties. For example, if sys = ss(stack(1,tf(1,[1 2 1]),tf(1,[1 1]))); then the model sys(:,:,1) is of order 2, while sys(:,:,2) is of order 1. To reassign the a, b, and c properties of sys(:,:,1) so that the state dimension of the new model is not 2, you must make the entire model assignment at once. You can do this as follows. sys(:,:,1) = sys2 where sys2 represents an LTI model for which size(sys2,'order') is not 2. Deleting Parts of an LTI Array You can use indexing to delete any part of an LTI array by reassigning it to be empty ([]). For instance, sys = rss(4,3,2,5,2); sys(1,:) = []; size(sys) 5x2 array of continuous-time state-space models Each model has 2 outputs, 2 inputs, and 4 states. deletes the first output channel from every model of this LTI array. 4-23 4 Arrays of LTI Models Similarly, sys(:,:,[3 4],:) = [] deletes the third and fourth rows of this two-dimensional array of models. 4-24 Operations on LTI Arrays Operations on LTI Arrays Using LTI arrays, you can apply almost all of the basic model operations that work on single LTI models to entire sets of models at once. These basic operations, discussed in Chapter 3, “Operations on LTI Models,” include: • The arithmetic operations: +, –, *, /,\,',.' • The model interconnection functions: concatenation along I/O dimensions ([,], [;]), feedback, append, series, parallel, and lft When you apply any of these operations to two (or more) LTI arrays (for example, sys1 and sys2), the operation is implemented on a model-by-model basis. Therefore, the kth model of the resulting LTI array is derived from the application of the given operation to the kth model of sys1 and the kth model of sys2. For example, if sys1 and sys2 are two LTI arrays and sys = op(sys1,sys2) then the kth model in the resulting LTI array sys is obtained by adding the kth models in sys1 to the kth model in sys2 sys(:,:,k) = sys1(:,:,k) + sys2(:,:,k) You can also apply any of the response plotting functions such as step, bode, and nyquist described in Chapter 5, “Model Analysis Tools,” to LTI arrays. These plotting functions are also applied on a model by model basis. See “The Right-Click Menu for LTI Arrays” on page 6-28 for information on using the model selector for LTI arrays on response plots. 4-25 4 Arrays of LTI Models Example: Addition of Two LTI Arrays The following diagram illustrates the addition of two 3-by-1 LTI arrays sys1+sys2. sys2(:,:,3) sys1(:,:,3) 1 -----------s+2 + sys1(:,:,2) 1 ----------------s + 2.5 sys1 2s + 6.5 -------------------------------2 s + 6.5s + 9 = sys2(:,:,2) + sys1(:,:,1) 1 ----------------s + 2.9 1 ----------------s + 4.5 sys(:,:,3) 2.1 -----------s+4 sys(:,:,2) = 3.15 + 9.25 ----------------------------------2 s + 6.5s + 10 sys(:,:,1) sys2(:,:,1) + 1.5 ----------------s + 3.9 = + sys2 = 2.5s + 8.25 ------------------------------------------2 s + 6.8s + 11.31 Figure 4-8: The Addition of Two LTI Arrays The summation of these LTI arrays sys = sys1+sys2 is equivalent to the following model-by-model summation. for k = 1:3 sys(:,:,k)=sys1(:,:,k) + sys2(:,:,k) end 4-26 sys Operations on LTI Arrays Note that: • Each model in sys1 and sys2 must have the same number of inputs and outputs. This is required for the addition of two LTI arrays. • The lengths of the array dimensions of sys1 and sys2 must match. Dimension Requirements In general, when you apply any of these basic operations to two or more LTI arrays: • The I/O dimensions of each of the LTI arrays must be compatible with the requirements of the operation. • The lengths of array dimensions must match. The I/O dimensions of each model in the resulting LTI array are determined by the operation being performed. See Chapter 3, “Operations on LTI Models,” for requirements on the I/O dimensions for the various operations. For example, if sys1 and sys2 are both 1-by-3 arrays of LTI models with two inputs and two outputs, and sys3 is a 1-by-3 array of LTI models with two outputs and 1 input, then sys1 + sys2 is an LTI array with the same dimensions as sys1 and sys2. sys1 * sys3 is a 1-by-3 array of LTI models with two outputs and one input, and [sys1,sys3] is a 1-by-3 array of LTI models with two outputs and three inputs. Special Cases for Operations on LTI Arrays There are some special cases in applying operations to LTI arrays. Consider applying any binary operation called op (such as +, –, or *) to an LTI array sys1 sys = op(sys1,sys2) 4-27 4 Arrays of LTI Models where sys, the result of the operation, is an LTI array with the same array dimensions as sys1. You can use shortcuts for coding sys = op(sys1,sys2) in the following cases: • For operations that apply to LTI arrays, sys2 does not have to be an array. It can be a single LTI model (or a gain matrix) whose I/O dimensions satisfy the compatibility requirements for op (with those of each of the models in sys1). In this case, op applies sys2 to each model in sys1, and the kth model in sys satisfies sys(:,:,k) = op(sys1(:,:,k),sys2) • For arithmetic operations, such as +, *, /, and \, sys2 can be either a single SISO model, or an LTI array of SISO models, even when sys1 is an LTI array of MIMO models. This special case relies on MATLAB’s scalar expansion capabilities for arithmetic operations. - When sys2 is a single SISO LTI model (or a scalar gain), op applies sys2 to sys1 on an entry-by-entry basis. The ijth entry in the kth model in sys satisfies sys(i,j,k) = op(sys1(i,j,k),sys2) - When sys2 is an LTI array of SISO models (or a multidimensional array of scalar gains), op applies sys2 to sys1 on an entry-by-entry basis for each model in sys. sys(i,j,k) = op(sys1(i,j,k),sys2(:,:,k)) Examples of Operations on LTI Arrays with Single LTI Models Suppose you want to create an LTI array containing three models, where, for τ in the set { 1.1, 1.2, 1.3 } , each model H τ ( s ) has the form Hτ( s ) = 4-28 1 ----------s+τ 0 –1 1 --s Operations on LTI Arrays You can do this efficiently by first setting up an LTI array h containing the SISO models 1 ⁄ ( s + τ ) and then using concatenation to form the LTI array H of MIMO LTI models H τ ( s ), τ ∈ { 1.1, 1.2, 1.3 }. To do this, type tau = [1.1 1.2 1.3]; for i=1:3 % Form LTI array h of SISO models. h(:,:,i)=tf(1,[1 tau]); end H = [h 0; –1 tf(1,[1 0])]; %Concatenation: array h & single models size(H) 3x1 array of continuous-time transfer functions Each transfer function has 2 output(s) and 2 input(s). Similarly, you can use append to perform the diagonal appending of each model in the SISO LTI array h with a fixed single (SISO or MIMO) LTI model. S = append(h,tf(1,[1 3])); % Append a single model to h. specifies an LTI array S in which each model has the form Sτ ( s ) = 1 ----------s+τ 0 0 1 -----------s+3 You can also combine an LTI array of MIMO models and a single MIMO LTI model using arithmetic operations. For example, if h is the LTI array of three SISO models defined above, [h,h] + [tf(1,[1 0]);tf(1,[1 5])] adds the single one-output, two-input LTI model [1/s 1/(s + 5)] to every model in the 3-by-1 LTI array of one-output, two-input models [h,h]. The result is a new 3-by-2 array of models. Examples: Arithmetic Operations on LTI Arrays and SISO Models Using the LTI array of one-output, two-input state-space models [h,h], defined in the previous example, tf(1,[1 3]) + [h,h] 4-29 4 Arrays of LTI Models adds a single SISO transfer function model to each entry in each model of the LTI array of MIMO models [h,h]. Finally, G = rand(1,1,3,1); sys = G + [h,h] adds the array of scalars to each entry of each MIMO model in the LTI array [h,h] on a model-by-model basis. This last command is equivalent to the following for loop. hh = [h,h]; for k = 1:3 sys(:,:,k) = G(1,1,k) + hh(:,:,k); end Other Operations on LTI Arrays You can also apply the analysis functions, such as bode, nyquist, and step, to LTI arrays. See Chapter 5, “Model Analysis Tools,” for more information on these functions. 4-30 5 Model Analysis Tools General Model Characteristics . . . . . . . . . . . 5-2 Model Dynamics . . . . . . . . . . . . . . . . . . 5-4 State-Space Realizations . . . . . . . . . . . . . . 5-7 Time and Frequency Response . . . Time Responses . . . . . . . . . . . Frequency Response . . . . . . . . . Plotting and Comparing Multiple Systems Customizing the Plot Display . . . . . . . . . . . . . . . . . . . . . . . . . . . . . . . . . . . . . . . . . . . . . . 5-9 5-9 5-11 5-13 5-17 Model Order Reduction . . . . . . . . . . . . . . . 5-20 5 Model Analysis Tools General Model Characteristics General model characteristics include the model type, I/O dimensions, and continuous or discrete nature. Related commands are listed in the table below. These commands operate on continuous- or discrete-time LTI models or arrays of LTI models of any type. General Model Characteristics Commands 5-2 class Display model type ('tf', 'zpk', 'ss', or 'frd'). hasdelay Test true if LTI model has any type of delay. isa Test true if LTI model is of specified class. isct Test true for continuous-time models. isdt Test true for discrete-time models. isempty Test true for empty LTI models. isproper Test true for proper LTI models. issiso Test true for SISO models. ndims Display the number of model/array dimensions. reshape Change the shape of an LTI array. size Output/input/array dimensions. Used with special syntax, size also returns the number of state dimensions for state-space models, and the number of frequencies in an FRD model. General Model Characteristics This example illustrates the use of some of these commands. See the related reference pages for more details. H = tf({1 [1 –1]},{[1 0.1] [1 2 10]}) Transfer function from input 1 to output: 1 ------s + 0.1 Transfer function from input 2 to output: s – 1 -------------s^2 + 2 s + 10 class(H) ans = tf size(H) Transfer function with 2 input(s) and 1 output(s). [ny,nu] = size(H)% Note: ny = number of outputs ny = 1 nu = 2 isct(H)% Is this system continuous? ans = 1 isdt(H)% Is this system discrete? ans = 0 5-3 5 Model Analysis Tools Model Dynamics The Control System Toolbox offers commands to determine the system poles, zeros, DC gain, norms, etc. You can apply these commands to single LTI models or LTI arrays. The following table gives an overview of these commands. Model Dynamics covar Covariance of response to white noise. damp Natural frequency and damping of system poles. dcgain Low-frequency (DC) gain. dsort Sort discrete-time poles by magnitude. esort Sort continuous-time poles by real part. norm Norms of LTI systems ( H 2 and L ∞ ). pole, eig System poles. pzmap Pole/zero map. zero System transmission zeros. With the exception of L ∞ norm, these commands are not supported for FRD models. 5-4 Model Dynamics Here is an example of model analysis using some of these commands. h = tf([4 8.4 30.8 60],[1 4.12 17.4 30.8 60]) Transfer function: 4 s^3 + 8.4 s^2 + 30.8 s + 60 --------------------------------------s^4 + 4.12 s^3 + 17.4 s^2 + 30.8 s + 60 pole(h) ans = –1.7971 –1.7971 –0.2629 –0.2629 + – + – 2.2137i 2.2137i 2.7039i 2.7039i zero(h) ans = –0.0500 + 2.7382i –0.0500 – 2.7382i –2.0000 dcgain(h) ans = 1 [ninf,fpeak] = norm(h,inf)% peak gain of freq. response ninf = 1.3402 % peak gain fpeak = 1.8537 % frequency where gain peaks 5-5 5 Model Analysis Tools These functions also operate on LTI arrays and return arrays. For example, the poles of a three dimensional LTI array sysarray are obtained as follows. sysarray = tf(rss(2,1,1,3)) Model sysarray(:,:,1,1) ======================= Transfer function: -0.6201 s - 1.905 --------------------s^2 + 5.672 s + 7.405 Model sysarray(:,:,2,1) ======================= Transfer function: 0.4282 s^2 + 0.3706 s + 0.04264 ------------------------------s^2 + 1.056 s + 0.1719 Model sysarray(:,:,3,1) ======================= Transfer function: 0.621 s + 0.7567 --------------------s^2 + 2.942 s + 2.113 3x1 array of continuous-time transfer functions. pole(sysarray) ans(:,:,1) = -3.6337 -2.0379 ans(:,:,2) = -0.8549 -0.2011 ans(:,:,3) = -1.6968 -1.2452 5-6 State-Space Realizations State-Space Realizations The following functions are useful to analyze, perform state coordinate transformations on, and derive canonical state-space realizations for single state-space LTI models or LTI arrays of state-space models. State-Space Realizations canon Canonical state-space realizations. ctrb Controllability matrix. ctrbf Controllability staircase form. gram Controllability and observability gramians. obsv Observability matrix. obsvf Observability staircase form. ss2ss State coordinate transformation. ssbal Diagonal balancing of state-space realizations. The function ssbal uses a simple diagonal similarity transformation –1 –1 ( A, B, C ) → ( T AT, T B, CT ) to balance the state-space data the norm of the matrix. –1 T AT CT ( A, B, C ) . This is accomplished by reducing –1 T B 0 Such balancing usually improves the numerical conditioning of subsequent state-space computations. Note that conversions to state-space using ss produce balanced realizations of transfer functions and zero-pole-gain models. By contrast, the canonical realizations produced by canon, ctrbf, or obsvf are often badly scaled, sensitive to perturbations of the data, and poorly suited for 5-7 5 Model Analysis Tools state-space computations. Consequently, it is wise to use them only for analysis purposes and not in control design algorithms. 5-8 Time and Frequency Response Time and Frequency Response The Control System Toolbox contains a set of commands that provide the basic time and frequency domain analysis tools required for control system engineering. These commands apply to any kind of LTI model (TF, ZPK, or SS, continuous or discrete, SISO or MIMO). You can only apply the frequency domain analysis tools FRDs. The LTI Viewer provides an integrated graphical user interface (GUI) to analyze and compare LTI models (see Chapter 6, “The LTI Viewer” for details). Time Responses Time responses investigate the time-domain transient behavior of LTI models for particular classes of inputs and disturbances. You can determine such system characteristics as rise time, settling time, overshoot, and steady-state error from the time response. The Control System Toolbox provides functions for step response, impulse response, initial condition response, and general linear simulations. You can apply these functions to single TF, SS, or ZPK models or arrays of these types of models. Note that you can simulate the response to white noise inputs using lsim and the function rand (see Using MATLAB to generate random input vectors. Time Response impulse Impulse response. initial Initial condition response. gensig Input signal generator. lsim Simulation of response to arbitrary inputs. step Step response. The functions step, impulse, and initial automatically generate an appropriate simulation horizon for the time response plots. Their syntax is step(sys) impulse(sys) initial(sys,x0) % x0 = initial state vector 5-9 5 Model Analysis Tools where sys is any continuous or discrete LTI model or LTI array. For MIMO models, these commands produce an array of plots with one plot per I/O channel (or per output for initial and lsim). For example, h = [tf(10,[1 2 10]) , tf(1,[1 1])] step(h) produces the following plot. The simulation horizon is automatically determined based on the model dynamics. You can override this automatic mode by specifying a final time step(sys,10) % simulates from 0 to 10 seconds or a vector of evenly spaced time samples. t = 0:0.01:10 % time samples spaced every 0.01 second step(sys,t) 5-10 Time and Frequency Response Note: When specifying a time vector t = [0:dt:tf], remember the following constraints on the spacing dt between time samples: • For discrete systems, dt should match the system sample time. • Continuous systems are first discretized using zero-order hold and dt as sampling period, and step simulates the resulting discrete system. As a result, you should pick dt small enough to capture the main features of the continuous transient response. The syntax step(sys) automatically takes these issues into account. Finally, the function lsim simulates the response to more general classes of inputs. For example, t = 0:0.01:10 u = sin(t) lsim(sys,u,t) simulates the zero-initial condition response of the LTI system sys to a sine wave for a duration of 10 seconds. Note: You can also implement several plotting options by using the right-click menus accessible from the (white) plot region of all time and frequency plots. These options are listed on the menu. To learn more about the right-click menus on plots, see “The Right-Click Menus” on page 6-18 Frequency Response The Control System Toolbox provides response-plotting functions for the following frequency domain analysis tools: • Bode plots • Nichols charts • Nyquist plots • Singular value plots 5-11 5 Model Analysis Tools In addition, the function margin determines the gain and phase margins for a given SISO open-loop model. These functions can be applied to single LTI models or LTI arrays. Table 5-1: Frequency Response Function Name Description bode Computes the Bode plot. evalfr Computes the frequency response at a single complex frequency (not for FRD models). freqresp Computes the frequency response for a set of frequencies. margin Computes gain and phase margins. ngrid Applies grid lines to a Nichols plot. nichols Computes the Nichols plot. nyquist Computes the Nyquist plot. sigma Computes the singular value plot. As for time response functions, the commands bode(sys) nichols(sys) nyquist(sys) sigma(sys) handle both continuous and discrete models. These functions produce a frequency response plot for SISO LTI models, and an array of plots in the MIMO case. The frequency grid used to evaluate the response is automatically selected based on the system poles and zeros. The Bode plot produced by bode plots the magnitude of the frequency response in decibels (dB), as 20*log10(abs(response)). Phase is plotted in degrees. To set the frequency range explicitly to some interval [wmin,wmax], use the syntax bode(sys,{wmin , wmax}) 5-12 % Note the curly braces Time and Frequency Response For example, bode(sys,{0.1 , 100}) draws the Bode plot between 0.1 and 100 radians/second. You can also specify a particular vector of frequency points as in w = logspace(–1,2,100) bode(sys,w) The logspace command generates a vector w of logarithmically spaced –1 2 frequencies starting at 10 = 0.1 rad/s and ending at 10 = 100 rad/s. See the reference page for linspace for linearly spaced frequency vectors. Note: In discrete time, the frequency response is evaluated on the unit circle and the notion of “frequency” should be understood as follows. The upper half of the unit circle is parametrized by z=e jωT s , π 0 ≤ ω ≤ ω N = -----Ts where T s is the system sample time and ω N is called the Nyquist frequency. The variable ω plays the role of continuous-time frequency. We use this “equivalent frequency” as an x -axis variable in all discrete-time frequency response plots. In addition, the frequency response is plotted only up to the Nyquist frequency ω N because it is periodic with period 2ω N (a phenomenon known as aliasing). Note: An easy way to implement these response-plotting functions is through the LTI Viewer. See Chapter 6, “The LTI Viewer” for more information. Plotting and Comparing Multiple Systems The LTI Viewer provides one method of plotting various responses for multiple models. See Chapter 6, “The LTI Viewer” to see how to accomplish this. You can also use the command line response-plotting functions to plot the response of 5-13 5 Model Analysis Tools several LTI models on a single plot. To do so, invoke the corresponding command line function using the list sys1,..., sysN of models as the inputs. step(sys1,sys2,...,sysN) impulse(sys1,sys2,...,sysN) ... bode(sys1,sys2,...,sysN) nichols(sys1,sys2,...,sysN) ... All models in the argument lists of any of the response plotting functions (except for sigma) must have the same number of inputs and outputs. To differentiate the plots easily, you can also specify a distinctive color/linestyle/ marker for each system just as you would with the plot command. For example, bode(sys1,’r’,sys2,’y--’,sys3,’gx’) plots sys1 with solid red lines, sys2 with yellow dashed lines, and sys3 with green x markers. You can plot responses of multiple models on the same plot. These models need not be all continuous-time or all discrete-time. 5-14 Time and Frequency Response The following example compares a continuous model with its zero-order-hold discretization. sysc = tf(1000,[1 10 1000]) sysd = c2d(sysc,0.2) % ZOH sampled at 0.2 second step(sysc,'--',sysd,'-') % compare step responses 5-15 5 Model Analysis Tools bode(sysc,'--',sysd,'-') % compare Bode responses A comparison of the continuous and discretized responses reveals a drastic undersampling of the continuous system. Specifically, there are hidden oscillations in the discretized time response and aliasing conceals the continuous-time resonance near 300 rad/sec. 5-16 Time and Frequency Response Customizing the Plot Display You can plot data generated by several response analysis functions applied to one or several LTI models, as well as your own data. There are several ways you can customize how you display plots: • Store the time or frequency response data in MATLAB arrays by invoking response analysis functions such as step, and bode with output arguments [y,t] = step(sys) [mag,phase,w] = bode(sys) [re,im,w] = nyquist(sys) and use the plot command to display the result. • Use the subplot and hold commands to plot several sets of data in a single figure window. • Use the plot configuration menu in the LTI Viewer for time and frequency responses of LTI models. For more information, see “Viewer Configuration Window” on page 6-39. 5-17 5 Model Analysis Tools For example, the following sequence of commands displays the Bode plot, step response, pole/zero map, and some additional data in a single figure window. h = tf([4 8.4 30.8 60],[1 4.12 17.4 30.8 60]); subplot (121) bode(h) subplot(222) bode(h) subplot(224) bode(h) 5-18 Time and Frequency Response Another example is subplot(221) bode(h) subplot(222) step(h) subplot(223) pzmap(h) subplot(224) plot(rand(1, 100)) % any data can go here title('Some noise') Note: Each of the plots generated by response analysis functions in these figures (here, bode, step, and pzmap) has its own right-click menu (similar to those in the LTI viewer. For more information, see “The Right-Click Menus” on page 6-18. 5-19 5 Model Analysis Tools Model Order Reduction You can derive reduced-order models with the following commands. Model Order Reduction balreal Input/output balancing. minreal Minimal realization or pole/zero cancellation. modred State deletion in I/O balanced realization. sminreal Structurally minimal realization Use minreal to delete uncontrollable or unobservable state dynamics in state-space models, or cancel pole/zero pairs in transfer functions or zero-pole-gain models. Use sminreal to remove any states from a model that don’t affect the I/O response. For already minimal models, you can further reduce the model order using a combination of balreal and modred. See the corresponding Reference pages for details. 5-20 6 The LTI Viewer Introduction . . . . . . . . . . . . . . . . . . . . 6-2 Getting Started Using the LTI Viewer: An Example . . 6-4 The LTI Viewer Menus . . . . . . . . . . . . . . . 6-15 The Right-Click Menus . . . . . . . . . . . . . . . 6-18 The LTI Viewer Tools Menu . . . . . . . . . . . . . 6-39 Simulink LTI Viewer . . . . . . . . . . . . . . . . 6-48 6 The LTI Viewer Introduction The LTI Viewer is a graphical user interface for viewing and manipulating the response plots of LTI models. You can display the following plot types for LTI models using the LTI Viewer: • Step response (only for TF, SS, or ZPK models) • Impulse response (only for TF, SS, or ZPK models) • Bode plot • Nyquist plot • Nichols chart • Singular values of the frequency response • Poles and zeros (only for TF, SS, or ZPK models) • LTI model response to a general input (only for TF, SS, or ZPK models) • Initial state LTI response (only for SS models) The LTI Viewer displays up to six of these different response analysis plot types simultaneously. You can also analyze the response plots of several LTI models at once. However, in order to analyze models with different numbers of inputs and outputs, you must display them in separate LTI Viewers. A special version of the LTI Viewer can also be used to analyze Simulink models. The operation of the Simulink LTI Viewer is discussed at the end of this chapter in “Simulink LTI Viewer” on page 6-48. Functionality of the LTI Viewer The basic function of the LTI Viewer is to display the plots of LTI model responses. Several menus are included for operations such as importing models into the LTI Viewer or printing response plots. In addition to these data operations, you can manipulate the LTI Viewer response plots in several ways, including: • Change the type of plot being displayed in each plot region of the LTI Viewer • Toggle on and off the response plots of individual LTI models loaded in the LTI Viewer • Display response plot characteristics for a given plot type, such as settling time for a step response plot 6-2 Introduction • Zoom in on or out from the individual displayed plots • Toggle the grid on or off on a plot • Select which I/O channels the LTI Viewer displays for MIMO models in each plot • For a given plot type, select how the LTI Viewer displays the I/O channels for MIMO models • Select which models of an LTI array you want displayed in the LTI Viewer by indexing into dimensions or model characteristics • Control plot characteristics such as the ranges for time and frequency used in various types of plots • Control linestyle preferences such as the color and marker for each model response plotted • Initialize the LTI Viewer from the command line to display multiple plot types (e.g., Bode plot and step response) simultaneously • Control of the number of response plot regions that appear (one to six regions) in the LTI Viewer Many of these features are accessed and controlled through plot-specific right-click menus. 6-3 6 The LTI Viewer Getting Started Using the LTI Viewer: An Example This section contains a brief introduction to the LTI Viewer through an example that leads you through the following steps: 1 Load two LTI models into the LTI Viewer, initialized with the step responses and Bode plots of both models. 2 Use the right-click menu to display markers for - The settling time on the step responses - The peak magnitude response on the Bode plots 3 Use the mouse to display the values of these response characteristics on the plots. 4 Import a third LTI model to the LTI Viewer for comparison. 5 Use the right-click menu to zoom in on a plot. Suppose you have a set of compensators you’ve designed to control a system, and you want to compare the closed-loop step responses and Bode plots. You can do this with the LTI Viewer. A sample set of closed-loop transfer function models are included (along with some other models) in the MAT-file LTIexamples.mat. Type load LTIexamples In this example, you analyze the response plots of these three transfer function models. Gcl1, Gcl2, Gcl3 Transfer function: 4 s^3 + 8.4 s^2 + 30.8 s + 60 --------------------------------------s^4 + 4.12 s^3 + 17.4 s^2 + 30.8 s + 60 6-4 Getting Started Using the LTI Viewer: An Example Transfer function: 2 s^3 + 1.2 s^2 + 15.1 s + 7.5 ---------------------------------------s^4 + 2.12 s^3 + 10.2 s^2 + 15.1 s + 7.5 Transfer function: 1.2 s^3 + 1.12 s^2 + 9.1 s + 7.5 ---------------------------------------s^4 + 1.32 s^3 + 10.12 s^2 + 9.1 s + 7.5 Initializing the LTI Viewer with Multiple Plots For a given LTI model, you can use the LTI Viewer to simultaneously display multiple response plot types, such as the Bode plot and the step response. You can also initialize the LTI Viewer to display the plots of several different models at once. The general syntax for initializing the LTI Viewer to plot up to six plot types is ltiview({'type1';'type2';...;'typek'},sys1,...,sysn) where: • {'type1';'type2';...;'typek'} is a cell array listing up to six strings for the names of the plot types ( k ≤ 6 ). • sys1, ..., sysn is a list of the MATLAB workspace variable names for the systems whose responses you want to initially display in the LTI Viewer. The plot type names can be any of the following. Plot Type Description bode Bode plot impulse Impulse response initial Initial state response for SS models lsim LTI model response to general input nichols Nichols chart nyquist Nyquist plot 6-5 6 The LTI Viewer Plot Type Description pzmap Plot of poles and zeros sigma Singular values of the frequency response step Step response Note: When you initialize the LTI Viewer with lsim or initial, these plot types require some extra arguments. For more information on the syntax for calling ltiview, see ltiview on page 11-133. To load the two models Gcl1, and Gcl2 into the LTI Viewer so that it displays the step responses and Bode plots of both models, type ltiview({'step';'bode'},Gcl1,Gcl2) This opens the following LTI Viewer. 6-6 Getting Started Using the LTI Viewer: An Example Plot region for the step response The File menu has several items, including ones that allow you to import models and print plots. The Tools menu items allow you to reconfigure the plot arrangement and set general plot and linestyle preferences for this open LTI Viewer. Right-click on either plot region to see the response plot menus. Two response curves are plotted on each of the two plot regions. Plot region for the Bode plot Status bar provides useful information. Right-Click Menus: Setting Response Characteristics To access the individual response plot controls, use the right-click menus available from any of the plot regions displayed. These right-click menus vary, depending on if the LTI Viewer is displaying the response plots of SISO models, MIMO models, or LTI arrays. Some of the menu items are also plot type dependent. For example, suppose you want to mark the settling time on the step responses, and the peak magnitude response on the Bode plots. To do this: 6-7 6 The LTI Viewer 1 Right-click anywhere in the plot region of the step response plots. This opens the following menu list in the plot region. Figure 6-1: The Right-Click Menu for SISO Models 2 Place your mouse pointer on the Characteristics menu item, and select Settling Time with your left mouse button. Figure 6-2: The Step Response Characteristics Submenu 3 Right-click anywhere in the plot region of the Bode plots to open a right-click menu. 4 Place your mouse pointer on the Characteristics menu item. The submenu items of the Characteristics menu for the Bode plot are different than those of the Characteristics menu for the step response right-click menu. Figure 6-3: Bode Plot Characteristics Submenu 5 Select Peak Response with your left mouse button. 6-8 Getting Started Using the LTI Viewer: An Example Your LTI Viewer should now look like this. Notice that there is one settling time or peak magnitude marker for each LTI model displayed in the LTI Viewer. Displaying Response Characteristics on a Plot To display the values of any plot characteristic marked on a plot: 1 Click on the marker 2 Hold the left or right mouse button down to read the values off the plot. 6-9 6 The LTI Viewer Hold the mouse button down on the marker to display the values. Note that you can: • Use either the right or the left mouse button when you select a marker on a plot. • Left-click anywhere on a particular plot line to see the response values of that plot at that point. • Right-click anywhere on a plot line to see I/O and model information. 6-10 Getting Started Using the LTI Viewer: An Example Importing Models If the closed-loop models Gcl1 and Gcl2 do not meet your specifications, you may want to design another compensator at the command line, and import the resulting closed-loop model Gcl3 for comparison: 1 Select Import from the File menu. This opens a browser listing all of the LTI models currently available in the MATLAB workspace. To multiselect individual models, select one model and hold down the Control key while selecting additional models. To deselect any selected models, hold down the control key while you click on the highlighted model names. To multiselect a list of several models in a row, select the first model and hold down the Shift key while selecting the last model you want in the list. This browser allows you to copy LTI models from the MATLAB workspace into the LTI Viewer workspace. LTI model variable names have to be in the LTI Viewer workspace before you can analyze the response plots of these models using the LTI Viewer. 2 Select Gcl3 from the list of models in the workspace browser. 3 Select OK. The LTI Viewer now shows the step response of Gcl3 in addition to those of Gcl1 and Gcl2. 6-11 6 The LTI Viewer Note: A given LTI Viewer can only be used to analyze models with the same number of inputs and outputs. If you want to analyze models with different numbers of inputs or outputs, you must import these into separate LTI Viewers. See “Opening a New LTI Viewer” on page 6-16 for more information. Zooming With three models loaded into the LTI Viewer, you may want to zoom in on one region of a given plot, in order to inspect the response behavior in that region more closely. For example, let’s zoom in on the step responses of these three models in the vicinity of 4.5 seconds on the time axis. To zoom in on a region on any of the plots, use the Zoom menu item available from the right-click menu: 1 Right-click on a plot region (in this case, the step response) to open the right-click menu. 2 Move your mouse pointer over the Zoom menu. Your menu looks like this. Select In-X and a horizontal rubber band is available to select the zoom region. Select In-Y and a vertical rubber band is available to select the zoom region. Select X-Y and a rectangular rubber band is available to select the zoom region. 3 Select X-Y to zoom in both the horizontal and vertical directions. 4 Use your mouse to create the rectangular rubberband that indicates the zoom region: 6-12 Getting Started Using the LTI Viewer: An Example a Point your mouse to any corner of the rectangle of the region you want to zoom in on. b Left-Click there, and hold the mouse button down. c Drag the mouse pointer until the rectangle covers the region you want to zoom in on. d Release your mouse. For this example, zoom in around the region near 4.5 seconds on the step response plot. Your step response plot looks like this as you select the zoom region. 6-13 6 The LTI Viewer After releasing the mouse on the zoom region, the LTI Viewer looks like this. Notice that you’ve only zoomed on the step response plot; the Bode plot remains unchanged. Note: To zoom out, i.e., to revert back to the original coordinate limits that were in place before you zoomed, follow the steps for zooming again, only this time select Out from the Zoom menu. 6-14 The LTI Viewer Menus The LTI Viewer Menus The LTI Viewer has three main menus: • File • Tools • Help The File menu provides features pertinent to bringing data in and out of the LTI Viewer. The Help provides help on the LTI Viewer features. The File and Help menus are covered in this section. The Tools menu allows you to control certain features common to all of the plots. You can read about the Tools menu items in “The LTI Viewer Tools Menu” on page 6-39. The File Menu The File menu gives you th following options: • New Viewer—Open a new LTI Viewer. • Import—Bring in new models into the LTI Viewer workspace. • Export—Export models to the MATLAB workspace or to a disk. • Delete Systems—Delete some or all of the LTI models in the LTI Viewer workspace. • Refresh Systems—Update the LTI Viewer with any changes you made at the MATLAB command line to models in the LTI Viewer workspace. • Print—Generate a hardcopy of the LTI model response. • Print to Figure—Send the LTI Viewer plots to a MATLAB figure window. • Close Viewer—Close an open LTI Viewer. Details on some of these menu items are described below. Importing a New Model into the LTI Viewer Workspace LTI models in the MATLAB workspace can only be viewed by the LTI Viewer if they are in the LTI Viewer workspace. There are two ways of loading models into the LTI Viewer workspace: • Load them into the LTI Viewer workspace when you open the LTI Viewer. • Import them into an open LTI Viewer using the browser that is opened when you select the Import menu item under the File menu. 6-15 6 The LTI Viewer For directions for loading LTI models into the LTI Viewer workspace when you open it, see “Initializing the LTI Viewer with Multiple Plots” on page 6-5. For directions for importing models into the workspace of an open LTI Viewer, see “Importing Models” on page 6-11. Opening a New LTI Viewer The New Viewer option in the File menu enables you to initialize a new LTI Viewer. This is the same as typing ltiview at the MATLAB prompt. You can use this feature to compare response plots of LTI models that don’t have the same numbers of inputs and outputs. Refreshing Systems in the LTI Viewer Workspace If you modify the characteristics of an LTI model in the MATLAB workspace, select Refresh Systems in the File menu to update the models in the LTI Viewer workspace with the changes you made. Printing Response Plots To print your response plots, go to the File menu: • Choose the Print option to obtain a hardcopy. • Choose the Print to Figure option to send the plots to a MATLAB figure window. The Print option allows you to print the plots, exactly as you see them displayed in the LTI Viewer. The Print to Figure option allows you to use the Plot Tools feature of MATLAB figure windows to edit the plots before printing them. Getting Help You can obtain instructions on how to use the LTI Viewer directly from the Help menu. Static Help The Help menu contains three submenus: • Overview • Response Preferences • Linestyle Preferences 6-16 The LTI Viewer Menus The first submenu, Overview, opens the help text describing how to use the LTI Viewer menus and right-click menus that control the LTI Viewer. The remaining help menu items pertain to LTI Viewer controls you access from the Tools menu: the Response Preferences and Linestyle Preferences windows. These windows provide additional tools for manipulating the system responses. See the “Response Preferences” on page 6-40” and the “Linestyle Preferences” on page 6-44” sections for more information on the Response Preferences and Linestyle Preferences windows. Interactive Help The status bar at the bottom of the LTI Viewer provides you with instructions, hints, and error messages as you proceed through your analysis. In general, you can consult the status bar to learn: • If you have tried to perform an unsupported function • If a function has successfully been completed • If additional information on the use of an LTI Viewer control is available 6-17 6 The LTI Viewer The Right-Click Menus You can access most of the controls for the individual response plots displayed by the LTI Viewer through the right-click menus located in any plot region. There is one right-click menu per plot region displayed on the LTI Viewer. These menus vary slightly, depending on the model dimensions and plot type: • The menu items that appear on the plot regions of the responses for SISO models are the basic right-click menu items. • Additional menu items appear when you are displaying the plots of MIMO LTI models or LTI arrays. You can’t access the right-click menu for the LTI Viewer plots until at least one response plot is displayed in the LTI Viewer. The Right-Click Menu for SISO Models If you have not already done so, load the three SISO LTI models into the LTI Viewer workspace. You can do this by typing load LTIexamples ltiview({'step';'bode'},Gcl1,Gcl2,Gcl3) Once you have loaded models into the LTI Viewer, right-click on the plot region of the step response plot. The following menu appears in the plot region. Each arrow next to a menu item opens a submenu list when you select the menu item. Figure 6-4: The Right-Click Menu for SISO Models 6-18 The Right-Click Menus This is the right-click menu for SISO models. These menu items control the LTI Viewer plots for all models: • Plot Type—You can choose which plot type you want displayed from this list of nine plot types. The check mark next to the plot type indicates your selection for the type of plot displayed. You can select from any of the items on this list. Figure 6-5: Plot Type Submenu • Systems—The Systems submenu lists the models in the LTI Viewer workspace. You can choose to display or hide the plots of LTI models in the LTI Viewer workspace from this menu item: The check mark next to a model name indicates that the model’s response is displayed on the plot that brought up this menu. LTI model name The color (in parentheses) is a legend item that indicates the style in which each model’s response plot is displayed. Figure 6-6: The Systems Submenu for Three Models - The legend for the individual response curves (described as linestyle, marker types, or color preferences) is indicated next to the name of each model. For information on how to modify these preferences, see “Linestyle Preferences” on page 6-44. - Check marks appear next to the names of models whose plots are displayed. Names of models that do not have a check mark next to them 6-19 6 The LTI Viewer are in the LTI Viewer workspace, but their responses are not displayed on the plot associated with the open menu. - You can select any model in the list with your mouse to toggle on (or off) the visibility of its response curve in the selected plot region. • Characteristics—You can toggle on and off the option to display a marker for various response characteristics for each plot type. For more information, see “Displaying Response Characteristics on a Plot” on page 6-9. A check mark indicates that the characteristic is displayed on the plot. You can multiselect these submenu items one at a time, by re-opening the right-click menu. Figure 6-7: The Characteristics Submenu for the Step Response • Zoom—You can zoom in or out of a given plot using the four submenu items in the Zoom menu. For more information, see “Zooming” on page 6-12. • Grid—You can toggle a grid on and off by selecting this menu item. Selecting a Menu Item To select any menu item on the right-click menu: 1 Move your mouse over the menu item until it becomes highlighted, and its submenu (if it has one) is displayed. 2 Click on any (sub)menu item you want to select: a For options menus such as Characteristics and Systems: If the menu item does not have a check next to it, selecting the menu item will produce a check next to that item. Selecting a checked item unchecks that menu selection (deselects that menu option). b For exclusive menus such as Plot Type, one menu item must be checked, and selecting a plot type other than the one checked changes the plot type according to your selection. 6-20 The Right-Click Menus Note: To multiselect submenu items (such as in the Characteristics or the Systems menus), re-open the right-click menu for each submenu item selection. The Right-Click Menu for MIMO Models When you load a MIMO model into the LTI Viewer, the right-click menu has a few more options than the right-click menu for SISO models does. These additional menu items are: • Axes Grouping for grouping I/O channels • Select I/Os for hiding the plots from some I/O channels To see these menu items, you much have a MIMO model loaded in the LTI Viewer workspace. The model ssF8 in the file LTIexamples.mat is a MIMO state-space model for an F-8 aircraft. This model has two inputs and two outputs. The InputNames have been assigned as Elevator and Flaperon, and the OutputNames have been assigned as Acceleration and FlightPath. If you haven’t already done so, load this model into the MATLAB workspace by typing load LTIexamples Now that ssF8 is in the MATLAB workspace, you can load it into an LTI Viewer workspace. To open a new LTI Viewer that displays the four nyquist plots for each of the I/O channels of this model, type ltiview('nyquist',ssF8) 6-21 6 The LTI Viewer Your LTI Viewer looks like this. This plot region is displayed as a grid of four distinct plots: one for each I/O response of ssF8. Figure 6-8: Nyquist Plots of the Four I/O Responses in ssF8 Notice that the I/O names for this model appear on the Nyquist plot. Each of the four plots displayed represents the I/O response from a single input to a single output. 6-22 The Right-Click Menus Right-click on any part of the plot region (anywhere on the grid of plots). This opens the following menu. The right-click menu for MIMO models has two extra menu items: Axes Grouping and Select I/Os. Figure 6-9: The Right-Click Menu for MIMO Models The Axes Grouping Submenu The Axes Grouping submenu is as follows. Default Axes Grouping setting: Each I/O response is displayed individually. When you first load a MIMO model into the LTI Viewer, it displays each I/O response curve in a separate portion of the plot region. For example, if you have two inputs and three outputs, the LTI Viewer initially displays a three-by-two grid of six separate plots. In this example, a two-by-two grid of four separate plots is displayed in the plot region. This initial (default) Axes Grouping setting is indicated by (checked) submenu item, None. 6-23 6 The LTI Viewer You can use the Axes Grouping submenu to reconfigure the grouping of these I/O response curves with the following submenu items. • Inputs: The response curves from all of the inputs to a given output are plotted in the same portion of the plot region. There are as many separate portions of the plot region displayed as there are outputs. The plot region is divided into two portions: one for each output. Figure 6-10: Axes Grouping: Inputs 6-24 The Right-Click Menus • Outputs: The response curves from a given input to all of the outputs are plotted in the same portion of the plot region. There are as many separate portions of the plot region displayed as there are inputs. The plot region is divided into two portions: one for each input. Figure 6-11: Axes Grouping: Outputs 6-25 6 The LTI Viewer • All: All of the I/O response curves are displayed (grouped) in a single plot region. The responses appear all on the same plot region. Figure 6-12: Axes Grouping: All The Select I/Os Menu Item The LTI Viewer initially displays all of the I/O response curves from each input channel to each output channel. You can select the Select I/Os menu item to customize the display with respect to the input and output channels. 6-26 The Right-Click Menus When you select Select I/Os from the right-click menu, the following window opens. Select one of these input channel names to display only I/O responses from the selected input. Select all to display the responses from all I/O channels. Select one of these output channel names to display only I/O responses to the selected output. Hold down the Shift key while selecting individual I/O response markers to customize the display. This I/O Selector window allows you to customize the I/O channel display for the plots of MIMO models. You can: • Select any input channel to display the responses from only that input. • Select any output channel to display the responses only to that output. • Select All to display the I/O responses from all inputs to all outputs. • Select individual I/O response channels. You can multiselect channels by holding down the Shift key while selecting the channels, or by rubberbanding a box around a selected set of I/O response markers on the grid. For example, select Elevator to display the responses from only this input. Notice that the name of this input is now highlighted in red in the I/O Selector window. 6-27 6 The LTI Viewer With the Axes Grouping set to None, the display looks like this. Note: To reset the Axes Grouping to None, open the right-click menu on the plot region, and select None. The Right-Click Menu for LTI Arrays When you load an LTI array into the LTI Viewer, all models in the LTI array are initially displayed. Using the Select from LTI Array menu item available to you through the right-click menu, you can choose to display the plots from a subset of the models in any LTI array in the LTI Viewer workspace, while hiding the plots of the other models. The Select from LTI Array menu item opens the Model Selector for LTI Arrays window. 6-28 The Right-Click Menus For a given LTI array in the LTI Viewer workspace, you can use this interface to display the plots of a subset of models in the LTI array, using either or both of the following options: • Indexing into the array dimensions • Indexing into the array through design specification criteria In order to have access to right-click menu item for LTI arrays, you must have at least one LTI array loaded in the LTI Viewer workspace. For example, type load LTIexamples ltiview('step',m2d) m2d is a 2-by-3 array of two-output, one-input models. Your LTI Viewer looks like this. Notice that for each I/O map in m2d, the step responses of all of the models are plotted in the same plot region. 6-29 6 The LTI Viewer To display the responses of only some of the models in the LTI array, you must first complete the following two steps: 1 Right-click anywhere in the plot region to open the following right-click menu. Figure 6-13: Right-Click Menu for LTI Arrays 2 Select the Select from LTI Array menu item. 6-30 The Right-Click Menus This opens the Model Selector for LTI Arrays window in the (default) Index into Dimensions setup. This tab lists all LTI arrays in the LTI Viewer. You only apply selection criteria to one LTI array at a time. Each listbox corresponds to a dimension of the LTI array. The number of entries in each listbox is the same as the number of models along the corresponding dimension. Each numbered entry in a given listbox represents the indices for each dimension of the selected LTI array. There are two selection criteria you can use to index into the LTI array: Index into Dimensions and Bound on Characteristics. You can apply either or both of these methods (at once) to index in to the LTI array. You can use these tabs to show all of the models in the LTI array, or show or hide selected ones as you index into the dimensions of the LTI array. You can use the mouse or the textbox to select or deselect models in a listbox that indexes into a particular dimension. Your choice of models is reflected in the LTI Viewer display (once you press OK or Apply). Figure 6-14: LTI Array Model Selector for a 2-by-3 Array of Models The Model Selector for LTI Arrays For any of the LTI arrays loaded into the LTI Viewer workspace, you can use the Model Selector for LTI Arrays window to display the responses of only a subset of the models in the LTI array. To do this, you must first select the LTI array name from the Arrays pull-down tab. 6-31 6 The LTI Viewer Once you have selected the name of an LTI array in the Model Selector for LTI Arrays window, you can select models in the LTI array whose response plots you want displayed using either or both of the following: • Index into the array dimensions of the LTI array (Index into Dimensions) • Index into LTI array using design specification criteria (Bound on Characteristics) Indexing into the Array Dimensions of an LTI Array To index into the array dimensions of an LTI Array: 1 Select Index into Dimensions in the Selection Criteria listbox. This item is initially selected for you by default. 2 Leave the show selected tab as is (or change it to hide selected). This allows you to use your mouse or the textboxes to index into each dimension of the LTI array. 3 Select indices of models whose plots you want displayed (or hidden) using the listboxes corresponding to the dimensions of the LTI array by either: - Using your mouse (using the Control key for multiselection) to select model indices from each array dimension of the LTI array (from each listbox) - Typing a vector of indices or any MATLAB expression that specifies a vector of indices in the textbox below the listbox 4 Select Apply to implement your model selection choice without closing the window, or OK to implement your model selection choice and close the Model Selector for LTI Arrays window. Note: Choosing the show all tab while in the Indexing into Dimensions selection criterion is equivalent to selecting all of the indices in the listboxes. However, any previous selections you made using the Indexing into Dimensions selection criterion are not lost. They can be reinstalled by applying show selected. 6-32 The Right-Click Menus For example to display only the first row of models in the 2-by-3 LTI array m2d, either: • Select the first index in the first listbox (corresponding to the first dimension of the LTI array) with your mouse. • Type the vector [1] in the textbox below the first listbox. The following figure depict the Model Selector for LTI Arrays window for selecting to display the responses of the first row of models in the LTI array m2d. Select OK or Apply to implement your LTI array model Figure 6-15: LTI Array Model Selector to Select the First Row of m2d The next figure shows the LTI Viewer display that results from selecting Apply or OK. 6-33 6 The LTI Viewer The plots of only three models (as opposed to the six models in the LTI array) are shown here. Figure 6-16: Step Response of the First Row of Models in m2d There are a variety of ways you can index into the dimensions of an LTI array using the textboxes located below each listbox. You can type both logical expressions, or ones that define indices directly. For example, suppose you have a variable p defined in the MATLAB workspace, representing a vector of parameters associated with the second dimension of m2d. p = [1.1 5.3 10] The variable p might, for example, represent three different operating conditions for which you created the LTI array. To select indices specified by these parameters in the second array dimension of m2d, you can, for example, type the following under the second listbox. p>5 % Choose the 2nd and 3rd indices in the 2nd array dim. of m2d or find(p<2) 6-34 % Choose the 1st index in the 2nd array dim. of m2d The Right-Click Menus Indexing into the LTI Array Using Design Specification Criteria You can also use several plot-specific design criteria to select those models in the LTI array whose responses you want displayed. You index into the LTI array through these design criteria (response plot characteristics) using Boolean expressions. To plot selected models by indexing into the LTI array in this manner: 1 Select show all in the Index into Dimensions set-up, and select Apply. This step is not required, but if you don’t do this, then any indexing into design specifications you perform applies only to the models whose plots are selected to be displayed using Index into Dimensions. 2 Select Bound on Characteristics in the Selection Criteria listbox. The right side of the interface now reflects the plot-specific design specification characteristics available for you to select models from. Always select Apply or OK to implement your selection. You can index into specific design criteria by selecting any (or all) of the checkboxes next to the listed criteria. This allows you to type MATLAB logical expressions in the corresponding textboxes. Figure 6-17: Selector for LTI Arrays Using Design Specification Criteria 3 Select the checkbox next to a design specification characteristic you want to index through. 6-35 6 The LTI Viewer 4 Position your mouse pointer in the textbox next to the design specification characteristic. 5 Type a MATLAB relational expression in the textbox, using $ as a variable name in the expression. Note that for arrays of MIMO models, you can consider $ to be an Ny-by-Nu matrix, if each model in the LTI array has Ny outputs and Nu inputs. This allows you to specify different requirements on different I/O channels. 6 Press Apply to implement your indexing selection. For example, to display only the plot of the model with the maximum rise time in the step response from the input to the first output, type $(1,1) == max($(1,1)) in the textbox next to Rise Time. Figure 6-18: Specifying Design Criteria to Select Models in the LTI Array After selecting the Apply button, your LTI Viewer displays only the step response of the model with the maximum rise time in the step response from the input to the first output. The result of your action is displayed on the status bar. 6-36 The Right-Click Menus The step response of the model in the (2,3) position of the LTI array is displayed. Figure 6-19: Step Response of the Model with the Maximum Rise Time You can also use any logical expression in variables defined in the MATLAB workspace to index into a specific design criterion. For example, typing $(2,1) < 7.25 & $(1,1) > 1.2 next to Steady State (after unchecking Rise Time), displays the responses of any models for which the steady-state response has a value less than 7.25 for in the second I/O channel, and greater than 1.2 in the first. Suppose you have a design specification requirement for each I/O map of each model of the LTI array, and store this requirement in a matrix q in the MATLAB workspace. For example, if q is an Ny-by-Nu matrix (2-by-1, in this case), and N is the number of models in the LTI array (6, in this case), then you can type N = 6; Q = repmat(q,[1,1,N]); 6-37 6 The LTI Viewer at the MATLAB command line, and $ > any(any(Q)) in the Model Selector for LTI Arrays window. This displays only the plots of those models for which the required bound is not satisfied on any of the I/O channels. You must use the any command twice, once for each I/O dimension. Typing $>Q would only display the plots of those models for which is bound is not satisfied on all of the I/O channels. 6-38 The LTI Viewer Tools Menu The LTI Viewer Tools Menu Three preferences windows provide additional options for customizing the LTI Viewer display. You can access these windows from the Tools menu. The preference windows you can access from the Tools menu are: • Viewer Configuration—To change the number and type of plots displayed by the LTI Viewer • Response Preferences—To set various parameters such as the ranges of values for the response plot time and frequency scales • Linestyle Preferences—To set options for changing linestyles, colors, and markers for all of the response curves Viewer Configuration Window Select the Viewer Configuration menu item under the Tools menu. The following window opens the Available LTI Viewer Configurations window. Select one of these six plot configuration radio buttons, and then select the corresponding response plot types to be mapped to that configuration. Choose response plot types to correspond to your chosen plot configuration here. Each of these pull-down tabs lists all of the possible plot types. Figure 6-20: The Available LTI Viewer Configurations Window For example, load the model ssF8 into the LTI Viewer workspace (see “The Right-Click Menu for MIMO Models” on page 6-21 for instructions on how to 6-39 6 The LTI Viewer load this model). With the Available LTI Viewer Configurations window open: 1 Select the radio button for the two-plot configuration. 2 Use the pull-down tab next to 1. to set the first plot to nyquist. 3 Use the pull-down tab next to 2. to set the second plot to bode. 4 Select OK. With the ssF8 model loaded, the LTI Viewer now displays two plot types on separate plots: Response Preferences When you select Response Preferences from the Tools menu, the Response Preferences window shown below opens. 6-40 The LTI Viewer Tools Menu Select Define to define your own time or frequency vectors in the editable text boxes. Select Define to define your own vertical axis range. Edit these text boxes to customize the response characteristics for step response plots. Use these radio buttons to change units on Bode and sigma plots. Always press OK or Apply to execute window options. Figure 6-21: Response Preferences Window You can use the Response Preferences window to: • Specify the time duration for time domain response plots and the frequency range for frequency domain response plots. • Choose units for plotting the magnitude, phase, and frequency of Bode plots. This choice of units also assigns the magnitude and frequency units for singular value (sigma) plots. • Specify vertical axis limits for time domain responses. • Set target percentages for settling time and rise time calculations on step response plots. Setting Response Time Durations and Frequency Ranges To get a smoother time domain response curve over a specified time duration, you can override the default time range and reset the time vector to a desired 6-41 6 The LTI Viewer value. You can use the Time vector (sec.) portion of the Time Domain field shown below to do this. The Time vector (sec.) field accepts one, two, or three arguments, separated by colons and surrounded by square brackets: • [Tf] specifies only the final time. • [Ti:Tf] specifies the initial and final time. • [Ti:dt:Tf] specifies the initial and final time and provides the incremental step dt to use when generating the time vector. The Generate automatically radio button is selected when you initially open this window. With this option selected, the LTI Viewer automatically determines the time vector to use for plotting the response. To override the default setting: 1 Select the Define radio button. 2 Enter the desired final time Tf or the new time vector as [Ti:dt:Tf] as described previously. 3 Select either: - Apply to keep the Response Preferences window open when you apply these changes - OK to apply the changes and close the Response Preferences window You can also use this window for setting: • The Y-axis Range section of the Time Domain field to override the vertical axis default settings: Enter the desired vertical axis limit as a row vector of the lower and upper axis limit. • The Frequency vector (rad/sec.) section of the Frequency Domain field: Enter the desired frequencies as if they were the input arguments of the logspace function. 6-42 The LTI Viewer Tools Menu The Frequency vector (rad/sec.) field also provides you with the option to recalculate a new frequency vector for each frequency response type. When this checkbox is selected along with Generate automatically, a new frequency vector and response is calculated each time you toggle between different frequency responses, e.g.from Bode to Nyquist. If you deselect the Recalculate for each response type checkbox, the frequency vector used to calculate the previous frequency response is used and the frequency response data is simply converted to the new response type. Note: Whenever you override any of the default settings in the Response Preferences window, the values you enter are used on each plot, and during every applicable response calculation. Customizing Step Response Specifications You can also use the Response Preferences window to customize the percentage values used in the step response settling time or rise time calculation. The settling time percentage value determines the time after which the envelope of the step response remains within that percentage of the steady state value of the step response. The rise time percentages are marked by two values. These determine the time it takes for the step response to increase from the first percentage value to the second percentage value of the steady state step value response. The default values for these step response characteristics are: • 2% of the steady state value for settling time • 10% to 90% of the steady state value for rise time You can use the editable text box in the Plot Option section of the Time Domain field shown below to change the percentages for the settling time or 6-43 6 The LTI Viewer rise time. For example, you can change the value for the settling time to 5% as shown below. Figure 6-22: Changing the Settling Time Percentage Value to 5% Changing the Frequency Domain Plot Units In addition to providing options for specifying the frequencies used in the frequency responses, the Frequency Domain field allows you to choose the units used for Bode plots and singular value (sigma) plots. You can use the radio buttons in the Frequency Domain field shown below to override the default units for these plots. By default, the LTI Viewer plots: • Magnitude in decibels • Phase in degrees • Frequency in radians per second Linestyle Preferences You can use the controls in the Linestyle Preferences window to modify the response curve plot styles. To do this: 1 Open the Tools menu. 2 Select Linestyle Preferences. 6-44 The LTI Viewer Tools Menu After selecting Linestyle Preferences from the Tools menu, the following Linestyle Preferences window opens. Distinguish multiple response curves according to any of these four characteristics. If you select a line property, you can use the arrow buttons next to one of the three selected line property listboxes to rearrange the order of the entries in that listbox. Distinguish multiple response curves by either of these three line properties, or not at all. The default linestyle preferences are selected. Always press OK or Apply to execute window functions. Figure 6-23: The Linestyle Preferences Window You can use the Linestyle Preferences window to: • Select the property used to distinguish the response curves for different LTI models, inputs, outputs, or I/O channels. • Change the order in which the line properties are applied. The settings you select in the Linestyle Preferences window override any plot styles you may have entered in the original ltiview command. To distinguish multiple response curves in each of the plot regions, you can distinguish the plotted response curves using combinations of any of the following preferences: • Colors (red, blue, green, etc.) • Markers (circles, crosses, etc.) • Linestyle, the type of curve drawn (solid, dashed, etc.) 6-45 6 The LTI Viewer You can designate that the chosen preference (color, marker, or linestyle) distinguish the plotted response curves by any (or all) of the following. • Systems: The line properties vary with the models. • Inputs: The line properties vary with the input channels. • Outputs: The line properties vary with the output channels. • Channels: The line properties vary with the I/O channels. Changing the Response Curve Linestyle Properties You can use the radio buttons in the Distinguish by field of the Linestyle Preferences window to vary a line property by model, input, output, or I/O channel. When you open the Linestyle Preferences window, the radio button in the Systems row and Color column of the Distinguish by field is selected and the radio buttons in the No Distinction column are selected in the remaining rows. This is the default setting for the plot styles used for all of the response plots. For example, to distinguish the responses from different inputs of a MIMO model using different linestyles (in addition to distinguishing multiple models by color): 1 Select the radio button in the Inputs row and Linestyle column. As soon as you select this radio button, the previously selected radio button in the Inputs row is turned off, as shown in the figure below. The radio buttons are mutually exclusive along each row and each column with the exception of the No Distinction column. In other words, you can use only one line property to distinguish the different systems, inputs, outputs, or channels, and that same property cannot be applied to any other row of the Linestyle Preferences window. 6-46 The LTI Viewer Tools Menu 2 Select either: - Apply to keep the Linestyle Preferences window open when you apply these changes - OK to apply the changes and close the Linestyle Preferences window The Order in which Line Properties are Assigned You can determine the order in which the line properties are applied to models (or inputs, outputs, or I/O channels) by referring to the order of the line properties in the listboxes. The three listboxes tell you the default order in which each of the line properties will be applied. For example, look at the Linestyle Order listbox and notice that the responses from the first input will be plotted with a solid line, and the second input with a dashed line. If, for example, (while Linestyle is assigned to distinguish models by inputs), you want to plot the response from the first input with dashed lines and those from the second input with dotted lines, you can use the up and down arrows to the left of each listbox to reorder the entries in the listboxes. The figure below shows the up and down arrows and the Linestyle Order listbox. To change any listbox order: 1 Select the line property you want to move in the list. 2 Press the up and down arrows to the left of that listbox to move the highlighted property in the desired direction within the listbox. 6-47 6 The LTI Viewer Simulink LTI Viewer If you have Simulink, you can use the Simulink LTI Viewer, a version of the LTI Viewer that performs linear analysis on any portion of a Simulink model. The Simulink LTI Viewer features: • Drag-and-drop blocks that identify the location for the inputs and outputs of the portion of a Simulink model you want to analyze. • The ability to specify the operating conditions about which the Simulink model is linearized for analysis in the LTI Viewer. • Access to all time and frequency response tools featured in the LTI Viewer. • The ability to compare a set of (linearized) models obtained by varying either the operating conditions or some model parameter values. Using the Simulink LTI Viewer To learn about the Simulink LTI Viewer, we will perform some analysis on a Simulink model for a van der Pol oscillator. To open this model, type vdp at the MATLAB prompt. This brings up the following diagram: 6-48 Simulink LTI Viewer Notice that the title of this Simulink model is vdp, and that it contains static nonlinearities. A Sample Analysis Task Suppose you want to: • Analyze the Bode plot of the linear response between the input x2 to the Product block and the output x1 of the second Integrator block. • Determine the effect of changing the value of the Gain block labeled Mu on this response. 6-49 6 The LTI Viewer The basic procedure for carrying out this type of analysis is outlined below: 1 Open the Simulink LTI Viewer. 2 Specify your analysis model: a Specify the portion of the Simulink model you want to analyze. This involves using special Simulink blocks to locate the inputs and outputs of this analysis model on your Simulink diagram. b Set the operating conditions for linear analysis (optional). If your Simulink model includes nonlinear components, the Simulink LTI Viewer linearizes the model around the specified operation point. The default operating conditions have all state and input values set to zero. c Modify any Simulink model block parameters (optional). 3 Perform linear analysis with the Simulink LTI Viewer: a Import a linearized analysis model to the Simulink LTI Viewer. b Analyze the Bode plot. c Specify a second analysis model by changing the value of the Gain block, Mu. d Import the second linearized analysis model, and compare the Bode plots of the two linearized analysis models. 4 Save the analysis models for future use. In the remaining sections of this chapter, we explain how to carry out each of these steps on the van der Pol oscillator example. Opening the Simulink LTI Viewer To open a Simulink LTI Viewer linked to the vdp Simulink model: 1 Go to the Tools menu on the Simulink model. 2 Select Linear Analysis. 6-50 Simulink LTI Viewer When you select Linear Analysis, two new windows open: an LTI Viewer window and a Simulink diagram called Model_Inputs_and_Outputs containing two blocks: Input Point and Output Point. The following figure depicts how to open the Simulink LTI Viewer. 6-51 6 The LTI Viewer Select Linear Analysis from the Simulink model Tools menu to open the Simulink LTI Viewer. This set of Simulink blocks opens when you select Linear Analysis. Use these blocks to specify the inputs and outputs of the portion of the Simulink model you want to analyze. Your Tools menu may differ from this one, depending on your options. Plot region The Simulink LTI Viewer includes an additional menu for acquiring the analysis model from Simulink, specifying the operating points, or removing all the Input and Output Point blocks. The Simulink LTI Viewer differs from the regular LTI Viewer, in that: 6-52 Simulink LTI Viewer • The title bar shows the name of the Simulink model to which it is linked. • The menu bar contains an additional menu called Simulink that contains the following items: - Get Linearized Model linearizes the Simulink model and imports the resulting linearized analysis model to the LTI Viewer. Each time you select this menu item, a new version of the linearized analysis model is added to the Simulink LTI Viewer workspace. - Set Operating Point allows you to set or reset the operating conditions. - Remove Input/Output Points clears all Input Point and Output Point blocks from the diagram. Specifying the Simulink Model Portion for Analysis To specify the portion of the Simulink model you want to analyze, mark its input and output signals on the Simulink model using the Input Point and Output Point blocks in the Model_Inputs_and_Outputs window. This defines an input/output relationship that is linearized and analyzed by the LTI Viewer. Adding Input Point or Output Point Blocks to the Diagram To designate the input and output signals of your analysis model, insert Input Point and Output Point blocks on the corresponding signal lines in your Simulink diagram. For example, to insert an Input Point block on the Simulink model: 1 Grab the Input Point block in the Model_Inputs_and_Outputs window by clicking on the block and holding the mouse button down. 2 Drag the block to your Simulink model and place it over the line associated with the desired signal. 3 Release the mouse button. The block should automatically connect to the line. 4 If the block fails to connect (this may occur, for example, when the line is too short), resize the line and double-click on the block to force the connection. 6-53 6 The LTI Viewer To set up the analysis model for the vdp Simulink model: 1 Insert an Input Point block on the line labeled x2 going into the Product block. 2 Insert an Output Point block on the line entering the Outport block, Out1. This results in the following diagram. 6-54 Simulink LTI Viewer Grab an Input Point block, drag it, and release it on the Simulink model here. . 6-55 6 The LTI Viewer Keep the following in mind when using the Input Point and Output Point blocks to specify analysis models: • You must place at least one Input Point block and one Output Point block somewhere in the diagram in order to specify an analysis model. • You can place the Input Point and Output Point blocks on any scalar or vector signal line in the Simulink model, with the exception of signal lines connected to any block in the Power System Blockset. • You can insert Input Point and Output Point blocks at different levels of a Simulink model hierarchy. • There is no limit on the number of these blocks you can use. Removing Input Points and Output Points There are two ways you can remove Input Point or Output Point blocks from the Simulink model: 1 One by one: Select the Input Point or Output Point block you want to remove and delete it as you would any other Simulink block. 2 All at once: To remove all Input Point and Output Point blocks, select Remove Input/Output Points from the Simulink menu in the LTI Viewer. When you delete an Input Point or an Output Point block, the signal lines coming into and out of this block are automatically reconnected. Specifying Open- Versus Closed-Loop Analysis Models Placing the Input Point and Output Point blocks on your Simulink model does not break any connection or isolate any component. As a result, the Simulink LTI Viewer performs closed-loop analysis whenever your diagram contains feedback loops. This may sometimes lead to counter-intuitive results, as is illustrated by the next example. 6-56 Simulink LTI Viewer Consider the following simple diagram. Delete this line to isolate the plant, P, for open loop analysis. Based on the location of the Input Point and Output Point blocks, you might think that the analysis model specified by these blocks is simply the plant model, P. However, due to the feedback loop, this analysis model is actually the closed-loop transfer function P ⁄ ( 1 + PK ) . If you want to analyze the (open-loop) plant P instead, you need to open the loop, for example, by deleting the line between the Sum and Input Point blocks. Setting the Operating Conditions If you have nonlinear components in your Simulink model, the Simulink LTI Viewer automatically linearizes them when you select Get Linearized Model. The Simulink LTI Viewer uses the initial state values you set in the Simulink diagram as default settings for linearization points for the states in the diagram. The default input values for this linearization are zero. You also have the option to linearize about the operating conditions of your choice. If you want your analysis model to be linearized about zero state, or other state and input operating conditions, follow these steps before selecting Get Linearized Model: 6-57 6 The LTI Viewer 1 Select Set Operating Point in the Simulink menu. This opens the Operating Point window. When you select this radio button, the Simulink LTI Viewer uses zero state values for each linearization. The default setting for the Operating Point window uses initial states from the Simulink diagram. Select either of the other two radio buttons to set all state values for linearization to zero, or choose some other values. When you have inputs in your Simulink model, you can set linearization values for them here. When you select this radio button, the Simulink LTI Viewer uses the values in the textboxes for each linearization, unless you change these. Edit the operating point values in the textboxes provided. Figure 6-24: The Operating Point Window for Changing Linearization Points 2 Change the radio button selection to either: - Set all state values for the linearization to zero. - Define your own state values for the linearization. 3 Use the white textboxes to specify the operating conditions for each input (and state) listed in the Operating Point window. You don’t have to specify the states if you choose the Zero state values radio button. 6-58 Simulink LTI Viewer 4 Select OK. A dialog box opens. a Selecting Yes closes the Operating Point window and linearizes the model automatically. The new operating conditions you selected remain in effect for any future linearizations. b Selecting No closes the Operating Point window without linearizing the model. The new operating conditions you selected remain in effect for any future linearizations. c Selecting Cancel closes the dialog box and returns you to the Operating Point window without linearizing the model or changing operating conditions. 6-59 6 The LTI Viewer For this example, we use the Zero initial states setting, shown in the figure below. Choose this menu on the Simulink LTI Viewer to set the operating conditions. Edit the operating point values here. Simulink path name for the state variables Selecting OK opens a dialog box, asking you to accept the changes you made to the operating conditions and linearize the model with these operating conditions. Selecting Cancel closes this window without implementing any changes to the operating conditions. Note the following: • The inputs listed on the Operating Point window correspond to the Inport blocks on the top level of your Simulink model. • All states and inputs in the Simulink diagram are listed in this window, not just those associated with your analysis model. • If you want to change the operating conditions, you need only change those values associated with your analysis model. • While the Operating Point window is in the User-defined initial state values mode, the values listed in the Operating Point window remain in effect throughout your Simulink LTI Viewer session unless you change these. 6-60 Simulink LTI Viewer • While the Operating Point window is in the Initial state in Simulink diagram mode, the linearization values used by the Simulink LTI Viewer are updated as you change any state values in your Simulink diagram. • To use the MATLAB command line to change Simulink diagram initial state values - Select Parameters under the Simulation menu on your Simulink diagram. - Choose the Workspace I/O tab in the Simulation Parameters window. - Load initial states from the MATLAB workspace using the appropriate textbox. Modifying the Block Parameters You have the option of modifying any of your Simulink model block parameters, such as Gain block gain values or LTI block poles and zeros, before you import your analysis model into the Simulink LTI Viewer. Performing Linear Analysis Once you have specified your analysis model, you are ready to analyze it with the Simulink LTI Viewer. Let’s use the Simulink LTI Viewer to compare the Bode plots of two different linearized analysis models. The procedure for carrying out this analysis on the van der Pol example involves: • Importing a linearized analysis model to the Simulink LTI Viewer. • Analyzing the Bode plot of the linearized analysis model. • Specifying another analysis model. • Importing the second linearized analysis model to compare the Bode plots of both linearized analysis models. 6-61 6 The LTI Viewer Importing a Linearized Analysis Model to the LTI Viewer To linearize and load your first analysis model for the van der Pol example into the LTI Viewer, select Get Linearized Model on the Simulink menu on the LTI Viewer. This produces the following response plot: The LTI Viewer displays the selected response plot for all of the models in the LTI Viewer workspace. These are listed in the Systems menu available by right-clicking in the plot region. The default plot type is step response. Each time you select Get Linearized Model in the LTI Viewer’s Simulink menu: • The linearized analysis model is imported into the LTI Viewer workspace. • The step response of the linearized analysis model is the default plot type displayed. 6-62 Simulink LTI Viewer You can view the linearized models in the LTI Viewer workspace or change the plot type using the right-click menus. See “The Right-Click Menus” on page 6-18 for more information. Analyzing the Bode Plot of the Linearized Analysis Model To analyze the Bode plot for this model, 1 Right-click anywhere in the plot region. 2 Select the Plot Type menu, and then the Bode submenu item. Specifying Another Analysis Model Once an analysis model is specified on a Simulink diagram, you can specify other analysis models from the same Simulink diagram in one of the following three ways: • Modify any of the model parameters. • Change the operating conditions. • Change the location of any of the Input Point or Output Point blocks. For the van der Pol example, we want to create a second analysis model by modifying a model parameter. Specifically, we modify the Gain block labeled Mu. To do this: • Return to the Simulink model, and open the Mu Gain block by double-clicking on it. • Change the gain to 10; click on OK. Comparing the Bode Plots of the Two Linearized Analysis Models Having just specified a new analysis model, let’s load its linearization into the LTI Viewer and compare the Bode plots of the two models. To do this, reselect the Get Linearized Model menu item under Simulink on the LTI Viewer. 6-63 6 The LTI Viewer As is shown below, the linearized model for the new value of Mu appears as the last item in the Systems submenu, and the Bode plots for both models are displayed. After reselecting Get Linearized Model, the Systems submenu contains two model names with different version numbers. The Bode plots for both models are displayed in different colors. As you might expect, changing the gain alters the Bode plot. 6-64 Simulink LTI Viewer Notice the following about the models listed in the Systems list on the right-click menu: • The names reflect the title of the Simulink model. • The version number is incremented every time Get Linearized Model is selected. • The LTI Viewer simultaneously displays the response plots of all of the checked models listed. Saving Analysis Models The analysis models obtained each time you select Get Linearized Model are stored only in the Simulink LTI Viewer workspace. You can save these models into the main MATLAB workspace by selecting Export from the Simulink LTI Viewer File menu. Selecting Export opens the window shown below. Store the selected analysis model in a MAT-file. Store the selected analysis model in the MATLAB workspace. Lists all the analysis models currently in the Simulink LTI Viewer workspace. 6-65 6 The LTI Viewer To export analysis models from the LTI Viewer workspace: 1 Highlight the models you want to save in the Export List. (You can multiselect models on the list by holding down the control key while selecting list items). 2 Save the selected models by clicking on the appropriate button on this GUI. You can export the linearized models to either: a A MAT-file b The MATLAB workspace Note: If you save models to a MAT-file, you are prompted to name the file. The variable names contained in that file are the same as those you selected from the Export List. The variable names of each model you save to the MATLAB workspace are also the same as those listed in the Export List. It’s up to you to modify the names of these variables after you’ve saved them. 6-66 7 Control Design Tools Root Locus Design . . . . . . . . . . . . . . . . . 7-3 Pole Placement . . . . . . State-Feedback Gain Selection State Estimator Design . . . Pole Placement Tools . . . . . . . . . . . . . . . . . . . . . . . . . . . . . . . . . . . . . . . . . . . . . . . . . . . . . . . . 7-5 7-5 7-5 7-6 LQG Design . . . . . . . Optimal State-Feedback Gain Kalman State Estimator . . . LQG Regulator . . . . . . LQG Design Tools . . . . . . . . . . . . . . . . . . . . . . . . . . . . . . . . . . . . . . . . . . . . . . . . . . . . . . . . . . . . . . . . . . . . . . 7-8 7-9 7-9 7-10 7-10 7 Control Design Tools We use the term control system design to refer to the process of selecting feedback gains in a closed-loop control system. Most design methods are iterative, combining parameter selection with analysis, simulation, and physical insight. The Control System Toolbox offers functions to: • Design the control system gains using either classical root locus techniques or modern pole placement and LQG techniques. • Close the loop for simulation and validation purposes. 7-2 Root Locus Design Root Locus Design The root locus method is used to describe the trajectories of the closed-loop poles of a feedback system as one parameter varies over a continuous range of values. Typically, the root locus method is used to tune a feedback gain so as to specify the closed-loop poles of a SISO control system. Consider, for example, the tracking loop r + P( s ) y – k H(s) where P ( s ) is the plant, H ( s ) is the sensor dynamics, and k is a scalar gain to be adjusted. The closed-loop poles are the roots of q ( s ) = 1 + k P ( s )H ( s ) The root locus technique consists of plotting the closed-loop pole trajectories in the complex plane as k varies. You can use this plot to identify the gain value associated with a given set of closed-loop poles on the locus. The command rltool opens the Root Locus Design GUI. In addition to plotting the root locus, the Root Locus Design GUI can be used to design a compensator interactively to meet some system design specifications. The Root Locus Design GUI can be used to: • Analyze the root locus plot for a SISO LTI feedback loop • Specify feedback compensator parameters: poles, zeros, and gain • Examine how the compensator parameters change the root locus, as well as various open and closed-loop system responses (step response, Bode plot, Nyquist plot, or Nichols chart) Chapter 8 provides more detail on the Root Locus Design GUI. 7-3 7 Control Design Tools If you are interested in just the root locus plot, use the command rlocus. This command takes one argument: a SISO model of the open loop system, created with ss, tf, or zpk. In the tracking loop depicted on the previous page, this model would represent P ( s )H ( s ) . You can also use the function rlocfind to select a point on the root locus plot and determine the corresponding gain k . The following table summarizes the commands for root locus design. Root Locus Design 7-4 pzmap Pole-zero map. rltool Root Locus Design GUI. rlocfind Interactive root locus gain selection. rlocus Evans root locus plot. sgrid Continuous ω n, ζ grid for root locus. zgrid Discrete ω n, ζ grid for root locus. Pole Placement Pole Placement The closed-loop pole locations have a direct impact on time response characteristics such as rise time, settling time, and transient oscillations. This suggests the following method for tuning the closed-loop behavior: 1 Based on the time response specifications, select desirable locations for the closed-loop poles. 2 Compute feedback gains that achieve these locations. This design technique is known as pole placement. Pole placement requires a state-space model of the system (use ss to convert other LTI models to state space). In continuous time, this model should be of the form · x = Ax + Bu y = Cx + Du where u is the vector of control inputs and y is the vector of measurements. Designing a dynamic compensator for this system involves two steps: state-feedback gain selection, and state estimator design. State-Feedback Gain Selection Under state feedback u = – Kx , the closed-loop dynamics are given by · x = ( A – BK ) x and the closed-loop poles are the eigenvalues of A – BK . Using pole placement algorithms, you can compute a gain matrix K that assigns these poles to any desired locations in the complex plane (provided that ( A, B ) is controllable). State Estimator Design You cannot implement the state-feedback law u = – Kx unless the full state x is measured. However, you can construct a state estimate ξ such that the law u = –Kξ retains the same pole assignment properties. This is achieved by designing a state estimator (or observer) of the form 7-5 7 Control Design Tools · ξ = Aξ + Bu + L ( y – Cξ – Du ) The estimator poles are the eigenvalues of A – LC , which can be arbitrarily assigned by proper selection of the estimator gain matrix L . As a rule of thumb, the estimator dynamics should be faster than the controller dynamics (eigenvalues of A – BK ). Replacing x by its estimate ξ in u = – Kx yields the dynamic output-feedback compensator · ξ = A – LC – ( B – LD )K ξ + Ly u = – Kξ Note that the resulting closed-loop dynamics are · x A – BK BK = · 0 A – LC e x , e e = x–ξ Hence, you actually assign all closed-loop poles by independently placing the eigenvalues of A – BK and A – LC . Pole Placement Tools The Control System Toolbox contains functions to: • Compute gain matrices K and L that achieve the desired closed-loop pole locations • Form the state estimator and dynamic compensator using these gains 7-6 Pole Placement Pole Placement acker SISO pole placement. estim Form state estimator given estimator gain. place MIMO pole placement. reg Form output-feedback compensator given state-feedback and estimator gains. The function acker is limited to SISO systems and should only be used for systems with a small number of states. The function place is a more general and numerically robust alternative to acker. Caution: Pole placement can be badly conditioned if you choose unrealistic pole locations. In particular, you should avoid: • Placing multiple poles at the same location • Moving poles that are weakly controllable or observable. This typically requires high gain, which in turn makes the entire closed-loop eigenstructure very sensitive to perturbations. 7-7 7 Control Design Tools LQG Design Linear-Quadratic-Gaussian (LQG) control is a modern state-space technique for designing optimal dynamic regulators. It enables you to trade off regulation performance and control effort, and to take into account process and measurement noise. Like pole placement, LQG design requires a state-space model of the plant (use ss to convert other LTI models to state space). This section focuses on the continuous-time case (see related Reference pages for details on discrete-time LQG design). LQG design addresses the following regulation problem. w y Plant u Regulator yv + v + The goal is to regulate the output y around zero. The plant is driven by the process noise w and the controls u , and the regulator relies on the noisy measurements y v = y + v to generate these controls. The plant state and measurement equations are of the form · x = Ax + Bu + Gw y v = Cx + Du + Hw + v and both w and v are modeled as white noise. The LQG regulator consists of an optimal state-feedback gain and a Kalman state estimator. You can design these two components independently as shown next. 7-8 LQG Design Optimal State-Feedback Gain In LQG control, the regulation performance is measured by a quadratic performance criterion of the form J( u ) = ∞ ∫0 { x T T T Qx + 2x Nu + u Ru } dt The weighting matrices Q, N, R are user specified and define the trade-off between regulation performance (how fast x ( t ) goes to zero) and control effort. The first design step seeks a state-feedback law u = – Kx that minimizes the cost function J ( u ) . The minimizing gain matrix K is obtained by solving an algebraic Riccati equation. This gain is called the LQ-optimal gain. Kalman State Estimator As for pole placement, the LQ-optimal state feedback u = – Kx is not implementable without full state measurement. However, we can derive a state estimate xˆ such that u = – Kxˆ remains optimal for the output-feedback problem. This state estimate is generated by the Kalman filter. · xˆ = Axˆ + Bu + L ( y v – Cxˆ – Du ) with inputs u (controls) and y v (measurements). The noise covariance data T T E ( ww ) = Q n , E ( vv ) = R n , T E ( wv ) = N n determines the Kalman gain L through an algebraic Riccati equation. The Kalman filter is an optimal estimator when dealing with Gaussian white noise. Specifically, it minimizes the asymptotic covariance T lim E ( ( x – xˆ ) ( x – xˆ ) ) t→∞ of the estimation error x – xˆ . u yv Kalman estimator xˆ 7-9 7 Control Design Tools LQG Regulator To form the LQG regulator, simply connect the Kalman filter and LQ-optimal gain K as shown below: w Plant y u u –K xˆ + Kalman filter v yv + LQG regulator This regulator has state-space equations · xˆ = A – LC – ( B – LD )K xˆ + Ly v u = – Kxˆ LQG Design Tools The Control System Toolbox contains functions to perform the three LQG design steps outlined above. These functions cover both continuous and 7-10 LQG Design discrete problems as well as the design of discrete LQG regulators for continuous plants. LQG Design care Solve continuous-time algebraic Riccati equations. dare Solve discrete-time algebraic Riccati equations. dlqr LQ-optimal gain for discrete systems. kalman Kalman estimator. kalmd Discrete Kalman estimator for continuous plant. lqgreg Form LQG regulator given LQ gain and Kalman filter. lqr LQ-optimal gain for continuous systems. lqrd Discrete LQ gain for continuous plant. lqry LQ-optimal gain with output weighting. See the case study on page 9-31 for an example of LQG design. You can also use the functions kalman and kalmd to perform Kalman filtering; see the case study on page 9-50 for details. 7-11 7 Control Design Tools 7-12 8 The Root Locus Design GUI Introduction . . . . . . . . . . . . . . . . . . . . 8-2 A Servomechanism Example . . . . . . . . . . . . 8-4 Controller Design Using the Root Locus Design GUI Opening the Root Locus Design GUI . . . . . . . . . Importing Models into the Root Locus Design GUI . . . Changing the Gain Set Point and Zooming . . . . . . Displaying System Responses . . . . . . . . . . . Designing a Compensator to Meet Specifications . . . . Saving the Compensator and Models . . . . . . . . . . . . . . . . . . . . . . 8-6 8-6 8-7 8-13 8-20 8-22 8-36 Additional Root Locus Design GUI Features . . Specifying Design Models: General Concepts . . . . Getting Help with the Root Locus Design GUI . . . . Erasing Compensator Poles and Zeros . . . . . . . Listing Poles and Zeros . . . . . . . . . . . . . Printing the Root Locus . . . . . . . . . . . . . Drawing a Simulink Diagram . . . . . . . . . . Converting Between Continuous and Discrete Models . Clearing Data . . . . . . . . . . . . . . . . . . . . . . . . . . . . . . . . . . . 8-38 8-38 8-39 8-41 8-41 8-44 8-44 8-45 8-46 . . . . . . . . . References . . . . . . . . . . . . . . . . . . . . . 8-48 8 The Root Locus Design GUI Introduction The root locus method is used to describe the trajectories in the complex plane of the closed-loop poles of a SISO feedback system as one parameter (usually a gain) varies over a continuous range of values. Along with the MATLAB command line function rlocus, the Control System Toolbox provides the Root Locus Design graphical user interface (GUI) for implementing root locus methods on single-input/single-output (SISO) LTI models defined using zpk, tf, or ss. In addition to plotting root loci, the Root Locus Design GUI is an interactive design tool that can be used to: • Analyze the root locus plot for a SISO LTI control system • Specify the parameters of a feedback compensator: poles, zeros, and gain • Examine how changing the compensator parameters effects changes in the root locus and various closed-loop system responses (step response, Bode plot, Nyquist plot, or Nichols chart) This chapter explains how to use the Root Locus Design GUI, in part, through an example involving an electrohydraulic servomechanism comprised of an electrohydraulic amplifier, a valve, and a ram. These types of servomechanisms can be made quite small, and are used for position control. Details on the modeling of electrohydraulic position control mechanisms can be found in [1]. After an explanation of the servomechanism control system, the following operations on the Root Locus Design GUI are covered in the section, “Controller Design Using the Root Locus Design GUI” on page 8-6: • Opening the Root Locus Design GUI • Importing models into the Root Locus Design GUI • Changing the gain set point and zooming • Displaying system responses • Designing the compensator to meet specifications: - Specifying the design region boundaries on the root locus - Placing compensator poles and zeros 8-2 Introduction - Editing the compensator pole and zero locations - Opening the LTI Viewer • Saving the compensator and models to the workspace or the disk Other important features listed below and not covered through this example are described in the section, “Additional Root Locus Design GUI Features” on page 8-38: • Specifying design models: general concepts • Getting help with the Root Locus Design GUI • Erasing compensator poles and zeros • Listing poles and zeros • Printing the root locus • Drawing a Simulink diagram of the closed-loop model • Converting between continuous and discrete models • Clearing data 8-3 8 The Root Locus Design GUI A Servomechanism Example A simple version of an electrohydraulic servomechanism model consists of: • A push-pull amplifier (a pair of electromagnets) • A sliding spool in a vessel of high pressure hydraulic fluid • Valve openings in the vessel to allow for fluid to flow • A central chamber with a piston-driven ram to deliver force to a load • A symmetrical fluid return vessel The force on the spool is proportional to the current in the electromagnet coil. As the spool moves, the valve opens, allowing the high pressure hydraulic fluid to flow through the chamber. The moving fluid forces the piston to move in the opposite direction of the spool. In [1], linearized models for the electromagnetic amplifier, the valve spool dynamics, and the ram dynamics are derived, and a detailed description of this type of servomechanism is provided. A schematic of this servomechanism is depicted below. Return Spool Push-pull amplifier Push-pull amplifier Pressure Hydraulic fluid Piston-driven ram Load If you want to use this servomechanism for position control, you can use the input voltage to the electromagnet to control the ram position. When measurements of the ram position are available, you can use feedback for the ram position control. 8-4 A Servomechanism Example A closed-loop model for the electrohydraulic valve position control can be set up as follows. Desired Ram Position + – K(s) G servo ( s ) Compensator Linearized Servomechanism Ram Position Figure 8-1: Feedback Control for an Electrohydraulic Servomechanism K(s) represents the compensator for you to design. This compensator can be either a gain or a more general LTI system. A linearized plant model for the electrohydraulic position control mechanism is given by 7 4 × 10 G servo ( s ) = -----------------------------------------------------------------------------2 4 s ( s + 250 ) ( s + 40s + 9 × 10 ) For this example, you want to design a controller so that the step response of the closed-loop system meets the following specifications: • The two-percent settling time is less than 0.05 seconds. • The maximum overshoot is less than 5 percent. For details on how these specifications are defined, see [2]. In the remainder of this chapter you learn how to use the Root Locus Design GUI. In the process, you design a controller to meet these specifications. 8-5 8 The Root Locus Design GUI Controller Design Using the Root Locus Design GUI In this section, we use the servomechanism example to describe some of the main Root Locus Design GUI features and operations: • Opening the Root Locus Design GUI • Importing models into the Root Locus Design GUI: - Opening the Import LTI Design Model window - Choosing a feedback structure - Specifying the design model • Changing the gain set point and zooming: - Dragging closed-loop poles to change the gain set point - Zooming - Storing and retrieving axes limits • Displaying system responses • Designing the compensator to meet specifications: - Specifying the design region boundaries on the root locus - Placing compensator poles and zeros: general information - Placing compensator poles and zeros using the root locus toolbar - Editing compensator pole and zero locations • Saving the compensator and models to the workspace or the disk Opening the Root Locus Design GUI To open the Root Locus Design GUI, at the MATLAB prompt type rltool 8-6 Controller Design Using the Root Locus Design GUI This brings up the following GUI. These are the main menus for importing/ exporting of models, and editing them. You can also perform discrete/continuous conversion. Compensator description: The default compensator is K=1. Root locus toolbar buttons to drag, add, or erase compensator poles and zeros, or to drag the closed-loop poles Plot region to display the root locus Toggle between positive/negative feedback. The feedback structure: Click on K to view/change the compensator, and on P, F, or H to view the design model characteristics. Edit the gain set point to change the closed-loop pole locations. Save/retrieve root locus axes limits and aspect ratios Zoom into or out of the root locus plot. Status bar for providing information Click on these boxes to open system response analysis tools. Importing Models into the Root Locus Design GUI The Root Locus Design GUI operates on SISO LTI models constructed using either tf, zpk, or ss (for detail on creating models, see “Creating LTI Models” in Chapter 2). 8-7 8 The Root Locus Design GUI There are four ways to import SISO LTI models into the Root Locus Design GUI: • Load a model from the MATLAB workspace. • Load a model from a MAT-file on your disk. • Load SISO LTI blocks from an open or saved Simulink diagram. • Create models using tf, ss, or zpk within the GUI. You can also use any combination of these methods to import models for root locus analysis and design. However, before you can import a model into the Root Locus Design GUI from the MATLAB workspace, you must have at least one SISO LTI model loaded into your workspace. Similar requirements hold for loading models from the disk or an open Simulink diagram. For this example, we import our servomechanism model for root locus analysis from the MATLAB workspace. You can find a zero-pole-gain model for G servo ( s ) in a set of LTI models provided in the file LTIexamples.MAT. To load these LTI models, at the MATLAB prompt type load LTIexamples The model for the position control system is contained in the variable Gservo. To view the information on this model, at the MATLAB prompt type Gservo Now that a model for G servo ( s ) is loaded into the workspace, you can begin your root locus analysis and design for this example. There are three steps involved in importing a model for our example covered in this section: • Opening the Import LTI Design Model window • Choosing a feedback structure • Specifying the design model 8-8 Controller Design Using the Root Locus Design GUI Opening the Import LTI Design Model Window To import the linearized electrohydraulic servomechanism model into the Root Locus Design GUI, first open the Import LTI Design Model window. To do this, select the Import Model menu item in the File menu. The Import LTI Design Model window that appears on your screen is as follows. 8-9 8 The Root Locus Design GUI Diagram of feedback structure Model listbox: lists available LTI models or blocks. Edit the name of the overall design model. This name appears on the title bar of the Root Locus Design GUI. F,P, and H compose the design model. Toggle button for the feedback structure SISO LTI models can be imported from either the workspace or disk. SISO LTI blocks can be imported from saved or open Simulink models. Click on the appropriate arrow to transfer a model from the list to a design model component. Variable names for the design model components appear here if you use the transfer arrows. You can also use tf, zpk, and ss to create a model in the text box. Choosing a Feedback Structure The Root Locus design tool can be applied to SISO LTI systems whose feedback structure is in one of the following two configurations. Default feedback structure 8-10 Controller Design Using the Root Locus Design GUI The Feedback Structure portion of the Import LTI Design Model window shows the current selection for the closed-loop structure. The Other button toggles the location of the compensator between the two configurations shown above. For this example you want the compensator in the forward path. Specifying the Design Model The SISO LTI models in either feedback configuration are coded as follows: • F represents a pre-filter. • P is the plant model. • H is the sensor dynamics. • K is the compensator to be designed. In terms of the GUI design procedure, once they are set, F, P, and H are fixed in the feedback structure. This triple, along with the choice of feedback structure, is referred to throughout this chapter as the design model. The default values for F, P, H, and K are all 1. When you specify your design model, in addition to F, P, H, and the feedback structure, you can specify the design model name. To name the design model, click in the editable text box in the Import LTI Design Model window below Name, and enter the name you want for the design model. For this example, change the design model name to Gservo. To specify F, P, and H for this example, we use the Workspace radio button, which is the default selection. A list of the LTI objects in your workspace appears in the model listbox under Workspace Contents. In general, to import design model components from the workspace to the GUI: 1 Select a given model in the Workspace Contents listbox to be loaded into either F, P, or H. 2 Click on the arrow buttons next to the design model component you want to specify. 8-11 8 The Root Locus Design GUI To specify the design model components for this servomechanism example: 1 Load the linearized servomechanism model Gservo into the plant P, by first selecting it and then selecting the arrow button. The Import LTI Design Model window looks like this after you specify both the plant, P, and the model name as Gservo. Use the arrow buttons to transfer selected models from the listbox to the design model components, in this case, to the plant, P. 2 Press the OK button. 8-12 Controller Design Using the Root Locus Design GUI The root locus of the design model is displayed in the plot region of the GUI. Your Root Locus Design GUI looks like this. The feedback structure selected in the Import LTI Design Model window The (red) squares are the closed-loop poles corresponding to the value of the compensator gain. . Notice that the design model name appears in the title bar. Changing the Gain Set Point and Zooming The gain set point is the value of the gain you apply to the compensator to determine the closed-loop poles. This value appears in the Gain text box on the GUI. In this section, we use some of the basic functions of the Root Locus Design GUI to analyze a root locus in the plot region. We cover how to change the gain set point, along with the closed-loop pole locations, and how to use the GUI zoom tools. Let’s begin by seeing how much gain you can apply to the compensator and still retain stability of the closed-loop system. The red squares on each branch of the root locus mark the locations of the closed-loop poles associated with the gain set point. The system becomes 8-13 8 The Root Locus Design GUI unstable if the gain set point is increased so as to place any of the closed-loop poles in the right-half of the complex plane. You can test the limits of stability by either: • Dragging the closed-loop poles around the locus to change the gain set point • Changing the gain set point manually In this example we do the former. Dragging Closed-loop Poles to Change the Gain Set Point To see by how much the gain can be increased while maintaining the closed-loop poles in the left-half of the complex plane: 1 Move the mouse pointer over a red square marking one of the complex poles nearest the imaginary axis. Notice how the pointer becomes a hand. 2 Grab the closed-loop pole by holding down the left mouse button when the hand appears. 3 Drag the pole close to the imaginary axis. 4 Release the mouse button. The gain changes as the closed-loop set point is recomputed. 8-14 Controller Design Using the Root Locus Design GUI The following two figures capture this procedure. As you get close to a closedloop pole on the locus, the mouse pointer becomes a hand. The poles appear to be on the imaginary axis. The right-most pair of closed-loop poles seem to be on the imaginary axis. Actually, they are only close. Let’s use the zoom controls to improve this result. Zooming You can use the Zoom controls on the lower right of the Root Locus Design GUI to zoom in on a region of the locus, or zoom out to show the entire locus. 8-15 8 The Root Locus Design GUI The Zoom controls are shown below. Zoom in the y-direction. Zoom in the x-direction. Zoom in both the x- and y- directions. Zoom out to full view. Once it is selected, you can operate any of the first three Zoom buttons in one of two ways. • Use your mouse to rubberband around the area on the plot region you want to focus on. Rubberbanding involves clicking and holding the mouse down, while dragging the mouse pointer around the region of interest on the screen. • Click in the plot region in the vicinity on which you want to focus. To move the closed-loop poles closer to the imaginary axis on your root locus by zooming with the rubberband method: 1 Zoom in X-Y by selecting the left-most Zoom button. 2 Use your mouse to rubberband the region of the imaginary axis near the closed-loop pole there. 3 Readjust the closed-loop pole position by grabbing it with the mouse and moving it until it rests on the imaginary axis. 4 Zoom out by clicking on the fourth Zoom button, (the icon is a pair of binoculars). 8-16 Controller Design Using the Root Locus Design GUI The use of zooming to find the limits of stability on the root locus is depicted in the following three figures. After you drag that pole close to the imaginary axis, use the left-most Zoom button to zoom in. Move the closed-loop pole to the imaginary axis to fine-tune your gain adjustment. 8-17 8 The Root Locus Design GUI The limiting gain set point for stability Use the right-most Zoom button to zoom out. You can also store this zoom focus setting using the Axes settings described in the next section. The critical gain value for stability is approximately 43.9. Note: You can also test how much the gain can be increased while maintaining stability by arbitrarily applying different values of the gain in the text area next to Gain (pressing the Enter key after entering each value) until one pair of complex poles reaches the imaginary axis. After using the zoom tools on the GUI, you may want to store one set of zoom focus settings so that you may later return to focus on that same region of the locus. 8-18 Controller Design Using the Root Locus Design GUI Storing and Retrieving Axes Limits You can store and change axes limits in two ways: • Using the Axes settings toolbar • Using the Set Axes Preferences menu item from the Tools menu For more information on square axes and/or equal axes, type help axis at the command line. To use the Axes settings toolbar to save the current axes limits, select the left-most button shown below. Save current axes limits. Retrieve a set of saved axes limits. Toggle the axes between a square and rectangle. Toggle the aspect ratio of the axes between equal and unequal. If you change the axes limits by zooming, you can always return to the saved axes limits by selecting the second Axes settings button. To try out these tools: • Select the left-most Axes settings button. • Zoom in on a region of the root locus. • Select the second Axes settings button. 8-19 8 The Root Locus Design GUI You can also set or revise axes limits and other axes preferences in the Root Locus Axes Preferences window. To open this window, select Set Axes Preferences from the Tools menu. You can also use this window to change the colors of the root locus plot and the compensator poles and zeros, and the color and type of marker used for the closed-loop poles. Type of marker used to designate the closed-loop poles Select Apply to implement changes and keep this window open. Select OK to implement changes and close the window. If you have already stored axes limits using Axes settings, these limits appear in this window in the Limits field. You can reset these limits by typing in new values. To apply any changes to the entries in this window, click on OK after making the changes. Displaying System Responses Before you design your compensator, you may want to conduct some response analysis of your closed-loop system evaluated at a fixed value of the gain. You can access some of the system response analysis capabilities of the LTI Viewer (see Chapter 6, “The LTI Viewer”) through the checkboxes located in the lower portion of the Root Locus Design GUI. Checking one or several of these boxes opens an LTI Viewer window that displays the corresponding plots. The LTI Viewer window that opens is dynamically linked to the Root Locus Design GUI: any changes made to the system on the GUI that affect the gain set point will effect a corresponding change on the displayed LTI Viewer plots. For this example, we want to know if the step response meets our design criteria. The current value for the gain set point is about 44. Clearly this value of the gain would test the limits of stability of our system. Let’s choose a reasonable value for the gain (say, 20) and look at the step response. 8-20 Controller Design Using the Root Locus Design GUI Change the gain to 20 by editing the text box next to Gain, and pressing the Enter key. Notice that the locations of the closed-loop poles on the root locus are recalculated for the new gain set point. Your Root Locus Design GUI looks like this now. 8-21 8 The Root Locus Design GUI Check the Step box, as shown below. Once you check the Step box, an LTI Viewer window opens. The plot type for this LTI Viewer is the step response and this cannot be changed. This closed-loop response does not meet the desired settling time requirement (.05 seconds or less). You can design a compensator so that you do meet the required specifications. Designing a Compensator to Meet Specifications Since the current closed-loop system doesn’t meet both of the required design specifications, let’s first try increasing the gain to about 33. You can increase the gain in two ways: • Edit the Gain textbox and press the Enter key. • Move the closed loop set point around with the mouse, while increasing the gain. 8-22 Controller Design Using the Root Locus Design GUI To increase the gain to about 33 using your mouse: 1 Hold your mouse button down as you click on any of the red squares. 2 Drag the square in the direction of increasing gain, without allowing any of the closed-loop poles to enter the right half of the complex plane. If, when you start to move the red square, you see the gain value in the Gain box decreasing, drag it in the opposite direction. 3 Release the mouse button when the gain is near 33. Your GUI looks like this. 8-23 8 The Root Locus Design GUI The step response plot on the dynamically linked LTI Viewer automatically updates when you release the mouse button. As you may have noticed, the response time decreases with increasing gain, while the overshoot increases. Here we no longer meet the overshoot requirement. Since this gain is already relatively large, it’s likely that we will not be able to meet both design requirements using only a gain for the compensator. This conjecture is supported when you specify the design region boundaries on the root locus for these design requirements. We do this in the next subsection. Specifying Design Region Boundaries on the Root Locus If, as in our example, your design criteria are specified in terms of step response characteristics, you may want to use the grid and boundary constraint options that are accessible from the Add Grid/Boundary menu item in the Tools menu on the Root Locus Design GUI. These options allow you to use second order system design criteria to inscribe the boundaries of design region directly on the root locus plot, or apply a grid to the plot. Note: The boundaries you apply to the Root Locus Design GUI based on LTI system design criteria (settling time, damping ratio, natural frequency, and peak overshoot) are computed relative to second-order systems only. Therefore, for higher order systems, these boundaries provide approximations to the design region. 8-24 Controller Design Using the Root Locus Design GUI Let’s place approximate design region boundaries on our root locus plot based on our design specifications. To do so, select the Add Grid/Boundary menu item in the Tools menu. Our design specifications require that the (2 percent) settling time be less than .05 seconds, and the maximum overshoot less than 5 percent. For second-order systems, the overshoot requirement can be translated directly as a requirement on the damping ratio of about .7 (see [2]). After you enter these values in the appropriate text fields for our specifications, your Grid and Constraint Options window looks like this. Check this box to place a grid on the root locus, either for lines of constant damping ratio (with circles of constant natural frequency), or lines of constant peak overshoot. You can enter lists of numbers here to specify several boundaries for any of these criteria. Separate numbers in a list by spaces or commas. Checks in these boxes indicate the boundaries will appear on the root locus once you select OK or Apply. Unchecking them toggles the boundary off. 8-25 8 The Root Locus Design GUI After you press OK, the Root Locus Design GUI calculates and displays the specified boundaries. Damping ratio boundary Settling time boundary The design region lies within this wedge to the left of the settling time boundary. Not all four branches of the root locus are within the design region. Let’s try adding poles and zeros to our compensator to see if we can meet the design criteria. Placing Compensator Poles and Zeros: General Information There are three types of parameters specifying the compensator: • Poles • Zeros • Gain 8-26 Controller Design Using the Root Locus Design GUI Once you have the gain specified, you can add poles or zeros to the compensator. You can add poles and zeros to the compensator (or remove them) in two ways: • Use buttons on the root locus toolbar section of the GUI for pole/zero placement. • Use the Edit Compensator menu item on the Tools menu. The root locus toolbar is convenient for graphically placing compensator poles and zeros so that you meet the design specifications for a given gain set point. This method may require a certain amount of trial and error. You can use the Edit Compensator menu item to: • Fine-tune compensator parameter values for design implementation. • Revise or implement an existing compensator design. For this example we first use the root locus toolbar to place compensator poles and zeros on the root locus, and then use the Edit Compensator menu item to set the compensator pole and zero locations for a specific compensator solution. Placing Compensator Poles and Zeros Using the Root Locus Toolbar The root locus toolbar is located on the left side of the GUI, above the plot region. The figure below describes the root locus toolbar buttons. Operate in default mode: Drag compensator poles Add compensator and zeros and closed-loop poles. poles. Add compensator zeros. Erase compensator poles/zeros. Edit the compensator gain. 8-27 8 The Root Locus Design GUI The default mode for the toolbar is the drag mode. In this mode, you can: • Click on a specific location on the root locus to place a closed-loop pole there (and consequently reassign the gain set point). • Drag any of the closed-loop poles along its branch of the root locus (also reassigning the gain set point). • Drag any of the compensator poles or zeros around the complex plane to change the compensator. To add a complex conjugate compensator pole pair on the root locus plot: 1 Select the add pole button (the second button in the root locus toolbar). 2 Click on the plot region where you would like to add one of the complex poles. Some of the features of using the root locus toolbar to add a pole are: • While the add pole button is depressed, the cursor changes to an arrow with an x at its tip whenever it is over the plot region. This indicates the toolbar is in the “add pole” mode. • After you add the poles, the add pole button pops back up and the default drag mode is restored. The added compensator poles appear in a different color. The default color is red. • The LTI Viewer response plots change as soon as the pole is added. • The text displayed in the Current Compensator region of the GUI now displays the new pair of poles. 8-28 Controller Design Using the Root Locus Design GUI Try placing a pair of complex poles just above the right-most real closed-loop pole. The resulting root locus plot looks like this. Add compensator poles here. Similarly, to add a pair of complex zeros to the compensator: 1 Select the add zero button from the root locus toolbar (third button from the left). 2 Click on the plot region where you would like to add one of the complex zeros. 8-29 8 The Root Locus Design GUI Try adding a pair of complex zeros just to the left of and a little bit below the complex closed-loop poles closest to the imaginary axis. The resulting root locus and step response plots are as follows. Add compensator zeros here. If your step response is unstable, lower the gain. In this example, the resulting step response is stable, but it still doesn’t meet the design criteria. As you can see, the compensator design process can involve some trial and error. You can try dragging the compensator poles, compensator zeros, or the closed-loop poles around the root locus until you meet the design criteria. Alternatively, you can edit the compensator using the solution provided in the next section. Note: You can follow the same procedure to add a single real pole or zero to the compensator by clicking on the real axis. 8-30 Controller Design Using the Root Locus Design GUI Editing Compensator Pole and Zero Locations In this section we use the Edit Compensator window to design a compensator with the following characteristics: • Gain: 9.7 • Poles: – 110 ± 140i • Zeros: – 70 ± 270i You can access the Edit Compensator window in one of three ways: • Double-click on any of the Current Compensator text. • Click on the (blue) compensator block in the feedback structure on the GUI. • Select Edit Compensator from the Tools menu. This figure shows how to choose this menu item on the GUI. With either method, you open the Edit Compensator window shown in the figure below. 8-31 8 The Root Locus Design GUI You can use the Edit Compensator window to: • Edit the locations of compensator poles and zeros. • Add compensator poles and zeros. • Delete compensator poles and zeros. • Change the name of the compensator (This name is used when exporting the compensator). For this example, edit the poles and zeros to be at – 110 ± 140i, and – 70 ± 270i, respectively. Your GUI looks like this. If, in addition, you want to add poles to the compensator: 1 Click on Add Pole. A new editable text field appears. 2 Enter the new pole location in the text field. The procedure is the same for adding zeros, only use the Add Zero button in place of the Add Pole button. To erase any poles or zeros, select the Delete checkbox. Before closing this window by selecting OK, you can also optionally change the name of the compensator. Note: You can also erase poles or zeros on the root locus using the erase button on the root locus toolbar. See “Erasing Compensator Poles and Zeros” on page 8-41 8-32 Controller Design Using the Root Locus Design GUI With the gain set point at 9.7, your root locus looks as follows. Note: Whenever the numerator or denominator are too long for the Current Compensator field, a default numK or denK is displayed. To display the actual numerator or denominator, resize the Root Locus Design GUI. 8-33 8 The Root Locus Design GUI To check where the closed-loop roots are with respect to the boundary of the design region, let’s zoom in a bit. We don’t have all of the closed-loop poles in the design region, but let’s see if we meet the step response specifications. The updated LTI Viewer plot of the step response looks like this. 8-34 Controller Design Using the Root Locus Design GUI The step response looks good. However, to be certain that you’ve met your design specifications, you can check the settling time and peak response characteristics from the right-click menu. To do this: 1 Right-click anywhere in the plot region. 2 Select Settling Time from the Characteristics menu. 3 Set your mouse pointer to the settling time marker and click to display the value. The LTI Viewer will look like this. Marker for the settling time As you can see, the settling time is less than .05 seconds, and the overshoot is less than 5 percent. You’ve met the design specifications and you’re done. You didn’t need your closed-loop poles to be entirely in the design region, because you actually have a sixth-order system with some fast dynamics, as opposed to having only a second-order system. 8-35 8 The Root Locus Design GUI Saving the Compensator and Models Now that you have successfully designed your compensator, you may want to save your design parameters for future implementation. You can do this by selecting Export from the File menu on the Root Locus Design GUI. The window shown below opens. Use your mouse to select or multiselect models to save. Save to the disk as a file with a .mat extension. Save to the workspace. The variable listed in the Export List on the Export LTI Models/ Compensators GUI are either previously named by you (on the List Model Poles/Zeros or the Edit Compensator windows) or have default names. They are coded as follows: • DM: The design model • OL: The open-loop model • CL: The closed-loop model • K: The compensator To export your compensator to the workspace: 1 Select the compensator in the Export List. 2 Click on the Export to Workspace button. The Export LTI Model/Compensators window is closed when you click on one of the export buttons. If you go to the MATLAB prompt and type who 8-36 Controller Design Using the Root Locus Design GUI the compensator is now in the workspace, in the variable named comp. Then type comp to see that this variable is stored in zpk format. 8-37 8 The Root Locus Design GUI Additional Root Locus Design GUI Features This section describes several features of the Root Locus Design GUI not covered in the servomechanism example. These are listed as follows: • Specifying design models: general concepts: - Creating models manually within the GUI - Designating the model source • Getting help with the Root Locus Design GUI • Erasing compensator poles and zeros • Listing poles and zeros • Printing the root locus • Drawing a Simulink diagram of the closed-loop model • Converting between continuous and discrete models • Clearing data Specifying Design Models: General Concepts In this section we provide general concepts for specifying the design model by using one or both of the following methods: • Creating models manually within the GUI • Designating the model source: - The MATLAB workspace - A MAT-file - An open or saved Simulink model Creating Models Manually Within the GUI You can create models for root locus analysis manually in the Import LTI Design Model window using tf, ss, or zpk. To do so, just edit the text boxes next to P, F, or H using any of these MATLAB expressions. You can also use a scalar number to specify P, F, or H. 8-38 Additional Root Locus Design GUI Features Designating the Model Source The source of your design model data is indicated in the Import From field shown below. If you are loading your models from MAT-files or Simulink models saved on your disk, you are prompted to enter the name of the file in the editable text box below the Import From radio buttons. You can also select the Browse button to search for and select the file. The Simulink radio button also allows you to load SISO LTI blocks from an open Simulink model, by entering the name of the model in the text box. When you select the model source, its contents are shown in the model listbox located in the central portion of the Import LTI Design Model window. The model listbox contains the following data: • For Workspace or MAT-file: All LTI models in the workspace, or in the selected MAT-file • For Simulink: All the LTI blocks in the selected Simulink diagram Note: If you want to load models saved in more than one MAT-file, load these into the MATLAB workspace before selecting Import Model on the Root Locus Design GUI. Getting Help with the Root Locus Design GUI You can obtain instructions on how to use the Root Locus Design GUI either using the Help menu, from the status bar, or by using the tooltips. 8-39 8 The Root Locus Design GUI Using the Help Menu Click on the Help menu and you find that it contains five menu items: • Main Help • Edit Compensator • Convert Model • Add Grid/Boundary • Set Axis Preferences The first menu item, Main Help, opens a help window that describes how to use the controls located on the Root Locus Design GUI. The remaining menu items provide additional information on the features you can access from the Tools menu. Using the Status Bar for Help The status bar at the bottom of the Root Locus Design GUI: • Provides you with information, hints, and error messages as you proceed through your design. • Lets you know if you have tried to undertake an action the GUI is not capable of, or if a GUI operation you have performed has successfully been completed. • Provides information about the location of newly placed compensator poles and zeros, as well as the damping ratio, natural frequency, and location of poles and zeros as you drag them. Tooltips You can obtain simple reminders (tooltips) on how to use the Root Locus Design GUI by moving your mouse and putting the cursor over one of these features. For example, if you put the cursor over the Step checkbox, its tooltip, Closed-loop step response, appears just below the button. When a tooltip is available, a small bubble containing information about the feature you selected appears. This bubble disappears when you move the mouse again. 8-40 Additional Root Locus Design GUI Features Erasing Compensator Poles and Zeros You can delete any compensator poles and zeros in one of two ways: • Check the associated Delete box on the Edit Compensator... window obtained from the Tools menu. • Click on the erase button (fourth from left on the root locus toolbar) and click on the pole or zero to delete. After using the root locus toolbar erase button to delete a pole or zero, the following occurs: • The erase button pops up and the default drag mode is restored. • The zero or pole you erased (and, if applicable, its conjugate) is removed from the root locus and from the Current Compensator text. • The root locus plot and any linked LTI Viewer response plots are recalculated. Listing Poles and Zeros At any point when the Root Locus Design GUI is open, you can view: • The closed-loop pole locations associated with the current Gain setting • The poles, zeros, and gain of each design model component 8-41 8 The Root Locus Design GUI To view the current closed-loop poles: • Select List Closed-Loop Poles from the Tools menu. If you select this menu, a window listing the closed-loop poles associated with the current gain set point opens. • Click on the OK button to close the window. Note: You cannot edit the closed-loop pole locations listed in this window. To view the design model poles and zeros, you can either: • Select the List Model Poles/Zeros item from the Tools menu. • Click on any of the design model blocks in the Feedback Structure. These are the yellow F, P, and H blocks. 8-42 Additional Root Locus Design GUI Features The following window opens. For each component of the design model, this window tells you: • The component name • The type of LTI model that the component is (that is, ss, zpk, or tf) • The component’s pole and zero locations • The associated numerator and denominator of the model transfer function You can edit any of the model names in the textboxes provided. Selecting OK closes this window and implements the changes you made to design model names. Before closing this window, you can also use the Show Object buttons in this window to provide a MATLAB display of the associated LTI model. The following is the information provided for the plant. Select OK to close this window. 8-43 8 The Root Locus Design GUI Note: The names you enter in this window are only used when you generate a Simulink diagram of the closed-loop structure. To list the denominator, (respectively, the numerator, including the gain) associated with a given component of the design model, in the List Model Poles/Zeros window, click on Poles, (respectively, Zeros) of that component. When you do, a window providing the selected information opens. The Show Object button in this window opens a dialog that displays the LTI model exactly as it would be shown at the MATLAB prompt. Printing the Root Locus You can print the locus the GUI is displaying by: 1 Selecting Print Locus from the File menu 2 Clicking the OK button on the printer dialog that appears When you select Print Locus a new MATLAB figure window containing the locus appears. This is the figure that is printed when you press OK. Note: You can also generate this root locus MATLAB figure window by selecting Send Locus to Figure from the File menu. This figure remains open until you close it. Drawing a Simulink Diagram If you have Simulink, you can use the Root Locus Design GUI to automatically draw a Simulink diagram of the closed-loop structure. To do this: 1 Select Draw Simulink Diagram from the File menu. 2 Answer Yes to the subsequent dialog box question to confirm that you want the design model data to be stored in the workspace using its current names, or answer No to this question, if you want to abort drawing the diagram. 8-44 Additional Root Locus Design GUI Features If you answered Yes, a Simulink diagram such as this appears. Pre-filter, F The root locus design compensator, K The plant, P (Gservo) Sensor dynamics, H The Simulink diagram is linked to the workspace, not to the Root Locus Design GUI. If you change your compensator design in the Root Locus Design GUI, you must export it to the workspace in order to reflect these changes in the Simulink diagram. Converting Between Continuous and Discrete Models The Root Locus Design GUI can be applied to either discrete or continuous-time systems, and you can convert between the two types of systems at any time during the design process. However, the design model and compensator must both be either continuous or discrete. To obtain the discrete equivalent of your current compensator design, select Convert Model/Compensator from the Tools menu. 8-45 8 The Root Locus Design GUI The Convert Model/Compensator window, shown below, opens. Choose the discretization method here. Click on OK to convert the model to your specifications and close this window. Enter the sampling time. Critical frequency is only required for the Tustin method. Once you select a discretization method, sampling time, and critical frequency (if required), click on the OK button. The Convert Model/Compensator window closes and the discretization is performed. At this point: • The design model and compensator are discretized. • The Current Compensator text displays a system using the complex variable 'z'. • The root locus for the discrete-time system representing the converted continuous-time system is plotted. • Any linked LTI Viewer response plots are updated. • The grids and boundaries are converted into the discrete plane. You can also use the Convert Model/Compensator GUI to retrieve the continuous system, or to re-sample the discrete system using a different sampling time. These options are selected from the radio buttons at the top of this GUI. Clearing Data You can clear the design model and/or compensator from the Root Locus Design GUI using options available in the Tools menu: • Clear Model: removes the plant, pre-filter, and sensor dynamics and replaces them all with unity gains. • Clear Compensator: removes the compensator poles and zeros, and resets the gain to one. 8-46 Additional Root Locus Design GUI Features To test these features, select Clear Model. Notice that your compensator is not altered, and its poles and zeros remain plotted in the root locus plot region of the GUI. Now, select Clear Compensator. The Root Locus Design GUI returns to the state it was in when you first opened it and you are ready to start a new design. 8-47 8 The Root Locus Design GUI References [1] Clark, R.N., Control System Dynamics, Cambridge University Press, 1996. [2] Dorf, R.C. and R.H. Bishop, Modern Control Systems, 8th Edition, Addison Wesley, 1997. 8-48 9 Design Case Studies Yaw Damper for a 747 Jet Transport Open-Loop Analysis . . . . . . . . Root Locus Design . . . . . . . . . Washout Filter Design . . . . . . . . . . . . . . . . . . . . . . . . . . . . . . . . . . . . . . . . . . . 9-3 9-6 9-9 9-14 Hard-Disk Read/Write Head Controller . . . . . . . . 9-20 LQG Regulation . . . . . . Process and Disturbance Models LQG Design for the x-Axis . . . LQG Design for the y-Axis . . . Cross-Coupling Between Axes . MIMO LQG Design . . . . . . . . . . . . . . . . . . . . . . . . . . . . . . . . . . . . . . . . . . . . . . . . . . . . . . . . . . . . . . . . . . . . . . . . . . . . . . 9-31 9-31 9-34 9-42 9-43 9-47 Kalman Filtering . . . . Discrete Kalman Filter . . Steady-State Design . . . Time-Varying Kalman Filter Time-Varying Design . . . References . . . . . . . . . . . . . . . . . . . . . . . . . . . . . . . . . . . . . . . . . . . . . . . . . . . . . . . . . . . . . . . . . . . . . . . . . . . . . . . 9-50 9-50 9-51 9-57 9-58 9-63 . . . . . . . . . . . . 9 Design Case Studies This chapter contains four detailed case studies of control system design and analysis using the Control System Toolbox. Case Study 1 A yaw damper for a 747 jet transport aircraft that illustrates the classical design process. Case Study 2 A hard-disk read/write head controller that illustrates classical digital controller design. Case Study 3 LQG regulation of the beam thickness in a steel rolling mill. Case Study 4 Kalman filtering that illustrates both steady-state and time-varying Kalman filter design and simulation. Demonstration files for these case studies are available as jetdemo.m, diskdemo.m, milldemo.m, and kalmdemo.m. To run any of these demonstrations, type the corresponding name at the command line, for example, jetdemo 9-2 Yaw Damper for a 747 Jet Transport Yaw Damper for a 747 Jet Transport This case study demonstrates the tools for classical control design by stepping through the design of a yaw damper for a 747 jet transport aircraft. The jet model during cruise flight at MACH = 0.8 and H = 40,000 ft. is A = [–0.0558 0.5980 –3.0500 0 B = [ 0.0729 –4.7500 1.5300 0 C = [0 0 1 0 D = [0 0 0 0]; –0.9968 –0.1150 0.3880 0.0805 0.0802 –0.0318 –0.4650 1.0000 0.0415 0 0 0]; 0.0000 0.00775 0.1430 0]; 0 0 0 1]; The following commands specify this state-space model as an LTI object and attach names to the states, inputs, and outputs. states = {'beta' 'yaw' 'roll' 'phi'}; inputs = {'rudder' 'aileron'}; output = {'yaw' 'bank angle'}; sys = ss(A,B,C,D,'statename',states,... 'inputname',inputs,... 'outputname',outputs); 9-3 9 Design Case Studies You can display the LTI model sys by typing sys. MATLAB responds with a = beta yaw roll phi beta -0.0558 0.598 -3.05 0 yaw -0.9968 -0.115 0.388 0.0805 beta yaw roll phi rudder 0.00729 -0.475 0.153 0 aileron 0 0.00775 0.143 0 yaw bank angle beta 0 0 yaw 1 0 rudder 0 0 aileron 0 0 roll 0.0802 -0.0318 -0.465 1 phi 0.0415 0 0 0 roll 0 0 phi 0 1 b = c = d = yaw bank angle Continuous-time model. The model has two inputs and two outputs. The units are radians for beta (sideslip angle) and phi (bank angle) and radians/sec for yaw (yaw rate) and roll (roll rate). The rudder and aileron deflections are in radians as well. 9-4 Yaw Damper for a 747 Jet Transport Compute the open-loop eigenvalues and plot them in the s -plane. damp(sys) Eigenvalue -7.28e-003 -5.63e-001 -3.29e-002 + 9.47e-001i -3.29e-002 - 9.47e-001i Damping Freq. (rad/s) 1.00e+000 1.00e+000 3.48e-002 3.48e-002 7.28e-003 5.63e-001 9.47e-001 9.47e-001 pzmap(sys) This model has one pair of lightly damped poles. They correspond to what is called the “Dutch roll mode.” 9-5 9 Design Case Studies Suppose you want to design a compensator that increases the damping of these poles, so that the resulting complex poles have a damping ratio ζ > 0.35 with natural frequency ω n < 1 rad/sec. You can do this using the Control System toolbox analysis tools. Open-Loop Analysis First perform some open-loop analysis to determine possible control strategies. Start with the time response (you could use step or impulse here). impulse(sys) The impulse response confirms that the system is lightly damped. But the time frame is much too long because the passengers and the pilot are more 9-6 Yaw Damper for a 747 Jet Transport concerned about the behavior during the first few seconds rather than the first few minutes. Next look at the response over a smaller time frame of 20 seconds. impulse(sys,20) Look at the plot from aileron (input 2) to bank angle (output 2). The aircraft is oscillating around a nonzero bank angle. Thus, the aircraft is turning in response to an aileron impulse. This behavior will prove important later in this case study. 9-7 9 Design Case Studies Typically, yaw dampers are designed using the yaw rate as sensed output and the rudder as control input. Look at the corresponding frequency response (input 1 to output 1). bode(sys(1,1)) From this Bode diagram, you can see that the rudder has significant effect around the lightly damped Dutch roll mode (that is, near ω = 1 rad/sec). To make the design easier, select the subsystem from rudder to yaw rate. % Select system with input 1 and output 1 sys11 = sys(1,1); 9-8 Yaw Damper for a 747 Jet Transport Root Locus Design Since the simplest compensator is a static gain, first try to determine appropriate gain values using the root locus technique. % Plot the root locus for the (1,1) channel rlocus(sys11) 9-9 9 Design Case Studies This is the root locus for negative feedback and shows that the system goes unstable almost immediately. If, instead, you use positive feedback, you may be able to keep the system stable. rlocus(–sys11) sgrid This looks better. Just using simple feedback you can achieve a damping ratio of ζ = 0.45 . You can graphically select some pole locations and determine the corresponding gain with rlocfind. [k,poles] = rlocfind(–sys11) 9-10 Yaw Damper for a 747 Jet Transport The '+' marks on the previous figure show a possible selection. The corresponding gain and closed-loop poles are k k = 2.7615 damp(poles) Eigenvalue -1.01e+000 -3.03e-001 + 6.18e-001i -3.03e-001 - 6.18e-001i -3.33e-001 Damping Freq. (rad/s) 1.00e+000 4.41e-001 4.41e-001 1.00e+000 1.01e+000 6.89e-001 6.89e-001 3.33e-001 Next, form the closed-loop system so that you can analyze this design. cl11 = feedback(sys11,–k); % negative feedback by default The closed-loop poles should match the ones chosen above (and they do). damp(cl11) Eigenvalue -3.33e-001 -3.03e-001 + 6.18e-001i -3.03e-001 - 6.18e-001i -1.01e+000 Damping Freq. (rad/s) 1.00e+000 4.41e-001 4.41e-001 1.00e+000 3.33e-001 6.89e-001 6.89e-001 1.01e+000 9-11 9 Design Case Studies Plot the closed-loop impulse response for a duration of 20 seconds. impulse(cl11,20) The response settles quickly and does not oscillate much. Now close the loop on the original model and see how the response from the aileron looks. The feedback loop involves input 1 and output 1 of the plant (use 9-12 Yaw Damper for a 747 Jet Transport feedback with index vectors selecting this input/output pair). At the MATLAB prompt, type cloop = feedback(sys,–k,1,1); damp(cloop) % closed-loop poles Eigenvalue -3.33e-001 -3.03e-001 + 6.18e-001i -3.03e-001 - 6.18e-001i -1.01e+000 Damping Freq. (rad/s) 1.00e+000 4.41e-001 4.41e-001 1.00e+000 3.33e-001 6.89e-001 6.89e-001 1.01e+000 9-13 9 Design Case Studies Plot the MIMO impulse response. impulse(cloop,20) Look at the plot from aileron (input 2) to bank angle (output 2). When you move the aileron, the system no longer continues to bank like a normal aircraft. You have over-stabilized the spiral mode. The spiral mode is typically a very slow mode and allows the aircraft to bank and turn without constant aileron input. Pilots are used to this behavior and will not like your design if it does not allow them to fly normally. This design has moved the spiral mode so that it has a faster frequency. Washout Filter Design What you need to do is make sure the spiral mode does not move further into the left-half plane when you close the loop. One way flight control designers have addressed this problem is to use a washout filter kH ( s ) where 9-14 Yaw Damper for a 747 Jet Transport s H ( s ) = -----------s+a The washout filter places a zero at the origin, which constrains the spiral mode pole to remain near the origin. We choose a = 0.333 for a time constant of three seconds and use the root locus technique to select the filter gain k . First specify the fixed part s ⁄ ( s + a ) of the washout by H = zpk(0,–0.333,1); Connect the washout in series with the design model sys11 (relation between input 1 and output 1) to obtain the open-loop model oloop = H * sys11; 9-15 9 Design Case Studies and draw another root locus for this open-loop model. rlocus(–oloop) sgrid Now the maximum damping is about ζ = 0.25 . You can select the gain providing maximum damping graphically by [k,poles] = rlocfind(–oloop) 9-16 Yaw Damper for a 747 Jet Transport The selected pole locations are marked by '+' on the root locus above. The resulting gain value and closed-loop dynamics are found by typing k k = 2.5832 damp(poles) Eigenvalue -1.37e+000 -1.76e-001 + 6.75e-001i -1.76e-001 - 6.75e-001i -4.74e-001 -3.88e-003 Damping Freq. (rad/s) 1.00e+000 2.52e-001 2.52e-001 1.00e+000 1.00e+000 1.37e+000 6.98e-001 6.98e-001 4.74e-001 3.88e-003 9-17 9 Design Case Studies Look at the closed-loop response from rudder to yaw rate. cl11 = feedback(oloop,–k); impulse(cl11,20) The response settles nicely but has less damping than your previous design. Finally, you can verify that the washout filter has fixed the spiral mode problem. First form the complete washout filter kH ( s ) (washout + gain). WOF = –k * H; 9-18 Yaw Damper for a 747 Jet Transport Then close the loop around the first I/O pair of the MIMO model sys and simulate the impulse response. cloop = feedback(sys,WOF,1,1); % Final closed-loop impulse response impulse(cloop,20) The bank angle response (output 2) due to an aileron impulse (input 2) now has the desired nearly constant behavior over this short time frame. Although you did not quite meet the damping specification, your design has increased the damping of the system substantially and now allows the pilot to fly the aircraft normally. 9-19 9 Design Case Studies Hard-Disk Read/Write Head Controller Hard Disk Drive Disk Platen Ω Disk Drive Motor Read/Write Head l θ Solenoid This case study demonstrates the ability to perform classical digital control design by going through the design of a computer hard-disk read/write head position controller. Using Newton’s law, a simple model for the read/write head is the differential equation 2 dθ d θ - + C ------- + Kθ = K i i J --------2 dt dt where J is the inertia of the head assembly, C is the viscous damping coefficient of the bearings, K is the return spring constant, K i is the motor torque constant, θ is the angular position of the head, and i is the input current. Taking the Laplace transform, the transfer function from i to θ is Ki H ( s ) = --------------------------------2 Js + Cs + K 9-20 Hard-Disk Read/Write Head Controller 2 Using the values J = 0.01 kg m , C = 0.004 Nm/(rad/sec), K = 10 Nm/rad, and K i = 0.05 Nm/rad, form the transfer function description of this system. At the MATLAB prompt, type J = num den H = .01; C = 0.004; K = 10; Ki = .05; = Ki; = [J C K]; tf(num,den) MATLAB responds with Transfer function: 0.05 ----------------------0.01 s^2 + 0.004 s + 10 The task here is to design a digital controller that provides accurate positioning of the read/write head. The design is performed in the digital domain. First, discretize the continuous plant. Because our plant will be equipped with a digital-to-analog converter (with a zero-order hold) connected to its input, use c2d with the 'zoh' discretization method. Type Ts = 0.005; % sampling period = 0.005 second Hd = c2d(H,Ts,'zoh') Transfer function: 6.233e–05 z + 6.229e–05 ----------------------z^2 – 1.973 z + 0.998 Sampling time: 0.005 9-21 9 Design Case Studies You can compare the Bode plots of the continuous and discretized models with bode(H,'-',Hd,'--') 9-22 Hard-Disk Read/Write Head Controller To analyze the discrete system, plot its step response, type step(Hd) The system oscillates quite a bit. This is probably due to very light damping. You can check this by computing the open-loop poles. Type % Open–loop poles of discrete model damp(Hd) Eigenvalue 9.87e–01 + 1.57e–01i 9.87e–01 – 1.57e–01i Magnitude 9.99e–01 9.99e–01 Equiv. Damping 6.32e–03 6.32e–03 Equiv. Freq. 3.16e+01 3.16e+01 The poles have very light equivalent damping and are near the unit circle. You need to design a compensator that increases the damping of these poles. 9-23 9 Design Case Studies The simplest compensator is just a gain, so try the root locus technique to select an appropriate feedback gain. rlocus(Hd) As shown in the root locus, the poles quickly leave the unit circle and go unstable. You need to introduce some lead or a compensator with some zeros. Try the compensator z+a D ( z ) = -----------z+b with a = – 0.85 and b = 0 . 9-24 Hard-Disk Read/Write Head Controller The corresponding open-loop model u D(z) Hd( z ) Compensator Plant y is obtained by the series connection D = zpk(0.85,0,1,Ts) oloop = Hd * D Now see how this compensator modifies the open-loop frequency response. bode(Hd,'--',oloop,'-') 9-25 9 Design Case Studies The plant response is the dashed line and the open-loop response with the compensator is the solid line. The plot above shows that the compensator has shifted up the phase plot (added lead) in the frequency range ω > 10 rad/sec. 9-26 Hard-Disk Read/Write Head Controller Now try the root locus again with the plant and compensator as open loop. rlocus(oloop) zgrid This time, the poles stay within the unit circle for some time (the lines drawn by zgrid show the damping ratios from ζ = 0 to 1 in steps of 0.1). This plot shows a set of poles '+' selected using rlocfind. At the MATLAB prompt, type [k,poles] = rlocfind(oloop) k k = 4.1179e+03 9-27 9 Design Case Studies Type ddamp(poles,Ts) to see the equivalent damping and natural frequency for each of the eigenvalues. To analyze this design, form the closed-loop system and plot the closed-loop step response. cloop = feedback(oloop,k); step(cloop) This response depends on your closed loop set point. The one shown here is relatively fast and settles in about 0.07 seconds. Therefore, this closed loop disk drive system has a seek time of about 0.07 seconds. This is slow by today's standards, but you also started with a very lightly damped system. 9-28 Hard-Disk Read/Write Head Controller Now look at the robustness of your design. The most common classical robustness criteria are the gain and phase margins. Use the function margin to determine these margins. With output arguments, margin returns the gain and phase margins as well as the corresponding crossover frequencies. Without output argument, margin plots the Bode response and displays the margins graphically. To compute the margins, first form the unity-feedback open loop by connecting the compensator D ( z ) , plant model, and feedback gain k in series. olk = k * oloop; oloop u + D(z) – Plant y k Next apply margin to this open-loop model. Type [Gm,Pm,Wcg,Wcp] = margin(olk); Margins = [Gm Wcg Pm Wcp] Margins = 3.7809 295.3172 43.1686 106.4086 To obtain the gain margin in dB, type 20*log10(Gm) ans = 11.5760 You can also display the margins graphically by typing margin(olk) 9-29 9 Design Case Studies The command produces the plot shown below. Bode Diagrams Gm=11.6 dB (Wcg=296.1); Pm=43.1 deg. (Wcp=106.5) 100 50 Phase (deg); Magnitude (dB) 0 −50 −100 100 0 −100 −200 −300 0 10 1 2 10 10 3 10 Frequency (rad/sec) This design is robust and can tolerate a 11 dB gain increase or a 40 degree phase lag in the open-loop system without going unstable. By continuing this design process, you may be able to find a compensator that stabilizes the open-loop system and allows you to reduce the seek time. 9-30 LQG Regulation LQG Regulation This case study demonstrates the use of the LQG design tools in a process control application. The goal is to regulate the horizontal and vertical thickness of the beam produced by a hot steel rolling mill. This example is adapted from [1]. The full plant model is MIMO and the example shows the advantage of direct MIMO LQG design over separate SISO designs for each axis. Type milldemo at the command line to run this demonstration interactively. Process and Disturbance Models The rolling mill is used to shape rectangular beams of hot metal. The desired outgoing shape is sketched below. rolling cylinders y x shaped beam 9-31 9 Design Case Studies This shape is impressed by two pairs of rolling cylinders (one per axis) positioned by hydraulic actuators. The gap between the two cylinders is called the roll gap. rolling mill stand incoming beam shaped beam rolling cylinders x-axis The objective is to maintain the beam thickness along the x- and y-axes within the quality assurance tolerances. Variations in output thickness can arise from the following: • Variations in the thickness/hardness of the incoming beam • Eccentricity in the rolling cylinders Feedback control is necessary to reduce the effect of these disturbances. Because the roll gap cannot be measured close to the mill stand, the rolling force is used instead for feedback. The input thickness disturbance is modeled as a low pass filter driven by white noise. The eccentricity disturbance is approximately periodic and its frequency is a function of the rolling speed. A reasonable model for this disturbance is a second-order bandpass filter driven by white noise. 9-32 LQG Regulation This leads to the following generic model for each axis of the rolling process. H(s) u + hydraulic actuator f1 – + + δ force-to-gap gain Fe ( s ) we gx eccentricity model Fi ( s ) wi f2 + f + input disturbance model u δ f w i, w e command thickness gap (in mm) incremental rolling force driving white noise for disturbance models Figure 9-1: Open-loop model for x- or y-axis The measured rolling force variation f is a combination of the incremental force delivered by the hydraulic actuator and of the disturbance forces due to eccentricity and input thickness variation. Note that: • The outputs of H ( s ), F e ( s ) , and F i ( s ) are the incremental forces delivered by each component. • An increase in hydraulic or eccentricity force reduces the output thickness gap δ . • An increase in input thickness increases this gap. 9-33 9 Design Case Studies The model data for each axis is summarized below. Model Data for the x-Axis 8 2.4 × 10 H x ( s ) = -----------------------------------2 2 s + 72s + 90 4 10 F ix ( s ) = -------------------s + 0.05 4 3 × 10 s F ex ( s ) = ----------------------------------------2 2 s + 0.125s + 6 g x = 10 –6 Model Data for the y-Axis 8 7.8 × 10 H y ( s ) = -----------------------------------2 2 s + 71s + 88 4 2 × 10 F iy ( s ) = -------------------s + 0.05 5 10 s F ey ( s ) = ------------------------------------------2 2 s + 0.19s + 9.4 g y = 0.5 × 10 –6 LQG Design for the x-Axis As a first approximation, ignore the cross-coupling between the x- and y-axes and treat each axis independently. That is, design one SISO LQG regulator for each axis. The design objective is to reduce the thickness variations δ x and δ y due to eccentricity and input thickness disturbances. 9-34 LQG Regulation Start with the x -axis. First specify the model components as transfer function objects. % Hydraulic actuator (with input "u-x") Hx = tf(2.4e8,[1 72 90^2],'inputname','u-x') % Input thickness/hardness disturbance model Fix = tf(1e4,[1 0.05],'inputn','w-ix') % Rolling eccentricity model Fex = tf([3e4 0],[1 0.125 6^2],'inputn','w-ex') % Gain from force to thickness gap gx = 1e–6; Next build the open-loop model shown in Figure 9-1 above. You could use the function connect for this purpose, but it is easier to build this model by elementary append and series connections. % I/O map from inputs to forces f1 and f2 Px = append([ss(Hx) Fex],Fix) % Add static gain from f1,f2 to outputs ”x-gap” and ”x-force” Px = [–gx gx;1 1] * Px % Give names to the outputs: set(Px,'outputn',{'x-gap' 'x-force'}) Note: To obtain minimal state-space realizations, always convert transfer function models to state space before connecting them. Combining transfer functions and then converting to state space may produce nonminimal state-space models. 9-35 9 Design Case Studies The variable Px now contains an open-loop state-space model complete with input and output names. Px.inputname ans = 'u-x' 'w-ex' 'w-ix' Px.outputname ans = 'x-gap' 'x-force' The second output 'x-force' is the rolling force measurement. The LQG regulator will use this measurement to drive the hydraulic actuator and reduce disturbance-induced thickness variations δ x . The LQG design involves two steps: 1 Design a full-state-feedback gain that minimizes an LQ performance measure of the form J ( ux ) = ∞ 2 ∫0 qδx + ru x dt 2 2 Design a Kalman filter that estimates the state vector given the force measurements 'x-force'. The performance criterion J ( u x ) penalizes low and high frequencies equally. Because low-frequency variations are of primary concern, eliminate the 9-36 LQG Regulation high-frequency content of δ x with the low-pass filter 30 ⁄ ( s + 30 ) and use the filtered value in the LQ performance criterion. lpf = tf(30,[1 30]) % Connect low-pass filter to first output of Px Pxdes = append(lpf,1) * Px set(Pxdes,'outputn',{'x-gap*' 'x-force'}) % Design the state-feedback gain using LQRY and q=1, r=1e–4 kx = lqry(Pxdes(1,1),1,1e–4) Note: lqry expects all inputs to be commands and all outputs to be measurements. Here the command 'u-x' and the measurement 'x-gap*' (filtered gap) are the first input and first output of Pxdes. Hence, use the syntax Pxdes(1,1) to specify just the I/O relation between 'u-x' and 'x-gap*'. Next, design the Kalman estimator with the function kalman. The process noise wx = w ex w ix has unit covariance by construction. Set the measurement noise covariance to 1000 to limit the high frequency gain, and keep only the measured output 'x-force' for estimator design. estx = kalman(Pxdes(2,:),eye(2),1000) Finally, connect the state-feedback gain kx and state estimator estx to form the LQG regulator. Regx = lqgreg(estx,kx) This completes the LQG design for the x -axis. 9-37 9 Design Case Studies Let’s look at the regulator Bode response between 0.1 and 1000 rad/sec. bode(Regx,{0.1 1000}) The phase response has an interesting physical interpretation. First, consider an increase in input thickness. This low-frequency disturbance boosts both output thickness and rolling force. Because the regulator phase is approximately 0o at low frequencies, the feedback loop then adequately reacts by increasing the hydraulic force to offset the thickness increase. Now consider the effect of eccentricity. Eccentricity causes fluctuations in the roll gap (gap between the rolling cylinders). When the roll gap is minimal, the rolling force increases and the beam thickness diminishes. The hydraulic force must then be reduced (negative force feedback) to restore the desired thickness. This is exactly what the LQG regulator does as its phase drops to –180o near the natural frequency of the eccentricity disturbance (6 rad/sec). 9-38 LQG Regulation Next, compare the open- and closed-loop responses from disturbance to thickness gap. Use feedback to close the loop. To help specify the feedback connection, look at the I/O names of the plant Px and regulator Regx. Px.inputname ans = 'u-x' 'w-ex' 'w-ix' Regx.outputname ans = 'u-x' Px.outputname ans = 'x-gap' 'x-force' Regx.inputname ans = 'x-force' This indicates that you must connect the first input and second output of Px to the regulator. clx = feedback(Px,Regx,1,2,+1) % Note: +1 for positive feedback 9-39 9 Design Case Studies You are now ready to compare the open- and closed-loop Bode responses from disturbance to thickness gap. bode(Px(1,2:3),'--',clx(1,2:3),'-',{0.1 100}) Bode Diagrams From: w−ex From: w−ix 0 −20 −40 Phase (deg); Magnitude (dB) −60 −80 −100 0 −50 To: x−gap −100 −150 −200 −250 −300 −1 10 0 10 1 10 2 −1 10 10 0 10 1 10 2 10 Frequency (rad/sec) The dashed lines show the open-loop response. Note that the peak gain of the eccentricity-to-gap response and the low-frequency gain of the input-thickness-to-gap response have been reduced by about 20 dB. Finally, use lsim to simulate the open- and closed-loop time responses to the white noise inputs w ex and w ix . Choose dt=0.01 as sampling period for the 9-40 LQG Regulation simulation, and derive equivalent discrete white noise inputs for this sampling rate. dt = 0.01 t = 0:dt:50 % time samples % Generate unit-covariance driving noise wx = [w-ex;w-ix]. % Equivalent discrete covariance is 1/dt wx = sqrt(1/dt) * randn(2,length(t)) lsim(Px(1,2:3),':',clx(1,2:3),'-',wx,t) The dotted lines correspond to the open-loop response. In this simulation, the LQG regulation reduces the peak thickness variation by a factor 4. 9-41 9 Design Case Studies LQG Design for the y-Axis The LQG design for the y -axis (regulation of the y thickness) follows the exact same steps as for the x -axis. % Specify model components Hy = tf(7.8e8,[1 71 88^2],'inputn','u-y') Fiy = tf(2e4,[1 0.05],'inputn','w-iy') Fey = tf([1e5 0],[1 0.19 9.4^2],'inputn','w-ey') gy = 0.5e–6 % force-to-gap gain % Build open-loop model Py = append([ss(Hy) Fey],Fiy) Py = [–gy gy;1 1] * Py set(Py,'outputn',{'y-gap' 'y-force'}) % State-feedback gain design Pydes = append(lpf,1) * Py % Add low-freq. weigthing set(Pydes,'outputn',{'y-gap*' 'y-force'}) ky = lqry(Pydes(1,1),1,1e–4) % Kalman estimator design esty = kalman(Pydes(2,:),eye(2),1e3) % Form SISO LQG regulator for y-axis and close the loop Regy = lqgreg(esty,ky) cly = feedback(Py,Regy,1,2,+1) 9-42 LQG Regulation Compare the open- and closed-loop response to the white noise input disturbances. dt = 0.01 t = 0:dt:50 wy = sqrt(1/dt) * randn(2,length(t)) lsim(Py(1,2:3),':',cly(1,2:3),'-',wy,t) The dotted lines correspond to the open-loop response. The simulation results are comparable to those for the x -axis. Cross-Coupling Between Axes The x / y thickness regulation, is a MIMO problem. So far you have treated each axis separately and closed one SISO loop at a time. This design is valid as long as the two axes are fairly decoupled. Unfortunately, this rolling mill 9-43 9 Design Case Studies process exhibits some degree of cross-coupling between axes. Physically, an increase in hydraulic force along the x -axis compresses the material, which in turn boosts the repelling force on the y -axis cylinders. The result is an increase in y -thickness and an equivalent (relative) decrease in hydraulic force along the y-axis. The coupling between axes is as follows. + δx + ux x-axis w ex model gx w ix – + g xy fx g yx + – uy fy y-axis w ey w iy model gy + + g xy = 0.1 g yx = 0.4 Figure 9-2: Coupling between the x- and y-axes 9-44 δy LQG Regulation Accordingly, the thickness gaps and rolling forces are related to the outputs δ x, f x, ... of the x- and y-axis models by δx δy fx 0 0 g yx g x δx 0 1 g xy g y 0 δy 0 0 1 – g yx fx 0 0 – g xy 1 fy fy = 1 cross-coupling matrix Let’s see how the previous “decoupled” LQG design fares when cross-coupling is taken into account. To build the two-axes model shown in Figure 9-2, append the models Px and Py for the x - and y-axes. P = append(Px,Py) For convenience, reorder the inputs and outputs so that the commands and thickness gaps appear first. P = P([1 3 2 4],[1 4 2 3 5 6]) P.outputname ans = 'x-gap' 'y-gap' 'x-force' 'y-force' Finally, place the cross-coupling matrix in series with the outputs. gxy = 0.1; gyx = 0.4; CCmat = [eye(2) [0 gyx*gx;gxy*gy 0] ; zeros(2) [1 –gyx;–gxy 1]] Pc = CCmat * P Pc.outputname = P.outputname To simulate the closed-loop response, also form the closed-loop model by feedin = 1:2 % first two inputs of Pc are the commands feedout = 3:4 % last two outputs of Pc are the measurements cl = feedback(Pc,append(Regx,Regy),feedin,feedout,+1) 9-45 9 Design Case Studies You are now ready to simulate the open- and closed-loop responses to the driving white noises wx (for the x-axis) and wy (for the y-axis). wxy = [wx ; wy] lsim(Pc(1:2,3:6),':',cl(1:2,3:6),'-',wxy,t) The response reveals a severe deterioration in regulation performance along the x-axis (the peak thickness variation is about four times larger than in the simulation without cross-coupling). Hence, designing for one loop at a time is inadequate for this level of cross-coupling, and you must perform a joint-axis MIMO design to correctly handle coupling effects. 9-46 LQG Regulation MIMO LQG Design Start with the complete two-axis state-space model Pc derived above. The model inputs and outputs are Pc.inputname ans = 'u-x' 'u-y' 'w-ex' 'w-ix' 'w_ey' 'w_iy' P.outputname ans = 'x-gap' 'y-gap' 'x-force' 'y-force' As earlier, add low-pass filters in series with the 'x-gap' and 'y-gap' outputs to penalize only low-frequency thickness variations. Pdes = append(lpf,lpf,eye(2)) * Pc Pdes.outputn = Pc.outputn Next, design the LQ gain and state estimator as before (there are now two commands and two measurements). k = lqry(Pdes(1:2,1:2),eye(2),1e–4*eye(2)) est = kalman(Pdes(3:4,:),eye(4),1e3*eye(2)) RegMIMO = lqgreg(est,k) % LQ gain % Kalman estimator % form MIMO LQG regulator 9-47 9 Design Case Studies The resulting LQG regulator RegMIMO has two inputs and two outputs. RegMIMO.inputname ans = 'x-force' 'y-force' RegMIMO.outputname ans = 'u-x' 'u-y' Plot its singular value response (principal gains). sigma(RegMIMO) 9-48 LQG Regulation Next, plot the open- and closed-loop time responses to the white noise inputs (using the MIMO LQG regulator for feedback). % Form the closed-loop model cl = feedback(Pc,RegMIMO,1:2,3:4,+1); % Simulate with LSIM using same noise inputs lsim(Pc(1:2,3:6),':',cl(1:2,3:6),'-',wxy,t) The MIMO design is a clear improvement over the separate SISO designs for each axis. In particular, the level of x / y thickness variation is now comparable to that obtained in the decoupled case. This example illustrates the benefits of direct MIMO design for multivariable systems. 9-49 9 Design Case Studies Kalman Filtering This final case study illustrates the use of the Control System Toolbox for Kalman filter design and simulation. Both steady-state and time-varying Kalman filters are considered. Consider the discrete plant x [ n + 1 ] = Ax [ n ] + B ( u [ n ] + w [ n ] ) y [ n ] = Cx [ n ] with additive Gaussian noise w [ n ] on the input u [ n ] and data A = [1.1269 1.0000 0 –0.4940 0 1.0000 0.1129 0 0]; B = [–0.3832 0.5919 0.5191]; C = [1 0 0]; Our goal is to design a Kalman filter that estimates the output y [ n ] given the inputs u [ n ] and the noisy output measurements y v [ n ] = Cx [ n ] + v [ n ] where v [ n ] is some Gaussian white noise. Discrete Kalman Filter The equations of the steady-state Kalman filter for this problem are given as follows. Measurement update xˆ [ n n ] = xˆ [ n n – 1 ] + M ( y v [ n ] – Cxˆ [ n n – 1 ] ) Time update xˆ [ n + 1 n ] = Axˆ [ n n ] + Bu [ n ] 9-50 Kalman Filtering In these equations: • xˆ [ n n – 1 ] is the estimate of x [ n ] given past measurements up to y v [ n – 1 ] • xˆ [ n n ] is the updated estimate based on the last measurement y v [ n ] Given the current estimate xˆ [ n n ] , the time update predicts the state value at the next sample n + 1 (one-step-ahead predictor). The measurement update then adjusts this prediction based on the new measurement y v [ n + 1 ] . The correction term is a function of the innovation, that is, the discrepancy. y v [ n + 1 ] – Cxˆ [ n + 1 n ] = C ( x [ n + 1 ] – xˆ [ n + 1 n ] ) between the measured and predicted values of y [ n + 1 ] . The innovation gain M is chosen to minimize the steady-state covariance of the estimation error given the noise covariances T E ( w [ n ]w [ n ] ) = Q , T E ( v [ n ]v [ n ] ) = R You can combine the time and measurement update equations into one state-space model (the Kalman filter). xˆ [ n + 1 n ] = A ( I – MC ) xˆ [ n n – 1 ] + B AM u[n] yv [ n ] yˆ [ n n ] = C ( I – MC ) xˆ [ n n – 1 ] + CM y v [ n ] This filter generates an optimal estimate yˆ [ n n ] of y [ n ] . Note that the filter state is xˆ [ n n – 1 ] . Steady-State Design You can design the steady-state Kalman filter described above with the function kalman. First specify the plant model with the process noise. x [ n + 1 ] = Ax [ n ] + Bu [ n ] + Bw [ n ] y [ n ] = Cx [ n ] (state equation) (measurement equation) 9-51 9 Design Case Studies This is done by % Note: set sample time to –1 to mark model as discrete Plant = ss(A,[B B],C,0,–1,'inputname',{'u' 'w'},... 'outputname','y'); Assuming that Q = R = 1 , you can now design the discrete Kalman filter by Q = 1; R = 1; [kalmf,L,P,M] = kalman(Plant,Q,R); This returns a state-space model kalmf of the filter as well as the innovation gain M M = 3.7980e–01 8.1732e–02 –2.5704e–01 The inputs of kalmf are u and y v , and its outputs are the plant output and state estimates y e = yˆ [ n n ] and xˆ [ n n ] . u yv kalmf Kalman filter 9-52 ye xˆ [ n n ] Kalman Filtering Because you are interested in the output estimate y e , keep only the first output of kalmf. Type kalmf = kalmf(1,:); kalmf a = x1_e x2_e x3_e x1_e 0.76830 0.62020 –0.08173 x2_e –0.49400 0 1.00000 x1_e x2_e x3_e u –0.38320 0.59190 0.51910 y 0.35860 0.37980 0.08173 y_e x1_e 0.62020 x2_e 0 y_e u 0 y 0.37980 x3_e 0.11290 0 0 b = c = x3_e 0 d = Sampling time: unspecified Discrete-time system. To see how the filter works, generate some input data and random noise and compare the filtered response y e with the true response y . You can either generate each response separately, or generate both together. To simulate each response separately, use lsim with the plant alone first, and then with the plant and filter hooked up together. The joint simulation alternative is detailed next. 9-53 9 Design Case Studies The block diagram below shows how to generate both true and filtered outputs. u Plant Process noise y Kalman filter yv ye Sensor noise y You can construct a state-space model of this block diagram with the functions parallel and feedback. First build a complete plant model with u, w, v as inputs and y and y v (measurements) as outputs. a b c d P = = = = = A; [B B 0*B]; [C;C]; [0 0 0;0 0 1]; ss(a,b,c,d,–1,'inputname',{'u' 'w' 'v'},... 'outputname',{'y' 'yv'}); Then use parallel to form the following parallel connection. w y v P yv u Kalman yv filter sys = parallel(P,kalmf,1,1,[],[]) 9-54 ye Kalman Filtering Finally, close the sensor loop by connecting the plant output y v to the filter input y v with positive feedback. % Close loop around input #4 and output #2 SimModel = feedback(sys,1,4,2,1) % Delete yv from I/O list SimModel = SimModel([1 3],[1 2 3]) The resulting simulation model has w, v, u as inputs and y, y e as outputs. SimModel.input ans = 'w' 'v' 'u' SimModel.output ans = 'y' 'y_e' You are now ready to simulate the filter behavior. Generate a sinusoidal input u and process and measurement noise vectors w and v . t = [0:100]'; u = sin(t/5); n = length(t) randn('seed',0) w = sqrt(Q)*randn(n,1); v = sqrt(R)*randn(n,1); Now simulate with lsim. [out,x] = lsim(SimModel,[w,v,u]); y = out(:,1); ye = out(:,2); yv = y + v; % true response % filtered response % measured response 9-55 9 Design Case Studies and compare the true and filtered responses graphically. subplot(211), plot(t,y,'--',t,ye,'-'), xlabel('No. of samples'), ylabel('Output') subplot(212), plot(t,y–yv,'-.',t,y–ye,'-'), xlabel('No. of samples'), ylabel('Error') The first plot shows the true response y (dashed line) and the filtered output y e (solid line). The second plot compares the measurement error (dash-dot) with the estimation error (solid). This plot shows that the noise level has been significantly reduced. This is confirmed by the following error covariance computations. MeasErr = y–yv; MeasErrCov = sum(MeasErr.*MeasErr)/length(MeasErr); EstErr = y–ye; EstErrCov = sum(EstErr.*EstErr)/length(EstErr); 9-56 Kalman Filtering The error covariance before filtering (measurement error) is MeasErrCov MeasErrCov = 1.1138 while the error covariance after filtering (estimation error) is only EstErrCov EstErrCov = 0.2722 Time-Varying Kalman Filter The time-varying Kalman filter is a generalization of the steady-state filter for time-varying systems or LTI systems with nonstationary noise covariance. Given the plant state and measurement equations x [ n + 1 ] = Ax [ n ] + Bu [ n ] + Gw [ n ] y v [ n ] = Cx [ n ] + v [ n ] the time-varying Kalman filter is given by the recursions Measurement update xˆ [ n n ] = xˆ [ n n – 1 ] + M [ n ] ( y v [ n ] – Cxˆ [ n n – 1 ] ) T –1 T M [ n ] = P [ n n – 1 ]C ( R [ n ] + CP [ n n – 1 ]C ) P [ n n ] = ( I – M [ n ]C ) P [ n n – 1 ] Time update xˆ [ n + 1 n ] = Axˆ [ n n ] + Bu [ n ] T P [ n + 1 n ] = AP [ n n ]A + GQ [ n ]G T 9-57 9 Design Case Studies with xˆ [ n n – 1 ] and xˆ [ n n ] as defined on page 9-50, and in the following. T Q [ n ] = E ( w [ n ]w [ n ] ) T R [ n ] = E ( v [ n ]v [ n ] ) T P [ n n ] = E( { x [ n] – x [ n n ] }{ x [ n] – x [ n n ] } ) T P[n n – 1 ] = E( { x[n ] – x[n n – 1 ] }{ x[ n ] – x[ n n – 1 ]} ) For simplicity, we have dropped the subscripts indicating the time dependence of the state-space matrices. Given initial conditions x [ 1 0 ] and P [ 1 0 ] , you can iterate these equations to perform the filtering. Note that you must update both the state estimates x [ n . ] and error covariance matrices P [ n . ] at each time sample. Time-Varying Design Although the Control System Toolbox does not offer specific commands to perform time-varying Kalman filtering, it is easy to implement the filter recursions in MATLAB. This section shows how to do this for the stationary plant considered above. First generate noisy output measurements % Use process noise w and measurement noise v generated above sys = ss(A,B,C,0,–1); y = lsim(sys,u+w); % w = process noise yv = + v; % v = measurement noise Given the initial conditions x[1 0] = 0 , 9-58 P [ 1 0 ] = BQB T Kalman Filtering you can implement the time-varying filter with the following for loop. P = B*Q*B'; % Initial error covariance x = zeros(3,1); % Initial condition on the state ye = zeros(length(t),1); ycov = zeros(length(t),1); for i=1:length(t) % Measurement update Mn = P*C'/(C*P*C'+R); x = x + Mn*(yv(i)–C*x); P = (eye(3)–Mn*C)*P; % x[n|n] % P[n|n] ye(i) = C*x; errcov(i) = C*P*C'; % Time update x = A*x + B*u(i); P = A*P*A' + B*Q*B'; end % x[n+1|n] % P[n+1|n] 9-59 9 Design Case Studies You can now compare the true and estimated output graphically. subplot(211), plot(t,y,'--',t,ye,'-') subplot(212), plot(t,y-yv,'-.',t,y-ye,'-') The first plot shows the true response y (dashed line) and the filtered response y e (solid line). The second plot compares the measurement error (dash-dot) with the estimation error (solid). 9-60 Kalman Filtering The time-varying filter also estimates the covariance errcov of the estimation error y – y e at each sample. Plot it to see if your filter reached steady state (as you expect with stationary input noise). subplot(211) plot(t,errcov), ylabel('Error covar') From this covariance plot, you can see that the output covariance did indeed reach a steady state in about five samples. From then on, your time-varying filter has the same performance as the steady-state version. 9-61 9 Design Case Studies Compare with the estimation error covariance derived from the experimental data. Type EstErr = y–ye; EstErrCov = sum(EstErr.*EstErr)/length(EstErr) EstErrCov = 0.2718 This value is smaller than the theoretical value errcov and close to the value obtained for the steady-state design. Finally, note that the final value M [ n ] and the steady-state value M of the innovation gain matrix coincide. Mn, M Mn = 0.3798 0.0817 –0.2570 M = 0.3798 0.0817 –0.2570 9-62 Kalman Filtering References [1] Grimble, M.J., Robust Industrial Control: Optimal Design Approach for Polynomial Systems, Prentice Hall, 1994, p. 261 and pp. 443–456. 9-63 9 Design Case Studies 9-64 10 Reliable Computations Conditioning and Numerical Stability . . . . . . . . 10-4 Conditioning . . . . . . . . . . . . . . . . . . . . 10-4 Numerical Stability . . . . . . . . . . . . . . . . . . 10-6 Choice of LTI Model State Space . . . . . Transfer Function . . Zero-Pole-Gain Models Scaling Summary . . . . . . . . . . . . . . . . . . . . . . . . . . . . . . . . . . . . . . . . . . . . . . . . . . . . . . . . . . . . . 10-8 . 10-8 . 10-8 10-14 . . . . . . . . . . . . . . . . . . . . . 10-15 . . . . . . . . . . . . . . . . . . . . 10-17 References . . . . . . . . . . . . . . . . . . . . 10-18 10 Reliable Computations When working with low-order SISO models (less than five states), computers are usually quite forgiving and insensitive to numerical problems. You generally won't encounter any numerical difficulties and MATLAB will give you accurate answers regardless of the model or conversion method you choose. For high order SISO models and MIMO models, however, the finite-precision arithmetic of a computer is not so forgiving and you must exercise caution. In general, to get a numerically accurate answer from a computer, you need: • A well-conditioned problem • An algorithm that is numerically stable in finite-precision arithmetic • A good software implementation of the algorithm A problem is said to be well-conditioned if small changes in the data cause only small corresponding changes in the solution. If small changes in the data have the potential to induce large changes in the solution, the problem is said to be ill-conditioned. An algorithm is numerically stable if it does not introduce any more sensitivity to perturbation than is already inherent in the problem. Many numerical linear algebra algorithms can be shown to be backward stable; i.e., the computed solution can be shown to be (near) the exact solution of a slightly perturbed original problem. The solution of a slightly perturbed original problem will be close to the true solution if the problem is well-conditioned. Thus, a stable algorithm cannot be expected to solve an ill-conditioned problem any more accurately than the data warrant, but an unstable algorithm can produce poor solutions even to well-conditioned problems. For further details and references to the literature see [5]. While most of the tools in the Control System Toolbox use reliable algorithms, some of the tools do not use stable algorithms and some solve ill-conditioned problems. These unreliable tools work quite well on some problems (low-order systems) but can encounter numerical difficulties, often severe, when pushed on higher-order problems. These tools are provided because: • They are quite useful for low-order systems, which form the bulk of real-world engineering problems. • Many control engineers think in terms of these tools. • A more reliable alternative tool is usually available in this toolbox. • They are convenient for pedagogical purposes. 10-2 At the same time, it is important to appreciate the limitations of computer analyses. By following a few guidelines, you can avoid certain tools and models when they are likely to get you into trouble. The following sections try to illustrate, through examples, some of the numerical pitfalls to be avoided. We also encourage you to get the most out of the good algorithms by ensuring, if possible, that your models give rise to problems that are well-conditioned. 10-3 10 Reliable Computations Conditioning and Numerical Stability Two of the key concepts in numerical analysis are the conditioning of problems and the stability of algorithms. Conditioning Consider the linear system Ax = b given by A = 0.7800 0.9130 0.5630 0.6590 b = 0.2170 0.2540 The true solution is x = [1, –1]' and you can calculate it approximately using MATLAB. x = A\b x = 1.0000 –1.0000 format long, x x = 0.99999999991008 –0.99999999987542 Of course, in real problems you almost never have the luxury of knowing the true solution. This problem is very ill-conditioned. To see this, add a small perturbation to A E = 0.0010 –0.0020 0.0010 –0.0010 and solve the perturbed system ( A + E )x = b xe = (A+E)\b xe = –5.0000 7.3085 10-4 Conditioning and Numerical Stability Notice how much the small change in the data is magnified in the solution. One way to measure the magnification factor is by means of the quantity A A –1 called the condition number of A with respect to inversion. The condition number determines the loss in precision due to roundoff errors in Gaussian elimination and can be used to estimate the accuracy of results obtained from matrix inversion and linear equation solution. It arises naturally in –1 perturbation theories that compare the perturbed solution ( A + E ) b with the –1 true solution A b . In MATLAB, the function cond calculates the condition number in 2-norm. cond(A) is the ratio of the largest singular value of A to the smallest. Try it for the example above. The usual rule is that the exponent log10(cond(A)) on the condition number indicates the number of decimal places that the computer can lose to roundoff errors. IEEE standard double precision numbers have about 16 decimal digits of accuracy, so if a matrix has a condition number of 1010, you can expect only six digits to be accurate in the answer. If the condition number is much greater than 1/sqrt(eps), caution is advised for subsequent computations. For IEEE arithmetic, the machine precision, eps, is about 2.2 × 10 -16, and 1/sqrt(eps) = 6.7 × 10 8. Another important aspect of conditioning is that, in general, residuals are reliable indicators of accuracy only if the problem is well-conditioned. To illustrate, try computing the residual vector r = Ax – b for the two candidate solutions x = [0.999 –1.001]' and x = [0.341 –0.087]'. Notice that the second, while clearly a much less accurate solution, gives a far smaller residual. The conclusion is that residuals are unreliable indicators of relative solution accuracy for ill-conditioned problems. This is a good reason to be concerned with computing or estimating accurately the condition of your problem. Another simple example of an ill-conditioned problem is the n -by- n matrix with ones on the first upper-diagonal. A = diag(ones(1,n–1),1); This matrix has n eigenvalues at 0. Now consider a small perturbation of the –n data consisting of adding the number 2 to the first element in the last ( n th) 10-5 10 Reliable Computations row of A. This perturbed matrix has n distinct eigenvalues λ 1, ..., λ n with λ k = 1 ⁄ 2 exp ( j2πk ⁄ n ) . Thus, you can see that this small perturbation in the n data has been magnified by a factor on the order of 2 to result in a rather large perturbation in the solution (the eigenvalues of A). Further details and related examples are to be found in [7]. It is important to realize that a matrix can be ill-conditioned with respect to inversion but have a well-conditioned eigenproblem, and vice versa. For example, consider an upper triangular matrix of ones (zeros below the diagonal) given by A = triu(ones(n)); This matrix is ill-conditioned with respect to its eigenproblem (try small perturbations in A(n,1) for, say, n=20), but is well-conditioned with respect to inversion (check its condition number). On the other hand, the matrix A = 1 1 1 1+δ has a well-conditioned eigenproblem, but is ill-conditioned with respect to inversion for small δ . Numerical Stability Numerical stability is somewhat more difficult to illustrate meaningfully. Consult the references in [5], [6], and [7] for further details. Here is one small example to illustrate the difference between stability and conditioning. Gaussian elimination with no pivoting for solving the linear system Ax = b is known to be numerically unstable. Consider A = 0.001 1.000 1.000 – 1.000 b = 1.000 0.000 All computations are carried out in three-significant-figure decimal arithmetic. –1 The true answer x = A b is approximately x = 10-6 0.999 0.999 Conditioning and Numerical Stability Using row 1 as the pivot row (i.e., subtracting 1000 times row 1 from row 2) you arrive at the equivalent triangular system. 0.001 1.000 x 1 0 – 1000 x 2 = 1.000 – 1000 Note that the coefficient multiplying x 2 in the second equation should be – 1001, but because of roundoff, becomes – 1000 . As a result, the second equation yields x 2 = 1.000 , a good approximation, but now back-substitution in the first equation 0.001x 1 = 1.000 – ( 1.000 ) ( 1.000 ) yields x 1 = 0.000 . This extremely bad approximation of x 1 is the result of numerical instability. The problem itself can be shown to be quite well-conditioned. Of course, MATLAB implements Gaussian elimination with pivoting. 10-7 10 Reliable Computations Choice of LTI Model Now turn to the implications of the results in the last section on the linear modeling techniques used for control engineering. The Control System Toolbox includes the following types of LTI models that are applicable to discussions of computational reliability: • State space • Transfer function, polynomial form • Transfer function, factored zero-pole-gain form The following subsections show that state space is most preferable for numerical computations. State Space The state-space representation is the most reliable LTI model to use for computer analysis. This is one of the reasons for the popularity of “modern” state-space control theory. Stable computer algorithms for eigenvalues, frequency response, time response, and other properties of the ( A, B, C, D ) quadruple are known [5] and implemented in this toolbox. The state-space model is also the most natural model in MATLAB's matrix environment. Even with state-space models, however, accurate results are not guaranteed, because of the problems of finite-word-length computer arithmetic discussed in the last section. A well-conditioned problem is usually a prerequisite for obtaining accurate results and makes it important to have reasonable scaling of the data. Scaling is discussed further in the “Scaling” section later in this chapter. Transfer Function Transfer function models, when expressed in terms of expanded polynomials, tend to be inherently ill-conditioned representations of LTI systems. For systems of order greater than 10, or with very large/small polynomial coefficients, difficulties can be encountered with functions like roots, conv, bode, step, or conversion functions like ss or zpk. 10-8 Choice of LTI Model A major difficulty is the extreme sensitivity of the roots of a polynomial to its coefficients. This example is adapted from Wilkinson, [6] as an illustration. Consider the transfer function 1 1 H ( s ) = ------------------------------------------------------------- = ---------------------------------------------------------20 19 ( s + 1 ) ( s + 2 )... ( s + 20 ) s + 210s + ... + 20! The A matrix of the companion realization of H ( s ) is A = 0 0 : 0 – 20! 1 0 : 0 . 0 1 . ... ... ... ... . . . 0 0 : 1 – 210 Despite the benign looking poles of the system (at –1,–2,..., –20) you are faced 18 with a rather large range in the elements of A , from 1 to 20! ≈ 2.4 × 10 . But 19 the difficulties don’t stop here. Suppose the coefficient of s in the transfer – 23 – 23 –7 ≈ 1.2 × 10 ). function (or A ( n, n ) ) is perturbed from 210 to 210 + 2 (2 Then, computed on a VAX (IEEE arithmetic has enough mantissa for only n = 17 ), the poles of the perturbed transfer function (equivalently, the eigenvalues of A ) are eig(A)' ans = Columns 1 through 7 –19.9998 –19.0019 –17.9916 –17.0217 –15.9594 –15.0516 –13.9504 Columns 8 through 14 –13.0369 –11.9805 –11.0081 –9.9976 –9.0005 –7.9999 Columns 15 through 20 –6.0000 –5.0000 –4.0000 –3.0000 –2.0000 –1.0000 –7.0000 The problem here is not roundoff. Rather, high-order polynomials are simply intrinsically very sensitive, even when the zeros are well separated. In this –9 case, a relative perturbation of the order of 10 induced relative –2 perturbations of the order of 10 in some roots. But some of the roots changed 10-9 10 Reliable Computations very little. This is true in general. Different roots have different sensitivities to different perturbations. Computed roots may then be quite meaningless for a polynomial, particularly high-order, with imprecisely known coefficients. Finding all the roots of a polynomial (equivalently, the poles of a transfer function or the eigenvalues of a matrix in controllable or observable canonical form) is often an intrinsically sensitive problem. For a clear and detailed treatment of the subject, including the tricky numerical problem of deflation, consult [6]. It is therefore preferable to work with the factored form of polynomials when available. To compute a state-space model of the transfer function H ( s ) defined above, for example, you could expand the denominator of H , convert the transfer function model to state space, and extract the state-space data by H1 = tf(1,poly(1:20)) H1ss = ss(H1) [a1,b1,c1] = ssdata(H1) However, you should rather keep the denominator in factored form and work with the zero-pole-gain representation of H ( s ) . H2 = zpk([],1:20,1) H2ss = ss(H2) [a2,b2,c2] = ssdata(H2) Indeed, the resulting state matrix a2 is better conditioned. [cond(a1) cond(a2)] ans = 2.7681e+03 10-10 8.8753e+01 Choice of LTI Model and the conversion from zero-pole-gain to state space incurs no loss of accuracy in the poles. format long e [sort(eig(a1)) sort(eig(a2))] ans = 9.999999999998792e-01 2.000000000001984e+00 3.000000000475623e+00 3.999999981263996e+00 5.000000270433721e+00 5.999998194359617e+00 7.000004542844700e+00 8.000013753274901e+00 8.999848908317270e+00 1.000059459550623e+01 1.099854678336595e+01 1.200255822210095e+01 1.299647702454549e+01 1.400406940833612e+01 1.499604787386921e+01 1.600304396718421e+01 1.699828695210055e+01 1.800062935148728e+01 1.899986934359322e+01 2.000001082693916e+01 1.000000000000000e+00 2.000000000000000e+00 3.000000000000000e+00 4.000000000000000e+00 5.000000000000000e+00 6.000000000000000e+00 7.000000000000000e+00 8.000000000000000e+00 9.000000000000000e+00 1.000000000000000e+01 1.100000000000000e+01 1.200000000000000e+01 1.300000000000000e+01 1.400000000000000e+01 1.500000000000000e+01 1.600000000000000e+01 1.700000000000000e+01 1.800000000000000e+01 1.900000000000000e+01 2.000000000000000e+01 There is another difficulty with transfer function models when realized in state-space form with ss. They may give rise to badly conditioned eigenvector matrices, even if the eigenvalues are well separated. For example, consider the normal matrix A = [5 4 1 1 4 5 1 1 1 1 4 2 1 1 2 4] 10-11 10 Reliable Computations Its eigenvectors and eigenvalues are given as follows. [v,d] = eig(A) v = 0.7071 –0.7071 0.0000 –0.0000 –0.0000 0.0000 0.7071 –0.7071 –0.3162 –0.3162 0.6325 0.6325 0.6325 0.6325 0.3162 0.3162 0 2.0000 0 0 0 0 5.0000 0 0 0 0 10.0000 d = 1.0000 0 0 0 The condition number (with respect to inversion) of the eigenvector matrix is cond(v) ans = 1.000 Now convert a state-space model with the above A matrix to transfer function form, and back again to state-space form. b = [1 ; 1 ; 0 ; –1]; c = [0 0 2 1]; H = tf(ss(A,b,c,0)); [Ac,bc,cc] = ssdata(H) % transfer function % convert back to state space The new A matrix is Ac = 18.0000 16.0000 0 0 –6.0625 0 4.0000 0 2.8125 0 0 1.0000 –1.5625 0 0 0 Note that Ac is not a standard companion matrix and has already been balanced as part of the ss conversion (see ssbal for details). 10-12 Choice of LTI Model Note also that the eigenvectors have changed. [vc,dc] = eig(Ac) vc = –0.5017 –0.8026 –0.3211 –0.0321 0.2353 0.7531 0.6025 0.1205 0.0510 0.4077 0.8154 0.4077 0.0109 0.1741 0.6963 0.6963 dc = 10.0000 0 0 0 0 5.0000 0 0 0 0 2.0000 0 0 0 0 1.0000 The condition number of the new eigenvector matrix cond(vc) ans = 34.5825 is thirty times larger. The phenomenon illustrated above is not unusual. Matrices in companion form or controllable/observable canonical form (like Ac) typically have worse-conditioned eigensystems than matrices in general state-space form (like A). This means that their eigenvalues and eigenvectors are more sensitive to perturbation. The problem generally gets far worse for higher-order systems. Working with high-order transfer function models and converting them back and forth to state space is numerically risky. In summary, the main numerical problems to be aware of in dealing with transfer function models (and hence, calculations involving polynomials) are: • The potentially large range of numbers leads to ill-conditioned problems, especially when such models are linked together giving high-order polynomials. 10-13 10 Reliable Computations • The pole locations are very sensitive to the coefficients of the denominator polynomial. • The balanced companion form produced by ss, while better than the standard companion form, often results in ill-conditioned eigenproblems, especially with higher-order systems. The above statements hold even for systems with distinct poles, but are particularly relevant when poles are multiple. Zero-Pole-Gain Models The third major representation used for LTI models in MATLAB is the factored, or zero-pole-gain (ZPK) representation. It is sometimes very convenient to describe a model in this way although most major design methodologies tend to be oriented towards either transfer functions or state-space. In contrast to polynomials, the ZPK representation of systems can be more reliable. At the very least, the ZPK representation tends to avoid the extraordinary arithmetic range difficulties of polynomial coefficients, as illustrated in the “Transfer Function” section. The transformation from state space to zero-pole-gain is stable, although the handling of infinite zeros can sometimes be tricky, and repeated roots can cause problems. If possible, avoid repeated switching between different model representations. As discussed in the previous sections, when transformations between models are not numerically stable, roundoff errors are amplified. 10-14 Scaling Scaling State space is the preferred model for LTI systems, especially with higher order models. Even with state-space models, however, accurate results are not guaranteed, because of the finite-word-length arithmetic of the computer. A well-conditioned problem is usually a prerequisite for obtaining accurate results. You should generally normalize or scale the ( A, B, C, D ) matrices of a system to improve their conditioning. An example of a poorly scaled problem might be a dynamic system where two states in the state vector have units of light years and millimeters. You would expect the A matrix to contain both very large and very small numbers. Matrices containing numbers widely spread in value are often poorly conditioned both with respect to inversion and with respect to their eigenproblems, and inaccurate results can ensue. Normalization also allows meaningful statements to be made about the degree of controllability and observability of the various inputs and outputs. A set of ( A, B, C, D ) matrices can be normalized using diagonal scaling matrices N u , N x , and N y to scale u, x, and y. u = Nu un x = Nx xn y = Ny yn so the normalized system is · x n = A n xn + Bn u n yn = Cn xn + Dn un where –1 A n = N x AN x –1 C n = N y CN x –1 B n = N x BN u –1 D n = N y DN u Choose the diagonal scaling matrices according to some appropriate normalization procedure. One criterion is to choose the maximum range of each of the input, state, and output variables. This method originated in the days of analog simulation computers when u n , x n , and y n were forced to be between ± 10 Volts. A second method is to form scaling matrices where the diagonal entries are the smallest deviations that are significant to each variable. An 10-15 10 Reliable Computations excellent discussion of scaling is given in the introduction to the LINPACK Users’ Guide, [1]. Choose scaling based upon physical insight to the problem at hand. If you choose not to scale, and for many small problems scaling is not necessary, be aware that this choice affects the accuracy of your answers. Finally, note that the function ssbal performs automatic scaling of the state vector. Specifically, it seeks to minimize the norm of –1 –1 N x AN x Nx B CN x 0 by using diagonal scaling matrices N x . Such diagonal scaling is an economical way to compress the numerical range and improve the conditioning of subsequent state-space computations. 10-16 Summary Summary This chapter has described numerous things that can go wrong when performing numerical computations. You won’t encounter most of these difficulties when you solve practical lower-order problems. The problems described here pertain to all computer analysis packages. MATLAB has some of the best algorithms available, and, where possible, notifies you when there are difficulties. The important points to remember are: • State-space models are, in general, the most reliable models for subsequent computations. • Scaling model data can improve the accuracy of your results. • Numerical computing is a tricky business, and virtually all computer tools can fail under certain conditions. 10-17 10 Reliable Computations References [1] Dongarra, J.J., J.R. Bunch, C.B. Moler, and G.W. Stewart, LINPACK Users Guide, SIAM Publications, Philadelphia, PA, 1978. [2] Franklin, G.F. and J.D. Powell, Digital Control of Dynamic Systems, Addison-Wesley, 1980. [3] Kailath, T., Linear Systems, Prentice-Hall, 1980. [4] Laub, A.J., “Numerical Linear Algebra Aspects of Control Design Computations,” IEEE Transactions on Automatic Control, Vol. AC-30, No. 2, February 1985, pp. 97-108. [5] Wilkinson, J.H., Rounding Errors in Algebraic Processes, Prentice-Hall, 1963. [6] Wilkinson, J.H., The Algebraic Eigenvalue Problem, Oxford University Press, 1965. 10-18 11 Reference 11 Reference This chapter contains detailed descriptions of all Control System Toolbox functions. It begins with a list of functions grouped by subject area and continues with the reference entries in alphabetical order. Information is also available through the online Help facility. 11-2 Category Tables Category Tables Table 11-1: LTI Models Function Name Description drss Generate random discrete state-space model. dss Create descriptor state-space model. filt Create discrete filter with DSP convention. frd Create a frequency response data (FRD) model. frdata Retrieve data from an FRD model. get Query LTI model properties. ltimodels Information on LTI models ltiprops Information on all LTI properties. set Set LTI or response object properties. rss Generate random continuous state-space model. ss Create state-space model. ssdata, dssdata Retrieve state-space data or covert data to cell array format. tf Create transfer function. tfdata Retrieve transfer function data. totaldelay Provide the aggregate delay for an LTI model. zpk Create zero-pole-gain model. zpkdata Retrieve zero-pole-gain data. 11-3 11 Reference Table 11-2: Model Characteristics Function Name Description class Display model type ('tf', 'zpk', 'ss', or 'frd'). hasdelay Test true if LTI model has any type of delay. isa Test true if LTI model is of specified type. isct Test true for continuous-time models. isdt Test true for discrete-time models. isempty Test true for empty LTI models. isproper Test true for proper LTI models. issiso Test true for SISO models. ndims Get the number of model/array dimensions. size Get output/input/array dimensions or model order. Table 11-3: Model Conversion 11-4 Function Name Description c2d Convert from continuous- to discrete-time models. chgunits Convert the units property for FRD models. d2c Convert from discrete- to continuous-time models. d2d Resample discrete-time models. delay2z Convert delays in discrete-time models or FRD models. frd Convert to a frequency response data model. pade Compute the Padé approximation of delays. reshape Change the shape of an LTI array Category Tables Table 11-3: Model Conversion (Continued) Function Name Description residue Provide partial fraction expansion (see Using MATLAB). ss Convert to a state space model. tf Convert to a transfer function model. zpk Convert to a zero-pole-gain model. Table 11-4: Model Order Reduction Function Name Description balreal Calculate an I/O balanced realization. minreal Calculate minimal realization or pole/zero cancellation. modred Delete states in I/O balanced realization. sminreal Calculate structured model reduction. Table 11-5: State-Space Realizations Function Name Description canon Canonical state-space realizations. ctrb Controllability matrix. ctrbf Controllability staircase form. gram Controllability and observability gramians. obsv Observability matrix. obsvf Observability staircase form. 11-5 11 Reference Table 11-5: State-Space Realizations (Continued) Function Name Description ss2ss State coordinate transformation. ssbal Diagonal balancing of state-space realizations. Table 11-6: Model Dynamics Function Name Description damp Calculate natural frequency and damping. dcgain Calculate low-frequency (DC) gain. covar Calculate covariance of response to white noise. dsort Sort discrete-time poles by magnitude. esort Sort continuous-time poles by real part. norm Calculate norms of LTI models ( H 2 and L ∞ ). pole, eig Calculate the poles of an LTI model. pzmap Plot the pole/zero map of an LTI model. roots Calculate roots of polynomial (see Using MATLAB). zero Calculate zeros of an LTI model. Table 11-7: Model Building 11-6 Function Name Description append Append models in a block diagonal configuration. augstate Augment output by appending states. Category Tables Table 11-7: Model Building (Continued) Function Name Description connect Connect the subsystems of a block-diagonal model according to an interconnection scheme of your choice. conv Convolve two polynomials (see Using MATLAB). drmodel, drss Generate random discrete-time model. feedback Calculate the feedback connection of models. lft Calculate the star product (LFT interconnection). ord2 Generate second-order model. pade Compute the Padé approximation of time delays. parallel Create a generalized parallel connection. rmodel, rss Generate random continuous model. series Create a generalized series connection. stack Concatenate LTI models along array dimensions. Table 11-8: Time Response Function Name Description filter Simulate discrete SISO filter (see Using MATLAB). gensig Generate an input signal. impulse Calculate impulse response. initial Calculate initial condition response. lsim Simulate response of LTI model to arbitrary inputs. 11-7 11 Reference Table 11-8: Time Response (Continued) Function Name Description ltiview Open the LTI Viewer for linear response analysis. step Calculate step response. Table 11-9: Frequency Response 11-8 Function Name Description bode Calculate bode plot. evalfr Evaluate response at single complex frequency. freqresp Evaluate frequency response for selected frequencies. linspace Create a vector of evenly spaced frequencies. logspace Create a vector of logarithmically spaced frequencies. ltiview Open the LTI Viewer for linear response analysis. margin Calculate gain and phase margins. ngrid Superimpose grid lines on a Nichols plot. nichols Calculate Nichols plot. nyquist Calculate Nyquist plot. pzmap Calculate pole/zero map. rlocus Calculate root locus. rlocfind Find gain/pole on root locus. rltool Open Root Locus Design GUI. sgrid Superimpose s-plane grid on root locus or pole/zero map. Category Tables Table 11-9: Frequency Response (Continued) Function Name Description sigma Calculate singular value plot. zgrid Superimpose z-plane grid on root locus or pole/zero map. Table 11-10: Pole Placement Function Name Description acker Calculate SISO pole placement design. place Calculate MIMO pole placement design. estim Form state estimator given estimator gain. reg Form output-feedback compensator given state-feedback and estimator gains. rltool Open Root Locus Design GUI Table 11-11: LQG Design Function Name Description lqr Calculate the LQ-optimal gain for continuous models. dlqr Calculate the LQ-optimal gain for discrete models. lqry Calculate the LQ-optimal gain with output weighting. lqrd Calculate the discrete LQ gain for continuous models. kalman Calculate the Kalman estimator. 11-9 11 Reference Table 11-11: LQG Design (Continued) Function Name Description kalmd Calculate the discrete Kalman estimator for continuous models. lqgreg Form LQG regulator given LQ gain and Kalman filter. Table 11-12: Equation Solvers Function Name Description care Solve continuous-time algebraic Riccati equations. dare Solve discrete-time algebraic Riccati equations. lyap Solve continuous-time Lyapunov equations. dlyap Solve discrete-time Lyapunov equations. Table 11-13: Graphical User Interfaces for Model Analysis and Design 11-10 Function Name Description ltiview Open the LTI Viewer for linear response analysis. rltool Open the Root Locus Design GUI. acker Purpose 11acker Pole placement design for single-input systems Syntax k = acker(A,b,p) Description Given the single-input system · x = Ax + bu and a vector p of desired closed-loop pole locations, acker (A,b,p)uses Ackermann’s formula [1] to calculate a gain vector k such that the state feedback u = – kx places the closed-loop poles at the locations p. In other words, the eigenvalues of A – bk match the entries of p (up to ordering). Here A is the state transmitter matrix and b is the input to state transmission vector. You can also use acker for estimator gain selection by transposing the matrix A and substituting c' for b when y = cx is a single output. l = acker(a',c',p).' Limitations acker is limited to single-input systems and the pair ( A, b ) must be controllable. Note that this method is not numerically reliable and starts to break down rapidly for problems of order greater than 5 or for weakly controllable systems. See place for a more general and reliable alternative. See Also lqr place rlocus, rlocfind References [1] Kailath, T., Linear Systems, Prentice-Hall, 1980, p. 201. Optimal LQ regulator Pole placement design Root locus design 11-11 append Purpose 11append Group LTI models by appending their inputs and outputs Syntax sys = append(sys1,sys2,...,sysN) Description append appends the inputs and outputs of the LTI models sys1,...,sysN to form the augmented model sys depicted below. u1 sys1 y1 u2 sys2 y2 : : uN yN sysN sys For systems with transfer functions H 1 ( s ) ,..., H N ( s ) , the resulting system sys has the block-diagonal transfer function H1 ( s ) 0 : 0 0 .. 0 H2 ( s ) . : . .. . 0 0 HN ( s ) For state-space models sys1 and sys2 with data ( A 1, B 1, C 1, D 1 ) and ( A 2, B 2, C 2, D 2 ) , append(sys1,sys2) produces the following state-space model. 11-12 append · A1 0 x1 B 0 u1 x1 = + 1 · 0 A2 x2 0 B2 u2 x2 y1 y2 Arguments = C1 0 x1 0 C2 x2 + D1 0 u1 0 D2 u2 The input arguments sys1,..., sysN can be LTI models of any type. Regular matrices are also accepted as a representation of static gains, but there should be at least one LTI object in the input list. The LTI models should be either all continuous, or all discrete with the same sample time. When appending models of different types, the resulting type is determined by the precedence rules (see “Precedence Rules” on page 2-5 for details). There is no limitation on the number of inputs. Example The commands sys1 = tf(1,[1 0]) sys2 = ss(1,2,3,4) sys = append(sys1,10,sys2) produce the state-space model sys a = x1 x2 x1 0 0 x2 0 1.00000 x1 x2 u1 1.00000 0 u2 0 0 b = u3 0 2.00000 11-13 append c = y1 y2 y3 x1 1.00000 0 0 x2 0 0 3.00000 y1 y2 y3 u1 0 0 0 u2 0 10.00000 0 d = u3 0 0 4.00000 Continuous-time system. See Also 11-14 connect feedback parallel series Modeling of block diagram interconnections Feedback connection Parallel connection Series connection augstate Purpose 11augstate Append the state vector to the output vector Syntax asys = augstate(sys) Description Given a state-space model sys with equations · x = Ax + Bu y = Cx + Du (or their discrete-time counterpart), augstate appends the states x to the outputs y to form the model · x = Ax + Bu y C D x+ = u x I 0 This command prepares the plant so that you can use the feedback command to close the loop on a full-state feedback u = – K x . Limitation Because augstate is only meaningful for state-space models, it cannot be used with TF, ZPK or FRD models. See Also feedback parallel series Feedback connection Parallel connection Series connection 11-15 balreal Purpose 11balreal Input/output balancing of state-space realizations Syntax sysb = balreal(sys) [sysb,g,T,Ti] = balreal(sys) Description sysb = balreal(sys) produces a balanced realization sysb of the LTI model sys with equal and diagonal controllability and observability gramians (see gram for a definition of gramian). balreal handles both continuous and discrete systems. If sys is not a state-space model, it is first and automatically converted to state space using ss. [sysb,g,T,Ti] = balreal(sys) also returns the vector g containing the diagonal of the balanced gramian, the state similarity transformation x b = Tx –1 used to convert sys to sysb, and the inverse transformation Ti = T . If the system is normalized properly, the diagonal g of the joint gramian can be used to reduce the model order. Because g reflects the combined controllability and observability of individual states of the balanced model, you can delete those states with a small g(i) while retaining the most important input-output characteristics of the original system. Use modred to perform the state elimination. Example Consider the zero-pole-gain model sys = zpk([–10 –20.01],[–5 –9.9 –20.1],1) Zero/pole/gain: (s+10) (s+20.01) ---------------------(s+5) (s+9.9) (s+20.1) A state-space realization with balanced gramians is obtained by [sysb,g] = balreal(sys) The diagonal entries of the joint gramian are g' ans = 1.0062e–01 11-16 6.8039e–05 1.0055e–05 balreal which indicates that the last two states of sysb are weakly coupled to the input and output. You can then delete these states by sysr = modred(sysb,[2 3],'del') to obtain the following first-order approximation of the original system. zpk(sysr) Zero/pole/gain: 1.0001 -------(s+4.97) Compare the Bode responses of the original and reduced-order models. bode(sys,'-',sysr,'x') Bode Diagrams −10 −20 Phase (deg); Magnitude (dB) −30 −40 −50 0 −20 −40 −60 −80 −100 0 10 1 10 2 10 Frequency (rad/sec) 11-17 balreal Algorithm Consider the model · x = Ax + Bu y = Cx + Du with controllability and observability gramians W c and W o . The state coordinate transformation x = Tx produces the equivalent model · –1 x = TAT x + TBu –1 y = CT x + Du and transforms the gramians to T W c = TW c T , Wo = T –T WoT –1 The function balreal computes a particular similarity transformation T such that W c = W o = diag ( g ) See [1,2] for details on the algorithm. Limitations The LTI model sys must be stable. In addition, controllability and observability are required for state-space models. See Also gram minreal modred References [1] Laub, A.J., M.T. Heath, C.C. Paige, and R.C. Ward, “Computation of System Balancing Transformations and Other Applications of Simultaneous Diagonalization Algorithms,” IEEE Trans. Automatic Control, AC-32 (1987), pp. 115–122. Controllability and observability gramians Minimal realizations Model order reduction [2] Moore, B., “Principal Component Analysis in Linear Systems: Controllability, Observability, and Model Reduction,” IEEE Transactions on Automatic Control, AC-26 (1981), pp. 17–31. [3] Laub, A.J., “Computation of Balancing Transformations,” Proc. ACC, San Francisco, Vol.1, paper FA8-E, 1980. 11-18 bode Purpose Syntax 11bode Compute the Bode frequency response of LTI models bode(sys) bode(sys,w) bode(sys1,sys2,...,sysN) bode(sys1,sys2,...,sysN,w) bode(sys1,'PlotStyle1',...,sysN,'PlotStyleN') [mag,phase,w] = bode(sys) Description bode computes the magnitude and phase of the frequency response of LTI models. When invoked without left-hand arguments, bode produces a Bode plot on the screen. The magnitude is plotted in decibels (dB), and the phase in degrees. The decibel calculation for mag is computed as 20*log10(abs(frsys)), where frsys is the frequency response of sys. Bode plots are used to analyze system properties such as the gain margin, phase margin, DC gain, bandwidth, disturbance rejection, and stability. bode(sys) plots the Bode response of an arbitrary LTI model sys. This model can be continuous or discrete, and SISO or MIMO. In the MIMO case, bode produces an array of Bode plots, each plot showing the Bode response of one particular I/O channel. The frequency range is determined automatically based on the system poles and zeros. bode(sys,w) explicitly specifies the frequency range or frequency points to be used for the plot. To focus on a particular frequency interval [wmin,wmax], set w = {wmin,wmax}. To use particular frequency points, set w to the vector of desired frequencies. Use logspace to generate logarithmically spaced frequency vectors. All frequencies should be specified in radians/sec. bode(sys1,sys2,...,sysN) or bode(sys1,sys2,...,sysN,w) plots the Bode responses of several LTI models on a single figure. All systems must have the same number of inputs and outputs, but may otherwise be a mix of continuous and discrete systems. This syntax is useful to compare the Bode responses of multiple systems. bode(sys1,'PlotStyle1',...,sysN,'PlotStyleN') specifies which color, linestyle, and/or marker should be used to plot each system. For example, bode(sys1,'r--',sys2,'gx') 11-19 bode uses red dashed lines for the first system sys1 and green 'x' markers for the second system sys2. When invoked with left-hand arguments [mag,phase,w] = bode(sys) [mag,phase] = bode(sys,w) return the magnitude and phase (in degrees) of the frequency response at the frequencies w (in rad/sec). The outputs mag and phase are 3-D arrays with the frequency as the last dimension (see “Arguments” below for details). You can convert the magnitude to decibels by magdb = 20*log10(mag) Remark If sys is an FRD model, bode(sys,w), w can only include frequencies in sys.frequency. Arguments The output arguments mag and phase are 3-D arrays with dimensions ( number of outputs ) × ( number of inputs ) × ( length of w ) For SISO systems, mag(1,1,k) and phase(1,1,k) give the magnitude and phase of the response at the frequency ω k = w(k). mag(1,1,k) = h ( jω k ) phase(1,1,k) = ∠h ( jω k ) MIMO systems are treated as arrays of SISO systems and the magnitudes and phases are computed for each SISO entry h ij independently ( h ij is the transfer function from input j to output i ). The values mag(i,j,k) and phase(i,j,k) then characterize the response of h ij at the frequency w(k). mag(i,j,k) = h ij ( jω k ) phase(i,j,k) = ∠h ij ( jω k ) Example 11-20 You can plot the Bode response of the continuous SISO system bode 2 s + 0.1s + 7.5 H ( s ) = -------------------------------------------4 3 2 s + 0.12s + 9s by typing g = tf([1 0.1 7.5],[1 0.12 9 0 0]); bode(g) Bode Diagrams 40 20 Phase (deg); Magnitude (dB) 0 −20 −40 0 −50 −100 −150 −200 −1 10 0 10 1 10 Frequency (rad/sec) To plot the response on a wider frequency range, for example, from 0.1 to 100 rad/sec, type bode(g,{0.1 , 100}) 11-21 bode You can also discretize this system using zero-order hold and the sample time T s = 0.5 second, and compare the continuous and discretized responses by typing gd = c2d(g,0.5) bode(g,'r',gd,'b--') Bode Diagrams 50 Phase (deg); Magnitude (dB) 0 −50 −100 0 −50 −100 −150 −200 −250 −300 −1 10 0 10 Frequency (rad/sec) Algorithm For continuous-time systems, bode computes the frequency response by evaluating the transfer function H ( s ) on the imaginary axis s = jω . Only positive frequencies ω are considered. For state-space models, the frequency –1 response is D + C ( jω – A ) B , ω≥0 When numerically safe, A is diagonalized for maximum speed. Otherwise, A is reduced to upper Hessenberg form and the linear equation ( jω – A )X = B is solved at each frequency point, taking advantage of the Hessenberg 11-22 1 10 bode structure. The reduction to Hessenberg form provides a good compromise between efficiency and reliability. See [1] for more details on this technique. For discrete-time systems, the frequency response is obtained by evaluating the transfer function H ( z ) on the unit circle. To facilitate interpretation, the upper-half of the unit circle is parametrized as z=e jωT s , π 0 ≤ ω ≤ ω N = -----Ts where T s is the sample time. ω N is called the Nyquist frequency. The equivalent “continuous-time frequency” ω is then used as the x -axis variable. Because H(e jωT s ) is periodic with period 2ω N , bode plots the response only up to the Nyquist frequency ω N . If the sample time is unspecified, the default value T s = 1 is assumed. Diagnostics If the system has a pole on the jω axis (or unit circle in the discrete case) and w happens to contain this frequency point, the gain is infinite, jωI – A is singular, and bode produces the warning message Singularity in freq. response due to jw-axis or unit circle pole. See Also evalfr freqresp ltiview nichols nyquist sigma References [1] Laub, A.J., “Efficient Multivariable Frequency Response Computations,” IEEE Transactions on Automatic Control, AC-26 (1981), pp. 407–408. Response at single complex frequency Frequency response computation LTI system viewer Nichols plot Nyquist plot Singular value plot 11-23 c2d Purpose 11c2d Discretize continuous-time systems Syntax sysd = c2d(sys,Ts) sysd = c2d(sys,Ts,method) Description sysd = c2d(sys,Ts) discretizes the continuous-time LTI model sys using zero-order hold on the inputs and a sample time of Ts seconds. sysd = c2d(sys,Ts,method) gives access to alternative discretization schemes. The string method selects the discretization method among the following: 'zoh' Zero-order hold. The control inputs are assumed piecewise constant over the sampling period Ts. 'foh' Triangle approximation (modified first-order hold, see [1], p. 151). The control inputs are assumed piecewise linear over the sampling period Ts. 'tustin' Bilinear (Tustin) approximation. 'prewarp' Tustin approximation with frequency prewarping. 'matched' Matched pole-zero method. See [1], p. 147. Refer to “Continuous/Discrete Conversions of LTI Models” in Chapter 3 for more detail on these discretization methods. c2d supports MIMO systems (except for the 'matched' method) as well as LTI models with input delays ('zoh' and 'foh' methods only). Example Consider the system s–1 H ( s ) = --------------------------2 s + 4s + 5 11-24 c2d with input delay T d = 0.35 second. To discretize this system using the triangle approximation with sample time T s = 0.1 second, type H = tf([1 –1],[1 4 5],'inputdelay',0.35) Transfer function: s - 1 exp(-0.35*s) * ------------s^2 + 4 s + 5 Hd = c2d(H,0.1,'foh') Transfer function: 0.0115 z^3 + 0.0456 z^2 – 0.0562 z – 0.009104 --------------------------------------------z^6 – 1.629 z^5 + 0.6703 z^4 Sampling time: 0.1 11-25 c2d The next command compares the continuous and discretized step responses. step(H,'-',Hd,'--') See Also d2c d2d References [1] Franklin, G.F., J.D. Powell, and M.L. Workman, Digital Control of Dynamic Systems, Second Edition, Addison-Wesley, 1990. 11-26 Discrete to continuous conversion Resampling of discrete systems canon Purpose 11canon Compute canonical state-space realizations Syntax csys = canon(sys,'type') [csys,T] = canon(sys,'type') Description canon computes a canonical state-space model for the continuous or discrete LTI system sys. Two types of canonical forms are supported. Modal Form csys = canon(sys,'modal') returns a realization csys in modal form, that is, where the real eigenvalues appear on the diagonal of the A matrix and the complex conjugate eigenvalues appear in 2-by-2 blocks on the diagonal of A . For a system with eigenvalues ( λ 1, σ ± jω, λ 2 ) , the modal A matrix is of the form λ1 0 0 0 0 σ ω 0 0 –ω σ 0 0 0 0 λ2 Companion Form csys = canon(sys,'companion') produces a companion realization of sys where the characteristic polynomial of the system appears explicitly in the rightmost column of the A matrix. For a system with characteristic polynomial n p ( s ) = s + a1 s n–1 + ... + a n – 1 s + a n the corresponding companion A matrix is A = 0 0 .. .. 0 –an 1 0 0 .. 0 –an – 1 0 : 0 1 0 . 0 . . . . 1 : : 0 : : –a 2 0 .. .. 0 1 –a 1 11-27 canon For state-space models sys, [csys,T] = canon(a,b,c,d,'type') also returns the state coordinate transformation T relating the original state vector x and the canonical state vector x c. x c = Tx This syntax returns T=[] when sys is not a state-space model. Algorithm Transfer functions or zero-pole-gain models are first converted to state space using ss. The transformation to modal form uses the matrix P of eigenvectors of the A matrix. The modal form is then obtained as –1 –1 · x c = P APx c + P Bu y = CPx c + Du The state transformation T returned is the inverse of P . The reduction to companion form uses a state similarity transformation based on the controllability matrix [1]. Limitations The modal transformation requires that the A matrix be diagonalizable. A sufficient condition for diagonalizability is that A has no repeated eigenvalues. The companion transformation requires that the system be controllable from the first input. The companion form is often poorly conditioned for most state-space computations; avoid using it when possible. See Also ctrb ctrbf ss2ss References [1] Kailath, T. Linear Systems, Prentice-Hall, 1980. 11-28 Controllability matrix Controllability canonical form State similarity transformation care Purpose Syntax 11care Solve continuous-time algebraic Riccati equations (CARE) [X,L,G,rr] = care(A,B,Q) [X,L,G,rr] = care(A,B,Q,R,S,E) [X,L,G,report] = care(A,B,Q,...,'report') [X1,X2,L,report] = care(A,B,Q,...,'implicit') Description [X,L,G,rr] = care(A,B,Q) computes the unique solution X of the algebraic Riccati equation T T Ric ( X ) = A X + XA – XBB X + Q = 0 T such that A – BB X has all its eigenvalues in the open left-half plane. The matrix X is symmetric and called the stabilizing solution of Ric ( X ) = 0 . [X,L,G,rr] = care(A,B,Q) also returns: T • The eigenvalues L of A – BB X T • The gain matrix G = B X Ric ( X ) F • The relative residual rr defined by rr = --------------------------X F [X,L,G,rr] = care(A,B,Q,R,S,E) solves the more general Riccati equation T T T –1 T T Ric ( X ) = A XE + E XA – ( E XB + S )R ( B XE + S ) + Q = 0 –1 T T Here the gain matrix is G = R ( B XE + S ) and the “closed-loop” eigenvalues are L = eig(A–B*G,E). Two additional syntaxes are provided to help develop applications such as H ∞ -optimal control design. [X,L,G,report] = care(A,B,Q,...,'report')turns off the error messages when the solution X fails to exist and returns a failure report instead. The value of report is: • –1 when the associated Hamiltonian pencil has eigenvalues on or very near the imaginary axis (failure) –1 • –2 when there is no finite solution, i.e., X = X 2 X 1 with X 1 singular (failure) • The relative residual rr defined above when the solution exists (success) 11-29 care Alternatively, [X1,X2,L,report] = care(A,B,Q,...,'implicit') also turns off error messages but now returns X in implicit form. –1 X = X2 X 1 Note that this syntax returns report = 0 when successful. Examples Example 1 Given A = –3 2 1 1 B = 0 1 C = 1 –1 R = 3 you can solve the Riccati equation T –1 T T A X + XA – XBR B X + C C = 0 by a = [–3 2;1 1] b = [0 ; 1] c = [1 –1] r = 3 [x,l,g] = care(a,b,c'*c,r) This yields the solution x x = 0.5895 1.8216 1.8216 8.8188 You can verify that this solution is indeed stabilizing by comparing the eigenvalues of a and a–b*g. [eig(a) eig(a–b*g)] ans = –3.4495 1.4495 11-30 –3.5026 –1.4370 care Finally, note that the variable l contains the closed-loop eigenvalues eig(a– b*g). l l = –3.5026 –1.4370 Example 2 To solve the H ∞ -like Riccati equation T –2 T T T A X + XA + X ( γ B 1 B 1 – B 2 B 2 )X + C C = 0 rewrite it in the care format as B –2 –γ I 0 –1 0 I T A X + XA – X [ B 1, B 2 ] T B1 T B2 T X+C C = 0 R You can now compute the stabilizing solution X by B = [B1 , B2] m1 = size(B1,2) m2 = size(B2,2) R = [–g^2*eye(m1) zeros(m1,m2) ; zeros(m2,m1) eye(m2)] X = care(A,B,C'*C,R) Algorithm care implements the algorithms described in [1]. It works with the Hamiltonian matrix when R is well-conditioned and E = I ; otherwise it uses the extended Hamiltonian pencil and QZ algorithm. Limitations The ( A, B ) pair must be stabilizable (that is, all unstable modes are controllable). In addition, the associated Hamiltonian matrix or pencil must have no eigenvalue on the imaginary axis. Sufficient conditions for this to hold are ( Q, A ) detectable when S = 0 and R > 0 , or 11-31 care Q S T >0 S R See Also dare lyap References [1] Arnold, W.F., III and A.J. Laub, “Generalized Eigenproblem Algorithms and Software for Algebraic Riccati Equations,” Proc. IEEE, 72 (1984), pp. 1746–1754. 11-32 Solve discrete-time Riccati equations Solve continuous-time Lyapunov equations chgunits Purpose 11chgunits Convert the frequency units of an FRD model Syntax sys = chgunits(sys,units) Description sys = chgunits(sys,units) converts the units of the frequency points stored in an FRD model, sys to units, where units is either of the strings 'Hz' or 'rad/s'. This operation changes the assigned frequencies by applying the appropriate (2*pi) scaling factor, and the 'Units' property is updated. If the 'Units' field already matches units, no conversion is made. Example w = logspace(1,2,2); sys = rss(3,1,1); sys = frd(sys,w) From input 'input 1' to: Frequency(rad/s) ---------------- output 1 -------- 10 0.293773+0.001033i 100 0.294404+0.000109i Continuous-time frequency response data. sys = chgunits(sys,'Hz') sys.freq ans = 1.5915 15.9155 See Also frd get set Create or convert to an FRD model Get the properties of an LTI model Set the properties of an LTI model 11-33 connect Purpose 11connect Derive state-space model from block diagram description Syntax sysc = connect(sys,Q,inputs,outputs) Description Complex dynamical systems are often given in block diagram form. For systems of even moderate complexity, it can be quite difficult to find the state-space model required in order to bring certain analysis and design tools into use. Starting with a block diagram description, you can use append and connect to construct a state-space model of the system. First, use sys = append(sys1,sys2,...,sysN) to specify each block sysj in the diagram and form a block-diagonal, unconnected LTI model sys of the diagram. Next, use sysc = connect(sys,Q,inputs,outputs) to connect the blocks together and derive a state-space model sysc for the overall interconnection. The arguments Q, inputs, and outputs have the following purpose: • The matrix Q indicates how the blocks on the diagram are connected. It has a row for each input of sys, where the first element of each row is the input number. The subsequent elements of each row specify where the block input gets its summing inputs; negative elements indicate minus inputs to the summing junction. For example, if input 7 gets its inputs from the outputs 2, 15, and 6, where the input from output 15 is negative, the corresponding row of Q is [7 2 –15 6]. Short rows can be padded with trailing zeros (see example below). • Given sys and Q, connect computes a state-space model of the interconnection with the same inputs and outputs as sys (that is, the concatenation of all block inputs and outputs). The index vectors inputs and outputs then indicate which of the inputs and outputs in the large unconnected system are external inputs and outputs of the block diagram. For example, if the external inputs are inputs 1, 2, and 15 of sys, and the 11-34 connect external outputs are outputs 2 and 7 of sys, then inputs and outputs should be set to inputs = [1 2 15]; outputs = [2 7]; The final model sysc has these particular inputs and outputs. Since it is easy to make a mistake entering all the data required for a large model, be sure to verify your model in as many ways as you can. Here are some suggestions: • Make sure the poles of the unconnected model sys match the poles of the various blocks in the diagram. • Check that the final poles and DC gains are reasonable. • Plot the step and bode responses of sysc and compare them with your expectations. If you need to work extensively with block diagrams, Simulink is a much easier and more comprehensive tool for model building. Example Consider the following block diagram sys2 u1 sys1 uc 10 -----------s+5 + – · x = Ax + Bu y1 y = Cx + Du y2 u2 sys3 2(s + 1 ) -------------------s+2 11-35 connect Given the matrices of the state-space model sys2 A = [ –9.0201 17.7791 –1.6943 3.2138 ]; B = [ –.5112 .5362 –.002 –1.8470]; C = [ –3.2897 2.4544 –13.5009 18.0745]; D = [–.5476 –.1410 –.6459 .2958 ]; Define the three blocks as individual LTI models. sys1 = tf(10,[1 5],'inputname','uc') sys2 = ss(A,B,C,D,'inputname',{'u1' 'u2'},... 'outputname',{'y1' 'y2'}) sys3 = zpk(–1,–2,2) Next append these blocks to form the unconnected model sys. sys = append(sys1,sys2,sys3) This produces the block-diagonal model sys a = x1 x2 x3 x4 x1 -5 0 0 0 x2 0 -9.0201 -1.6943 0 x3 0 17.779 3.2138 0 x4 0 0 0 -2 x1 x2 x3 x4 uc 4 0 0 0 u1 0 -0.5112 -0.002 0 u2 0 0.5362 -1.847 0 ? 0 0 0 1.4142 b = 11-36 connect c = ? y1 y2 ? x1 2.5 0 0 0 x2 0 -3.2897 -13.501 0 x3 0 2.4544 18.075 0 x4 0 0 0 -1.4142 ? y1 y2 ? uc 0 0 0 0 u1 0 -0.5476 -0.6459 0 u2 0 -0.141 0.2958 0 ? 0 0 0 2 d = Continuous-time system. Note that the ordering of the inputs and outputs is the same as the block ordering you chose. Unnamed inputs or outputs are denoted by ?. To derive the overall block diagram model from sys, specify the interconnections and the external inputs and outputs. You need to connect outputs 1 and 4 into input 3 (u2), and output 3 (y2) into input 4. The interconnection matrix Q is therefore Q = [3 1 –4 4 3 0]; Note that the second row of Q has been padded with a trailing zero. The block diagram has two external inputs uc and u1 (inputs 1 and 2 of sys), and two external outputs y1 and y2 (outputs 2 and 3 of sys). Accordingly, set inputs and outputs as follows. inputs = [1 2]; outputs = [2 3]; 11-37 connect You can obtain a state-space model for the overall interconnection by typing sysc = connect(sys,Q,inputs,outputs) a = x1 x2 x3 x4 x1 -5 0.84223 -2.9012 0.65708 x1 x2 x3 x4 uc 4 0 0 0 y1 y2 x1 -0.22148 0.46463 y1 y2 uc 0 0 x2 0 0.076636 -33.029 -11.996 x3 0 5.6007 45.164 16.06 x4 0 0.47644 -1.6411 -1.6283 x3 5.6568 11.356 x4 -0.12529 0.26283 b = u1 0 -0.076001 -1.5011 -0.57391 c = x2 -5.6818 -8.4826 d = u1 -0.66204 -0.40582 Continuous-time system. Note that the inputs and outputs are as desired. See Also 11-38 append feedback minreal parallel series Append LTI systems Feedback connection Minimal state-space realization Parallel connection Series connection connect References [1] Edwards, J.W., “A Fortran Program for the Analysis of Linear Continuous and Sampled-Data Systems,” NASA Report TM X56038, Dryden Research Center, 1976. 11-39 covar Purpose 11covar Output and state covariance of a system driven by white noise Syntax [P,Q] = covar(sys,W) Description covar calculates the stationary covariance of the output y of an LTI model sys driven by Gaussian white noise inputs w . This function handles both continuous- and discrete-time cases. P = covar(sys,W) returns the steady-state output response covariance T P = E ( yy ) given the noise intensity T E ( w ( t )w ( τ ) ) = W δ ( t – τ ) T E ( w [ k ]w [ l ] ) = W δ kl (continuous time) (discrete time) [P,Q] = covar(sys,W) also returns the steady-state state covariance T Q = E ( xx ) when sys is a state-space model (otherwise Q is set to []). When applied to an N-dimensional LTI array sys, covar returns multi-dimensional arrays P, Q such that P(:,:,i1,...iN) and Q(:,:,i1,...iN) are the covariance matrices for the model sys(:,:,i1,...iN). Example Compute the output response covariance of the discrete SISO system 2z + 1 -, H ( z ) = ------------------------------------2 z + 0.2z + 0.5 T s = 0.1 due to Gaussian white noise of intensity W = 5. Type sys = tf([2 1],[1 0.2 0.5],0.1); p = covar(sys,5) 11-40 covar and MATLAB returns p = 30.3167 You can compare this output of covar to simulation results. randn('seed',0) w = sqrt(5)∗randn(1,1000); % 1000 samples % Simulate response to w with LSIM: y = lsim(sys,w); % Compute covariance of y values psim = sum(y .∗ y)/length(w); This yields psim = 32.6269 The two covariance values p and psim do not agree perfectly due to the finite simulation horizon. Algorithm Transfer functions and zero-pole-gain models are first converted to state space with ss. For continuous-time state-space models · x = Ax + Bw y = Cx + Dw Q is obtained by solving the Lyapunov equation T AQ + QA + BWB T = 0 The output response covariance P is finite only when D = 0 and then T P = CQC . In discrete time, the state covariance solves the discrete Lyapunov equation T AQA – Q + BWB T = 0 11-41 covar T and P is given by P = CQC + DWD T Note that P is well defined for nonzero D in the discrete case. Limitations The state and output covariances are defined for stable systems only. For continuous systems, the output response covariance P is finite only when the D matrix is zero (strictly proper system). See Also dlyap lyap References [1] Bryson, A.E. and Y.C. Ho, Applied Optimal Control, Hemisphere Publishing, 1975, pp. 458-459. 11-42 Solver for discrete-time Lyapunov equations Solver for continuous-time Lyapunov equations ctrb Purpose 11ctrb Form the controllability matrix Syntax Co = ctrb(A,B) Co = ctrb(sys) Description ctrb computes the controllability matrix for state-space systems. For an n-by-n matrix A and an n-by-m matrix B, ctrb(A,B) returns the controllability matrix 2 Co = B AB A B … A n–1 B (11-1) where Co has n rows and nm columns. Co = ctrb(sys) calculates the controllability matrix of the state-space LTI object sys. This syntax is equivalent to executing Co = ctrb(sys.A,sys.B) The system is controllable if Co has full rank n. Example Check if the system with the following data A = 1 4 1 –2 1 1 –1 –1 B = is controllable. Type Co=ctrb(A,B); % Number of uncontrollable states unco=length(A)–rank(Co) and MATLAB returns unco = 1 11-43 ctrb Limitations The calculation of Co may be ill-conditioned with respect to inversion. An indication of this can be seen from this simple example. A = 1 δ , 01 B = 1 δ This pair is controllable if δ ≠ 0 but if δ < eps , where eps is the relative machine precision. ctrb(A,B) returns B AB = 11 δ δ which is not full rank. For cases like these, it is better to determine the controllability of a system using ctrbf. See Also 11-44 ctrbf obsv Compute the controllability staircase form Compute the observability matrix ctrbf Purpose Syntax Description 11ctrbf Compute the controllability staircase form [Abar,Bbar,Cbar,T,k] = ctrbf(A,B,C) [Abar,Bbar,Cbar,T,k] = ctrbf(A,B,C,tol) If the controllability matrix of ( A, B ) has rank r ≤ n , where n is the size of A , then there exists a similarity transformation such that T A = TAT , B = TB, C = CT T where T is unitary, and the transformed system has a staircase form, in which the uncontrollable modes, if there are any, are in the upper left corner. A = A uc 0 A 21 A c , B = 0 , Bc C = C nc C c where ( A c, B c ) is controllable, all eigenvalues of A uc are uncontrollable, and –1 –1 C c ( sI – A c ) B c = C ( sI – A ) B. [Abar,Bbar,Cbar,T,k] = ctrbf(A,B,C) decomposes the state-space system represented by A, B, and C into the controllability staircase form, Abar, Bbar, and Cbar, described above. T is the similarity transformation matrix and k is a vector of length n, where n is the order of the system represented by A. Each entry of k represents the number of controllable states factored out during each step of the transformation matrix calculation. The number of nonzero elements in k indicates how many iterations were necessary to calculate T, and sum(k) is the number of states in A c , the controllable portion of Abar. ctrbf(A,B,C,tol) uses the tolerance tol when calculating the controllable/ uncontrollable subspaces. When the tolerance is not specified, it defaults to 10*n*norm(A,1)*eps. 11-45 ctrbf Example Compute the controllability staircase form for A = 1 4 1 –2 1 1 –1 –1 1 0 0 1 B = C = and locate the uncontrollable mode. [Abar,Bbar,Cbar,T,k]=ctrbf(A,B,C) Abar = –3.0000 –3.0000 0 2.0000 Bbar = 0.0000 1.4142 0.0000 –1.4142 Cbar = –0.7071 0.7071 0.7071 0.7071 T = –0.7071 0.7071 k = 1 0 0.7071 0.7071 The decomposed system Abar shows an uncontrollable mode located at –3 and a controllable mode located at 2. See also the function minreal, which uses ctrbf to find the minimal realization of a system. 11-46 ctrbf Algorithm ctrbf is an M-file that implements the Staircase Algorithm of [1]. See Also ctrb minreal References [1] Rosenbrock, M.M., State-Space and Multivariable Theory, John Wiley, 1970. Form the controllability matrix Minimum realization and pole-zero cancellation 11-47 d2c Purpose 11d2c Convert discrete-time LTI models to continuous time Syntax sysc = d2c(sysd) sysc = d2c(sysd,method) Description d2c converts LTI models from discrete to continuous time using one of the following conversion methods: 'zoh' Zero-order hold on the inputs. The control inputs are assumed piecewise constant over the sampling period. 'tustin' Bilinear (Tustin) approximation to the derivative. 'prewarp' Tustin approximation with frequency prewarping. 'matched' Matched pole-zero method of [1] (for SISO systems only). The string method specifies the conversion method. If method is omitted then zero-order hold ('zoh') is assumed. See “Continuous/Discrete Conversions of LTI Models” in Chapter 3 of this manual and reference [1] for more details on the conversion methods. Example Consider the discrete-time model with transfer function z–1 H ( z ) = ---------------------------2 z + z + 0.3 and sample time T s = 0.1 second. You can derive a continuous-time zero-order-hold equivalent model by typing Hc = d2c(H) Discretizing the resulting model Hc with the zero-order hold method (this is the default method) and sampling period T s = 0.1 gives back the original discrete model H ( z ) . To see this, type c2d(Hc,0.1) To use the Tustin approximation instead of zero-order hold, type Hc = d2c(H,'tustin') 11-48 d2c As with zero-order hold, the inverse discretization operation c2d(Hc,0.1,'tustin') gives back the original H ( z ) . Algorithm The 'zoh' conversion is performed in state space and relies on the matrix logarithm (see logm in Using MATLAB). Limitations The Tustin approximation is not defined for systems with poles at z = – 1 and is ill-conditioned for systems with poles near z = –1 . The zero-order hold method cannot handle systems with poles at z = 0 . In addition, the 'zoh' conversion increases the model order for systems with negative real poles, [2]. This is necessary because the matrix logarithm maps real negative poles to complex poles. As a result, a discrete model with a single pole at z = –0.5 would be transformed to a continuous model with a single complex pole at log ( – 0.5 ) ≈ – 0.6931 + jπ . Such a model is not meaningful because of its complex time response. To ensure that all complex poles of the continuous model come in conjugate pairs, d2c replaces negative real poles z = – α with a pair of complex conjugate poles near – α . The conversion then yields a continuous model with higher order. For example, the discrete model with transfer function z + 0.2 H ( z ) = -------------------------------------------------------2 ( z + 0.5 ) ( z + z + 0.4 ) and sample time 0.1 second is converted by typing Ts = 0.1 H = zpk(–0.2,–0.5,1,Ts) * tf(1,[1 1 0.4],Ts) Hc = d2c(H) MATLAB responds with Warning: System order was increased to handle real negative poles. Zero/pole/gain: –33.6556 (s–6.273) (s^2 + 28.29s + 1041) -------------------------------------------(s^2 + 9.163s + 637.3) (s^2 + 13.86s + 1035) 11-49 d2c Convert Hc back to discrete time by typing c2d(Hc,Ts) yielding Zero/pole/gain: (z+0.5) (z+0.2) ------------------------(z+0.5)^2 (z^2 + z + 0.4) Sampling time: 0.1 This discrete model coincides with H ( z ) after canceling the pole/zero pair at z = – 0.5 . See Also c2d d2d logm References [1] Franklin, G.F., J.D. Powell, and M.L. Workman, Digital Control of Dynamic Systems, Second Edition, Addison-Wesley, 1990. Continuous- to discrete-time conversion Resampling of discrete models Matrix logarithm [2] Kollár, I., G.F. Franklin, and R. Pintelon, “On the Equivalence of z-domain and s-domain Models in System Identification,” Proceedings of the IEEE Instrumentation and Measurement Technology Conference, Brussels, Belgium, June, 1996, Vol. 1, pp. 14-19. 11-50 d2d Purpose 11d2d Resample discrete-time LTI models or add input delays Syntax sys1 = d2d(sys,Ts) Description sys1 = d2d(sys,Ts) resamples the discrete-time LTI model sys to produce an equivalent discrete-time model sys1 with the new sample time Ts (in seconds). The resampling assumes zero-order hold on the inputs and is equivalent to consecutive d2c and c2d conversions. sys1 = c2d(d2c(sys),Ts) Example Consider the zero-pole-gain model z – 0.7 H ( z ) = ----------------z – 0.5 with sample time 0.1 second. You can resample this model at 0.05 second by typing H = zpk(0.7,0.5,1,0.1) H2 = d2d(H,0.05) Zero/pole/gain: (z–0.8243) ---------(z–0.7071) Sampling time: 0.05 Note that the inverse resampling operation, performed by typing d2d(H2,0.1), yields back the initial model H ( z ). Zero/pole/gain: (z–0.7) ------(z–0.5) Sampling time: 0.1 See Also c2d d2c Continuous- to discrete-time conversion Discrete- to continuous-time conversion 11-51 damp Purpose 11damp Compute damping factors and natural frequencies Syntax [Wn,Z] = damp(sys) [Wn,Z,P] = damp(sys) Description damp calculates the damping factor and natural frequencies of the poles of an LTI model sys. When invoked without lefthand arguments, a table of the eigenvalues in increasing frequency, along with their damping factors and natural frequencies, is displayed on the screen. [Wn,Z] = damp(sys) returns column vectors Wn and Z containing the natural frequencies ω n and damping factors ζ of the poles of sys. For discrete-time systems with poles z and sample time T s , damp computes “equivalent” continuous-time poles s by solving z = e sT s The values Wn and Z are then relative to the continuous-time poles s . Both Wn and Z are empty if the sample time is unspecified. [Wn,Z,P] = damp(sys) returns an additional vector P containing the (true) poles of sys. Note that P returns the same values as pole(sys) (up to reordering). Example Compute and display the eigenvalues, natural frequencies, and damping factors of the continuous transfer function 2 2s + 5s + 1 H ( s ) = -----------------------------2 s + 2s + 3 Type H = tf([2 5 1],[1 2 3]) Transfer function: 2 s^2 + 5 s + 1 --------------s^2 + 2 s + 3 11-52 damp Type damp(H) and MATLAB returns Eigenvalue Damping –1.00e+000 + 1.41e+000i –1.00e+000 – 1.41e+000i See Also eig esort,dsort pole pzmap zero Freq. (rad/s) 5.77e–001 5.77e–001 1.73e+000 1.73e+000 Calculate eigenvalues and eigenvectors Sort system poles Compute system poles Pole-zero map Compute (transmission) zeros 11-53 dare Purpose Syntax 11dare Solve discrete-time algebraic Riccati equations (DARE) [X,L,G,rr] = dare(A,B,Q,R) [X,L,G,rr] = dare(A,B,Q,R,S,E) [X,L,G,report] = dare(A,B,Q,...,'report') [X1,X2,L,report] = dare(A,B,Q,...,'implicit') Description [X,L,G,rr] = dare(A,B,Q,R) computes the unique solution X of the discrete-time algebraic Riccati equation T T T –1 T Ric ( X ) = A XA – X – A XB ( B XB + R ) B XA + Q = 0 such that the “closed-loop” matrix –1 T T A cl = A – B ( B XB + R ) B XA has all its eigenvalues inside the unit disk. The matrix X is symmetric and called the stabilizing solution of Ric ( X ) = 0 . [X,L,G,rr] = dare(A,B,Q,R) also returns: • The eigenvalues L of A cl • The gain matrix –1 T T G = ( B XB + R ) B XA • The relative residual rr defined by Ric ( X ) F rr = --------------------------X F [X,L,G,rr] = dare(A,B,Q,R,S,E) solves the more general DARE: T T T T –1 T T A XA – E XE – ( A XB + S ) ( B XB + R ) ( B XA + S ) + Q = 0 The corresponding gain matrix and closed-loop eigenvalues are T –1 T T G = ( B XB + R ) ( B XA + S ) 11-54 dare and L = eig(A–B*G,E). Two additional syntaxes are provided to help develop applications such as H ∞ -optimal control design. [X,L,G,report] = dare(A,B,Q,...,'report') turns off the error messages when the solution X fails to exist and returns a failure report instead. The value of report is: • –1 when the associated symplectic pencil has eigenvalues on or very near the unit circle (failure) –1 • –2 when there is no finite solution, that is, X = X 2 X 1 with X 1 singular (failure) • The relative residual rr defined above when the solution exists (success) Alternatively, [X1,X2,L,report] = dare(A,B,Q,...,'implicit') also turns off error messages but now returns X in implicit form as –1 X = X2 X1 Note that this syntax returns report = 0 when successful. Algorithm dare implements the algorithms described in [1]. It uses the QZ algorithm to deflate the extended symplectic pencil and compute its stable invariant subspace. Limitations The ( A, B ) pair must be stabilizable (that is, all eigenvalues of A outside the unit disk must be controllable). In addition, the associated symplectic pencil must have no eigenvalue on the unit circle. Sufficient conditions for this to hold are ( Q, A ) detectable when S = 0 and R > 0 , or Q S T >0 S R See Also care dlyap Solve continuous-time Riccati equations Solve discrete-time Lyapunov equations 11-55 dare References 11-56 [1] Arnold, W.F., III and A.J. Laub, “Generalized Eigenproblem Algorithms and Software for Algebraic Riccati Equations,” Proc. IEEE, 72 (1984), pp. 1746–1754. dcgain Purpose 11dcgain Compute low frequency (DC) gain of LTI system Syntax k = dcgain(sys) Description k = dcgain(sys) computes the DC gain k of the LTI model sys. Continuous Time The continuous-time DC gain is the transfer function value at the frequency s = 0 . For state-space models with matrices ( A, B, C, D ) , this value is –1 K = D – CA B Discrete Time The discrete-time DC gain is the transfer function value at z = 1 . For state-space models with matrices ( A, B, C, D ) , this value is –1 K = D + C(I – A) B Remark The DC gain is infinite for systems with integrators. Example To compute the DC gain of the MIMO transfer function s–1 ----------------------2 s +s+3 H(s) = 1 s+2 ------------ -----------s+1 s–3 1 type H = [1 tf([1 –1],[1 1 3]) ; tf(1,[1 1]) tf([1 2],[1 –3])] dcgain(H) ans = 1.0000 1.0000 See Also evalfr norm –0.3333 –0.6667 Evaluates frequency response at single frequency LTI system norms 11-57 delay2z Purpose Replace delays of discrete-time TF, SS, or ZPK models by poles at z=0, or replace delays of FRD models by a phase shift Syntax sys = delay2z(sys) Description sys = delay2z(sys) maps all time delays to poles at z=0 for discrete-time TF, ZPK, or SS models sys. Specifically, a delay of k sampling periods is replaced by (1/z)^k in the transfer function corresponding to the model. 11delay2z For FRD models, delay2z absorbs all time delays into the frequency response data, and is applicable to both continuous- and discrete-time FRDs. Example z=tf('z',–1); sys=(–.4*z –.1)/(z^2 + 1.05*z + .08) Transfer function: –0.4 z – 0.1 ------------------z^2 + 1.05 z + 0.08 Sampling time: unspecified sys.Inputd = 1; sys = delay2z(sys) Transfer function: -0.4 z - 0.1 ----------------------z^3 + 1.05 z^2 + 0.08 z Sampling time: unspecified See Also 11-58 hasdelay pade totaldelay True for LTI models with delays Pade approximation of time delays Combine delays for an LTI model dlqr Purpose Syntax Description 11dlqr Design linear-quadratic (LQ) state-feedback regulator for discrete-time plant [K,S,e] = dlqr(a,b,Q,R) [K,S,e] = dlqr(a,b,Q,R,N) [K,S,e] = dlqr(a,b,Q,R,N) calculates the optimal gain matrix K such that the state-feedback law u [ n ] = – Kx [ n ] minimizes the quadratic cost function ∞ ∑ J( u ) = T T T ( x [ n ] Qx [ n ] + u [ n ] Ru [ n ] + 2x [ n ] Nu [ n ] ) n=1 for the discrete-time state-space mode l x [ n + 1 ] = Ax [ n ] + Bu [ n ] The default value N=0 is assumed when N is omitted. In addition to the state-feedback gain K, dlqr returns the solution S of the associated discrete-time Riccati equation T T –1 T T T A SA – S – ( A SB + N ) ( B XB + R ) ( B SA + N ) + Q = 0 and the closed-loop eigenvalues e = eig(a-b*K). Note that K is derived from S by –1 T T T K = ( B XB + R ) ( B SA + N ) Limitations The problem data must satisfy: • The pair ( A, B ) is stabilizable. –1 T • R > 0 and Q – NR N ≥ 0 . –1 T –1 T • ( Q – NR N , A – BR N ) has no unobservable mode on the unit circle. See Also dare lqgreg Solve discrete Riccati equations LQG regulator 11-59 dlqr lqr lqrd lqry 11-60 State-feedback LQ regulator for continuous plant Discrete LQ regulator for continuous plant State-feedback LQ regulator with output weighting dlyap Purpose 11dlyap Solve discrete-time Lyapunov equations Syntax X = dlyap(A,Q) Description dlyap solves the discrete-time Lyapunov equation T A XA – X + Q = 0 where A and Q are n -by- n matrices. The solution X is symmetric when Q is symmetric, and positive definite when Q is positive definite and A has all its eigenvalues inside the unit disk. Diagnostics The discrete-time Lyapunov equation has a (unique) solution if the eigenvalues α 1, α 2, ..., α n of A satisfy α i α j ≠ 1 for all ( i, j ). If this condition is violated, dlyap produces the error message Solution does not exist or is not unique. See Also covar lyap Covariance of system response to white noise Solve continuous Lyapunov equations 11-61 drmodel, drss Purpose Syntax 11drmodel, drss Generate stable random discrete test models sys sys sys sys = = = = drss(n) drss(n,p) drss(n,p,m) drss(n,p,m,s1,...sn) [num,den] = drmodel(n) [A,B,C,D] = drmodel(n) [A,B,C,D] = drmodel(n,p,m) Description sys = drss(n) produces a random n-th order stable model with one input and one output, and returns the model in the state-space object sys. drss(n,p) produces a random n-th order stable model with one input and p outputs. drss(n,m,p) generates a random n-th order stable model with m inputs and p outputs. drss(n,p,m,s1,...sn) generates a s1–by–sn array of random n-th order stable model with m inputs and p outputs. In all cases, the discrete-time state-space model or array returned by drss has an unspecified sampling time. To generate transfer function or zero-pole-gain systems, convert sys using tf or zpk. drmodel(n) produces a random n-th order stable model and returns either the transfer function numerator num and denominator den or the state-space matrices A, B, C, and D, based on the number of output arguments. The resulting model always has one input and one output. [A,B,C,D] = drmodel(n,m,p) produces a random n-th order stable state-space model with m inputs and p outputs. 11-62 drmodel, drss Example Generate a random discrete LTI system with three states, two inputs, and two outputs. sys = drss(3,2,2) a = x1 x2 x3 x1 0.38630 –0.23390 –0.03412 x2 –0.21458 –0.15220 0.11394 x1 x2 x3 u1 0.98833 0 0.42350 u2 0.51551 0.33395 0.43291 y1 y2 x1 0.22595 0 x2 0.76037 0 y1 y2 u1 0 0.78333 u2 0.68085 0.46110 x3 –0.09914 –0.06572 –0.22618 b = c = x3 0 0 d = Sampling time: unspecified Discrete-time system. See Also rmodel, rss tf zpk Generate stable random continuous test models Convert LTI systems to transfer functions form Convert LTI systems to zero-pole-gain form 11-63 dsort Purpose 11dsort Sort discrete-time poles by magnitude Syntax s = dsort(p) [s,ndx] = dsort(p) Description dsort sorts the discrete-time poles contained in the vector p in descending order by magnitude. Unstable poles appear first. When called with one lefthand argument, dsort returns the sorted poles in s. [s,ndx] = dsort(p) also returns the vector ndx containing the indices used in the sort. Example Sort the following discrete poles. p = –0.2410 + 0.5573i –0.2410 – 0.5573i 0.1503 –0.0972 –0.2590 s = dsort(p) s = –0.2410 + 0.5573i –0.2410 – 0.5573i –0.2590 0.1503 –0.0972 Limitations The poles in the vector p must appear in complex conjugate pairs. See Also eig esort, sort pole pzmap zero 11-64 Calculate eigenvalues and eigenvectors Sort system poles Compute system poles Pole-zero map Compute (transmission) zeros dss Purpose Syntax 11dss Specify descriptor state-space models sys = dss(a,b,c,d,e) sys = dss(a,b,c,d,e,Ts) sys = dss(a,b,c,d,e,ltisys) sys = dss(a,b,c,d,e,'Property1',Value1,...,'PropertyN',ValueN) sys = dss(a,b,c,d,e,Ts,'Property1',Value1,...,'PropertyN',ValueN) Description sys = dss(a,b,c,d,e) creates the continuous-time descriptor state-space model · Ex = Ax + Bu y = Cx + Du The E matrix must be nonsingular. The output sys is an SS model storing the model data (see “LTI Objects” on page 2-3). Note that ss produces the same type of object. If the matrix D = 0 , do can simply set d to the scalar 0 (zero). sys = dss(a,b,c,d,e,Ts) creates the discrete-time descriptor model Ex [ n + 1 ] = Ax [ n ] + Bu [ n ] y [ n ] = Cx [ n ] + Du [ n ] with sample time Ts (in seconds). sys = dss(a,b,c,d,e,ltisys) creates a descriptor model with generic LTI properties inherited from the LTI model ltisys (including the sample time). See “LTI Properties” on page 2-26 for an overview of generic LTI properties. Any of the previous syntaxes can be followed by property name/property value pairs 'Property',Value Each pair specifies a particular LTI property of the model, for example, the input names or some notes on the model history. See set and the example below for details. 11-65 dss Example The command sys = dss(1,2,3,4,5,'td',0.1,'inputname','voltage',... 'notes','Just an example') creates the model · 5x = x + 2u y = 3x + 4u with a 0.1 second input delay. The input is labeled 'voltage', and a note is attached to tell you that this is just an example. See Also 11-66 dssdata get set ss Retrieve A, B, C, D, E matrices of descriptor model Get properties of LTI models Set properties of LTI models Specify (regular) state-space models dssdata Purpose 11dssdata Quick access to descriptor state-space data Syntax [a,b,c,d,e] = dssdata(sys) [a,b,c,d,e,Ts] = dssdata(sys) Description [a,b,c,d,e] = dssdata(sys) extracts the descriptor matrix data ( A, B, C, D, E ) from the state-space model sys. If sys is a transfer function or zero-pole-gain model, it is first converted to state space. Note that dssdata is then equivalent to ssdata because it always returns E = I . [a,b,c,d,e,Ts] = dssdata(sys) also returns the sample time Ts in addition to a, b, c, d, and e. You can access the remaining LTI properties of sys with get or by direct referencing, for example, sys.notes See Also dss get ssdata tfdata zpkdata Specify descriptor state-space models Get properties of LTI models Quick access to state-space data Quick access to transfer function data Quick access to zero-pole-gain data 11-67 esort Purpose 11esort Sort continuous-time poles by real part Syntax s = esort(p) [s,ndx] = esort(p) Description esort sorts the continuous-time poles contained in the vector p by real part. Unstable eigenvalues appear first and the remaining poles are ordered by decreasing real parts. When called with one left-hand argument, s = esort(p) returns the sorted eigenvalues in s. [s,ndx] = esort(p) returns the additional argument ndx, a vector containing the indices used in the sort. Example Sort the following continuous eigenvalues. p p = –0.2410+ 0.5573i –0.2410– 0.5573i 0.1503 –0.0972 –0.2590 esort(p) ans = 0.1503 –0.0972 –0.2410+ 0.5573i –0.2410– 0.5573i –0.2590 Limitations 11-68 The eigenvalues in the vector p must appear in complex conjugate pairs. esort See Also dsort, sort eig pole pzmap zero Sort system poles Calculate eigenvalues and eigenvectors Compute system poles Pole-zero map Compute (transmission) zeros 11-69 estim Purpose 11estim Form state estimator given estimator gain Syntax est = estim(sys,L) est = estim(sys,L,sensors,known) Description est = estim(sys,L) produces a state/output estimator est given the plant state-space model sys and the estimator gain L. All inputs w of sys are assumed stochastic (process and/or measurement noise), and all outputs y are measured. The estimator est is returned in state-space form (SS object). For a continuous-time plant sys with equations · x = Ax + Bw y = Cx + Dw estim generates plant output and state estimates yˆ and xˆ as given by the following model. · xˆ = Axˆ + L ( y – Cxˆ ) yˆ xˆ = C ˆ x I The discrete-time estimator has similar equations. est = estim(sys,L,sensors,known) handles more general plants sys with both known inputs u and stochastic inputs w , and both measured outputs y and nonmeasured outputs z. · x = Ax + B 1 w + B 2 u C1 D 11 D 12 z = x+ w+ u y C2 D 21 D 22 The index vectors sensors and known specify which outputs y are measured and which inputs u are known. The resulting estimator est uses both u and y to produce the output and state estimates. 11-70 estim · xˆ = Axˆ + B 2 u + L ( y – C 2 xˆ – D 22 u ) yˆ = xˆ C2 I xˆ + D 22 u 0 u (known) yˆ est y (sensors) xˆ estim handles both continuous- and discrete-time cases. You can use the functions place (pole placement) or kalman (Kalman filtering) to design an adequate estimator gain L . Note that the estimator poles (eigenvalues of A – LC ) should be faster than the plant dynamics (eigenvalues of A ) to ensure accurate estimation. Example Consider a state-space model sys with seven outputs and four inputs. Suppose you designed a Kalman gain matrix L using outputs 4, 7, and 1 of the plant as sensor measurements, and inputs 1,4, and 3 of the plant as known (deterministic) inputs. You can then form the Kalman estimator by sensors = [4,7,1]; known = [1,4,3]; est = estim(sys,L,sensors,known) See the function kalman for direct Kalman estimator design. See Also kalman place reg Design Kalman estimator Pole placement Form regulator given state-feedback and estimator gains 11-71 evalfr Purpose 11evalfr Evaluate frequency response at a single (complex) frequency Syntax frsp = evalfr(sys,f) Description frsp = evalfr(sys,f) evaluates the transfer function of the TF, SS, or ZPK model sys at the complex number f. For state-space models with data ( A, B, C, D ) , the result is –1 H ( f ) = D + C ( fI – A ) B evalfr is a simplified version of freqresp meant for quick evaluation of the response at a single point. Use freqresp to compute the frequency response over a set of frequencies. Example To evaluate the discrete-time transfer function z–1 H ( z ) = ----------------------2 z +z+1 at z = 1 + j , type H = tf([1 –1],[1 1 1],–1) z = 1+j evalfr(H,z) ans = 2.3077e–01 + 1.5385e–01i Limitations The response is not finite when f is a pole of sys. See Also bode freqresp sigma 11-72 Bode frequency response Frequency response over a set of frequencies Singular value response feedback Purpose Syntax Description 11feedback Feedback connection of two LTI models sys = feedback(sys1,sys2) sys = feedback(sys1,sys2,sign) sys = feedback(sys1,sys2,feedin,feedout,sign) sys = feedback(sys1,sys2) returns an LTI model sys for the negative feedback interconnection. + u sys1 y – sys2 The closed-loop model sys has u as input vector and y as output vector. The LTI models sys1 and sys2 must be both continuous or both discrete with identical sample times. Precedence rules are used to determine the resulting model type (see “Precedence Rules” on page 2-5). To apply positive feedback, use the syntax sys = feedback(sys1,sys2,+1) By default, feedback(sys1,sys2) assumes negative feedback and is equivalent to feedback(sys1,sys2,–1). Finally, sys = feedback(sys1,sys2,feedin,feedout) 11-73 feedback computes a closed-loop model sys for the more general feedback loop. v z + sys1 u y – sys2 sys The vector feedin contains indices into the input vector of sys1 and specifies which inputs u are involved in the feedback loop. Similarly, feedout specifies which outputs y of sys1 are used for feedback. The resulting LTI model sys has the same inputs and outputs as sys1 (with their order preserved). As before, negative feedback is applied by default and you must use sys = feedback(sys1,sys2,feedin,feedout,+1) to apply positive feedback. For more complicated feedback structures, use append and connect. Remark You can specify static gains as regular matrices, for example, sys = feedback(sys1,2) However, at least one of the two arguments sys1 and sys2 should be an LTI object. For feedback loops involving two static gains k1 and k2, use the syntax sys = feedback(tf(k1),k2) 11-74 feedback Examples Example 1 + torque G velocity – H To connect the plant 2 2s + 5s + 1 G ( s ) = -----------------------------2 s + 2s + 3 with the controller 5(s + 2) H ( s ) = -------------------s + 10 using negative feedback, type G = tf([2 5 1],[1 2 3],'inputname','torque',... 'outputname','velocity'); H = zpk(–2,–10,5) Cloop = feedback(G,H) and MATLAB returns Zero/pole/gain from input "torque" to output "velocity": 0.18182 (s+10) (s+2.281) (s+0.2192) ----------------------------------(s+3.419) (s^2 + 1.763s + 1.064) The result is a zero-pole-gain model as expected from the precedence rules. Note that Cloop inherited the input and output names from G. 11-75 feedback Example 2 Consider a state-space plant P with five inputs and four outputs and a state-space feedback controller K with three inputs and two outputs. To connect outputs 1, 3, and 4 of the plant to the controller inputs, and the controller outputs to inputs 4 and 2 of the plant, use feedin = [4 2]; feedout = [1 3 4]; Cloop = feedback(P,K,feedin,feedout) Example 3 You can form the following negative-feedback loops G G by Cloop = feedback(G,1) Cloop = feedback(1,G) Limitations % left diagram % right diagram The feedback connection should be free of algebraic loop. If D 1 and D 2 are the feedthrough matrices of sys1 and sys2, this condition is equivalent to: • I + D 1 D 2 nonsingular when using negative feedback • I – D 1 D 2 nonsingular when using positive feedback. See Also 11-76 star series parallel connect Star product of LTI systems (LFT connection) Series connection Parallel connection Derive state-space model for block diagram interconnection filt Purpose Syntax 11filt Specify discrete transfer functions in DSP format sys = filt(num,den) sys = filt(num,den,Ts) sys = filt(M) sys = filt(num,den,'Property1',Value1,...,'PropertyN',ValueN) sys = filt(num,den,Ts,'Property1',Value1,...,'PropertyN',ValueN) Description In digital signal processing (DSP), it is customary to write transfer functions –1 as rational expressions in z and to order the numerator and denominator –1 terms in ascending powers of z , for example, –1 2+z –1 H ( z ) = -------------------------------------------–1 –2 1 + 0.4z + 2z The function filt is provided to facilitate the specification of transfer functions in DSP format. sys = filt(num,den) creates a discrete-time transfer function sys with numerator(s) num and denominator(s) den. The sample time is left unspecified (sys.Ts = –1) and the output sys is a TF object. sys = filt(num,den,Ts) further specifies the sample time Ts (in seconds). sys = filt(M) specifies a static filter with gain matrix M. Any of the previous syntaxes can be followed by property name/property value pairs of the form 'Property',Value Each pair specifies a particular LTI property of the model, for example, the input names or the transfer function variable. See “LTI Properties” on page 2-26 and the set entry for additional information on LTI properties and admissible property values. Arguments For SISO transfer functions, num and den are row vectors containing the –1 numerator and denominator coefficients ordered in ascending powers of z . –1 –2 For example, den = [1 0.4 2] represents the polynomial 1 + 0.4z + 2z . 11-77 filt MIMO transfer functions are regarded as arrays of SISO transfer functions (one per I/O channel), each of which is characterized by its numerator and denominator. The input arguments num and den are then cell arrays of row vectors such that: • num and den have as many rows as outputs and as many columns as inputs. • Their ( i, j ) entries num{i,j} and den{i,j} specify the numerator and denominator of the transfer function from input j to output i. If all SISO entries have the same denominator, you can also set den to the row vector representation of this common denominator. See also “MIMO Transfer Function Models” on page 2-10 for alternative ways to specify MIMO transfer functions. Remark filt behaves as tf with the Variable property set to 'z^–1' or 'q'. See tf entry below for details. Example Typing the commands num = {1 , [1 0.3]} den = {[1 1 2] ,[5 2]} H = filt(num,den,'inputname',{'channel1' 'channel2'}) creates the two-input digital filter –1 1 H ( z ) = ----------------------------------–1 –2 1 + z + 2z –1 1 + 0.3z ------------------------–1 5 + 2z with unspecified sample time and input names 'channel1' and 'channel2'. See Also 11-78 tf zpk ss Create transfer functions Create zero-pole-gain models Create state-space models frd Purpose Syntax 11frd Create a frequency response data (FRD) object or convert another model type to an FRD model sys sys sys sys = = = = frd(response,frequency) frd(response,frequency,Ts) frd frd(response,frequency,ltisys) sysfrd = frd(sys,frequency) sysfrd = frd(sys,frequency,'Units',units) Description sys = frd(response,frequency) creates an FRD model sys from the frequency response data stored in the multidimensional array response. The vector frequency represents the underlying frequencies for the frequency response data. See Table 11-14, “Data Format for the Argument response in FRD Models,” on page 80. sys = frd(response,frequency,Ts) creates a discrete-time FRD model sys with scalar sample time Ts. Set Ts = –1 to create a discrete-time FRD model without specifying the sample time. sys = frd creates an empty FRD model. The input argument list for any of these syntaxes can be followed by property name/property value pairs of the form 'PropertyName',PropertyValue You can use these extra arguments to set the various properties of FRD models (see the set command, or “LTI Properties” on page 2-26 and “Model-Specific Properties” on page 2-28). These properties include 'Units'. The default units for FRD models are in 'rad/s'. To force an FRD model sys to inherit all of its generic LTI properties from any existing LTI model refsys, use the syntax sys = frd(response,frequency,ltisys). sysfrd = frd(sys,frequency) converts a TF, SS, or ZPK model to an FRD model. The frequency response is computed at the frequencies provided by the vector frequency. 11-79 frd sysfrd = frd(sys,frequency,'Units',units)converts an FRD model from a TF, SS, or ZPK model while specifying the units for frequency to be units ('rad/s' or 'Hz'). Arguments When you specify a SISO or MIMO FRD model, or an array of FRD models, the input argument frequency is always a vector of length Nf, where Nf is the number of frequency data points in the FRD. The specification of the input argument response is summarized in the following table. Table 11-14: Data Format for the Argument response in FRD Models Model Form Response Data Format SISO model Vector of length Nf for which response(i) is the frequency response at the frequency frequency(i) MIMO model with Ny outputs and Nu inputs Ny-by-Nu-by-Nf multidimensional array for which response(i,j,k) specifies the frequency response from input j to output i at frequency frequency(k) S1-by-...-by-Sn array of models with Ny outputs and Nu inputs Multidimensional array of size [Ny Nu S1 ... Sn] for which response(i,j,k,:) specifies the array of frequency response data from input j to output i at frequency frequency(k) Remarks See “Frequency Response Data (FRD) Models” on page 2-17 for more information on single FRD models, and “Building LTI Arrays Using tf, zpk, ss, and frd” on page 4-17 for information on arrays of FRD models. Example Type the commands freq = logspace(1,2); resp = .05*(freq).*exp(i*2*freq); sys = frd(resp,freq) to create a SISO FRD model. See Also 11-80 chgunits frdata set ss Change units for an FRD model Quick access to data for an FRD model Set the properties for an LTI model Create state-space models frd tf zpk Create transfer functions Create zero-pole-gain models 11-81 frdata Purpose 11frdata Quick access to data for a frequency response data object Syntax [response,freq] = frdata(sys) [response,freq,Ts] = frdata(sys) [response,freq] = frdata(sys,'v') Description [response,freq] = frdata(sys) returns the response data and frequency samples of the FRD model sys. For an FRD model with Ny outputs and Nu inputs at Nf frequencies: • response is an Ny-by-Nu-by-Nf multidimensional array where the (i,j) entry specifies the response from input j to output i. • freq is a column vector of length Nf that contains the frequency samples of the FRD model. See Table 11-14, “Data Format for the Argument response in FRD Models,” on page 80 for more information on the data format for FRD response data. For SISO FRD models, the syntax [response,freq] = frdata(sys,'v') forces frdata to return the response data and frequencies directly as column vectors rather than as cell arrays (see example below). [response,freq,Ts] = frdata(sys) also returns the sample time Ts. Other properties of sys can be accessed with get or by direct structure-like referencing (e.g., sys.Units). Arguments The input argument sys to frdata must be an FRD model. Example Typing the commands freq = logspace(1,2,2); resp = .05*(freq).*exp(i*2*freq); sys = frd(resp,freq); [resp,freq] = frdata(sys,'v') 11-82 frdata returns the FRD model data resp = 0.2040 + 0.4565i 2.4359 - 4.3665i freq = 10 100 See Also frd get set Create or convert to FRD models Get the properties for an LTI model Set model properties 11-83 freqresp Purpose 11freqresp Compute frequency response over grid of frequencies Syntax H = freqresp(sys,w) Description H = freqresp(sys,w) computes the frequency response of the LTI model sys at the real frequency points specified by the vector w. The frequencies must be in radians/sec. For single LTI Models, freqresp(sys,w) returns a 3-D array H with the frequency as the last dimension (see “Arguments” below). For LTI arrays of size [Ny Nu S1 ... Sn], freqresp(sys,w) returns a [Ny–by–Nu–by– S1–by–...–by–Sn] length (w) array. In continuous time, the response at a frequency ω is the transfer function value at s = jω . For state-space models, this value is given by –1 H ( jω ) = D + C ( jωI – A ) B In discrete time, the real frequencies w(1),..., w(N) are mapped to points on the jωT s unit circle using the transformation z = e where T s is the sample time. The transfer function is then evaluated at the resulting z values. The default T s = 1 is used for models with unspecified sample time. Remark If sys is an FRD model, freqresp(sys,w), w can only include frequencies in sys.frequency. Arguments The output argument H is a 3-D array with dimensions ( number of outputs ) × ( number of inputs ) × ( length of w ) For SISO systems, H(1,1,k) gives the scalar response at the frequency w(k). For MIMO systems, the frequency response at w(k) is H(:,:,k), a matrix with as many rows as outputs and as many columns as inputs. Example 11-84 Compute the frequency response of freqresp P( s ) = 0 1 -----------s+1 s–1 -----------s+2 1 at the frequencies ω = 1, 10, 100 . Type w = [1 10 100] H = freqresp(P,w) H(:,:,1) = 0 –0.2000+ 0.6000i 0.5000– 0.5000i 1.0000 H(:,:,2) = 0 0.9423+ 0.2885i 0.0099– 0.0990i 1.0000 H(:,:,3) = 0 0.9994+ 0.0300i 0.0001– 0.0100i 1.0000 The three displayed matrices are the values of P ( jω ) for ω = 1, ω = 10, ω = 100 The third index in the 3-D array H is relative to the frequency vector w, so you can extract the frequency response at ω = 10 rad/sec by H(:,:,w==10) ans = 0 0.9423+ 0.2885i 0.0099– 0.0990i 1.0000 11-85 freqresp Algorithm For transfer functions or zero-pole-gain models, freqresp evaluates the numerator(s) and denominator(s) at the specified frequency points. For continuous-time state-space models ( A, B, C, D ) , the frequency response is –1 D + C ( jω – A ) B , ω = ω 1, ..., ω N When numerically safe, A is diagonalized for fast evaluation of this expression at the frequencies ω 1, ..., ω N . Otherwise, A is reduced to upper Hessenberg form and the linear equation ( jω – A )X = B is solved at each frequency point, taking advantage of the Hessenberg structure. The reduction to Hessenberg form provides a good compromise between efficiency and reliability. See [1] for more details on this technique. Diagnostics If the system has a pole on the jω axis (or unit circle in the discrete-time case) and w happens to contain this frequency point, the gain is infinite, jωI – A is singular, and freqresp produces the following warning message. Singularity in freq. response due to jw-axis or unit circle pole. See Also References 11-86 evalfr bode nyquist nichols sigma ltiview Response at single complex frequency Bode plot Nyquist plot Nichols plot Singular value plot LTI system viewer [1] Laub, A.J., “Efficient Multivariable Frequency Response Computations,” IEEE Transactions on Automatic Control, AC-26 (1981), pp. 407–408. gensig Purpose 11gensig Generate test input signals for lsim Syntax [u,t] = gensig(type,tau) [u,t] = gensig(type,tau,Tf,Ts) Description [u,t] = gensig(type,tau) generates a scalar signal u of class type and with period tau (in seconds). The following types of signals are available. type = 'sin' Sine wave. type = 'square' Square wave. type = 'pulse' Periodic pulse. gensig returns a vector t of time samples and the vector u of signal values at these samples. All generated signals have unit amplitude. [u,t] = gensig(type,tau,Tf,Ts) also specifies the time duration Tf of the signal and the spacing Ts between the time samples t. You can feed the outputs u and t directly to lsim and simulate the response of a single-input linear system to the specified signal. Since t is uniquely determined by Tf and Ts, you can also generate inputs for multi-input systems by repeated calls to gensig. Example Generate a square wave with period 5 seconds, duration 30 seconds, and sampling every 0.1 seconds. [u,t] = gensig('square',5,30,0.1) 11-87 gensig Plot the resulting signal. plot(t,u) axis([0 30 –1 2]) 2 1.5 1 0.5 0 −0.5 −1 See Also 11-88 0 lsim 5 10 15 20 Simulate response to arbitrary inputs 25 30 get Purpose 11get Access/query LTI property values Syntax Value = get(sys,'PropertyName') get(sys) Description Value = get(sys,'PropertyName') returns the current value of the property PropertyName of the LTI model sys. The string 'PropertyName' can be the full property name (for example, 'UserData') or any unambiguous case-insensitive abbreviation (for example, 'user'). You can specify any generic LTI property, or any property specific to the model sys (see “LTI Properties” on page 2-26 for details on generic and model-specific LTI properties). Without left-hand argument, get(sys) displays all properties of sys and their values. Example Consider the discrete-time SISO transfer function defined by h = tf(1,[1 2],0.1,'inputname','voltage','user','hello'); You can display all LTI properties of h with get(h) num: {[0 1]} den: {[1 2]} Variable: 'z' Ts: 0.1 InputDelay: 0 OutputDelay: 0 ioDelayMatrix: 0 InputName: {'voltage'} OutputName: {''} InputGroup: {0x2 cell} OutputGroup: {0x2 cell} Notes: {} UserData: 'hello' 11-89 get or query only about the numerator and sample time values by get(h,'num') ans = [1x2 double] and get(h,'ts') ans = 0.1000 Because the numerator data (num property) is always stored as a cell array, the first command evaluates to a cell array containing the row vector [0 1]. Remark An alternative to the syntax Value = get(sys,'PropertyName') is the structure-like referencing Value = sys.PropertyName For example, sys.Ts sys.a sys.user return the values of the sample time, A matrix, and UserData property of the (state-space) model sys. See Also 11-90 frdata set ssdata tfdata zpkdata Quick access to frequency response data Set/modify LTI properties Quick access to state-space data Quick access to transfer function data Quick access to zero-pole-gain data gram Purpose 11gram Compute controllability and observability gramians Syntax Wc = gram(sys,'c') Wo = gram(sys,'o') Description gram calculates controllability and observability gramians. You can use gramians to study the controllability and observability properties of state-space models and for model reduction [1,2]. They have better numerical properties than the controllability and observability matrices formed by ctrb and obsv. Given the continuous-time state-space model · x = Ax + Bu y = Cx + Du the controllability gramian is defined by ∞ Wc = ∫0 e Aτ T A τ T BB e dτ and the observability gramian by ∞ Wo = ∫0 e A τ T T C Ce Aτ dτ The discrete-time counterparts are ∞ Wc = ∑A ∞ k T T k BB ( A ) , k=0 Wo = ∑ (A T k T ) C CA k k=0 The controllability gramian is positive definite if and only if ( A, B ) is controllable. Similarly, the observability gramian is positive definite if and only if ( C, A ) is observable. Use the commands Wc = gram(sys,'c') Wo = gram(sys,'o') % controllability gramian % observability gramian 11-91 gram to compute the gramians of a continuous or discrete system. The LTI model sys must be in state-space form. Algorithm The controllability gramian W c is obtained by solving the continuous-time Lyapunov equation T AW c + W c A + BB T = 0 or its discrete-time counterpart T AW c A – W c + BB T = 0 Similarly, the observability gramian W o solves the Lyapunov equation T T A Wo + W o A + C C = 0 in continuous time, and the Lyapunov equation T T A Wo A – Wo + C C = 0 in discrete time. Limitations The A matrix must be stable (all eigenvalues have negative real part in continuous time, and magnitude strictly less than one in discrete time). See Also balreal ctrb lyap, dlyap obsv References 11-92 Gramian-based balancing of state-space realizations Controllability matrix Lyapunov equation solvers Observability matrix [1] Kailath, T., Linear Systems, Prentice-Hall, 1980. hasdelay Purpose 11hasdelay Test if an LTI model has time delays Syntax hasdelay(sys) Description hasdelay(sys) returns 1 (true) if the LTI model sys has input delays, output delays, or I/O delays, and 0 (false) otherwise. See Also delay2z totaldelay Changes transfer functions of discrete-time LTI models with delays to rational functions or absorbs FRD delays into the frequency response phase information Combines delays for an LTI model 11-93 impulse Purpose Syntax 11impulse Compute the impulse response of LTI models impulse(sys) impulse(sys,t) impulse(sys1,sys2,...,sysN) impulse(sys1,sys2,...,sysN,t) impulse(sys1,'PlotStyle1',...,sysN,'PlotStyleN') [y,t,x] = impulse(sys) Description impulse calculates the unit impulse response of a linear system. The impulse response is the response to a Dirac input δ ( t ) for continuous-time systems and to a unit pulse at t = 0 for discrete-time systems. Zero initial state is assumed in the state-space case. When invoked without left-hand arguments, this function plots the impulse response on the screen. impulse(sys) plots the impulse response of an arbitrary LTI model sys. This model can be continuous or discrete, and SISO or MIMO. The impulse response of multi-input systems is the collection of impulse responses for each input channel. The duration of simulation is determined automatically to display the transient behavior of the response. impulse(sys,t) sets the simulation horizon explicitly. You can specify either a final time t = Tfinal (in seconds), or a vector of evenly spaced time samples of the form t = 0:dt:Tfinal For discrete systems, the spacing dt should match the sample period. For continuous systems, dt becomes the sample time of the discretized simulation model (see “Algorithm”), so make sure to choose dt small enough to capture transient phenomena. To plot the impulse responses of several LTI models sys1,..., sysN on a single figure, use impulse(sys1,sys2,...,sysN) impulse(sys1,sys2,...,sysN,t) 11-94 impulse As with bode or plot, you can specify a particular color, linestyle, and/or marker for each system, for example, impulse(sys1,'y:',sys2,'g--') See “Plotting and Comparing Multiple Systems” on page 5-13 and the bode entry in this chapter for more details. When invoked with lefthand arguments, [y,t] = impulse(sys) [y,t,x] = impulse(sys) y = impulse(sys,t) % for state-space models only return the output response y, the time vector t used for simulation, and the state trajectories x (for state-space models only). No plot is drawn on the screen. For single-input systems, y has as many rows as time samples (length of t), and as many columns as outputs. In the multi-input case, the impulse responses of each input channel are stacked up along the third dimension of y. The dimensions of y are then ( length of t ) × ( number of outputs ) × ( number of inputs ) and y(:,:,j) gives the response to an impulse disturbance entering the jth input channel. Similarly, the dimensions of x are ( length of t ) × ( number of states ) × ( number of inputs ) Example To plot the impulse response of the second-order state-space model · x1 –0.5572 – 0.7814 x 1 1 = + · x 0.7814 0 0 x2 2 y = 1.9691 6.4493 –1 u1 2 u2 x1 x2 11-95 impulse use the following commands. a = [–0.5572 –0.7814;0.7814 b = [1 –1;0 2]; c = [1.9691 6.4493]; sys = ss(a,b,c,0); impulse(sys) 0]; Impulse Response From: U1 From: U2 12 10 8 Amplitude 6 4 2 0 −2 −4 −6 0 5 10 15 200 5 10 15 Time (sec.) The left plot shows the impulse response of the first input channel, and the right plot shows the impulse response of the second input channel. You can store the impulse response data in MATLAB arrays by [y,t] = impulse(sys) 11-96 20 impulse Because this system has two inputs, y is a 3-D array with dimensions size(y) ans = 101 1 2 (the first dimension is the length of t). The impulse response of the first input channel is then accessed by y(:,:,1) Algorithm Continuous-time models are first converted to state space. The impulse response of a single-input state-space model · x = Ax + bu y = Cx is equivalent to the following unforced response with initial state b . · x = Ax , x(0) = b y = Cx To simulate this response, the system is discretized using zero-order hold on the inputs. The sampling period is chosen automatically based on the system dynamics, except when a time vector t = 0:dt:Tf is supplied (dt is then used as sampling period). Limitations The impulse response of a continuous system with nonzero D matrix is infinite at t = 0 . impulse ignores this discontinuity and returns the lower continuity value Cb at t = 0 . See Also ltiview step initial lsim LTI system viewer Step response Free response to initial condition Simulate response to arbitrary inputs 11-97 initial Purpose Syntax 11initial Compute the initial condition response of state-space models initial(sys,x0) initial(sys,x0,t) initial(sys1,sys2,...,sysN,x0) initial(sys1,sys2,...,sysN,x0,t) initial(sys1,'PlotStyle1',...,sysN,'PlotStyleN',x0) [y,t,x] = initial(sys,x0) Description initial calculates the unforced response of a state-space model with an initial condition on the states. · x = Ax , x ( 0 ) = x0 y = Cx This function is applicable to either continuous- or discrete-time models. When invoked without lefthand arguments, initial plots the initial condition response on the screen. initial(sys,x0) plots the response of sys to an initial condition x0 on the states. sys can be any state-space model (continuous or discrete, SISO or MIMO, with or without inputs). The duration of simulation is determined automatically to reflect adequately the response transients. initial(sys,x0,t) explicitly sets the simulation horizon. You can specify either a final time t = Tfinal (in seconds), or a vector of evenly spaced time samples of the form t = 0:dt:Tfinal For discrete systems, the spacing dt should match the sample period. For continuous systems, dt becomes the sample time of the discretized simulation model (see impulse), so make sure to choose dt small enough to capture transient phenomena. 11-98 initial To plot the initial condition responses of several LTI models on a single figure, use initial(sys1,sys2,...,sysN,x0) initial(sys1,sys2,...,sysN,x0,t) (see impulse for details). When invoked with lefthand arguments, [y,t,x] = initial(sys,x0) [y,t,x] = initial(sys,x0,t) return the output response y, the time vector t used for simulation, and the state trajectories x. No plot is drawn on the screen. The array y has as many rows as time samples (length of t) and as many columns as outputs. Similarly, x has length(t) rows and as many columns as states. Example Plot the response of the state-space model · x1 –0.5572 –0.7814 = · 0.7814 0 x2 y = 1.9691 6.4493 x1 x2 x1 x2 11-99 initial to the initial condition 1 0 x( 0) = a = [–0.5572 –0.7814;0.7814 c = [1.9691 6.4493]; x0 = [1 ; 0] 0]; sys = ss(a,[],c,[]); initial(sys,x0) Initial Condition Results 5 4 3 Amplitude 2 1 0 −1 −2 0 2 4 6 8 10 12 14 Time (sec.) See Also 11-100 impulse lsim ltiview step Impulse response Simulate response to arbitrary inputs LTI system viewer Step response 16 18 20 inv Purpose 11inv Invert LTI systems Syntax isys = inv(sys) Description inv inverts the input/output relation y = G ( s )u –1 to produce the LTI system with the transfer matrix H ( s ) = G ( s ) . u = H ( s )y This operation is defined only for square systems (same number of inputs and outputs) with an invertible feedthrough matrix D . inv handles both continuous- and discrete-time systems. Example Consider H(s) = 1 0 1 -----------s+1 1 At the MATLAB prompt, type H = [1 tf(1,[1 1]);0 1] Hi = inv(H) to invert it. MATLAB returns Transfer function from input 1 to output... #1: 1 #2: 0 Transfer function from input 2 to output... –1 #1: ----s + 1 #2: 1 11-101 inv You can verify that H * Hi is the identity transfer function (static gain I). Limitations Do not use inv to model feedback connections such as + G – H While it seems reasonable to evaluate the corresponding closed-loop transfer –1 function ( I + GH ) G as inv(1+g*h) * g this typically leads to nonminimal closed-loop models. For example, g = zpk([],1,1) h = tf([2 1],[1 0]) cloop = inv(1+g*h) * g yields a third-order closed-loop model with an unstable pole-zero cancellation at s = 1. cloop Zero/pole/gain: s (s–1) ------------------(s–1) (s^2 + s + 1) 11-102 inv Use feedback or star to avoid such pitfalls. cloop = feedback(g,h) Zero/pole/gain: s ------------(s^2 + s + 1) 11-103 isct, isdt Purpose 11isct, isdt Determine whether an LTI model is continuous or discrete Syntax boo = isct(sys) boo = isdt(sys) Description boo = isct(sys) returns 1 (true) if the LTI model sys is continuous and 0 (false) otherwise. sys is continuous if its sample time is zero, that is, sys.Ts=0. boo = isdt(sys) returns 1 (true) if sys is discrete and 0 (false) otherwise. Discrete-time LTI models have a nonzero sample time, except for empty models and static gains, which are regarded as either continuous or discrete as long as their sample time is not explicitly set to a nonzero value. Thus both isct(tf(10)) isdt(tf(10)) are true. However, if you explicitly label a gain as discrete, for example, by typing g = tf(10,'ts',0.01) isct(g) now returns false and only isdt(g) is true. See Also 11-104 isa isempty isproper Determine LTI model type True for empty LTI models True for proper LTI models isempty Purpose 11isempty Test if an LTI model is empty Syntax boo = isempty(sys) Description isempty(sys) returns 1 (true) if the LTI model sys has no input or no output, and 0 (false) otherwise. Example Both commands isempty(tf) % tf by itself returns an empty transfer function isempty(ss(1,2,[],[])) return 1 (true) while isempty(ss(1,2,3,4)) returns 0 (false). See Also issiso size True for SISO systems I/O dimensions and array dimensions of LTI models 11-105 isproper Purpose Syntax Description 11isproper Test if an LTI model is proper boo = isproper(sys) isproper(sys) returns 1 (true) if the LTI model sys is proper and 0 (false) otherwise. State-space models are always proper. SISO transfer functions or zero-pole-gain models are proper if the degree of their numerator is less than or equal to the degree of their denominator. MIMO transfer functions are proper if all their SISO entries are proper. Example The following commands isproper(tf([1 0],1)) isproper(tf([1 0],[1 1])) return false and true, respectively. 11-106 % transfer function s % transfer function s/(s+1) issiso Purpose Syntax Description 11issiso Test if an LTI model is single-input/single-output (SISO) boo = issiso(sys) issiso(sys) returns 1 (true) if the LTI model sys is SISO and 0 (false) otherwise. See Also isempty size True for empty LTI models I/O dimensions and array dimensions of LTI models 11-107 kalman Purpose 11kalman Design continuous- or discrete-time Kalman estimator Syntax [kest,L,P] = kalman(sys,Qn,Rn,Nn) [kest,L,P,M,Z] = kalman(sys,Qn,Rn,Nn) % discrete time only [kest,L,P] = kalman(sys,Qn,Rn,Nn,sensors,known) Description kalman designs a Kalman state estimator given a state-space model of the plant and the process and measurement noise covariance data. The Kalman estimator is the optimal solution to the following continuous or discrete estimation problems. Continuous-Time Estimation Given the continuous plant · x = Ax + Bu + Gw y v = Cx + Du + Hw + v (state equation) (measurement equation) with known inputs u and process and measurement white noise w, v satisfying E(w) = E(v) = 0 , T E ( ww ) = Q , T T E ( vv ) = R , E ( wv ) = N construct a state estimate xˆ ( t ) that minimizes the steady-state error covariance T P = lim E ( { x – xˆ } { x – xˆ } ) t→∞ The optimal solution is the Kalman filter with equations · xˆ = Axˆ + Bu + L ( y v – Cxˆ – Du ) yˆ xˆ = C ˆ D x+ u I 0 where the filter gain L is determined by solving an algebraic Riccati equation. This estimator uses the known inputs u and the measurements y v to generate 11-108 kalman the output and state estimates yˆ and xˆ . Note that yˆ estimates the true plant output y = Cx + Du + Hw u yˆ Kalman filter xˆ yv u Plant w y + v (Measurement noise) Kalman estimator Discrete-Time Estimation Given the discrete plant x [ n + 1 ] = Ax [ n ] + Bu [ n ] + Gw [ n ] y v [ n ] = Cx [ n ] + Du [ n ] + Hw [ n ] + v [ n ] and the noise covariance data T E ( w [ n ]w [ n ] ) = Q , T T E ( v [ n ]v [ n ] ) = R , E ( w [ n ]v [ n ] ) = N the Kalman estimator has equations xˆ [ n + 1 n ] = Axˆ [ n n – 1 ] + Bu [ n ] + L ( y v [ n ] – Cxˆ [ n n – 1 ] – Du [ n ] ) yˆ [ n n ] xˆ [ n n ] = C ( I – MC ) ˆ ( I – CM )D CM u [ n ] x[ n n – 1] + I – MC – MD M yv [ n ] 11-109 kalman and generates optimal “current” output and state estimates yˆ [ n n ] and xˆ [ n n ] using all available measurements including y v [ n ] . The gain matrices L and M are derived by solving a discrete Riccati equation. The innovation gain M is used to update the prediction xˆ [ n n – 1 ] using the new measurement y v [ n ] . xˆ [ n n ] = xˆ [ n n – 1 ] + M y v [ n ] – Cxˆ [ n n – 1 ] – Du [ n ] innovation Usage [kest,L,P] = kalman(sys,Qn,Rn,Nn) returns a state-space model kest of the Kalman estimator given the plant model sys and the noise covariance data Qn, Rn, Nn (matrices Q, R, N above). sys must be a state-space model with matrices A, B G , C, D H The resulting estimator kest has [ u ; y v ] as inputs and [ yˆ ; xˆ ] (or their discrete-time counterparts) as outputs. You can omit the last input argument Nn when N = 0 . The function kalman handles both continuous and discrete problems and produces a continuous estimator when sys is continuous, and a discrete estimator otherwise. In continuous time, kalman also returns the Kalman gain L and the steady-state error covariance matrix P. Note that P is the solution of the associated Riccati equation. In discrete time, the syntax [kest,L,P,M,Z] = kalman(sys,Qn,Rn,Nn) returns the filter gain L and innovations gain M , as well as the steady-state error covariances T P = lim E ( e [ n n – 1 ]e [ n n – 1 ] ) , n→∞ T Z = lim E ( e [ n n ]e [ n n ] ) , n→∞ e[ n n – 1 ] = x[ n ] – x[ n n – 1 ] e[n n ] = x[ n ] – x[ n n] Finally, use the syntaxes [kest,L,P] = kalman(sys,Qn,Rn,Nn,sensors,known) [kest,L,P,M,Z] = kalman(sys,Qn,Rn,Nn,sensors,known) 11-110 kalman for more general plants sys where the known inputs u and stochastic inputs w are mixed together, and not all outputs are measured. The index vectors sensors and known then specify which outputs y of sys are measured and which inputs u are known. All other inputs are assumed stochastic. Example See examples on “Control Design Tools” on page 1-20, “LQG Design for the x-Axis” on page 9-34, and “Kalman Filtering” on page 9-50. Limitations The plant and noise data must satisfy: • ( C, A ) detectable –1 T • R > 0 and Q – NR N ≥ 0 –1 –1 T • ( A – NR C, Q – NR N ) has no uncontrollable mode on the imaginary axis (or unit circle in discrete time) with the notation Q = GQG T T T R = R + HN + N H + HQH T T N = G ( QH + N ) See Also References care dare estim kalmd lqgreg lqr Solve continuous-time Riccati equations Solve discrete-time Riccati equations Form estimator given estimator gain Discrete Kalman estimator for continuous plant Assemble LQG regulator Design state-feedback LQ regulator [1] Franklin, G.F., J.D. Powell, and M.L. Workman, Digital Control of Dynamic Systems, Second Edition, Addison-Wesley, 1990. 11-111 kalmd Purpose 11kalmd Design discrete Kalman estimator for continuous plant Syntax [kest,L,P,M,Z] = kalmd(sys,Qn,Rn,Ts) Description kalmd designs a discrete-time Kalman estimator that has response characteristics similar to a continuous-time estimator designed with kalman. This command is useful to derive a discrete estimator for digital implementation after a satisfactory continuous estimator has been designed. [kest,L,P,M,Z] = kalmd(sys,Qn,Rn,Ts) produces a discrete Kalman estimator kest with sample time Ts for the continuous-time plant · x = Ax + Bu + Gw y v = Cx + Du + v (state equation) (measurement equation) with process noise w and measurement noise v satisfying T E(w) = E(v) = 0 , E ( ww ) = Q n , T T E ( vv ) = R n , E ( wv ) = 0 The estimator kest is derived as follows. The continuous plant sys is first discretized using zero-order hold with sample time Ts (see c2d entry), and the continuous noise covariance matrices Q n and R n are replaced by their discrete equivalents Ts Qd = ∫0 e Aτ T A τ T GQG e dτ Rd = R ⁄ Ts The integral is computed using the matrix exponential formulas in [2]. A discrete-time estimator is then designed for the discretized plant and noise. See kalman for details on discrete-time Kalman estimation. kalmd also returns the estimator gains L and M, and the discrete error covariance matrices P and Z (see kalman for details). Limitations The discretized problem data should satisfy the requirements for kalman. See Also kalman 11-112 Design Kalman estimator kalmd lqgreg lqrd References Assemble LQG regulator Discrete LQ-optimal gain for continuous plant [1] Franklin, G.F., J.D. Powell, and M.L. Workman, Digital Control of Dynamic Systems, Second Edition, Addison-Wesley, 1990. [2] Van Loan, C.F., “Computing Integrals Involving the Matrix Exponential,” IEEE Trans. Automatic Control, AC-15, October 1970. 11-113 kalmd 11-114 lft Purpose 11lft Redheffer star product (linear fractional transformation) of two LTI models Syntax sys = lft(sys1,sys2) sys = lft(sys1,sys2,nu,ny) Description lft forms the star product or linear fractional transformation (LFT) of two LTI models or LTI arrays. Such interconnections are widely used in robust control techniques. sys = lft(sys1,sys2,nu,ny) forms the star product sys of the two LTI models (or LTI arrays) sys1 and sys2. The star product amounts to the following feedback connection for single LTI models (or for each model in an LTI array). sys w1 w2 z1 sys1 u y y u sys2 z2 This feedback loop connects the first nu outputs of sys2 to the last nu inputs of sys1 (signals u ), and the last ny outputs of sys1 to the first ny inputs of sys2 (signals y ). The resulting system sys maps the input vector [ w 1 ; w 2 ] to the output vector [ z 1 ; z 2 ] . 11-115 lft The abbreviated syntax sys = lft(sys1,sys2) produces: • The lower LFT of sys1 and sys2 if sys2 has fewer inputs and outputs than sys1. This amounts to deleting w 2 and z 2 in the above diagram. • The upper LFT of sys1 and sys2 if sys1 has fewer inputs and outputs than sys2. This amounts to deleting w 1 and z 1 in the above diagram. w1 z1 sys1 sys1 u u y y sys2 sys2 z2 w2 Lower LFT connection Upper LFT connection Algorithm The closed-loop model is derived by elementary state-space manipulations. Limitations There should be no algebraic loop in the feedback connection. See Also connect feedback 11-116 Derive state-space model for block diagram interconnection Feedback connection lqgreg Purpose Syntax 11lqgreg Form LQG regulator given state-feedback gain and Kalman estimator rlqg = lqgreg(kest,k) rlqg = lqgreg(kest,k,'current') % discrete-time only rlqg = lqgreg(kest,k,controls) Description lqgreg forms the LQG regulator by connecting the Kalman estimator designed with kalman and the optimal state-feedback gain designed with lqr, dlqr, or lqry. The LQG regulator minimizes some quadratic cost function that trades off regulation performance and control effort. This regulator is dynamic and relies on noisy output measurements to generate the regulating commands (see “LQG Regulator” on page 7-10 for details). In continuous time, the LQG regulator generates the commands u = – Kxˆ where xˆ is the Kalman state estimate. The regulator state-space equations are · xˆ = A – LC – ( B – LD )K xˆ + Ly v u = – Kxˆ where y v is the vector of plant output measurements (see kalman for background and notation). The diagram below shows this dynamic regulator in relation to the plant. 11-117 lqgreg Process noise Plant y u u –K xˆ Kalman filter + yv + Measurement noise LQG regulator In discrete time, you can form the LQG regulator using either the prediction xˆ [ n n – 1 ] of x [ n ] based on measurements up to y v [ n – 1 ] , or the current state estimate xˆ [ n n ] based on all available measurements including y v [ n ] . While the regulator u [ n ] = – Kxˆ [ n n – 1 ] is always well-defined, the current regulator u [ n ] = – Kxˆ [ n n ] is causal only when I – KMD is invertible (see kalman for the notation). In addition, practical implementations of the current regulator should allow for the processing time required to compute u [ n ] once the measurements y v [ n ] become available (this amounts to a time delay in the feedback loop). Usage 11-118 rlqg = lqgreg(kest,k) returns the LQG regulator rlqg (a state-space model) given the Kalman estimator kest and the state-feedback gain matrix k. The same function handles both continuous- and discrete-time cases. Use consistent tools to design kest and k: lqgreg • Continuous regulator for continuous plant: use lqr or lqry and kalman. • Discrete regulator for discrete plant: use dlqr or lqry and kalman. • Discrete regulator for continuous plant: use lqrd and kalmd. In discrete time, lqgreg produces the regulator u [ n ] = – Kxˆ [ n n – 1 ] by default (see “Description”). To form the “current” LQG regulator instead, use u [ n ] = – Kxˆ [ n n ] the syntax rlqg = lqgreg(kest,k,'current') This syntax is meaningful only for discrete-time problems. rlqg = lqgreg(kest,k,controls) handles estimators that have access to additional known plant inputs u d . The index vector controls then specifies which estimator inputs are the controls u , and the resulting LQG regulator rlqg has u d and y v as inputs (see figure below). Note: plant. Always use positive feedback to connect the LQG regulator to the 11-119 lqgreg u ud yv Kalman –K estimator u xˆ LQG regulator Example See the examples “Control Design Tools” on page 1-20 and “LQG Regulation” on page 9-31. See Also kalman kalmd lqr, dlqr lqrd lqry reg 11-120 Kalman estimator design Discrete Kalman estimator for continuous plant State-feedback LQ regulator Discrete LQ regulator for continuous plant LQ regulator with output weighting Form regulator given state-feedback and estimator gains lqr Purpose Syntax Description 11lqr Design linear-quadratic (LQ) state-feedback regulator for continuous plant [K,S,e] = lqr(A,B,Q,R) [K,S,e] = lqr(A,B,Q,R,N) [K,S,e] = lqr(A,B,Q,R,N) calculates the optimal gain matrix K such that the state-feedback law u = – Kx minimizes the quadratic cost function J( u ) = ∞ ∫0 ( x T T T Qx + u Ru + 2x Nu ) dt · for the continuous-time state-space model x = Ax + Bu The default value N=0 is assumed when N is omitted. In addition to the state-feedback gain K, lqr returns the solution S of the associated Riccati equation T –1 T T A S + SA – ( SB + N )R ( B S + N ) + Q = 0 and the closed-loop eigenvalues e = eig(A–B*K). Note that K is derived from S by –1 T T K = R (B S + N ) Limitations The problem data must satisfy: • The pair ( A, B ) is stabilizable. –1 T • R > 0 and Q – NR N ≥ 0 . –1 T –1 T • ( Q – NR N , A – BR N ) has no unobservable mode on the imaginary axis. 11-121 lqr See Also 11-122 care dlqr lqgreg lqrd lqry Solve continuous Riccati equations State-feedback LQ regulator for discrete plant Form LQG regulator Discrete LQ regulator for continuous plant State-feedback LQ regulator with output weighting lqrd Purpose 11lqrd Design discrete LQ regulator for continuous plant Syntax [Kd,S,e] = lqrd(A,B,Q,R,Ts) [Kd,S,e] = lqrd(A,B,Q,R,N,Ts) Description lqrd designs a discrete full-state-feedback regulator that has response characteristics similar to a continuous state-feedback regulator designed using lqr. This command is useful to design a gain matrix for digital implementation after a satisfactory continuous state-feedback gain has been designed. [Kd,S,e] = lqrd(A,B,Q,R,Ts) calculates the discrete state-feedback law u [ n ] = – Kd x [ n ] that minimizes a discrete cost function equivalent to the continuous cost function ∞ J = ∫0 ( x T T Qx + u Ru ) dt The matrices A and B specify the continuous plant dynamics · x = Ax + Bu and Ts specifies the sample time of the discrete regulator. Also returned are the solution S of the discrete Riccati equation for the discretized problem and the discrete closed-loop eigenvalues e = eig(Ad–Bd*Kd). [Kd,S,e] = lqrd(A,B,Q,R,N,Ts) solves the more general problem with a cross-coupling term in the cost function. ∞ J = Algorithm ∫0 ( x T T T Qx + u Ru + 2x Nu ) dt The equivalent discrete gain matrix Kd is determined by discretizing the continuous plant and weighting matrices using the sample time Ts and the zero-order hold approximation. 11-123 lqrd With the notation Φ( τ) = e Γ(τ) = Aτ τ ∫0 e Ad = Φ ( Ts ) , Aη B dη , Bd = Γ ( T s ) the discretized plant has equations x [ n + 1 ] = Ad x [ n ] + B d u [ n ] and the weighting matrices for the equivalent discrete cost function are Qd Nd T Nd Rd Ts = ∫0 T Q N Φ( τ) Γ(τ ) dτ T T 0 I Γ (τ) I N R Φ (τ) 0 The integrals are computed using matrix exponential formulas due to Van Loan (see [2]). The plant is discretized using c2d and the gain matrix is computed from the discretized data using dlqr. Limitations The discretized problem data should meet the requirements for dlqr. See Also c2d dlqr kalmd lqr References [1] Franklin, G.F., J.D. Powell, and M.L. Workman, Digital Control of Dynamic Systems, Second Edition, Addison-Wesley, 1980, pp. 439–440 Discretization of LTI model State-feedback LQ regulator for discrete plant Discrete Kalman estimator for continuous plant State-feedback LQ regulator for continuous plant [2] Van Loan, C.F., “Computing Integrals Involving the Matrix Exponential,” IEEE Trans. Automatic Control, AC-15, October 1970. 11-124 lqry Purpose 11lqry Linear-quadratic (LQ) state-feedback regulator with output weighting Syntax [K,S,e] = lqry(sys,Q,R) [K,S,e] = lqry(sys,Q,R,N) Description Given the plant · x = Ax + Bu y = Cx + Du or its discrete-time counterpart, lqry designs a state-feedback control u = – Kx that minimizes the quadratic cost function with output weighting J( u ) = ∞ ∫0 ( y T T T Qy + u Ru + 2y Nu ) dt (or its discrete-time counterpart). The function lqry is equivalent to lqr or dlqr with weighting matrices: Q N N T R = C D T T Q N CD T I N R 0 I 0 [K,S,e] = lqry(sys,Q,R,N) returns the optimal gain matrix K, the Riccati solution S, and the closed-loop eigenvalues e = eig(A-B*K). The state-space model sys specifies the continuous- or discrete-time plant data ( A, B, C, D ) . The default value N=0 is assumed when N is omitted. Example See “LQG Design for the x-Axis” on page 9-34 for an example. Limitations The data A, B, Q, R, N must satisfy the requirements for lqr or dlqr. See Also lqr dlqr kalman lqgreg State-feedback LQ regulator for continuous plant State-feedback LQ regulator for discrete plant Kalman estimator design Form LQG regulator 11-125 lsim Purpose Syntax 11lsim Simulate LTI model response to arbitrary inputs lsim(sys,u,t) lsim(sys,u,t,x0) lsim(sys1,sys2,...,sysN,u,t) lsim(sys1,sys2,...,sysN,u,t,x0) lsim(sys1,'PlotStyle1',...,sysN,'PlotStyleN',u,t) [y,t,x] = lsim(sys,u,t,x0) Description lsim simulates the (time) response of continuous or discrete linear systems to arbitrary inputs. When invoked without left-hand arguments, lsim plots the response on the screen. lsim(sys,u,t) produces a plot of the zero-initial condition time response of the LTI model sys to the input time history t,u. The vector t specifies the time samples for the simulation and consists of regularly spaced time samples t = T0:dt:Tfinal The matrix u must have as many rows as time samples (length(t)) and as many columns as system inputs. Each row u(i,:) specifies the input value(s) at the time sample t(i). The LTI model sys can be continuous or discrete, SISO or MIMO. In discrete time, u must be sampled at the same rate as the system (t is then redundant and can be omitted or set to the empty matrix). In continuous time, the time sampling dt=t(2)–t(1) is used to discretize the continuous model. Automatic resampling is performed if dt is too large (undersampling) and may give rise to hidden oscillations (see “Algorithm”). lsim(sys,u,t,x0) specifies a nonzero initial condition x0 for the system states. This initial condition is applied at t(1). This syntax applies only to state-space models. Finally, lsim(sys1,sys2,...,sysN,u,t) 11-126 lsim simulates the responses of several LTI models to the same input history t,u and plots these responses on a single figure. As with bode or plot, you can specify a particular color, linestyle, and/or marker for each system, for example, lsim(sys1,'y:',sys2,'g--',u,t,x0) The multisystem behavior is similar to that of bode or step. When invoked with left-hand arguments, [y,t] = lsim(sys,u,t) [y,t,x] = lsim(sys,u,t) [y,t,x] = lsim(sys,u,t,x0) % for state-space models only % with initial state return the output response y, the time vector t used for simulation, and the state trajectories x (for state-space models only). No plot is drawn on the screen. The matrix y has as many rows as time samples (length(t)) and as many columns as system outputs. The same holds for x with “outputs” replaced by states. Note that the output t may differ from the specified time vector when the input data is undersampled (see “Algorithm”). Example Simulate and plot the response of the system 2 2s + 5s + 1 -----------------------------2 + 2s + 3 s H(s) = s–1 ----------------------2 s +s+5 to a square wave with period of four seconds. First generate the square wave with gensig. Sample every 0.1 second during 10 seconds: [u,t] = gensig('square',4,10,0.1); 11-127 lsim Then simulate with lsim. H = [tf([2 5 1],[1 2 3]) ; tf([1 –1],[1 1 5])]; lsim(H,u,t) 11-128 lsim Note that if you begin the simulation with a nonzero value for t(1), then the zero-initial condition response is shifted in time, as shown below. lsim(H,u,t+4) Algorithm Discrete-time systems are simulated with ltitr (state space) or filter (transfer function and zero-pole-gain). Continuous-time systems are discretized with c2d using either the 'zoh' or 'foh' method ('foh' is used for smooth input signals and 'zoh' for discontinuous signals such as pulses or square waves). By default, the sampling period is set to the spacing dt between the user-supplied time samples t. However, if dt is not small enough to capture intersample behavior, lsim selects a smaller sampling period and resamples the input data using linear interpolation for smooth signals and zero-order hold for square signals. The time vector returned by lsim is then different from the specified t vector. 11-129 lsim To illustrate why resampling is sometimes necessary, consider the second-order model 2 ω - , H ( s ) = -----------------------------2 2 s + 2s + ω ω = 62.83 To simulate its response to a square wave with period 1 second, you can proceed as follows: w2 = 62.83^2 h = tf(w2,[1 2 w2]); t = 0:0.1:5; u = (rem(t,1)>=0.5); lsim(h,u,t) 11-130 % vector of time samples % square wave values lsim The response exhibits strong oscillations. Less obvious from this plot is the fact that lsim has resampled the input to reveal the oscillatory behavior. To see this, discretize H ( s ) using the sampling period 0.1 second (spacing in your t vector) and simulate the response of the discretized model: hd = c2d(h,0.1); lsim(hd,u,t) 11-131 lsim The two responses look quite different. To clarify this discrepancy, superimpose the two plots by lsim(h,'b--',hd,'r-',u,t) The cause is now obvious: hd is undersampled and its response (solid line) masks the intersample oscillations of the continuous model H ( s ) . By comparing the suggested sampling dt=t(2)–t(1) against the system dynamics, lsim detects such undersampling and resamples the input to produce accurate continuous-time simulations. See Also 11-132 gensig impulse initial ltiview step Generate test input signals for lsim Impulse response Free response to initial condition LTI system viewer Step response ltiview Purpose Syntax 11ltiview Initialize an LTI Viewer for LTI system response analysis ltiview ltiview(plottype,sys) ltiview(plottype,sys,extras) ltiview(plottype,sys1,sys2,...sysN) ltiview(plottype,sys1,sys2,...sysN,extras) ltiview(plottype,sys1,PlotStyle1,sys2,PlotStyle2,...) Description ltiview when invoked without input arguments, initializes a new LTI Viewer for LTI system response analysis. Only frequency-domain analysis functions can be applied to FRDs. ltiview(plottype,sys) initializes an LTI Viewer containing the LTI response type indicated by plottype for the LTI model sys. The string plottype can be any one of the following: 'step' 'impulse' 'initial' 'lsim' 'pzmap' 'bode' 'nyquist' 'nichols' 'sigma' or, plottype can be a cell vector containing up to six of these plot types. For example, ltiview({'step';'nyquist'},sys) displays the plots of both of these response types for a given system sys. ltiview(plottype,sys,extras) allows the additional input arguments supported by the various LTI model response functions to be passed to the ltiview command. 11-133 ltiview extras is one or more input arguments as specified by the function named in plottype. These arguments may be required or optional, depending on the type of LTI response. For example, if plottype is 'step' then extras may be the desired final time, Tfinal, as shown below. ltiview('step',sys,Tfinal) However, if plottype is 'initial', the extras arguments must contain the initial conditions x0 and may contain other arguments, such as Tfinal. ltiview('initial',sys,x0,Tfinal) See the individual references pages of each possible plottype commands for a list of appropriate arguments for extras. Finally, ltiview(plottype,sys1,sys2,...sysN) ltiview(plottype,sys1,sys2,...sysN,extras) ltiview(plottype,sys1,PlotStyle1,sys2,PlotStyle2,...) initializes an LTI Viewer containing the responses of multiple LTI models, using the plot styles in PlotStyle, when applicable. See the individual reference pages of the LTI response functions for more information on specifying plot styles. Example See Chapter 6, “The LTI Viewer.” See Also bode impulse initial lsim nichols nyquist pzmap sigma step 11-134 Bode response Impulse response Response to initial condition Simulate LTI model response to arbitrary inputs Nichols response Nyquist response Pole/zero map Singular value response Step response lyap Purpose 11lyap Solve continuous-time Lyapunov equations Syntax X = lyap(A,Q) X = lyap(A,B,C) Description lyap solves the special and general forms of the Lyapunov matrix equation. Lyapunov equations arise in several areas of control, including stability theory and the study of the RMS behavior of systems. X = lyap(A,Q) solves the Lyapunov equation T AX + XA + Q = 0 where A and Q are square matrices of identical sizes. The solution X is a symmetric matrix if Q is. X = lyap(A,B,C) solves the generalized Lyapunov equation (also called Sylvester equation). AX + XB + C = 0 The matrices A, B, C must have compatible dimensions but need not be square. Algorithm lyap transforms the A and B matrices to complex Schur form, computes the solution of the resulting triangular system, and transforms this solution back [1]. Limitations The continuous Lyapunov equation has a (unique) solution if the eigenvalues α 1, α 2, ..., α n of A and β 1, β 2, ..., β n of B satisfy αi + β j ≠ 0 for all pairs ( i, j ) If this condition is violated, lyap produces the error message Solution does not exist or is not unique. See Also covar dlyap Covariance of system response to white noise Solve discrete Lyapunov equations 11-135 lyap References [1] Bartels, R.H. and G.W. Stewart, “Solution of the Matrix Equation AX + XB = C,” Comm. of the ACM, Vol. 15, No. 9, 1972. [2] Bryson, A.E. and Y.C. Ho, Applied Optimal Control, Hemisphere Publishing, 1975. pp. 328–338. 11-136 margin Purpose 11margin Compute gain and phase margins and associated crossover frequencies Syntax [Gm,Pm,Wcg,Wcp] = margin(sys) [Gm,Pm,Wcg,Wcp] = margin(mag,phase,w) margin(sys) Description margin calculates the gain margin, phase margin, and associated crossover frequencies of SISO open-loop models. The gain and phase margins indicate the relative stability of the control system when the loop is closed. When invoked without left-hand arguments, margin produces a Bode plot and displays the margins on this plot. The gain margin is the amount of gain increase required to make the loop gain unity at the frequency where the phase angle is –180°. In other words, the gain margin is 1 ⁄ g if g is the gain at the –180° phase frequency. Similarly, the phase margin is the difference between the phase of the response and –180° when the loop gain is 1.0. The frequency at which the magnitude is 1.0 is called the unity-gain frequency or crossover frequency. It is generally found that gain margins of three or more combined with phase margins between 30 and 60 degrees result in reasonable trade-offs between bandwidth and stability. [Gm,Pm,Wcg,Wcp] = margin(sys) computes the gain margin Gm, the phase margin Pm, and the corresponding crossover frequencies Wcg and Wcp, given the SISO open-loop model sys. This function handles both continuous- and discrete-time cases. When faced with several crossover frequencies, margin returns the smallest gain and phase margins. [Gm,Pm,Wcg,Wcp] = margin(mag,phase,w) derives the gain and phase margins from the Bode frequency response data (magnitude, phase, and frequency vector). Interpolation is performed between the frequency points to estimate the margin values. This approach is generally less accurate. When invoked without left-hand argument, margin(sys) plots the open-loop Bode response with the gain and phase margins marked by vertical lines. 11-137 margin Example You can compute the gain and phase margins of the open-loop discrete-time transfer function. Type hd = tf([0.04798 0.0464],[1 –1.81 0.9048],0.1) MATLAB responds with Transfer function: 0.04798 z + 0.0464 --------------------z^2 – 1.81 z + 0.9048 Sampling time: 0.1 Type [Gm,Pm,Wcg,Wcp] = margin(hd); [Gm,Pm,Wcg,Wcp] and MATLAB returns ans = 2.0517 11-138 13.5712 5.4374 4.3544 margin You can also display these margins graphically. margin(hd) Bode Diagrams Gm=6.3 dB (Wcg=5.4); Pm=13.6 deg. (Wcp=4.4) 50 Phase (deg); Magnitude (dB) 0 −50 −100 0 −50 −100 −150 −200 −250 −300 0 10 1 10 2 10 Frequency (rad/sec) Algorithm The phase margin is computed using H ∞ theory, and the gain margin by solving H ( jω ) = H ( jω ) for the frequency ω . See Also bode ltiview Bode frequency response LTI system viewer 11-139 minreal Purpose 11minreal Minimal realization or pole-zero cancellation Syntax sysr = minreal(sys) sysr = minreal(sys,tol) Description sysr = minreal(sys) eliminates uncontrollable or unobservable state in state-space models, or cancels pole-zero pairs in transfer functions or zero-pole-gain models. The output sysr has minimal order and the same response characteristics as the original model sys. sysr = minreal(sys,tol) specifies the tolerance used for state elimination or pole-zero cancellation. The default value is tol = sqrt(eps) and increasing this tolerance forces additional cancellations. Example The commands g = zpk([],1,1) h = tf([2 1],[1 0]) cloop = inv(1+g*h) * g produce the nonminimal zero-pole-gain model by typing cloop. Zero/pole/gain: s (s–1) ------------------(s–1) (s^2 + s + 1) To cancel the pole-zero pair at s = 1 , type cloop = minreal(cloop) and MATLAB returns Zero/pole/gain: s ------------(s^2 + s + 1) Algorithm 11-140 Pole-zero cancellation is a straightforward search through the poles and zeros looking for matches that are within tolerance. Transfer functions are first converted to zero-pole-gain form. minreal See Also balreal modred sminreal Gramian-based input/output balancing Model order reduction Structured model reduction 11-141 modred Purpose 11modred Model order reduction Syntax rsys = modred(sys,elim) rsys = modred(sys,elim,'mdc') rsys = modred(sys,elim,'del') Description modred reduces the order of a continuous or discrete state-space model sys. This function is usually used in conjunction with balreal. Two order reduction techniques are available: • rsys = modred(sys,elim) or rsys = modred(sys,elim,'mdc') produces a reduced-order model rsys with matching DC gain (or equivalently, matching steady state in the step response). The index vector elim specifies the states to be eliminated. The resulting model rsys has length(elim) fewer states. This technique consists of setting the derivative of the eliminated states to zero and solving for the remaining states. • rsys = modred(sys,elim,'del')simply deletes the states specified by elim. While this method does not guarantee matching DC gains, it tends to produce better approximations in the frequency domain (see example below). If the state-space model sys has been balanced with balreal and the gramians have m small diagonal entries, you can reduce the model order by eliminating the last m states with modred. Example Consider the continuous fourth-order model 3 2 s + 11s + 36s + 26 h ( s ) = ----------------------------------------------------------------------------------------------------3 4 2 s + 14.6 s + 74.96s + 153.7s + 99.65 To reduce its order, first compute a balanced state-space realization with balreal by typing h = tf([1 11 36 26],[1 14.6 74.96 153.7 99.65]) [hb,g] = balreal(h) g' MATLAB returns ans = 1.3938e–01 11-142 9.5482e–03 6.2712e–04 7.3245e–06 modred The last three diagonal entries of the balanced gramians are small, so eliminate the last three states with modred using both matched DC gain and direct deletion methods. hmdc = modred(hb,2:4,'mdc') hdel = modred(hb,2:4,'del') Both hmdc and hdel are first-order models. Compare their Bode responses against that of the original model h ( s ) . bode(h,'-',hmdc,'x',hdel,'*') Bode Diagrams 0 −20 Phase (deg); Magnitude (dB) −40 −60 −80 0 −50 −100 −150 −200 −1 10 0 10 1 10 2 10 3 10 Frequency (rad/sec) 11-143 modred The reduced-order model hdel is clearly a better frequency-domain approximation of h ( s ) . Now compare the step responses. step(h,'-',hmdc,'-.',hdel,'--') Step Response 0.3 0.25 Amplitude 0.2 0.15 0.1 0.05 0 −0.05 0 0.5 1 1.5 2 2.5 3 Time (sec.) While hdel accurately reflects the transient behavior, only hmdc gives the true steady-state response. Algorithm The algorithm for the matched DC gain method is as follows. For continuous-time models · x = Ax + Bu y = Cx + Du the state vector is partitioned into x 1 , to be kept, and x 2 , to be eliminated. 11-144 modred · A 11 A 12 x 1 B x1 = + 1 u · A 21 A 22 x 2 B2 x2 y = C 1 C 2 x + Du Next, the derivative of x 2 is set to zero and the resulting equation is solved for x 1 . The reduced-order model is given by –1 –1 · x 1 = [ A 11 – A 12 A 22 A 21 ]x1 + [ B 1 – A 12 A 22 B 2 ]u –1 –1 y = [ C 1 – C 2 A 22 A 21 ]x + [ D – C 2 A 22 B 2 ]u The discrete-time case is treated similarly by setting x2 [ n + 1 ] = x 2 [ n ] Limitations With the matched DC gain method, A 22 must be invertible in continuous time, and I – A 22 must be invertible in discrete time. See Also balreal minreal Input/output balancing of state-space models Minimal state-space realizations 11-145 ndims Purpose 11ndims Provide the number of the dimensions of an LTI model or LTI array Syntax n = ndims(sys) Description n = ndims(sys) is the number of dimensions of an LTI model or an array of LTI models sys. A single LTI model has two dimensions (one for outputs, and one for inputs). An LTI array has 2+p dimensions, where p ≥ 2 is the number of array dimensions. For example, a 2-by-3-by-4 array of models has 2+3=5 dimensions. ndims(sys) = length(size(sys)) Example sys = rss(3,1,1,3); ndims(sys) ans = 4 ndims returns 4 for this 3-by-1 array of SISO models. See Also 11-146 size Returns a vector containing the lengths of the dimensions of an LTI array or model ngrid Purpose 11ngrid Superimpose a Nichols chart on a Nichols plot Syntax ngrid Description ngrid superimposes Nichols chart grid lines over the Nichols frequency response of a SISO LTI system. The range of the Nichols grid lines is set to encompass the entire Nichols frequency response. The chart relates the complex number H ⁄ ( 1 + H ) to H , where H is any complex number. For SISO systems, when H is a point on the open-loop frequency response, then H -------------1+H is the corresponding value of the closed-loop frequency response assuming unit negative feedback. If the current axis is empty, ngrid generates a new Nichols chart grid in the region –40 dB to 40 dB in magnitude and –360 degrees to 0 degrees in phase. If the current axis does not contain a SISO Nichols frequency response, ngrid returns a warning. Example Plot the Nichols response with Nichols grid lines for the system. 4 3 2 – 4s + 48s – 18s + 250s + 600 H ( s ) = -------------------------------------------------------------------------------------4 3 2 s + 30s + 282s + 525s + 60 Type H = tf([–4 48 –18 250 600],[1 30 282 525 60]) MATLAB returns Transfer function: – 4 s^4 + 48 s^3 – 18 s^2 + 250 s + 600 --------------------------------------s^4 + 30 s^3 + 282 s^2 + 525 s + 60 11-147 ngrid Type nichols(H) ngrid Nichols Charts 40 0 dB 30 0.25 dB 0.5 dB Open−Loop Gain (dB) 20 1 dB −1 dB 3 dB 10 −3 dB 6 dB −6 dB 0 −10 −12 dB −20 −20 dB −30 −40 −500 −450 −400 −350 −300 −250 −200 Open−Loop Phase (deg) See Also 11-148 nichols Nichols plots −150 −100 −50 −40 dB nichols Purpose Syntax 11nichols Compute Nichols frequency response of LTI models nichols(sys) nichols(sys,w) nichols(sys1,sys2,...,sysN) nichols(sys1,sys2,...,sysN,w) nichols(sys1,'PlotStyle1',...,sysN,'PlotStyleN') [mag,phase,w] = nichols(sys) [mag,phase] = nichols(sys,w) Description nichols computes the frequency response of an LTI model and plots it in the Nichols coordinates. Nichols plots are useful to analyze open- and closed-loop properties of SISO systems, but offer little insight into MIMO control loops. Use ngrid to superimpose a Nichols chart on an existing SISO Nichols plot. nichols(sys) produces a Nichols plot of the LTI model sys. This model can be continuous or discrete, SISO or MIMO. In the MIMO case, nichols produces an array of Nichols plots, each plot showing the response of one particular I/O channel. The frequency range and gridding are determined automatically based on the system poles and zeros. nichols(sys,w) explicitly specifies the frequency range or frequency points to be used for the plot. To focus on a particular frequency interval [wmin,wmax], set w = {wmin,wmax}. To use particular frequency points, set w to the vector of desired frequencies. Use logspace to generate logarithmically spaced frequency vectors. Frequencies should be specified in radians/sec. nichols(sys1,sys2,...,sysN) or nichols(sys1,sys2,...,sysN,w) superimposes the Nichols plots of several LTI models on a single figure. All systems must have the same number of inputs and outputs, but may otherwise be a mix of continuous- and discrete-time systems. You can also specify a distinctive color, linestyle, and/or marker for each system plot with the syntax nichols(sys1,'PlotStyle1',...,sysN,'PlotStyleN') See bode for an example. 11-149 nichols When invoked with left-hand arguments, [mag,phase,w] = nichols(sys) [mag,phase] = nichols(sys,w) return the magnitude and phase (in degrees) of the frequency response at the frequencies w (in rad/sec). The outputs mag and phase are 3-D arrays similar to those produced by bode (see bode on page 11-19). They have dimensions ( number of outputs ) × ( number of inputs ) × ( length of w ) Remark If sys is an FRD model, nichols(sys,w), w can only include frequencies in sys.frequency. Example Plot the Nichols response of the system 4 3 2 – 4s + 48s – 18s + 250s + 600 H ( s ) = -------------------------------------------------------------------------------------4 3 2 s + 30s + 282s + 525s + 60 num = [–4 48 –18 250 600]; den = [1 30 282 525 60]; H = tf(num,den) nichols(H); ngrid 11-150 nichols Nichols Charts 40 0 dB 30 0.25 dB 0.5 dB Open−Loop Gain (dB) 20 1 dB −1 dB 3 dB 10 −3 dB 6 dB −6 dB 0 −10 −12 dB −20 −20 dB −30 −40 −500 −450 −400 −350 −300 −250 −200 −150 −100 −50 −40 dB Open−Loop Phase (deg) Algorithm See bode. See Also bode evalfr freqresp ltiview ngrid nyquist sigma Bode plot Response at single complex frequency Frequency response computation LTI system viewer Grid on Nichols plot Nyquist plot Singular value plot 11-151 norm Purpose Syntax 11norm Compute LTI model norms norm(sys) norm(sys,2) norm(sys,inf) norm(sys,inf,tol) [ninf,fpeak] = norm(sys) Description norm computes the H 2 or L ∞ norm of a continuous- or discrete-time LTI model. H2 Norm The H 2 norm of a stable continuous system with transfer function H ( s ) , is the root-mean-square of its impulse response, or equivalently H 2 1 -----2π = ∞ ∫–∞ Trace ( H ( jω ) H H ( jω ) ) dω This norm measures the steady-state covariance (or power) of the output response y = Hw to unit white noise inputs w . H 2 2 T = lim E { y ( t ) y ( t ) } , t→∞ T E ( w ( t )w ( τ ) ) = δ ( t – τ )I Infinity Norm The infinity norm is the peak gain of the frequency response, that is, H(s) ∞ = max H ( jω ) ω (SISO case) H(s) ∞ = max σ max ( H ( jω ) ) ω (MIMO case) where σ max ( . ) denotes the largest singular value of a matrix. 11-152 norm The discrete-time counterpart is H(z ) Usage ∞ = jθ max σ max ( H ( e ) ) θ ∈ [ 0, π ] norm(sys) or norm(sys,2) both return the H 2 norm of the TF, SS, or ZPK model sys. This norm is infinite in the following cases: • sys is unstable. • sys is continuous and has a nonzero feedthrough (that is, nonzero gain at the frequency ω = ∞ ). Note that norm(sys) produces the same result as sqrt(trace(covar(sys,1))) norm(sys,inf) computes the infinity norm of any type of LTI model sys. This norm is infinite if sys has poles on the imaginary axis in continuous time, or on the unit circle in discrete time. norm(sys,inf,tol) sets the desired relative accuracy on the computed infinity norm (the default value is tol=1e–2). [ninf,fpeak] = norm(sys,inf) also returns the frequency fpeak where the gain achieves its peak value. Example Consider the discrete-time transfer function 3 2 z – 2.841z + 2.875z – 1.004 H ( z ) = -------------------------------------------------------------------------------3 2 z – 2.417z + 2.003z – 0.5488 with sample time 0.1 second. Compute its H 2 norm by typing H = tf([1 –2.841 2.875 –1.004],[1 –2.417 2.003 –0.5488],0.1) norm(H) ans = 1.2438 11-153 norm Compute its infinity norm by typing [ninf,fpeak] = norm(H,inf) ninf = 2.5488 fpeak = 3.0844 These values are confirmed by the Bode plot of H ( z ) . bode(H) Bode Diagrams 10 Phase (deg); Magnitude (dB) 5 0 −5 200 100 0 −100 −200 −300 −400 −1 10 0 1 10 10 2 10 Frequency (rad/sec) The gain indeed peaks at approximately 3 rad/sec and its peak value in dB is found by typing 20*log10(ninf) 11-154 norm MATLAB returns ans = 8.1268 Algorithm norm uses the same algorithm as covar for the H 2 norm, and the algorithm of [1] for the infinity norm. sys is first converted to state space. See Also bode freqresp sigma References Bode plot Frequency response computation Singular value plot [1] Bruisma, N.A. and M. Steinbuch, “A Fast Algorithm to Compute the H ∞ -Norm of a Transfer Function Matrix,” System Control Letters, 14 (1990), pp. 287–293. 11-155 nyquist Purpose Syntax 11nyquist Compute Nyquist frequency response of LTI models nyquist(sys) nyquist(sys,w) nyquist(sys1,sys2,...,sysN) nyquist(sys1,sys2,...,sysN,w) nyquist(sys1,'PlotStyle1',...,sysN,'PlotStyleN') [re,im,w] = nyquist(sys) [re,im] = nyquist(sys,w) Description nyquist calculates the Nyquist frequency response of LTI models. When invoked without left-hand arguments, nyquist produces a Nyquist plot on the screen. Nyquist plots are used to analyze system properties including gain margin, phase margin, and stability. nyquist(sys) plots the Nyquist response of an arbitrary LTI model sys. This model can be continuous or discrete, and SISO or MIMO. In the MIMO case, nyquist produces an array of Nyquist plots, each plot showing the response of one particular I/O channel. The frequency points are chosen automatically based on the system poles and zeros. nyquist(sys,w) explicitly specifies the frequency range or frequency points to be used for the plot. To focus on a particular frequency interval [wmin,wmax], set w = {wmin,wmax}. To use particular frequency points, set w to the vector of desired frequencies. Use logspace to generate logarithmically spaced frequency vectors. Frequencies should be specified in rad/sec. nyquist(sys1,sys2,...,sysN) or nyquist(sys1,sys2,...,sysN,w) superimposes the Nyquist plots of several LTI models on a single figure. All systems must have the same number of inputs and outputs, but may otherwise be a mix of continuous- and discrete-time systems. You can also specify a distinctive color, linestyle, and/or marker for each system plot with the syntax nyquist(sys1,'PlotStyle1',...,sysN,'PlotStyleN') See bode for an example. 11-156 nyquist When invoked with left-hand arguments [re,im,w] = nyquist(sys) [re,im] = nyquist(sys,w) return the real and imaginary parts of the frequency response at the frequencies w (in rad/sec). re and im are 3-D arrays with the frequency as last dimension (see “Arguments” below for details). Remark If sys is an FRD model, nyquist(sys,w), w can only include frequencies in sys.frequency. Arguments The output arguments re and im are 3-D arrays with dimensions ( number of outputs ) × ( number of inputs ) × ( length of w ) For SISO systems, the scalars re(1,1,k) and im(1,1,k) are the real and imaginary parts of the response at the frequency ω k = w(k). re(1,1,k) = Re ( h ( jω k ) ) im(1,1,k) = Im ( h ( jω k ) ) For MIMO systems with transfer function H ( s ) , re(:,:,k) and im(:,:,k) give the real and imaginary parts of H ( jω k ) (both arrays with as many rows as outputs and as many columns as inputs). Thus, re(i,j,k) = Re ( h ij ( jω k ) ) im(i,j,k) = Im ( h ij ( jω k ) ) where h ij is the transfer function from input j to output i . Example Plot the Nyquist response of the system 11-157 nyquist 2 2s + 5s + 1 H ( s ) = -----------------------------2 s + 2s + 3 H = tf([2 5 1],[1 2 3]) nyquist(H) Nyquist Diagrams 2 1.5 1 Imaginary Axis 0.5 0 −0.5 −1 −1.5 −2 −1 −0.5 0 0.5 1 1.5 2 Real Axis See Also 11-158 bode evalfr freqresp ltiview nichols sigma Bode plot Response at single complex frequency Frequency response computation LTI system viewer Nichols plot Singular value plot 2.5 3 obsv Purpose 11obsv Form the observability matrix Syntax Ob = obsv(A,B) Ob = obsv(sys) Description obsv computes the observability matrix for state-space systems. For an n-by-n matrix A and a p-by-n matrix C, obsv(A,C) returns the observability matrix C CA Ob = CA : CA 2 n–1 with n columns and np rows. Ob = obsv(sys) calculates the observability matrix of the state-space model sys. This syntax is equivalent to executing Ob = obsv(sys.A,sys.C) The model is observable if Ob has full rank n. Example Determine if the pair A = 1 4 1 –2 1 0 0 1 C = is observable. Type Ob = obsv(A,C); % Number of unobservable states unob = length(A)–rank(Ob) 11-159 obsv MATLAB responds with unob = 0 See Also 11-160 obsvf Compute the observability staircase form obsvf Purpose 11obsvf Compute the observability staircase form Syntax [Abar,Bbar,Cbar,T,k] = obsvf(A,B,C) [Abar,Bbar,Cbar,T,k] = obsvf(A,B,C,tol) Description If the observability matrix of (A,C) has rank r ≤ n , where n is the size of A, then there exists a similarity transformation such that T A = TAT , B = TB, C = CT T where T is unitary and the transformed system has a staircase form with the unobservable modes, if any, in the upper left corner. A = A no A 12 0 Ao , B = B no Bo , C = 0 Co where ( C o, A o ) is observable, and the eigenvalues of A no are the unobservable modes. [Abar,Bbar,Cbar,T,k] = obsvf(A,B,C) decomposes the state-space system with matrices A, B, and C into the observability staircase form Abar, Bbar, and Cbar, as described above. T is the similarity transformation matrix and k is a vector of length n, where n is the number of states in A. Each entry of k represents the number of observable states factored out during each step of the transformation matrix calculation [1]. The number of nonzero elements in k indicates how many iterations were necessary to calculate T, and sum(k) is the number of states in A o , the observable portion of Abar. obsvf(A,B,C,tol) uses the tolerance tol when calculating the observable/ unobservable subspaces. When the tolerance is not specified, it defaults to 10*n*norm(a,1)*eps. 11-161 obsvf Example Form the observability staircase form of A = 1 4 1 –2 1 1 –1 –1 1 0 0 1 B = C = by typing [Abar,Bbar,Cbar,T,k] = obsvf(A,B,C) Abar = 1 4 Bbar = 1 1 Cbar = 1 0 T = 1 0 k = 2 1 –2 1 –1 0 1 0 1 0 Algorithm obsvf is an M-file that implements the Staircase Algorithm of [1] by calling ctrbf and using duality. See Also ctrbf obsv References 11-162 Compute the controllability staircase form Calculate the observability matrix [1] Rosenbrock, M.M., State-Space and Multivariable Theory, John Wiley, 1970. ord2 Purpose Syntax Description 11ord2 Generate continuous second-order systems [A,B,C,D] = ord2(wn,z) [num,den] = ord2(wn,z) [A,B,C,D] = ord2(wn,z) generates the state-space description (A,B,C,D) of the second-order system 1 h ( s ) = --------------------------------------------2 2 s + 2ζω n s + ω n given the natural frequency wn ( ω n ) and damping factor z ( ζ ). Use ss to turn this description into a state-space object. [num,den] = ord2(wn,z) returns the numerator and denominator of the second-order transfer function. Use tf to form the corresponding transfer function object. Example To generate an LTI model of the second-order transfer function with damping factor ζ = 0.4 and natural frequency ω n = 2.4 rad/sec. , type [num,den] = ord2(2.4,0.4) num = 1 den = 1.0000 1.9200 5.7600 sys = tf(num,den) Transfer function: 1 ------------------s^2 + 1.92 s + 5.76 See Also rmodel, rss ss tf Generate random stable continuous models Create a state-space LTI model Create a transfer function LTI model 11-163 pade Purpose Syntax 11pade Compute the Padé approximation of models with time delays [num,den] = pade(T,N) pade(T,N) sysx = pade(sys,N) sysx = pade(sys,NI,NO,Nio) Description pade approximates time delays by rational LTI models. Such approximations are useful to model time delay effects such as transport and computation delays within the context of continuous-time systems. The Laplace transform of an time delay of T seconds is exp ( – sT ) . This exponential transfer function is approximated by a rational transfer function using the Padé approximation formulas [1]. [num,den] = pade(T,N) returns the Nth-order (diagonal) Padé approximation of the continuous-time I/O delay exp ( – sT ) in transfer function form. The row vectors num and den contain the numerator and denominator coefficients in descending powers of s . Both are Nth-order polynomials. When invoked without output arguments, pade(T,N) plots the step and phase responses of the Nth-order Padé approximation and compares them with the exact responses of the model with I/O delay T. Note that the Padé approximation has unit gain at all frequencies. sysx = pade(sys,N) produces a delay-free approximation sysx of the continuous delay system sys. All delays are replaced by their Nth-order Padé approximation. See “Time Delays” on page 2-45 for details on LTI models with delays. 11-164 pade sysx = pade(sys,NI,NO,Nio) specifies independent approximation orders for each input, output, and I/O delay. These approximation orders are given by the arrays of integers NI, NO, and Nio, such that: • NI(j) is the approximation order for the j-th input channel. • NO(i) is the approximation order for the i-th output channel. • Nio(i,j) is the approximation order for the I/O delay from input j to output i. You can use scalar values to specify uniform approximation orders, and [] if there are no input, output, or I/O delays. 11-165 pade Example Compute a third-order Padé approximation of a 0.1 second I/O delay and compare the time and frequency responses of the true delay and its approximation. To do this, type pade(0.1,3) Step response of 3rd−order Pade approximation 1.5 Amplitude 1 0.5 0 −0.5 −1 0 0.02 0.04 0.06 0.08 0.1 0.12 Time (secs) 0.14 0.16 0.18 0.2 Phase response 0 Phase (deg.) −200 −400 −600 −800 −1000 1 10 2 10 Frequency (rad/s) Limitations High-order Padé approximations produce transfer functions with clustered poles. Because such pole configurations tend to be very sensitive to perturbations, Padé approximations with order N>10 should be avoided. See Also c2d delay2z 11-166 3 10 Discretization of continuous system Changes transfer functions of discrete-time LTI models with delays to rational functions or absorbs FRD delays into the frequency response phase information pade References [1] Golub, G. H. and C. F. Van Loan, Matrix Computations, Johns Hopkins University Press, Baltimore, 1989, pp. 557–558. 11-167 parallel Purpose 11parallel Parallel connection of two LTI models Syntax sys = parallel(sys1,sys2) sys = parallel(sys1,sys2,inp1,inp2,out1,out2) Description parallel connects two LTI models in parallel. This function accepts any type of LTI model. The two systems must be either both continuous or both discrete with identical sample time. Static gains are neutral and can be specified as regular matrices. sys = parallel(sys1,sys2) forms the basic parallel connection shown below. sys sys1 + u y + sys2 This command is equivalent to the direct addition sys = sys1 + sys2 (See “Addition and Subtraction” on page 3-11 for details on LTI system addition.) 11-168 parallel sys = parallel(sys1,sys2,inp1,inp2,out1,out2) forms the more general parallel connection. sys v1 y1 u1 + + u u2 v2 z1 sys1 sys2 y y2 z2 The index vectors inp1 and inp2 specify which inputs u 1 of sys1 and which inputs u 2 of sys2 are connected. Similarly, the index vectors out1 and out2 specify which outputs y 1 of sys1 and which outputs y 2 of sys2 are summed. The resulting model sys has [ v 1 ; u ; v 2 ] as inputs and [ z 1 ; y ; z 2 ] as outputs. Example See “Steady-State Design” on page 9-51 for an example. See Also append feedback series Append LTI systems Feedback connection Series connection 11-169 place Purpose 11place Pole placement design Syntax K = place(A,B,p) [K,prec,message] = place(A,B,p) Description Given the single- or multi-input system · x = Ax + Bu and a vector p of desired self-conjugate closed-loop pole locations, place computes a gain matrix K such that the state feedback u = – Kx places the closed-loop poles at the locations p. In other words, the eigenvalues of A – BK match the entries of p (up to the ordering). K = place(A,B,p) computes a feedback gain matrix K that achieves the desired closed-loop pole locations p, assuming all the inputs of the plant are control inputs. The length of p must match the row size of A. place works for multi-input systems and is based on the algorithm from [1]. This algorithm uses the extra degrees of freedom to find a solution that minimizes the sensitivity of the closed-loop poles to perturbations in A or B . [K,prec,message] = place(A,B,p) also returns prec, an estimate of how closely the eigenvalues of A – BK match the specified locations p (prec measures the number of accurate decimal digits in the actual closed-loop poles). If some nonzero closed-loop pole is more than 10% off from the desired location, message contains a warning message. You can also use place for estimator gain selection by transposing the A matrix and substituting C' for B. l = place(A',C',p).' Example Consider a state-space system (a,b,c,d) with two inputs, three outputs, and three states. You can compute the feedback gain matrix needed to place the closed-loop poles at p = [1.1 23 5.0] by p = [1 1.23 5.0]; K = place(a,b,p) 11-170 place Algorithm place uses the algorithm of [1] which, for multi-input systems, optimizes the choice of eigenvectors for a robust solution. We recommend place rather than acker even for single-input systems. In high-order problems, some choices of pole locations result in very large gains. The sensitivity problems attached with large gains suggest caution in the use of pole placement techniques. See [2] for results from numerical testing. See Also References acker lqr rlocus, rlocfind Pole placement using Ackermann’s formula State-feedback LQ regulator design Root locus design [1] Kautsky, J. and N.K. Nichols, “Robust Pole Assignment in Linear State Feedback,” Int. J. Control, 41 (1985), pp. 1129–1155. [2] Laub, A.J. and M. Wette, Algorithms and Software for Pole Assignment and Observers, UCRL-15646 Rev. 1, EE Dept., Univ. of Calif., Santa Barbara, CA, Sept. 1984. 11-171 pole Purpose 11pole Compute the poles of an LTI system Syntax p = pole(sys) Description pole computes the poles p of the SISO or MIMO LTI model sys. Algorithm For state-space models, the poles are the eigenvalues of the A matrix, or the generalized eigenvalues of A – λE in the descriptor case. For SISO transfer functions or zero-pole-gain models, the poles are simply the denominator roots (see roots). For MIMO transfer functions (or zero-pole-gain models), the poles are computed as the union of the poles for each SISO entry. If some columns or rows have a common denominator, the roots of this denominator are counted only once. Limitations Multiple poles are numerically sensitive and cannot be computed to high accuracy. A pole λ with multiplicity m typically gives rise to a cluster of computed poles distributed on a circle with center λ and radius of order ρ ≈ eps See Also 11-172 1⁄m damp esort, dsort pzmap zero Damping and natural frequency of system poles Sort system poles Pole-zero map Compute (transmission) zeros pzmap Purpose 11pzmap Compute the pole-zero map of an LTI model Syntax pzmap(sys) [p,z] = pzmap(sys) Description pzmap(sys) plots the pole-zero map of the continuous- or discrete-time LTI model sys. For SISO systems, pzmap plots the transfer function poles and zeros. For MIMO systems, it plots the system poles and transmission zeros. The poles are plotted as x’s and the zeros are plotted as o’s. When invoked without left-hand arguments, [p,z] = pzmap(sys) returns the system poles and (transmission) zeros in the column vectors p and z. No plot is drawn on the screen. You can use the functions sgrid or zgrid to plot lines of constant damping ratio and natural frequency in the s - or z -plane. 11-173 pzmap Example Plot the poles and zeros of the continuous-time system. 2 2s + 5s + 1 H ( s ) = -----------------------------2 s + 2s + 3 H = tf([2 5 1],[1 2 3]) pzmap(H) Pole−zero map 1.5 1 Imag Axis 0.5 0 −0.5 −1 −1.5 −2.5 −2 −1.5 −1 −0.5 Real Axis Algorithm pzmap uses a combination of pole and zero. See Also damp esort, dsort pole rlocus 11-174 Damping and natural frequency of system poles Sort system poles Compute system poles Root locus 0 pzmap sgrid, zgrid zero Plot lines of constant damping and natural frequency Compute system (transmission) zeros 11-175 reg Purpose 11reg Form regulator given state-feedback and estimator gains Syntax rsys = reg(sys,K,L) rsys = reg(sys,K,L,sensors,known,controls) Description rsys = reg(sys,K,L) forms a dynamic regulator or compensator rsys given a state-space model sys of the plant, a state-feedback gain matrix K, and an estimator gain matrix L. The gains K and L are typically designed using pole placement or LQG techniques. The function reg handles both continuous- and discrete-time cases. This syntax assumes that all inputs of sys are controls, and all outputs are measured. The regulator rsys is obtained by connecting the state-feedback law u = – K x and the state estimator with gain matrix L (see estim). For a plant with equations · x = Ax + Bu y = Cx + Du this yields the regulator · xˆ = A – LC – ( B – LD )K xˆ + Ly u = – Kxˆ 11-176 reg This regulator should be connected to the plant using positive feedback. Plant y u u State Estimator –K xˆ y Regulator rsys = reg(sys,K,L,sensors,known,controls) handles more general regulation problems where: • The plant inputs consist of controls u , known inputs u d , and stochastic inputs w . • Only a subset y of the plant outputs is measured. The index vectors sensors, known, and controls specify y , u d , and u as subsets of the outputs and inputs of sys. The resulting regulator uses [ u d ; y ] as inputs to generate the commands u (see figure below). u u d (known) y (sensors) Estimator –K (gain L) u xˆ Regulator rsys 11-177 reg Example Given a continuous-time state-space model sys = ss(A,B,C,D) with seven outputs and four inputs, suppose you have designed: • A state-feedback controller gain K using inputs 1, 2, and 4 of the plant as control inputs • A state estimator with gain L using outputs 4, 7, and 1 of the plant as sensors, and input 3 of the plant as an additional known input You can then connect the controller and estimator and form the complete regulation system by controls = [1,2,4]; sensors = [4,7,1]; known = [3]; regulator = reg(sys,K,L,sensors,known,controls) See Also 11-178 estim kalman lqgreg lqr, dlqr place Form state estimator given estimator gain Kalman estimator design Form LQG regulator State-feedback LQ regulator Pole placement reshape Purpose 11reshape Change the shape of an LTI array Syntax sys = reshape(sys,s1,s2,...,sk) sys = reshape(sys,[s1 s2 ... sk]) Description sys = reshape(sys,s1,s2,...,sk) (or, equivalently, sys = reshape(sys,[s1 s2 ... sk])) reshapes the LTI array sys into an s1-by-s2-by...-sk array of LTI models. Equivalently, sys = reshape(sys,[s1 s2 ... sk]) reshapes the LTI array sys into an s1-by-s2-by...-sk array of LTI models. With either syntax, there must be s1*s2*...*sk models in sys to begin with. Example sys = rss(4,1,1,2,3); size(sys) 2x3 array of state-space models Each model has 1 output, 1 input, and 4 states. sys1 = reshape(sys,6); size(sys1) 6x1 array of state-space models Each model has 1 output, 1 input, and 4 states. See Also ndims size Provide the number of dimensions of an LTI array Provide the lengths of each dimension of an LTI array 11-179 rlocfind Purpose 11rlocfind Select feedback gain from root locus plot Syntax [k,poles] = rlocfind(sys) [k,poles] = rlocfind(sys,p) Description rlocfind returns the feedback gain associated with a particular set of poles on the root locus. rlocfind works with both continuous- and discrete-time SISO systems. [k,poles] = rlocfind(sys) is used for interactive gain selection from the root locus plot of the SISO system sys generated by rlocus. The function rlocfind puts up a crosshair cursor on the root locus plot that you use to select a particular pole location. The root locus gain associated with this point is returned in k and the column vector poles contains the closed-loop poles for this gain. To use this command, the root locus of the SISO open-loop model sys must be present in the current figure window. [k,poles] = rlocfind(sys,p) takes a vector p of desired root locations and computes a root locus gain for each of these locations (that is, a gain for which one of the closed-loop roots is near the desired location). The jth entry of the vector k gives the computed gain for the pole location p(j), and the jth column of the matrix poles lists the resulting closed-loop poles. Example Determine a feedback gain such that the closed-loop poles of the system 2 2s + 5s + 1 h ( s ) = -----------------------------2 s + 2s + 3 have damping ratio ζ = 0.707. h = tf([2 5 1],[1 2 3]); rlocus(h) % Plot the root locus k = rlocfind(h) Algorithm % Select pole with ζ=.707 graphically [k,poles] = rlocfind(sys,p) calculates the gain k from the following formula. k = abs(d(p)/n(p)) 11-180 rlocfind where p is the complex point you supply as an input argument to rlocfind (or where you point to with the mouse), and n and d are respectively the numerator and denominator polynomials of the transfer function associated with sys. The poles associated with the gain k are then computed as poles = roots(k*n(s) + d(s)) Limitations rlocfind assumes that a root locus is in the current figure window when this function is called without second input argument. See Also rlocus rltool References [1] Ogota, K., Modern Control Engineering, Prentice Hall, 1970. Plot root locus Root Locus Design GUI 11-181 rlocus Purpose Syntax 11rlocus Evans root locus rlocus(sys) rlocus(sys,k) [r,k] = rlocus(sys) r = rlocus(sys,k) Description rlocus computes the Evans root locus of a SISO open-loop model. The root locus gives the closed-loop pole trajectories as a function of the feedback gain k (assuming negative feedback). Root loci are used to study the effects of varying feedback gains on closed-loop pole locations. In turn, these locations provide indirect information on the time and frequency responses. rlocus(sys) calculates and plots the root locus of the open-loop SISO model sys. This function can be applied to any of the following negative feedback loops by setting sys appropriately. + + G G – – k k sys = F * G sys = G + C G – k sys = G * C If sys has transfer function n(s) h ( s ) = ----------d(s) 11-182 F rlocus the closed-loop poles are the roots of d( s ) + k n( s ) = 0 rlocus adaptively selects a set of positive gains k to produce a smooth plot. Alternatively, rlocus(sys,k) uses the user-specified vector k of gains to plot the root locus. When invoked with output arguments, [r,k] = rlocus(sys) r = rlocus(sys,k) return the vector k of selected gains and the complex root locations r for these gains. The matrix r has length(k) columns and its jth column lists the closed-loop roots for the gain k(j). Example Find and plot the root-locus of the following system. 11-183 rlocus 2 2s + 5s + 1 h ( s ) = -----------------------------2 s + 2s + 3 h = tf([2 5 1],[1 2 3]); rlocus(h) 1.5 1 Imag Axis 0.5 0 −0.5 −1 −1.5 −3 −2.5 −2 −1.5 −1 Real Axis −0.5 0 0.5 1 For examples, see “Root Locus Design” on page 9-9 and “Hard-Disk Read/Write Head Controller” on page 9-20. See Also 11-184 rlocfind rltool pole pzmap Select gain from root locus plot Root Locus Design GUI System poles Pole-zero map rltool Purpose 11rltool Initialize the Root Locus Design GUI Syntax rltool rltool(sys) rltool(sys,comp) rltool(sys,comp,LocationFlag,FeedbackSign) Description When invoked without input arguments, rltool initializes a new Root Locus Design GUI for interactive compensator design. This GUI allows you to design a single-input/single-output (SISO) compensator using root locus techniques. 11-185 rltool The Root Locus Design GUI looks like this. These are the main menus for importing/exporting of models, and editing them. You can also perform discrete/ continuous conversion. Compensator description: The default compensator is K=1. Root locus toolbar buttons to drag, add, or erase compensator poles and zeros, or to drag the closed-loop poles Plot region to display the root locus The feedback structure: Click on K to view/change the compensator, and on P, F, or H to view the design model characteristics. Toggle between positive/negative feedback. Edit the gain set point to change the closed-loop pole locations. Save/retrieve root locus axes limits and aspect ratios. Zoom into or out of the root locus plot. Status bar for providing information 11-186 Click on these boxes to open system response analysis tools. rltool This tool can be applied to SISO LTI systems whose feedback structure is in one of the following two configurations. In either configuration, F is a pre-filter, P is the plant model, H is the sensor dynamics, and K is the compensator to be designed. In terms of the GUI design procedure, once you specify them, F, P, and H are fixed in the feedback structure. This triple, along with the feedback structure, is called the design model. A design model can be constructed for the GUI by selecting the Import Model menu item from the File menu of the Root Locus Design GUI. Once you select the item, the Import Design Model window opens. You can then import SISO LTI models that have been created with ss, tf, or zpk in your workspace or on your disk (or SISO LTI blocks contained in open or saved Simulink models) into F, P, and H. Otherwise, you can specify your design model by defining F, P, and H manually with LTI models created using ss, tf, or zpk in the text boxes provided on the Import Design Model window. If sys is any SISO LTI object (created with ss, tf, or zpk) that exists in the MATLAB workspace, rltool(sys) initializes a Root Locus Design GUI, by setting the plant model P to sys. rltool(sys,comp) also initializes a Root Locus Design GUI for the plant model sys. In addition, the root locus compensator is initialized to comp, where comp is any SISO LTI object that exists in the MATLAB workspace. When either the plant, or both the plant and the compensator are provided as arguments to rltool, the root locus of the closed-loop poles and their locations for the current compensator gain are drawn on the Root Locus Design GUI. The closed-loop model is generated by placing the compensator (comp) and plant 11-187 rltool model (sys) in the forward loop of a negative unity feedback system, as shown in the diagram below. u comp sys y +_ In this case, F and H are taken to be 1, while P is sys. If you want to include F and H in the design model after loading rltool(sys) or rltool(sys,comp), select the Import Model menu item from the File menu of the Root Locus Design GUI to load F and H. rltool(sys,comp,LocationFlag,FeedbackSign) allows you to override the default compensator location and feedback sign. LocationFlag can be either 1 or 2: • LocationFlag = 1: Places the compensator in the forward path (this is the default) • LocationFlag = 2: Places the compensator in the feedback path • FeedbackSign can be either 1 or -1: - FeedbackSign = —1 for negative feedback (this is the default) - FeedbackSign = 1 for positive feedback See Also 11-188 rlocus rlocfind Plot root locus Select gain from the root locus plot rmodel, rss Purpose Syntax 11rmodel, rss Generate stable random continuous test models sys = rss(n) sys = rss(n,p) sys = rss(n,p,m) sys = rss(n,p,m,s1,...,sn) [num,den] = rmodel(n) [A,B,C,D] = rmodel(n) [A,B,C,D] = rmodel(n,p,m) Description rss(n) produces a stable random n-th order model with one input and one output and returns the model in the state-space object sys. rss(n,p) produces a random nth order stable model with one input and p outputs, and rss(n,m,p) produces a random n-th order stable model with m inputs and p outputs. The output sys is always a state-space model. rss(n,p,m,s1,...,sn)produces an s1-by-...-by-sn array of random n-th order stable state-space models with m inputs and p outputs. Use tf, frd, or zpk to convert the state-space object sys to transfer function, frequency response, or zero-pole-gain form. rmodel(n) produces a random n-th order stable model and returns either the transfer function numerator num and denominator den or the state-space matrices A, B, C, and D, depending on the number of output arguments. The resulting model always has one input and one output. [A,B,C,D] = rmodel(n,m,p) produces a stable random nth order state-space model with m inputs and p outputs. 11-189 rmodel, rss Example Obtain a stable random continuous LTI model with three states, two inputs, and two outputs by typing sys = rss(3,2,2) a = x1 x2 x3 x1 –0.54175 0.09729 0.08304 x2 0.09729 –0.89491 0.58707 x1 x2 x3 u1 –0.88844 0 –0.07162 u2 –2.41459 –0.69435 –1.39139 y1 y2 x1 0.32965 0.59854 x2 0.14718 –0.10144 y1 y2 u1 –0.87631 0 u2 –0.32758 0 x3 0.08304 0.58707 –1.95271 b = c = x3 0 0.02805 d = Continuous-time system. See Also 11-190 drmodel, drss frd tf zpk Generate stable random discrete test models Convert LTI systems to frequency response form Convert LTI systems to transfer function form Convert LTI systems to zero-pole-gain form series Purpose 11series Series connection of two LTI models Syntax sys = series(sys1,sys2) sys = series(sys1,sys2,outputs1,inputs2) Description series connects two LTI models in series. This function accepts any type of LTI model. The two systems must be either both continuous or both discrete with identical sample time. Static gains are neutral and can be specified as regular matrices. sys = series(sys1,sys2) forms the basic series connection shown below. sys u sys1 sys2 y This command is equivalent to the direct multiplication sys = sys2 * sys1 See “Multiplication” on page 3-13 for details on multiplication of LTI models. sys = series(sys1,sys2,outputs1,inputs2) forms the more general series connection. sys v2 sys2 u sys1 y1 y u2 z1 11-191 series The index vectors outputs1 and inputs2 indicate which outputs y 1 of sys1 and which inputs u 2 of sys2 should be connected. The resulting model sys has u as input and y as output. Example Consider a state-space system sys1 with five inputs and four outputs and another system sys2 with two inputs and three outputs. Connect the two systems in series by connecting outputs 2 and 4 of sys1 with inputs 1 and 2 of sys2. outputs1 = [2 4]; inputs2 = [1 2]; sys = series(sys1,sys2,outputs2,inputs1) See Also 11-192 append feedback parallel Append LTI systems Feedback connection Parallel connection set Purpose Syntax 11set Set or modify LTI model properties set(sys,'Property',Value) set(sys,'Property1',Value1,'Property2',Value2,...) set(sys,'Property') set(sys) Description set is used to set or modify the properties of an LTI model (see “LTI Properties” on page 2-26 for background on LTI properties). Like its Handle Graphics counterpart, set uses property name/property value pairs to update property values. set(sys,'Property',Value) assigns the value Value to the property of the LTI model sys specified by the string 'Property'. This string can be the full property name (for example, 'UserData') or any unambiguous case-insensitive abbreviation (for example, 'user'). The specified property must be compatible with the model type. For example, if sys is a transfer function, Variable is a valid property but StateName is not (see “Model-Specific Properties” on page 2-28 for details). set(sys,'Property1',Value1,'Property2',Value2,...) sets multiple property values with a single statement. Each property name/property value pair updates one particular property. set(sys,'Property') displays admissible values for the property specified by 'Property'. See “Property Values” below for an overview of legitimate LTI property values. set(sys) displays all assignable properties of sys and their admissible values. Example Consider the SISO state-space model created by sys = ss(1,2,3,4); You can add an input delay of 0.1 second, label the input as torque, reset the D matrix to zero, and store its DC gain in the 'Userdata' property by set(sys,'inputd',0.1,'inputn','torque','d',0,'user',dcgain(sys)) 11-193 set Note that set does not require any output argument. Check the result with get by typing get(sys) a: 1 b: 2 c: 3 d: 0 e: [] StateName: {''} Ts: 0 InputDelay: 0.1 OutputDelay: 0 ioDelayMatrix: 0 InputName: {'torque'} OutputName: {''} InputGroup: {0x2 cell} OutputGroup: {0x2 cell} Notes: {} UserData: -2 Property Values 11-194 The following table lists the admissible values for each LTI property. N u and N y denotes the number of inputs and outputs of the underlying LTI model. For K-dimensional LTI arrays, let S 1, S 2, …, S K denote the array dimensions. set Table 11-15: LTI Properties Property Name Admissible Property Values Ts • 0 (zero) for continuous-time systems • Sample time in seconds for discrete-time systems • –1 or [] for discrete systems with unspecified sample time Note: Resetting the sample time property does not alter the model data. Use c2d, d2c, or d2d for discrete/continuous and discrete/discrete conversions. ioDelayMatrix Input/Output delays specified with • Nonnegative real numbers for continuous-time models (seconds) • Integers for discrete-time models (number of sample periods) • Scalar when all I/O pairs have the same delay • N y -by- N u matrix to specify independent delay times for each I/O pair • Array of size N y -by- N u -by- S 1 -by-. . .-by- S n to specify different I/O delays for each model in an LTI array. InputDelay Input delays specified with • Nonnegative real numbers for continuous-time models (seconds) • Integers for discrete-time models (number of sample periods) • Scalar when N u = 1 or system has uniform input delay • Vector of length N u to specify independent delay times for each input channel • Array of size N y -by- N u -by- S 1 -by-. . .-by- S n to specify different input delays for each model in an LTI array. 11-195 set Table 11-15: LTI Properties (Continued) Property Name Admissible Property Values OutputDelay Output delays specified with • Nonnegative real numbers for continuous-time models (seconds) • Integers for discrete-time models (number of sample periods) • Scalar when N y = 1 or system has uniform output delay • Vector of length N y to specify independent delay times for each output channel • Array of size N y -by- N u -by- S 1 -by-. . .-by- S n to specify different output delays for each model in an LTI array. Notes String, array of strings, or cell array of strings UserData Arbitrary MATLAB variable InputName • String for single-input systems, for example, 'thrust' • Cell vector of strings for multi-input systems (with as many cells as inputs), for example, {'u';'w'} for a two-input system • Padded array of strings with as many rows as inputs, for example, ['rudder ' ; 'aileron'] OutputName Same as InputName (with “input” replaced by “output”) InputGroup Cell array. See “Input Groups and Output Groups” on page 2-37. OutputGroup Same as InputGroup Table 11-16: State-Space Model Properties Property Name Admissible Property Values StateName Same as InputName (with Input replaced by State) a, b, c, d, e Real-valued state-space matrices (multidimensional arrays, in the case of LTI arrays) with compatible dimensions for the number of states, inputs, and outputs. See “The Size of LTI Array Data for SS Models” on page 4-18. 11-196 set Table 11-17: TF Model Properties Property Name Admissible Property Values num, den • Real-valued row vectors for the coefficients of the numerator or denominator polynomials in the SISO case. List the coefficients in descending powers of the variable s or z by default, and in ascending –1 powers of q = z when the Variable property is set to 'q' or 'z^–1' (see note below). • N y -by- N u cell arrays of real-valued row vectors in the MIMO case, for example, {[1 2];[1 0 3]} for a two-output/one-input transfer function • N y -by- N u -by- S 1 -by- …-by-S K -dimensional real-valued cell arrays for MIMO LTI arrays Variable • String 's' (default) or 'p' for continuous-time systems • String 'z' (default), 'q', or 'z^–1' for discrete-time systems Table 11-18: ZPK Model Properties Property Name Admissible Property Values z, p • Vectors of zeros and poles (either real-valued or complex conjugate pairs of them) in SISO case • N y -by- N u cell arrays of vectors (entries are real-valued or in complex conjugate pairs) in MIMO case, for example, z = {[],[–1 0]} for a model with two inputs and one output • N y -by- N u -by- S 1 -by- …-by- S K -dimensional cell arrays for MIMO LTI arrays Variable • String 's' (default) or 'p' for continuous-time systems • String 'z' (default), 'q', or 'z^–1' for discrete-time systems 11-197 set Table 11-19: FRD Model Properties Property Name Admissible Property Values Frequency Real-valued vector of length N f -by-1, where N f is the number of frequencies Response • N y -by- N u -by- N f -dimensional array of complex data for single LTI models • N y -by- N u -by- N f -by- S 1 -by- …-by- S K -dimensional array for LTI arrays Units Remark String 'rad/s' (default), or 'Hz' For discrete-time transfer functions, the convention used to represent the numerator and denominator depends on the choice of variable (see the tf entry for details). Like tf, the syntax for set changes to remain consistent with the choice of variable. For example, if the Variable property is set to 'z' (the default), set(h,'num',[1 2],'den',[1 3 4]) produces the transfer function z+2 h ( z ) = --------------------------z 2 + 3z + 4 However, if you change the Variable to 'z^–1' (or 'q') by set(h,'Variable','z^–1'), the same command set(h,'num',[1 2],'den',[1 3 4]) now interprets the row vectors [1 2] and [1 3 4] as the polynomials 1 + 2z –1 –2 and 1 + 3z + 4z and produces: 11-198 –1 set –1 1 + 2z –1 h ( z ) = --------------------------------------- = zh ( z ) –1 –2 1 + 3z + 4z Because the resulting transfer functions are different, make sure to use the convention consistent with your choice of variable. See Also get frd ss tf zpk Access/query LTI model properties Specify a frequency response data model Specify a state-space model Specify a transfer function Specify a zero-pole-gain model 11-199 sgrid Purpose 11sgrid Generate an s-plane grid of constant damping factors and natural frequencies Syntax sgrid sgrid(z,wn) Description sgrid generates a grid of constant damping factors from zero to one in steps of 0.1 and natural frequencies from zero to 10 rad/sec in steps of one rad/sec, and plots the grid over the current axis. If the current axis contains a continuous s-plane root locus diagram or pole-zero map, sgrid draws the grid over the plot. sgrid(z,wn) plots a grid of constant damping factor and natural frequency lines for the damping factors and natural frequencies in the vectors z and wn, respectively. If the current axis contains a continuous s-plane root locus diagram or pole-zero map, sgrid(z,wn) draws the grid over the plot. Example Plot s-plane grid lines on the root locus for the following system. 2 2s + 5s + 1 H ( s ) = -----------------------------2 s + 2s + 3 You can do this by typing H = tf([2 5 1],[1 2 3]) Transfer function: 2 s^2 + 5 s + 1 --------------s^2 + 2 s + 3 rlocus(H) sgrid 11-200 sgrid 1.5 1 Imag Axis 0.5 0 −0.5 −1 −1.5 −3 Limitations −2.5 −2 −1.5 −1 Real Axis −0.5 0 0.5 1 sgrid plots the grid over the current axis regardless of whether the axis contains a root locus diagram or pole-zero map. Therefore, if the current axes contains, for example, a step response, you may superimpose a meaningless s-plane grid over the plot. In addition, sgrid does not rescale the axis limits of the current axis. Therefore, the s-plane grid may not appear in the plot if the left half of the s-plane is not encompassed by the axis limits. See Also pzmap rlocus zgrid Plot pole-zero map Plot root locus Generate z-plane grid lines 11-201 sigma Purpose Syntax 11sigma Singular values of the frequency response of LTI models sigma(sys) sigma(sys,w) sigma(sys,w,type) sigma(sys1,sys2,...,sysN) sigma(sys1,sys2,...,sysN,w) sigma(sys1,sys2,...,sysN,w,type) sigma(sys1,'PlotStyle1',...,sysN,'PlotStyleN') [sv,w] = sigma(sys) sv = sigma(sys,w) Description sigma calculates the singular values of the frequency response of an LTI model. For an FRD model, sys, sigma computes the singular values of sys.Response at the frequencies, sys.frequency. For continuous-time TF, SS, or ZPK models with transfer function H ( s ) , sigma computes the singular values of H ( jω ) as a function of the frequency ω . For discrete-time TF, SS, or ZPK models with transfer function H ( z ) and sample time T s , sigma computes the singular values of H( e jωT s ) for frequencies ω between 0 and the Nyquist frequency ω N = π ⁄ T s . The singular values of the frequency response extend the Bode magnitude response for MIMO systems and are useful in robustness analysis. The singular value response of a SISO system is identical to its Bode magnitude response. When invoked without output arguments, sigma produces a singular value plot on the screen. sigma(sys) plots the singular values of the frequency response of an arbitrary LTI model sys. This model can be continuous or discrete, and SISO or MIMO. The frequency points are chosen automatically based on the system poles and zeros, or from sys.frequency if sys is an FRD. sigma(sys,w) explicitly specifies the frequency range or frequency points to be used for the plot. To focus on a particular frequency interval [wmin,wmax], set 11-202 sigma w = {wmin,wmax}. To use particular frequency points, set w to the corresponding vector of frequencies. Use logspace to generate logarithmically spaced frequency vectors. The frequencies must be specified in rad/sec. sigma(sys,[],type) or sigma(sys,w,type) plots the following modified singular value responses: –1 type = 1 Singular values of the frequency response H the frequency response of sys. type = 2 Singular values of the frequency response I + H . type = 3 Singular values of the frequency response I + H , where H is –1 . These options are available only for square systems, that is, with the same number of inputs and outputs. To superimpose the singular value plots of several LTI models on a single figure, use sigma(sys1,sys2,...,sysN) sigma(sys1,sys2,...,sysN,[],type) % modified SV plot sigma(sys1,sys2,...,sysN,w) % specify frequency range/grid The models sys1,sys2,...,sysN need not have the same number of inputs and outputs. Each model can be either continuous- or discrete-time. You can also specify a distinctive color, linestyle, and/or marker for each system plot with the syntax sigma(sys1,'PlotStyle1',...,sysN,'PlotStyleN') See bode for an example. When invoked with output arguments, [sv,w] = sigma(sys) sv = sigma(sys,w) return the singular values sv of the frequency response at the frequencies w. For a system with Nu input and Ny outputs, the array sv has min(Nu,Ny) rows and as many columns as frequency points (length of w). The singular values at the frequency w(k) are given by sv(:,k). 11-203 sigma Remark If sys is an FRD model, sigma(sys,w), w can only include frequencies in sys.frequency. Example Plot the singular value responses of 0 H(s) = s+1 -----------s+5 and I + H ( s ) . 11-204 3s -------------------------2 s + s + 10 2 -----------s+6 sigma You can do this by typing H = [0 tf([3 0],[1 1 10]) ; tf([1 1],[1 5]) tf(2,[1 6])] subplot(211) sigma(H) subplot(212) sigma(H,[],2) Singular Values Singular Values (dB) 20 0 −20 −40 −60 −2 10 −1 10 0 10 Frequency (rad/sec) 1 10 2 10 Singular Values Singular Values (dB) 20 10 0 −10 −20 −30 −40 −2 10 Algorithm −1 10 0 10 Frequency (rad/sec) 1 10 2 10 sigma uses the svd function in MATLAB to compute the singular values of a complex matrix. See Also bode evalfr freqresp ltiview Bode plot Response at single complex frequency Frequency response computation LTI system viewer 11-205 sigma nichols nyquist 11-206 Nichols plot Nyquist plot size Purpose 11size Provide the output/input/array dimensions of LTI models, the model order of TF, SS, and ZPK models, and the number of frequencies of FRD models Syntax size(sys) d = size(sys) Ny = size(sys,1) Nu = size(sys,2) Sk = size(sys,2+k) Ns = size(sys,'order') Nf = size(sys,'frequency') Description When invoked without output arguments, size(sys) returns a vector of the number of outputs and inputs for a single LTI model. The lengths of the array dimensions are also included in the response to size when sys is an LTI array. size is the overloaded version of the MATLAB function size for LTI objects. d = size(sys) returns: • The row vector d = [Ny Nu] for a single LTI model sys with Ny outputs and Nu inputs • The row vector d = [Ny Nu S1 S2 ... Sp] for an S1-by-S2-by-...-by-Sp array of LTI models with Ny outputs and Nu inputs Ny = size(sys,1) returns the number of outputs of sys. Nu = size(sys,2) returns the number of inputs of sys. Sk = size(sys,2+k) returns the length of the k-th array dimension when sys is an LTI array. Ns = size(sys,'order') returns the model order of a TF, SS, or ZPK model. This is the same as the number of states for state-space models. When sys is an LTI array of SS models with differing numbers of states in each model: • Ns is the multidimensional array of the orders of each of the models in the LTI array. • The dimensions of Ns are given by the array dimensions of the LTI array sys. Nf = size(sys,'frequency') returns the number of frequencies when sys is an FRD. This is the same as the length of sys.frequency. 11-207 size Example Consider the random LTI array of state-space models sys = rss(5,3,2,3); Its dimensions are obtained by typing size(sys) 3x1 array of state-space models Each model has 3 outputs, 2 inputs, and 5 states. See Also 11-208 isempty issiso ndims Test if LTI model is empty Test if LTI model is SISO Number of dimensions of an LTI array sminreal Purpose 11sminreal Perform model reduction based on structure Syntax msys = sminreal(sys) Description msys = sminreal(sys) eliminates the states of the state-space model sys that don’t affect the input/output response. All of the states of the resulting state-space model msys are also states of sys and the input/output response of msys is equivalent to that of sys. sminreal eliminates only structurally non minimal states, i.e., states that can be discarded by looking only at hard zero entries in the A, B, and C matrices. Such structurally nonminimal states arise, for example, when linearizing a Simulink model that includes some unconnected state-space or transfer function blocks. Remark The model resulting from sminreal(sys) is not necessarily minimal, and may have a higher order than one resulting from minreal(sys). However, sminreal(sys) retains the state structure of sys, while, in general, minreal(sys) does not. Example Suppose you concatenate two SS models, sys1 and sys2. sys = [sys1,sys2]; This operation is depicted in the diagram below. u sys1 + v y sys2 If you extract the subsystem sys1 from sys, with sys(1,1) 11-209 sminreal all of the states of sys, including those of sys2 are retained. To eliminate the unobservable states from sys2, while retaining the states of sys1, type sminreal(sys(1,1)) See Also 11-210 minreal Model reduction by removing unobservable/ uncontrollable states or cancelling pole/zero pairs ss Purpose Syntax 11ss Specify state-space models or convert an LTI model to state space sys sys sys sys = = = = ss(a,b,c,d) ss(a,b,c,d,Ts) ss(d) ss(a,b,c,d,ltisys) sys = ss(a,b,c,d,'Property1',Value1,...,'PropertyN',ValueN) sys = ss(a,b,c,d,Ts,'Property1',Value1,...,'PropertyN',ValueN) sys_ss = ss(sys) sys_ss = ss(sys,'minimal') Description ss is used to create real-valued state-space models (SS objects) or to convert transfer function or zero-pole-gain models to state space. Creation of State-Space Models sys = ss(a,b,c,d) creates the continuous-time state-space model · x = Ax + Bu y = Cx + Du For a model with Nx states, Ny outputs, and Nu inputs: • a is an Nx-by-Nx real-valued matrix. • b is an Nx-by-Nu real-valued matrix. • c is an Ny-by-Nx real-valued matrix. • d is an Ny-by-Nu real-valued matrix. The output sys is an SS model that stores the model data (see “State-Space Models” on page 2-14). If D = 0 , you can simply set d to the scalar 0 (zero), regardless of the dimension. sys = ss(a,b,c,d,Ts) creates the discrete-time model x [ n + 1 ] = Ax [ n ] + Bu [ n ] y [ n ] = Cx [ n ] + Du [ n ] 11-211 ss with sample time Ts (in seconds). Set Ts = –1 or Ts = [] to leave the sample time unspecified. sys = ss(d) specifies a static gain matrix D and is equivalent to sys = ss([],[],[],d) sys = ss(a,b,c,d,ltisys) creates a state-space model with generic LTI properties inherited from the LTI model ltisys (including the sample time). See “Generic Properties” on page 2-26 for an overview of generic LTI properties. See “Building LTI Arrays” on page 4-12 for information on how to build arrays of state-space models. Any of the previous syntaxes can be followed by property name/property value pairs. 'PropertyName',PropertyValue Each pair specifies a particular LTI property of the model, for example, the input names or some notes on the model history. See the set entry and the example below for details. Note that sys = ss(a,b,c,d,'Property1',Value1,...,'PropertyN',ValueN) is equivalent to the sequence of commands. sys = ss(a,b,c,d) set(sys,'Property1',Value1,...,'PropertyN',ValueN) Conversion to State Space sys_ss = ss(sys) converts an arbitrary TF or ZPK model sys to state space. The output sys_ss is an equivalent state-space model (SS object). This operation is known as state-space realization. sys_ss = ss(sys,'minimal') produces a state-space realization with no uncontrollable or unobservable states. This is equivalent to sys_ss = minreal(ss(sys)). 11-212 ss Examples Example 1 The command sys = ss(A,B,C,D,0.05,'statename',{'position' 'velocity'},... 'inputname','force',... 'notes','Created 10/15/96') creates a discrete-time model with matrices A, B, C, D and sample time 0.05 second. This model has two states labeled position and velocity, and one input labeled force (the dimensions of A, B, C, D should be consistent with these numbers of states and inputs). Finally, a note is attached with the date of creation of the model. Example 2 Compute a state-space realization of the transfer function H(s) = s+1 -----------------------------------------3 2 s + 3s + 3s + 2 2 s +3 ----------------------2 s +s+1 by typing H = [tf([1 1],[1 3 3 2]) ; tf([1 0 3],[1 1 1])]; sys = ss(H); size(sys) State-space model with 2 outputs, 1 input, and 5 states. Note that the number of states is equal to the cumulative order of the SISO entries of H(s). To obtain a minimal realization of H(s), type sys = ss(H,'min'); size(sys) State-space model with 2 outputs, 1 input, and 3 states. 11-213 ss The resulting state-space model order has order three, the minimum number of states needed to represent H(s). This can be seen directly by factoring H(s) as the product of a first order system with a second order one. 1 ------------ 0 H(s) = s + 2 0 1 See Also 11-214 dss frd get set ssdata tf zpk s+1 ----------------------2 s +s+1 2 s +3 ----------------------2 s +s+1 Specify descriptor state-space models. Specify FRD models or convert to an FRD. Get properties of LTI models. Set properties of LTI models. Retrieve the A, B, C, D matrices of state-space model. Specify transfer functions or convert to TF. Specify zero-pole-gain models or convert to ZPK. ss2ss Purpose 11ss2ss State coordinate transformation for state-space models Syntax sysT = ss2ss(sys,T) Description Given a state-space model sys with equations · x = Ax + Bu y = Cx + Du (or their discrete-time counterpart), ss2ss performs the similarity transformation x = Tx on the state vector x and produces the equivalent state-space model sysT with equations. · –1 x = TAT x + TBu –1 y = CT x + Du sysT = ss2ss(sys,T) returns the transformed state-space model sysT given sys and the state coordinate transformation T. The model sys must be in state-space form and the matrix T must be invertible. ss2ss is applicable to both continuous- and discrete-time models. Example Perform a similarity transform to improve the conditioning of the A matrix. T = balance(sys.a) sysb = ss2ss(sys,inv(T)) See ssbal for a more direct approach. See Also balreal canon ssbal Gramian-based I/O balancing Canonical state-space realizations Balancing of state-space models using diagonal similarity transformations 11-215 ssbal Purpose 11ssbal Balance state-space models using a diagonal similarity transformation Syntax [sysb,T] = ssbal(sys) [sysb,T] = ssbal(sys,condT) Description Given a state-space model sys with matrices ( A, B, C, D ) , [sysb,T] = ssbal(sys) computes a diagonal similarity transformation T and a scalar α such that TAT αCT –1 –1 TB ⁄ α 0 has approximately equal row and column norms. ssbal returns the balanced model sysb with matrices –1 –1 ( TAT , TB ⁄ α, αCT , D ) and the state transformation x = Tx where x is the new state. [sysb,T] = ssbal(sys,condT) specifies an upper bound condT on the condition number of T . Since balancing with ill-conditioned T can inadvertently magnify rounding errors, condT gives control over the worst-case roundoff amplification factor. The default value is condT=1/eps. Example Consider the continuous-time state-space model with the following data. 4 2 2 5 1 10 10 A = a = b = c = sys 11-216 0 10 10 10 1 0 , 1 B = 1 , 1 [1 1e4 1e2;0 1e2 1e5;10 1 0]; [1;1;1]; [0.1 10 1e2]; = ss(a,b,c,0) C = 0.1 10 100 ssbal Balance this model with ssbal by typing ssbal(sys) a = x1 x2 x3 x1 1 0 2560 x1 x2 x3 u1 0.125 0.5 32 y1 x1 0.8 y1 u1 0 x2 2500 100 64 x3 0.39063 1562.5 0 x2 20 x3 3.125 b = c = d = Continuous-time system. Direct inspection shows that the range of numerical values has been compressed by a factor 100 and that the B and C matrices now have nearly equal norms. Algorithm ssbal uses the MATLAB function balance to compute T and α . See Also balreal ss2ss Gramian-based I/O balancing State coordinate transformation 11-217 ssdata Purpose 11ssdata Quick access to state-space model data Syntax [a,b,c,d] = ssdata(sys) [a,b,c,d,Ts] = ssdata(sys) Description [a,b,c,d] = ssdata(sys) extracts the matrix (or multidimensional array) data ( A, B, C, D ) from the state-space model (LTI array) sys. If sys is a transfer function or zero-pole-gain model (LTI array), it is first converted to state space. See Table 11-16, “State-Space Model Properties,” on page 11-196 for more information on the format of state-space model data. [a,b,c,d,Ts] = ssdata(sys) returns the sample time Ts in addition to a, b, c, and d. You can access the remaining LTI properties of sys with get or by direct referencing, for example, sys.statename See Also 11-218 dssdata get set ss tfdata zpkdata Quick access to descriptor state-space data Get properties of LTI models Set model properties Specify state-space models Quick access to transfer function data Quick access to zero-pole-gain data stack Purpose 11stack Build an LTI array by stacking LTI models or LTI arrays along array dimensions of an LTI array Syntax sys = stack(arraydim,sys1,sys2,...) Description sys = stack(arraydim,sys1,sys2,...) produces an array of LTI models sys by stacking (concatenating) the LTI models (or LTI arrays) sys1,sys2,... along the array dimension arraydim. All models must have the same number of inputs and outputs (the same I/O dimensions). The I/O dimensions are not counted in the array dimensions. See “Dimensions, Size, and Shape of an LTI Array” on page 4-7, and “Building LTI Arrays Using the stack Function” on page 4-15 for more information. Example If sys1 and sys2 are two LTI models with the same I/O dimensions: • stack(1,sys1,sys2) produces a 2-by-1 LTI array. • stack(2,sys1,sys2) produces a 1-by-2 LTI array. • stack(3,sys1,sys2) produces a 1-by-1-by-2 LTI array. 11-219 step Purpose Syntax 11step Step response of LTI systems step(sys) step(sys,t) step(sys1,sys2,...,sysN) step(sys1,sys2,...,sysN,t) step(sys1,'PlotStyle1',...,sysN,'PlotStyleN') [y,t,x] = step(sys) Description step calculates the unit step response of a linear system. Zero initial state is assumed in the state-space case. When invoked with no output arguments, this function plots the step response on the screen. step(sys) plots the step response of an arbitrary LTI model sys. This model can be continuous or discrete, and SISO or MIMO. The step response of multi-input systems is the collection of step responses for each input channel. The duration of simulation is determined automatically based on the system poles and zeros. step(sys,t) sets the simulation horizon explicitly. You can specify either a final time t = Tfinal (in seconds), or a vector of evenly spaced time samples of the form t = 0:dt:Tfinal For discrete systems, the spacing dt should match the sample period. For continuous systems, dt becomes the sample time of the discretized simulation model (see “Algorithm”), so make sure to choose dt small enough to capture transient phenomena. To plot the step responses of several LTI models sys1,..., sysN on a single figure, use step(sys1,sys2,...,sysN) step(sys1,sys2,...,sysN,t) 11-220 step All systems must have the same number of inputs and outputs but may otherwise be a mix of continuous- and discrete-time systems. This syntax is useful to compare the step responses of multiple systems. You can also specify a distinctive color, linestyle, and/or marker for each system. For example, step(sys1,'y:',sys2,'g--') plots the step response of sys1 with a dotted yellow line and the step response of sys2 with a green dashed line. When invoked with output arguments, [y,t] = step(sys) [y,t,x] = step(sys) y = step(sys,t) % for state-space models only return the output response y, the time vector t used for simulation, and the state trajectories x (for state-space models only). No plot is drawn on the screen. For single-input systems, y has as many rows as time samples (length of t), and as many columns as outputs. In the multi-input case, the step responses of each input channel are stacked up along the third dimension of y. The dimensions of y are then ( length of t ) × ( number of outputs ) × ( number of inputs ) and y(:,:,j) gives the response to a unit step command injected in the jth input channel. Similarly, the dimensions of x are ( length of t ) × ( number of states ) × ( number of inputs ) Example Plot the step response of the following second-order state-space model. 11-221 step · x1 – 0.5572 – 0.7814 x 1 1 = + · x2 0.7814 0 0 x2 y = 1.9691 6.4493 –1 u1 2 u2 x1 x2 a = [–0.5572 –0.7814;0.7814 b = [1 –1;0 2]; c = [1.9691 6.4493]; sys = ss(a,b,c,0); step(sys) 0]; Step Response From: U1 From: U2 12 10 8 Amplitude 6 4 2 0 −2 −4 0 5 10 15 200 5 10 15 20 Time (sec.) The left plot shows the step response of the first input channel, and the right plot shows the step response of the second input channel. 11-222 step Algorithm Continuous-time models are converted to state space and discretized using zero-order hold on the inputs. The sampling period is chosen automatically based on the system dynamics, except when a time vector t = 0:dt:Tf is supplied (dt is then used as sampling period). See Also impulse initial lsim ltiview Impulse response Free response to initial condition Simulate response to arbitrary inputs LTI system viewer 11-223 tf Purpose Syntax 11tf Specify transfer functions or convert LTI model to transfer function form sys sys sys sys = = = = tf(num,den) tf(num,den,Ts) tf(M) tf(num,den,ltisys) sys = tf(num,den,'Property1',Value1,...,'PropertyN',ValueN) sys = tf(num,den,Ts,'Property1',Value1,...,'PropertyN',ValueN) sys = tf('s') sys = tf('z') tfsys = tf(sys) tfsys = tf(sys,'inv') Description % for state-space sys only tf is used to create real-valued transfer function models (TF objects) or to convert state-space or zero-pole-gain models to transfer function form. Creation of Transfer Functions sys = tf(num,den) creates a continuous-time transfer function with numerator(s) and denominator(s) specified by num and den. The output sys is a TF object storing the transfer function data (see “Transfer Function Models” on page 2-8). In the SISO case, num and den are the real-valued row vectors of numerator and denominator coefficients ordered in descending powers of s . These two vectors need not have equal length and the transfer function need not be proper. For example, h = tf([1 0],1) specifies the pure derivative h ( s ) = s . To create MIMO transfer functions, specify the numerator and denominator of each SISO entry. In this case: • num and den are cell arrays of row vectors with as many rows as outputs and as many columns as inputs. • The row vectors num{i,j} and den{i,j} specify the numerator and denominator of the transfer function from input j to output i (with the SISO convention). 11-224 tf If all SISO entries of a MIMO transfer function have the same denominator, you can set den to the row vector representation of this common denominator. See “Examples” for more details. sys = tf(num,den,Ts) creates a discrete-time transfer function with sample time Ts (in seconds). Set Ts = –1 or Ts = [] to leave the sample time unspecified. The input arguments num and den are as in the continuous-time case and must list the numerator and denominator coefficients in descending powers of z . sys = tf(M) creates a static gain M (scalar or matrix). sys = tf(num,den,ltisys) creates a transfer function with generic LTI properties inherited from the LTI model ltisys (including the sample time). See “Generic Properties” on page 2-26 for an overview of generic LTI properties. There are several ways to create LTI arrays of transfer functions. To create arrays of SISO or MIMO TF models, either specify the numerator and denominator of each SISO entry using multidimensional cell arrays, or use a for loop to successively assign each TF model in the array. See “Building LTI Arrays” on page 4-12 for more information. Any of the previous syntaxes can be followed by property name/property value pairs 'Property',Value Each pair specifies a particular LTI property of the model, for example, the input names or the transfer function variable. See set entry and the example below for details. Note that sys = tf(num,den,'Property1',Value1,...,'PropertyN',ValueN) is a shortcut for sys = tf(num,den) set(sys,'Property1',Value1,...,'PropertyN',ValueN) Transfer Functions as Rational Expressions in s or z You can also use real-valued rational expressions to create a TF model. To do so, first type either: 11-225 tf • s = tf('s') to specify a TF model using a rational function in the Laplace variable, s. • z = tf('z',Ts) to specify a TF model with sample time Ts using a rational function in the discrete-time variable, z. Once you specify either of these variables, you can specify TF models directly as rational expressions in the variable s or z by entering your transfer function as a rational expression in either s or z. Conversion to Transfer Function tfsys = tf(sys) converts an arbitrary SS or ZPK LTI model sys to transfer function form. The output tfsys (TF object) is the transfer function of sys. By default, tf uses zero to compute the numerators when converting a state-space model to transfer function form. Alternatively, tfsys = tf(sys,'inv') uses inversion formulas for state-space models to derive the numerators. This algorithm is faster but less accurate for high-order models with low gain at s = 0. Examples Example 1 Create the two-output/one-input transfer function p+1 ---------------------------2 H ( p ) = p + 2p + 2 1 --p with input current and outputs torque and ang velocity. 11-226 tf To do this, type num = {[1 1] ; 1} den = {[1 2 2] ; [1 0]} H = tf(num,den,'inputn','current',... 'outputn',{'torque' 'ang. velocity'},... 'variable','p') Transfer function from input "current" to output... p + 1 torque: ------------p^2 + 2 p + 2 ang. velocity: 1 p Note how setting the 'variable' property to 'p' causes the result to be displayed as a transfer function of the variable p . Example 2 To use a rational expression to create a SISO TF model, type s = tf('s'); H = s/(s^2 + 2*s +10); This produces the same transfer function as h = tf([1 0],[1 2 10]); Example 3 Specify the discrete MIMO transfer function 1 ----------------z + 0.3 H(z ) = –z+2 ----------------z + 0.3 z ----------------z + 0.3 3 ----------------z + 0.3 11-227 tf with common denominator d ( z ) = z + 0.3 and sample time of 0.2 seconds. nums = {1 [1 0];[–1 2] 3} Ts = 0.2 H = tf(nums,[1 0.3],Ts) % Note: row vector for common den. d(z) Example 4 Compute the transfer function of the state-space model with the following data. A = –2 – 1 , 1 –2 B = 1 1 , 2 –1 C = 1 0 , D = 0 1 To do this, type sys = ss([–2 –1;1 –2],[1 1;2 –1],[1 0],[0 1]) tf(sys) Transfer function from input 1 to output: s ------------s^2 + 4 s + 5 Transfer function from input 2 to output: s^2 + 5 s + 8 ------------s^2 + 4 s + 5 Example 5 You can use a for loop to specify a 10-by-1 array of SISO TF models. s = tf('s') H = tf(zeros(1,1,10)); for k=1:10, H(:,:,k) = k/(s^2+s+k); end The first statement pre-allocates the TF array and fills it with zero transfer functions. Discrete-Time Conventions 11-228 The control and digital signal processing (DSP) communities tend to use different conventions to specify discrete transfer functions. Most control tf engineers use the z variable and order the numerator and denominator terms in descending powers of z , for example, 2 z h ( z ) = --------------------------z 2 + 2z + 3 2 The polynomials z and z 2 + 2z + 3 are then specified by the row vectors [1 0 0] and [1 2 3], respectively. By contrast, DSP engineers prefer to write this transfer function as 1 –1 h ( z ) = --------------------------------------–1 –2 1 + 2z + 3z and specify its numerator as 1 (instead of [1 0 0]) and its denominator as [1 2 3]. tf switches convention based on your choice of variable (value of the 'Variable' property). Variable Convention 'z' (default) Use the row vector [ak ... a1 a0] to specify the k polynomial a k z + ... + a 1 z + a 0 (coefficients ordered in descending powers of z ). 'z^–1', 'q' Use the row vector [b0 b1 ... bk] to specify the –1 –k polynomial b 0 + b 1 z + ... + b k z (coefficients in –1 ascending powers of z or q ). For example, g = tf([1 1],[1 2 3],0.1) specifies the discrete transfer function z+1 g ( z ) = --------------------------2 z + 2z + 3 because z is the default variable. In contrast, h = tf([1 1],[1 2 3],0.1,'variable','z^–1') 11-229 tf uses the DSP convention and creates –1 1+z –1 h ( z ) = --------------------------------------- = zg ( z ) –1 –2 1 + 2z + 3z See also filt for direct specification of discrete transfer functions using the DSP convention. Note that tf stores data so that the numerator and denominator lengths are made equal. Specifically, tf stores the values num = [0 1 1]; den = [1 2 3] for g (the numerator is padded with zeros on the left) and the values num = [1 1 0]; den = [1 2 3] for h (the numerator is padded with zeros on the right). Algorithm tf uses the MATLAB function poly to convert zero-pole-gain models, and the functions zero and pole to convert state-space models. See Also filt frd get set ss tfdata zpk 11-230 Specify discrete transfer functions in DSP format Specify a frequency response data model Get properties of LTI models Set properties of LTI models Specify state-space models or convert to state space Retrieve transfer function data Specify zero-pole-gain models or convert to ZPK tfdata Purpose 11tfdata Quick access to transfer function data Syntax [num,den] = tfdata(sys) [num,den] = tfdata(sys,'v') [num,den,Ts] = tfdata(sys) Description [num,den] = tfdata(sys) returns the numerator(s) and denominator(s) of the transfer function for the TF, SS or ZPK model (or LTI array of TF, SS or ZPK models) sys. For single LTI models, the outputs num and den of tfdata are cell arrays with the following characteristics: • num and den have as many rows as outputs and as many columns as inputs. • The (i,j) entries num{i,j} and den{i,j} are row vectors specifying the numerator and denominator coefficients of the transfer function from input j to output i. These coefficients are ordered in descending powers of s or z . For arrays sys of LTI models, num and den are multidimensional cell arrays with the same sizes as sys. If sys is a state-space or zero-pole-gain model, it is first converted to transfer function form using tf. See Table 11-15, “LTI Properties,” on page 11-195 for more information on the format of transfer function model data. For SISO transfer functions, the syntax [num,den] = tfdata(sys,'v') forces tfdata to return the numerator and denominator directly as row vectors rather than as cell arrays (see example below). [num,den,Ts] = tfdata(sys) also returns the sample time Ts. You can access the remaining LTI properties of sys with get or by direct referencing, for example, sys.Ts sys.variable Example Given the SISO transfer function h = tf([1 1],[1 2 5]) 11-231 tfdata you can extract the numerator and denominator coefficients by typing [num,den] = tfdata(h,'v') num = 0 1 1 den = 1 2 5 This syntax returns two row vectors. If you turn h into a MIMO transfer function by typing H = [h ; tf(1,[1 1])] the command [num,den] = tfdata(H) now returns two cell arrays with the numerator/denominator data for each SISO entry. Use celldisp to visualize this data. Type celldisp(num) and MATLAB returns the numerator vectors of the entries of H. num{1} = 0 1 num{2} = 0 1 1 Similarly, for the denominators, type celldisp(den) See Also 11-232 den{1} = 1 2 den{2} = 1 1 get ssdata 5 Get properties of LTI models Quick access to state-space data tfdata tf zpkdata Specify transfer functions Quick access to zero-pole-gain data 11-233 totaldelay Purpose 11totaldelay Return the total combined I/O delays for an LTI model Syntax td = totaldelay(sys) Description td = totaldelay(sys) returns the total combined I/O delays for an LTI model sys. The matrix td combines contributions from the InputDelay, OutputDelay, and ioDelayMatrix properties, (see set on page 11-193 or type ltiprops for details on these properties). Delays are expressed in seconds for continuous-time models, and as integer multiples of the sample period for discrete-time models. To obtain the delay times in seconds, multiply td by the sample time sys.Ts. Example sys = tf(1,[1 0]); % TF of 1/s sys.inputd = 2; sys.outputd = 1.5; td = totaldelay(sys) % 2 sec input delay % 1.5 sec output delay td = 3.5000 The resulting I/O map is e – 2s 1 – 3.5s 1 --× --- e –1.5s = e s s This is equivalent to assigning an I/O delay of 3.5 seconds to the original model sys. See Also delay2z hasdelay 11-234 Change transfer functions of discrete-time LTI models with delays to rational functions or absorbs FRD delays into the frequency response phase information True for LTI models with delays zero Purpose 11zero Transmission zeros of LTI models Syntax z = zero(sys) [z,gain] = zero(sys) Description zero computes the zeros of SISO systems and the transmission zeros of MIMO systems. For a MIMO system with matrices ( A, B, C, D ) , the transmission zeros are the complex values λ for which the normal rank of A – λI B C D drops. z = zero(sys) returns the (transmission) zeros of the LTI model sys as a column vector. [z,gain] = zero(sys) also returns the gain (in the zero-pole-gain sense) if sys is a SISO system. Algorithm The transmission zeros are computed using the algorithm in [1]. See Also pole pzmap References [1] Emami-Naeini, A. and P. Van Dooren, “Computation of Zeros of Linear Multivariable Systems,” Automatica, 18 (1982), pp. 415–430. Compute the poles of an LTI model Compute the pole-zero map 11-235 zgrid Purpose 11zgrid Generate a z-plane grid of constant damping factors and natural frequencies Syntax zgrid zgrid(z,wn) Description zgrid generates a grid of constant damping factors from zero to one in steps of 0.1 and natural frequencies from zero to π in steps of π ⁄ 10 , and plots the grid over the current axis. If the current axis contains a discrete z-plane root locus diagram or pole-zero map, zgrid draws the grid over the plot without altering the current axis limits. zgrid(z,wn) plots a grid of constant damping factor and natural frequency lines for the damping factors and normalized natural frequencies in the vectors z and wn, respectively. If the current axis contains a discrete z-plane root locus diagram or pole-zero map, zgrid(z,wn) draws the grid over the plot. The frequency lines for unnormalized (true) frequencies can be plotted using zgrid(z,wn/Ts) where Ts is the sample time. zgrid([],[]) draws the unit circle. Example Plot z-plane grid lines on the root locus for the system 2 2z – 3.4z + 1.5 H ( z ) = ---------------------------------------2 z – 1.6z + 0.8 by typing H = tf([2 –3.4 1.5],[1 –1.6 0.8],–1) Transfer function: 2 z^2 – 3.4 z + 1.5 ------------------z^2 – 1.6 z + 0.8 Sampling time: unspecified 11-236 zgrid To see the z-plane grid on the root locus plot, type rlocus(H) zgrid axis('square') 1 0.8 0.6 0.4 Imag Axis 0.2 0 −0.2 −0.4 −0.6 −0.8 −1 −1 Limitations −0.8 −0.6 −0.4 −0.2 0 0.2 Real Axis 0.4 0.6 0.8 1 zgrid plots the grid over the current axis regardless of whether the axis contains a root locus diagram or pole-zero map. Therefore, if the current axis contains, for example, a step response, you may superimpose a meaningless z-plane grid over the plot. See Also pzmap rlocus sgrid Plot pole-zero map of LTI systems Plot root locus Generate s-plane grid lines 11-237 zpk Purpose Syntax 11zpk Specify zero-pole-gain models or convert LTI model to zero-pole-gain form sys sys sys sys = = = = zpk(z,p,k) zpk(z,p,k,Ts) zpk(M) zpk(z,p,k,ltisys) sys = zpk(z,p,k,'Property1',Value1,...,'PropertyN',ValueN) sys = zpk(z,p,k,Ts,'Property1',Value1,...,'PropertyN',ValueN) sys = zpk('s') sys = zpk('z') zsys = zpk(sys) zsys = zpk(sys,'inv') Description % for state-space sys only zpk is used to create zero-pole-gain models (ZPK objects) or to convert TF or SS models to zero-pole-gain form. Creation of Zero-Pole-Gain Models sys = zpk(z,p,k) creates a continuous-time zero-pole-gain model with zeros z, poles p, and gain(s) k. The output sys is a ZPK object storing the model data (see “LTI Objects” on page 2-3). In the SISO case, z and p are the vectors of real or complex conjugate zeros and poles, and k is the real-valued scalar gain. ( s – z ( 1 ) ) ( s – z ( 2 ) )... ( s – z ( m ) ) h ( s ) = k ---------------------------------------------------------------------------------( s – p ( 1 ) ) ( s – p ( 2 ) )... ( s – p ( n ) ) Set z or p to [] for systems without zeros or poles. These two vectors need not have equal length and the model need not be proper (that is, have an excess of poles). You can also use rational expressions to create a ZPK model. To do so, use either: 11-238 zpk • s = zpk('s') to specify a ZPK model from a rational transfer function of the Laplace variable, s. • z = zpk('z',Ts) to specify a ZPK model with sample time Ts from a rational transfer function of the discrete-time variable, z. Once you specify either of these variables, you can specify ZPK models directly as real-valued rational expressions in the variable s or z. To create a MIMO zero-pole-gain model, specify the zeros, poles, and gain of each SISO entry of this model. In this case: • z and p are cell arrays of vectors with as many rows as outputs and as many columns as inputs, and k is a matrix with as many rows as outputs and as many columns as inputs. • The vectors z{i,j} and p{i,j} specify the zeros and poles of the transfer function from input j to output i. • k(i,j) specifies the (scalar) gain of the transfer function from input j to output i. See below for a MIMO example. sys = zpk(z,p,k,Ts) creates a discrete-time zero-pole-gain model with sample time Ts (in seconds). Set Ts = –1 or Ts = [] to leave the sample time unspecified. The input arguments z, p, k are as in the continuous-time case. sys = zpk(M) specifies a static gain M. sys = zpk(z,p,k,ltisys) creates a zero-pole-gain model with generic LTI properties inherited from the LTI model ltisys (including the sample time). See “Generic Properties” on page 2-26 for an overview of generic LTI properties. To create an array of ZPK models, use a for loop, or use multidimensional cell arrays for z and p, and a multidimensional array for k. Any of the previous syntaxes can be followed by property name/property value pairs. 'PropertyName',PropertyValue 11-239 zpk Each pair specifies a particular LTI property of the model, for example, the input names or the input delay time. See set entry and the example below for details. Note that sys = zpk(z,p,k,'Property1',Value1,...,'PropertyN',ValueN) is a shortcut for the following sequence of commands. sys = zpk(z,p,k) set(sys,'Property1',Value1,...,'PropertyN',ValueN) Zero-Pole-Gain Models as Rational Expressions in s or z You can also use rational expressions to create a ZPK model. To do so, first type either: • s = zpk('s') to specify a ZPK model using a rational function in the Laplace variable, s. • z = zpk('z',Ts) to specify a ZPK model with sample time Ts using a rational function in the discrete-time variable, z. Once you specify either of these variables, you can specify ZPK models directly as rational expressions in the variable s or z by entering your transfer function as a rational expression in either s or z. Conversion to Zero-Pole-Gain Form zsys = zpk(sys) converts an arbitrary LTI model sys to zero-pole-gain form. The output zsys is a ZPK object. By default, zpk uses zero to compute the zeros when converting from state-space to zero-pole-gain. Alternatively, zsys = zpk(sys,'inv') uses inversion formulas for state-space models to compute the zeros. This algorithm is faster but less accurate for high-order models with low gain at s = 0. Variable Selection 11-240 As for transfer functions, you can specify which variable to use in the display of zero-pole-gain models. Available choices include s (default) and p for –1 –1 continuous-time models, and z (default), z , or q = z for discrete-time models. Reassign the 'Variable' property to override the defaults. Changing the variable affects only the display of zero-pole-gain models. zpk Example Example 1 Specify the following zero-pole-gain model. 1 ----------------z – 0.3 H(z ) = 2 ( z + 0.5 ) -----------------------------------------------------------( z – 0.1 + j ) ( z – 0.1 – j ) To do this, type z p k H = = = = {[] ; –0.5} {0.3 ; [0.1+i 0.1–i]} [1 ; 2] zpk(z,p,k,–1) % unspecified sample time Example 2 Convert the transfer function h = tf([–10 20 0],[1 7 20 28 19 5]) Transfer function: –10 s^2 + 20 s ---------------------------------------s^5 + 7 s^4 + 20 s^3 + 28 s^2 + 19 s + 5 to zero-pole-gain form by typing zpk(h) Zero/pole/gain: –10 s (s–2) ---------------------(s+1)^3 (s^2 + 4s + 5) 11-241 zpk Example 3 Create a discrete-time ZPK model from a rational expression in the variable z, by typing z = zpk('z',0.1); H = (z+.1)*(z+.2)/(z^2+.6*z+.09) Zero/pole/gain: (z+0.1) (z+0.2) --------------(z+0.3)^2 Sampling time: 0.1 Algorithm zpk uses the MATLAB function roots to convert transfer functions and the functions zero and pole to convert state-space models. See Also frd get set ss tf zpkdata 11-242 Convert to frequency response data models Get properties of LTI models Set properties of LTI models Convert to state-space models Convert to TF transfer function models Retrieve zero-pole-gain data zpkdata Purpose 11zpkdata Quick access to zero-pole-gain data Syntax [z,p,k] = zpkdata(sys) [z,p,k] = zpkdata(sys,'v') [z,p,k,Ts,Td] = zpkdata(sys) Description [z,p,k] = zpkdata(sys) returns the zeros z, poles p, and gain(s) k of the zeropole-gain model sys. The outputs z and p are cell arrays with the following characteristics: • z and p have as many rows as outputs and as many columns as inputs. • The (i,j) entries z{i,j} and p{i,j} are the (column) vectors of zeros and poles of the transfer function from input j to output i. The output k is a matrix with as many rows as outputs and as many columns as inputs such that k(i,j) is the gain of the transfer function from input j to output i. If sys is a transfer function or state-space model, it is first converted to zero-pole-gain form using zpk. See Table 11-15, “LTI Properties,” on page 11-195 for more information on the format of state-space model data. For SISO zero-pole-gain models, the syntax [z,p,k] = zpkdata(sys,'v') forces zpkdata to return the zeros and poles directly as column vectors rather than as cell arrays (see example below). [z,p,k,Ts,Td] = zpkdata(sys) also returns the sample time Ts and the input delay data Td. For continuous-time models, Td is a row vector with one entry per input channel (Td(j) indicates by how many seconds the jth input is delayed). For discrete-time models, Td is the empty matrix [] (see d2d for delays in discrete systems). You can access the remaining LTI properties of sys with get or by direct referencing, for example, sys.Ts sys.inputname 11-243 zpkdata Example Given a zero-pole-gain model with two outputs and one input H = zpk({[0];[–0.5]},{[0.3];[0.1+i 0.1–i]},[1;2],–1) Zero/pole/gain from input to output... 1 #1: ------(z–0.3) #2: 2 (z+0.5) ------------------(z^2 – 0.2z + 1.01) Sampling time: unspecified you can extract the zero/pole/gain data embedded in H with [z,p,k] = zpkdata(H) z = [ 0] [-0.5000] p = [ 0.3000] [2x1 double] k = 1 2 To access the zeros and poles of the second output channel of H, get the content of the second cell in z and p by typing z{2,1} ans = –0.5000 p{2,1} ans = 0.1000+ 1.0000i 0.1000– 1.0000i 11-244 zpkdata See Also get ssdata tfdata zpk Get properties of LTI models Quick access to state-space data Quick access to transfer function data Specify zero-pole-gain models 11-245 zpkdata 11-246 Index A acker 11-11 addition of LTI models 3-11 scalar 3-12 adjoint. See pertransposition algebraic loop 11-76 aliasing 5-13 analysis models specifying 6-56 See also Simulink LTI Viewer append 3-16, 3-17, 4-29, 11-12 array dimensions 4-7 arrays. See LTI arrays augstate 11-15 axes grouping menu 6-23 B balancing realizations 5-7, 11-16, 11-216 balreal 11-16 block diagram. See model building bode (Bode Plots) 11-19 units for plots 5-12 building LTI arrays 4-12 C c2d 11-24 cancellation 11-140 canon 11-27 canonical realizations 5-7, 11-27 care 11-29 cell array 2-11, 2-14, 11-90, 11-231 chgunits 11-33 classical control 9-3, 9-20 closed loop. See feedback companion realizations 11-27 comparing models 5-13, 11-19, 11-94, 11-127, 11-134 compensators feedback 7-6 Root Locus Design GUI 8-28, 8-31, 8-41 concatenation, model 2-10 horizontal 3-17 LTI arrays 4-15, 11-219 state-space model order, effects on 3-10 vertical 3-17 conditioning, state-space models 10-4 connect 11-33, 11-34 connection feedback 9-11, 11-73 parallel 3-12, 9-54, 11-168 series 3-13, 9-15, 11-191 star product (LFT) 11-115 constructor functions, LTI objects 2-4 continuous-time 5-2, 11-104 conversion to. See conversion, model random model 11-189 control design. See design controllability gramian 11-91 matrix (ctrb) 11-43 staircase form 11-45 conversion, model automatic 2-43 between model types 2-42, 3-3, 11-212, 11-226, 11-240 continuous to discrete (c2d) 3-20, 11-24 discrete to continuous (d2c) 2-36, 3-20, 11-48 with negative real poles 3-21, 11-49 FRD model, to 2-42 resampling 3-27 discrete models 11-51 I-1 Index SS model, to 2-42 state-space, to 2-44, 11-212 TF model, to 2-42 ZPK model, to 2-42 covar 11-40 covariance error 9-56, 9-62, 11-110 noise 7-9, 11-110 output 11-40, 11-110 state 11-40, 11-110 ctrb 11-43 ctrbf 11-45 D d2c 11-48 d2d 3-27, 11-51 damp 11-52 damping 11-52, 11-200, 11-236 dare 11-54 dcgain 11-57, 11-58 delay2z 11-58 delays arithmetic operations 3-15 c2d and d2c conversions 3-25 combining 2-54, 11-234 conversion 11-58 conversion to SS 2-54 delay2z 11-58 discrete-time models 2-52 discretization 3-24 existence of, test for 11-93 hasdelay 11-93 I/O 2-26, 2-45, 2-46, 11-195 information, retrieving 2-54 input 2-26, 2-50, 11-195 output 2-26, 2-45, 2-50, 11-196 I-2 Padé approximation 2-55, 11-164 supported functionality 2-45 time 11-195 delays input 2-45 deletion parts of LTI arrays 4-23 parts of LTI models 3-9 denominator common denominator 11-78, 11-225 property 2-28, 11-197 specification 2-8, 2-10, 2-11, 2-22, 11-77 value 2-25 descriptor systems. See state-space models, descriptor deselection of items in a window 6-11 design 1-20 classical 9-3, 9-20 compensators 7-6 Kalman estimator 7-9, 9-36, 9-57, 11-108, 11-112 LQG 1-20, 7-8, 7-10, 9-31, 11-59, 11-117 pole placement 7-5, 11-11, 11-170 regulators 7-6, 7-10, 9-31, 11-117, 11-176 robustness 9-29 root locus 7-3, 9-9, 9-24 state estimator 7-5, 7-9, 11-70, 11-108, 11-112 design model 8-11, 11-187 compensator for 8-11 diagonal realizations 11-27 digital filter filt 2-23 specification 2-22, 11-77 dimensions array 4-7 I/O 4-7 Dirac impulse 11-94 discrete-time models 5-2, 11-104 Index control design 9-20 equivalent continuous poles 11-52 frequency 5-13, 11-23 Kalman estimator 9-50, 11-108 random 11-62 resampling 3-27 See also LTI models discretization 2-36, 3-20, 9-21, 11-24 available methods 11-24 delay systems 3-24 first-order hold 3-22 intersample behavior 11-129 matched poles/zeros 3-23 Tustin method 3-22 zero-order hold 3-20 dlqr 11-59 dlyap 11-61 drmodel 11-62 drss 11-62 dsort 11-64 DSP convention 11-77, 11-198, 11-228 dss 11-65 dssdata 11-67 dual. See transposition E error covariance 9-56, 9-62, 11-110 esort 11-68 estim 11-70 estimator 7-5, 7-9, 11-70, 11-108, 11-112 current 11-110 discrete 11-108 discrete for continuous plant 11-112 gain 7-6 evalfr 11-72 extraction LTI arrays, in 4-21 LTI models, in 3-5 F feedback 11-73 feedback 9-11, 11-73 algebraic loop 11-76 negative 11-73 positive 11-73 feedthrough gain 2-28 filt 2-23, 11-77, 11-79, 11-82 filtering. See Kalman estimator final time. See time response first-order hold (FOH) 3-22, 11-24 with delays 3-24 frd 11-79 FRD (frequency response data) objects 2-3, 2-18, 11-79 conversion to 2-42 data 11-82 frdata 11-82 frequencies indexing by 3-7 referencing by 3-7 units, conversion 11-33 singular value plots 11-202 uses 2-3 frdata 11-82 freqresp 11-84 frequency crossover 11-137 for discrete systems 5-13, 11-23 grid 5-12 linearly spaced frequencies 5-13 logarithmically spaced frequencies 5-13, 11-19 natural 11-52, 11-200, 11-236 I-3 Index Nyquist 5-13, 11-23 range 5-12 frequency response 2-18, 5-11 at single frequency (evalfr) 11-72 Bode plot 11-19 customized plots 5-17 discrete-time frequency 5-13, 11-23 freqresp 11-84 magnitude 11-19 MIMO 5-12, 11-19, 11-149, 11-156 Nichols chart (ngrid) 11-147 Nichols plot 11-149 Nyquist plot 11-156 phase 11-19 plotting 5-13, 11-19, 11-134 singular value plot 11-202 viewing the gain and phase margins 11-137 G gain 2-11 estimator gain 7-6, 7-9 feedthrough 2-28 low frequency (DC) 11-57 property LTI properties gain 2-28 selection 7-3, 7-6, 7-9 state-feedback gain 7-9, 11-59 gain margins 9-29, 11-19, 11-137 gensig 11-87 get 2-31, 11-89 gram 11-91, 11-93 gramian (gram) 11-16, 11-91 group. See I/O groups GUI 8-2 I-4 H Hamiltonian matrix and pencil 11-29 hasdelay 2-54, 11-93 hidden oscillations 11-129 I I/O concatenation 3-16 delays 2-26, 2-45, 2-46, 11-195 dimensions 5-2, 11-207 LTI arrays 4-7 groups 2-26 referencing models by group name 3-8 names 2-26, 2-37 conflicts, naming 3-4 referencing models by 3-8 relation 3-5 impulse 11-94 impulse response 11-94 indexing into LTI arrays 4-20 single index access 4-20 inheritance 3-3, 11-65, 11-212 initial 11-98 initial condition 11-98 innovation 11-110 input 2-2 delays 2-26, 2-45, 2-50, 11-195 Dirac impulse 11-94 generate test input signals 11-87 groups 2-26 names 2-26, 11-196 See also InputName number of inputs 5-2, 11-207 pulse 11-87, 11-94 resampling 11-129 sine wave 11-87 Index square wave 11-87 input point block 6-56 See also Simulink LTI Viewer InputDelay. See delays InputGroup 2-26, 2-27 conflicts, naming 3-4 See also I/O groups InputName 2-34, 2-36 conflicts, naming 3-4 See also I/O names interconnection. See model building intersample behavior 11-129 inv 11-101 inversion 11-101 limitations 11-102 model 3-13 ioDelayMatrix. See delay isct 11-104 isdt 11-104 isempty 11-105 isproper 11-106 issiso 11-107 K Kalman filter. See Kalman estimator filtering 7-11, 9-50 gain 7-9 kalman 11-108 Kalman estimator continuous 7-9, 9-36 current 11-110 discrete 9-50, 11-108 discrete for continuous plant 11-112 innovation 11-110 steady-state 7-9, 11-108 time-varying 9-57 kalmd 11-112 L LFT (linear-fractional transformation) 11-115 LQG (linear quadratic-gaussian) method continuous LQ regulator 7-9, 9-36, 11-121 cost function 9-36, 11-59, 11-121 current regulator 11-118 design 1-20, 7-8, 7-10, 9-31, 9-47 discrete LQ regulator 11-59, 11-123 Kalman state estimator 7-9, 11-108, 11-112 LQ-optimal gain 7-9, 9-36, 11-121, 11-123, 11-125 optimal state-feedback gain 7-9, 11-121, 11-123, 11-125 output weighting 11-125 regulator 1-21, 7-10, 9-31, 11-117 weighting matrices 7-9 lqr 11-121 lqrd 11-123 lqry 11-125 lsim 11-126 LTI (linear time-invariant) 2-2 LTI arrays 4-1 accessing models 4-20 analysis functions 4-30 array dimensions 4-7 building 4-15, 11-219 building LTI arrays 4-12 building with rss 4-12 building with tf, zpk, ss, and frd 4-17 concatenation 4-15, 11-219 conversion, model.See conversion deleting parts of 4-23 dimensions, size, and shape 4-7 I-5 Index extracting subsystems 4-21 indexing into 4-20 interconnection functions 4-25 LTI Viewer, model selector 6-28, 6-31 model dimensions 4-7 operations on 4-25 dimension requirements 4-27 special cases 4-27 reassigning parts of 4-22 SS models 4-23 shape, changing 11-179 size 4-7 stack 4-15, 11-219 LTI models addition 3-11 scalar 3-12 building 3-16 characteristics 5-2 comparing multiple models 5-13, 11-19, 11-94, 11-127, 11-134 concatenation effects on model order 3-10 horizontal 3-17 vertical 3-17 continuous 5-2 conversion 2-42, 3-3 continuous/discrete 3-20 See also conversion, model creating 2-8 dimensions 11-146 discrete 2-20, 5-2, 11-104 discretization, matched poles/zeros 3-23 empty 2-12, 5-2, 11-105 frd 11-79 frequency response. See frequency response functions, analysis 5-4 I-6 I/O group or channel name, referencing by 3-8 interconnection functions 3-16 inversion 3-13 model data, accessing 2-24, 11-218 model order reduction 5-20, 11-16, 11-142 modifying 3-5 multiplication 3-13 ndims 11-146 norms 11-152 operations 3-1, 3-2 precedence rules 3-3 See also operations proper transfer function 5-2, 11-106 random 11-62, 11-189 resizing 3-9 second-order 11-163 SISO 11-107 ss 11-211 subsystem, modifying 3-10 subtraction 3-12 time response. See time response type 5-2 zpk 11-238 LTI objects 2-26, 2-33 constructing 2-4 methods 2-4 properties. See LTI properties See also LTI models LTI properties 2-4, 2-26, 2-34 accessing property values (get) 2-31, 2-33, 11-89 admissible values 11-194 displaying properties 2-32, 11-89 generic properties 2-26 I/O groups. See I/O, groups I/O names. See I/O, names inheritance 3-3, 11-65, 11-212 Index model-specific properties 2-28 online help (ltiprops) 2-26 property names 2-26, 2-30, 11-89, 11-193 property values 2-26, 2-31, 11-89, 11-193 setting 2-30, 11-193, 11-212, 11-225, 11-240 sample time 3-3 variable property 3-4 LTI Viewer 11-133 axes grouping menu 6-23 command line initializing 6-5 file menu 6-15 frequency domain plot units 6-44 getting help 6-16 importing models 6-11, 6-15 multiselection and deselection 6-11 line properties, order 6-47 linestyle properties 6-46 LTI array selector 6-28 LTI arrays 6-28, 6-31 model selection 6-32, 6-35 menu items, selection 6-20 menus, LTI Viewer 6-15 Model Selector for LTI Arrays window 6-28 opening a new 6-16 plot options 6-7, 6-9 plot types changing 6-19 selection 6-20 printing 6-16 refreshing systems 6-16 response characteristics 6-9, 6-43 response preferences, setting 6-40 right-click menus 6-7 MIMO models 6-21 selecting a menu item 6-20 SISO models 6-18 rise time 6-43 select I/Os menu 6-26 settling time 6-43 Simulink models. See Simulink LTI Viewer systems, deselecting 6-19 systems, selecting 6-19 Tools menu 6-39 Viewer Configuration menu 6-39 zooming 6-12 ltiview 11-133 lyap 11-135 Lyapunov equation 11-41, 11-92 continuous 11-135 discrete 11-61 M map, I/O 3-5 margin 11-137 margins, gain and phase 9-29, 11-19, 11-137 matched pole-zero 11-24 methods 2-4 MIMO 2-2, 3-17, 5-10, 5-12, 11-94 minreal 11-140 model building 3-16 appending LTI models 11-12 feedback connection 9-11, 11-73 LFT connection 11-115 modeling block diagrams (connect) 11-34 parallel connection 3-12, 9-54, 11-168 series connection 3-13, 9-15, 11-191 model dynamics, function list 5-4 Model Inputs and Outputs block set 6-51 model order reduction 5-20, 11-16, 11-142, 11-209 Model Selector for LTI Arrays window 6-28 modeling. See model building modred 11-142 I-7 Index multiplication 3-13 scalar 3-13 multiselection of items in a window 6-11 N natural frequency 11-52 ndims 11-146 ngrid 11-147 Nichols chart 11-147 plot (nichols) 11-149 nichols 11-149 noise covariance 7-9, 11-110 measurement 7-8, 11-70 process 7-8, 11-70 white 5-9, 7-8, 11-40 norm 11-152 norms of LTI systems (norm) 11-152 Notes 2-27 numerator property 2-28, 11-197 specification 2-8, 2-10, 2-11, 2-22, 11-77 value 2-25, 11-90 numerical stability 10-6 Nyquist frequency 5-13, 11-23 plot (nyquist) 11-156 nyquist 11-156 O object-oriented programming 2-4 objects. See LTI objects observability gramian 11-91 I-8 matrix (ctrb) 11-159 staircase form 11-161 obsv 11-159 obsvf 11-161 operations on LTI models addition 3-11 append 3-17 append 11-12 arithmetic 3-11 augmenting state with outputs 11-15 concatenation 2-10, 3-10, 3-17 diagonal building 11-12 extracting a subsystem 2-6 inversion 3-13, 11-101 multiplication 3-13 overloaded 2-4 pertransposition 3-14 precedence 3-3 resizing 3-9 sorting the poles 11-64, 11-68 subsystem, extraction 3-5 subtraction 3-12 transposition 3-14 ord2 11-163 output 2-2 covariance 11-40, 11-110 delays 2-26, 2-45, 2-50, 11-196 groups 2-26 names 2-26, 11-196 names. See also OutputName number of outputs 5-2, 11-207 output point block 6-56 See also Simulink LTI Viewer OutputDelay. See delays OutputGroup 2-26, 2-27 group names, conflicts 3-4 Index See also I/O, groups OutputName 2-34 conflicts, naming 3-4 See also I/O, names overshoot 5-9 P pade 11-164 Padé approximation (pade) 2-55, 11-164 parallel 11-168 parallel connection 3-12, 9-54, 11-168 pertransposition 3-14 phase margins 9-29, 11-19, 11-137 place 11-170 plot configuration, LTI Viewer 6-39 plotting customized plots 5-17 frequency response. See frequency response multiple systems 5-13, 11-19, 11-94, 11-127, 11-134 Nichols chart (ngrid) 11-147 s-plane grid (sgrid) 11-200 time responses 5-9 See also time response 5-9 z-plane grid (zgrid) 11-236 pole 11-172 pole placement 7-5, 11-11, 11-170 conditioning 7-7 poles 2-12 computing 11-172 damping 11-52, 11-200, 11-236 equivalent continuous poles 11-52 multiple 11-172 natural frequency 11-52, 11-200, 11-236 pole-zero map 11-173 property 2-28 sorting by magnitude (dsort) 11-64 sorting by real part (esort) 11-68 s-plane grid (sgrid) 11-200 z-plane grid (zgrid) 11-236 pole-zero cancellation 11-140 map (pzmap) 11-173 precedence rules 2-5, 3-3 proper transfer function 5-2, 11-106 properties sample time 3-3 variable 3-4 properties. See LTI properties pulse 11-87, 11-94 pzmap 11-173 R random models 11-62, 11-189 realization state coordinate transformation 5-7, 11-28, 11-215 realizations 5-7, 11-212 balanced 5-7, 11-16, 11-216 canonical 5-7, 11-27 companion form 11-27 minimal 11-140 modal form 11-27 Redheffer star product 11-115 See also LFT reduced-order models 5-20, 11-16, 11-142 regulation 1-20, 7-8, 9-31, 11-176 performance 7-9 resampling 3-27 resampling (d2d) 11-51 reshape 11-179 response characteristics 6-43 I-9 Index See also LTI Viewer response preferences, setting 6-40 response, I/O 3-5 Riccati equation 7-9 continuous (care) 11-29 discrete (dare) 11-54 for LQG design 11-110, 11-121 Η∞-like 11-31 stabilizing solution 11-29, 11-54 right-click menus LTI arrays 6-28 right-click menus, LTI Viewer 6-7 See also LTI Viewer, right-click menus rise time 5-9 rlocfind 11-180 rlocus 11-182 rltool 11-179, 11-185 rmodel 11-189 robustness 9-29 root locus design 7-3, 9-9, 9-24 plot (rlocus) 11-182 select gain from 11-180 See also Root Locus Design GUI Root Locus Design GUI 7-3, 8-1, 11-185 add grid/boundary 8-24 axes settings 8-19 clearing model and compensator data 8-46 compensators 8-11, 11-187 editing 8-3, 8-28, 8-31, 8-41 configuration, design model 8-10, 11-187 continuous to discrete model conversion 8-3, 8-38, 8-45 controller design 8-6 design model 8-11 design region boundaries 8-24 design specifications 8-35 I-10 discrete to continuous model conversion 8-3, 8-38, 8-45 drawing a Simulink diagram from 8-44 feedback structure 8-10, 11-187 gain set point 8-13 importing models 8-7, 8-9 listing poles and zeros 8-41 model source 8-38, 8-39 opening 8-6 printing 8-28 toolbar 8-28 zoom tools 8-16 zooming 8-15 Root Locus Design GUI compensators editing 8-3 rss 11-189 building an LTI array with 4-12 S sample time 2-20, 2-26, 2-27, 2-34, 3-3 accessing 2-24, 11-218 choices of for plotting 5-11 resampling 3-27, 11-51 setting 2-36, 11-195, 11-225, 11-239 unspecified 2-27, 11-23 scaling 10-15 second-order model 11-163 select from LTI array menu 6-28 select I/Os menu 6-26 series 11-191 series connection 3-13, 9-15, 11-191 set 2-30, 11-193 settling time 5-9 signal generator 11-87 simulation of linear systems. See time response Simulink LTI Viewer 6-48, 6-50 Index analysis models 6-50 clearing 6-53 open and closed loop 6-56 saving 6-65 specifying 6-53, 6-56 input point blocks 6-53 linearizing models 6-53, 6-63 opening 6-50 operating conditions, changing 6-61 operating conditions, setting 6-58 operating points 6-53 output point blocks 6-53 Simulink menu 6-53 specifying models for 6-51 sine wave 11-87 singular value plot (bode) 11-202 SISO 2-2, 5-2, 8-2, 11-107 size 11-207 sminreal 11-209 square wave 11-87 ss 2-15, 11-211 SS objects. See state-space models stability numerical 10-6 stabilizable 11-31 stabilizing, Riccati equation 11-29, 11-54 stack 4-15, 11-219 star product 11-115 state 2-14 augmenting with outputs 11-15 covariance 11-40, 11-110 estimator 7-5, 7-9, 11-70, 11-108, 11-112 feedback 7-5, 11-59 matrix 2-28 names 2-29, 11-196 number of states 4-10, 11-207 transformation 5-7, 11-28, 11-215 uncontrollable 11-140 unobservable 11-140, 11-161 vector 2-2 state-space models 2-2, 2-3, 10-8 balancing 5-7, 11-16, 11-216 conditioning 10-4 conversion to 2-42 See also conversion descriptor 2-16, 2-24, 11-65, 11-67 dss 11-65 initial condition response 11-98 matrices 2-15 model data 2-15 order reduction. See model order reduction quick data retrieval 2-24, 11-67, 11-218 random continuous-time 11-189 discrete-time models 11-62 realizations 5-7, 11-212 scaling 10-15 specification 2-14, 11-211 ss 2-15, 11-211 transfer functions of 2-42 steady state error 5-9 step response 11-220 subsystem 2-6, 3-5 subsystem operations on LTI models subsystem, modifying 3-10 subtraction 3-12 Sylvester equation 11-135 symplectic pencil 11-55 T Td. See delays tf 2-8, 11-224 TF objects. See transfer functions I-11 Index tfdata output, form of 2-24 time delays. See delays time response 5-9 customized plots 5-17 final time 5-10, 11-94 impulse response (impulse) 11-94 initial condition response (initial) 11-98 MIMO 5-10, 11-94, 11-126 plotting 5-13, 11-94, 11-127, 11-134 response to arbitrary inputs (lsim) 11-87, 11-126 step response (step) 11-220 time range to white noise 5-9, 11-40 vector of time samples 5-10 time-varying Kalman filter 9-57 totaldelay 2-54, 11-234 transfer functions 2-2, 2-3, 10-8 common denominator 11-78, 11-225 constructing with rational expressions 2-9 conversion to 2-42 denominator 2-8 discrete-time 2-20, 2-22, 11-77, 11-198, 11-228 DSP convention 2-22, 11-77, 11-198, 11-228 filt 2-23, 11-77 MIMO 2-10, 3-17, 11-224 numerator 2-8 quick data retrieval 2-24, 11-231 random 11-62, 11-189 specification 2-8, 11-224 static gain 2-11, 11-225 tf 2-8, 11-224 TF object, display for 2-9 variable property 2-28, 3-4, 11-198, 11-228 transmission zeros. See zeros I-12 transposition 3-14 triangle approximation 3-22, 11-24 Ts. See sample time Tustin approximation 3-22, 11-24 with frequency prewarping 3-23, 11-24 typographic conventions 5 tzero. See zero U undersampling 11-129 Userdata 2-27 V variable property 3-4 Viewer Configuration 6-39 W white noise 5-9 See also noise Z zero 11-235 zero-order hold (ZOH) 3-20, 9-21, 11-24 with delays 3-24 zero-pole-gain (ZPK) models 2-2, 2-3, 10-14 conversion to 2-42 MIMO 2-13, 3-17, 11-239 quick data retrieval 2-24, 11-243 specification 2-12, 11-238 static gain 11-239 zpk 2-12, 11-238 zeros 2-12 computing 11-235 Index pole-zero map 11-173 property 2-28 transmission 11-235 zooming LTI Viewer 6-12 Root Locus Design GUI 8-15 zpk 2-12, 11-238 ZPK objects. See zero-pole-gain (ZPK) models zpkdata output, form of 2-24 I-13