1
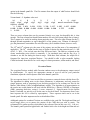
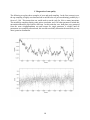
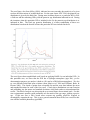
The next figure, also from Jeffery (2009), indicates how one can study the sensitivity of a given
result to the observations of an individual star. For the open cluster NGC 2360, the posterior age
distribution is given by the black line. During some iterations, however, a particular WD is fit as
a field star and the remaining WDs yield the posterior age distribution indicated in red. During
the iterations when this particular WD is included in the fit, the posterior age distribution is as
indicated in blue. The final age posterior distribution is a linear combination of these two
distributions based on the fraction of time this particular WD was included in the fit.
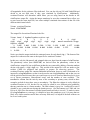
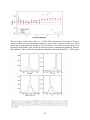
The next figure shows unpublished work based on applying BASE-8 to an individual WD. In
this particular case, we know that the WD has a hydrogen atmosphere (type DA), yet for
demonstration purposes we analyze it both as a DA and as a DB (helium atmosphere). We also
try two different initial-final mass relations (from Salaris et al. 2009 and Williams, Bolte, &
Koester 2009). The clouds of points show acceptable fits and the error bars indicate the mean
and standard deviation for each of the four cases. Clearly these distributions are non-Gaussian
and publishing just the means and standard deviations could lead readers to misunderstand the
results. This kind of analysis can also point the way toward future observational work. For this
star a trigonometric parallax could potentially rule out much of the age range, yielding a precise
age. If this star were a DB a much more accurate trig parallax would be required to
meaningfully constrain the age. This is not a general statement about WDs, but a result for this
star with the available photometry (grizJHK).
21