1
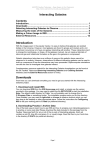
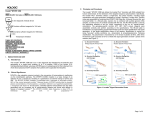
Version 2.0
Date: 7/10/2004
Report # 13
Pathway Viewer Tool
User Manual
Center for Computational Genomics
Division of Computer Science
EECS Department
Case Western Reserve University
Cleveland, OH 44106
Department of Genetics
Case Western Reserve University
Cleveland, OH 44106
1. Pathways System – Pathway Visualization Tool
Living organisms behave as complex systems that are flexible and adaptive to their surroundings.
At the molecular level, organisms consist of intricate networks of molecular reactions, which are
often called “biochemical pathways”. In order to maintain, visualize, and ultimately, analyze
organism functions that result from biochemical pathways, the Genome Pathways System is
being developed. The system contains a pathways database and the associated tools to store,
compare, query, and visualize biochemical pathways. The aim is to develop an integrated
database, and the associated tools to support computational analysis and visualization of
biochemical pathways. The ultimate goal of the system is to describe, utilize and predict systems
functions and behaviors of living organisms. As of July 2004, the components that the project is
comprised of are as follows:
•
•
•
•
•
Pathway Browser (Windows and .Net)
Pathway Viewer, including Genome Viewer (Windows and .Net)
Pathway Editor (Windows and .Net)
Pathway Explorer (Windows and .Net)
J-Pathway Viewer (Unix, Macintosh, Windows, and Java)
To better understand the chemical interactions taking place in nature, biologists need mechanisms
to visualize pathways and processes. Towards this goal, a graphical interface is developed, which
allows formulating queries using graphical icons as well as visualizing query outputs in the form
of graphs in various abstraction levels. For example, the user can have a pathway graph drawn,
showing as many details as he/she chooses. Or, the user can have a pathway graph showing the
inter-connections of different pathways where some pathways may be abbreviated as nodes, as
opposed to sub-graphs. The goal of the pathway visualization is to facilitate data discovery by
providing a robust collection of visualization capabilities.
This user manual describes the Pathway Viewer only. The Pathway Browser Tool is a tool that
hierarchically lists the pathways, processes, and molecular entities in the database, and allows
users to (a) view textual information, and (b) launch the pathway viewer that visualizes pathway
graphs.
The Pathway Viewer of the Pathway System provides a visual interface to biochemical pathways
stored in the underlying database. The Pathway Viewer is basically a graph drawing,
manipulation querying, and storage tool. Pathway Viewer provides an intuitive and highly visual
means for biochemists to study, query, save/open, and curate biological pathways. The tool
supports ad-hoc querying of the pathways data as well as menu-driven queries. Figure 1 shows
the Pathway Browser user interface and how to draw a pathway or a process by the Pathway
Viewer. A graph can be drawn in an internal window, which is at the lower-right area of the
Pathway Browser, or drawn in a separate window.
2
Figure 1. The Pathway Browser user interface and how to invoke Pathway Visualization Tool
facility.
Textual results of queries are displayed in the upper right window, as illustrated in Figure 1. Also,
separate multiple external windows can display multiple pathway graph visually. For example, by
clicking the view the pathway graph check box in the query form of Query | Pathways |Paths of
Length Two or Less from Given Molecular Entity, a pathway graph is drawn in a separate
window showing the query results (Figure 2).
3
Figure 2. Query result may be displayed as a graph.
This manual describes the features of the Pathway Viewer. However, we also briefly illustrate the
features of the Pathway Browser since it is first used to select pathways for the Pathway Viewer
to display. Section 2 describes the main menu options. Section 3 describes the pop-up menu
options. Section 4 describes the toolbar options. Section 5 discusses the overview window.
Section 6 explains the object properties window. Section 7 depicts the common molecules/split
molecules window. Section 8 depicts the main display window. Section 9 explains the Genome
Viewer. Finally, section 10 depicts the status bar.
1.1 Definitions of commonly used terms:
Pathway: Pathways are the sequential and cumulative actions of genetically distinct, but
functionally related, molecules. They consist of processes (reactions), which in turn consist of
molecular entities. Each process in each pathway begins with specific substrates, uses various
combinations of cofactors, activators, inhibitors and regulators, and ends with products that are
chemically modified substrates.
Molecular Entity: The general name given to any entity participating in a process.
Catalyzing Protein: The enzyme that catalyzes any reactions.
EC Number: Enzyme Commission (EC) number describes the type of catalytic activity of the
enzyme. A single protein can have more than one catalytic function, thus multiple EC numbers.
Substrate: A molecular entity, which is an input to a chemical reaction (process).
Product: A molecular entity, produced as a result of a reaction (process).
Co-factor In: A molecular entity that participates as a secondary input to a chemical reaction,
and results in a secondary output (cofactor-out) to the reaction.
4
Co-factor Out: A molecular entity that is produced as a secondary output of a chemical reaction.
Activator: A molecular entity that activates a reaction.
Inhibitor: A molecular entity that binds to an enzyme, and interferes with its activity by
preventing the formation of the enzyme-substrate complex or its breakdown into enzyme and
product.
Regulator: Either an activator or an inhibitor that regulates a reaction, or the function of the
molecule is unknown at the present time.
Process: Any reaction involving molecular entities. A process has zero (i.e., a non-enzymatic
process) or one catalyzing enzyme, one or more substrates and products, zero or more co-factorins, co-factor-outs, inhibitors, or activators. A sample process is drawn in Figure 3. The substrates
of the process are indicated by circular nodes at the top; products are also indicated using circular
nodes at the bottom. The oval shaped nodes on the right side indicate cofactor-ins and cofactorouts. The red T-shaped nodes on the left hand side indicate inhibitors; the green horizontal lines
on the left hand side indicate activators; and the blue line with arrow head indicates regulators.
The catalyzing protein is indicated using a square shaped node at the center of the process. When
the mouse is pulled over to the enzyme node, the enzyme name is displayed. Processes can be
reversible or irreversible.
substrate
cofactor-ins
regulators
activators
enzyme
inhibitors
cofactor-outs
product
Figure 3. A process and its associated molecular entities.
Common Molecules: In pathways, common molecules such as H2O, CO2, PI, O2 appear in
multiple processes. Connecting multiple processes due to common molecules makes the graph
visually cluttered. Therefore, for each occurrence of a common molecule, an independent node is
created and drawn in the respective process.
5
Collapsed Process: Collapsing a process hides all activators, inhibitors, regulators, cofactor-ins,
and cofactor-outs. Collapsing a process graph displays the remainder of the pathway graph as is
(Figure 4).
Expanded Process: Expanding a process re-displays the process graph (i.e. activators, inhibitors,
regulators, cofactor-ins, cofactor-outs and catalyzing protein nodes) associated with the process
node. Since it changes the size of the pathway graph, a layout algorithm is applied after the
expansion of a process.
Invisible Nodes: Invisible nodes do not represent any molecular entities, and, hence, are made
invisible. They serve the purpose of retaining the relationship between substrates, the catalyzing
protein and products by connecting substrate nodes to the catalyzing protein node, and catalyzing
protein node to product nodes.
Hierarchical Layout: The hierarchical layout draws the molecular creation/precedence
relationships in a pathway graph hierarchically. It emphasizes hierarchical dependencies by
placing graph nodes at different levels. The hierarchical style offers a wealth of features,
including the tailoring options, constraints and edge routing.
Edge Routing: Arc shaped edges require multiple points to be defined. Edges are routed through
all these points to give the edge an arc shape.
Figure 4. Expanded process and collapsed process. All involved molecules are drawn in the
expanded view (left). After the process is collapsed, the process is drawn as single node with
the EC number.
Organisms and Organism Groups:In the current database, following the Biochemical Pathways
Atlas [MG98], we have three organism groups, namely, animals, plants (and yeasts), and
6
prokarya, and an additional organism group general for processes that exist in general pathways.
A process in a general pathway refers to a process that is common to all organism groups. We
grouped processes that exist in any one or more organism groups, but not necessarily common to
all, under the organism group unspecified. Finally, as specific organisms we have mouse and
human.
Pathways Database System consists of the following components (see figure 1):
• Main Menu Bar (at the top)
• Pathway Browser: tree View of Pathways, Processes, and Molecular Entities (Left
window)
• Query output window (Upper right window): Displays the textual output of queries.
• Pathway Visualization window (lower right window): This window is managed by the
Pathway Viewer as an “internal” window.
The Pathway Viewer consists of the following components:
1. Main Menu Bar
2. Toolbar
3. Overview/Object Properties Window – the overview window provides a read-only view of the
entire main display graph, with a movable marquee rectangle indicating the region displayed in
the active window. Object Properties window provides an object properties inspector, which
displays the properties of selected graph objects. Some of the properties such as node and edge
color may be edited through this window. It can be hidden and displayed as need from both
Menu|Options|Hide/Show Overview and Inspector and the toolbar.
4. Common Molecules/Search Window – the tab for setting common molecules and searching
molecules on the graph.
5. Main Display Window - the active main display window that provides editing.
6. Genome Viewer – the tool to draw genes on chromosomes. It can be hidden and displayed as
need from Menu|Options|Hide/Show Gene Window.
7. Status Bar – the bar display pathway name and current selected organism. Right click on the
current selected organism will lead the popup menu to reset the organism. It can be hidden and
displayed as need from Menu|Options|Hide/Show Status Bar.
The overview window and the object properties window can be resized by dragging their border
or hidden from the main menu by selecting Options | Hide/Show overview and inspector.
Figure 5 shows the Pathway Viewer and its above-listed 7 components.
7
a
b
c
d
e
f
g
h
i
j
k
1
2
3
5
6
7
4
Figure 5. The Pathway Visualization tool interface with its five components: main menu bar,
toolbar, overview/property window, common molecules window, main display window,
Genome Viewer, and status bar.
The toolbar contains, in addition to the usual options such as opening a file, the following toolbar
buttons:
a. Select – Selects a set of graphic objects.
b. Mouse Pan – Moves the graph up/down on the canvas.
c. Marquee Zoom – Marks a section/area to zoom in.
d. Interactive Zoom – Zooms in or zooms out the entire graph.
e. Create Nodes – Adds nodes to the main display window.
f. Create Edges – Adds edges to the main display window.
g. Hierarchical Layout – Draws the graph hierarchically.
h. Symmetric Layout – Draws the graph symmetrically.
i. Fit In Window – Makes the graph fit in window.
j. Expand View – Displays/hides regulatory factors and cofactors.
k. Hide/Display common molecules – hides/unhides all common molecules on the graph.
l. Overview/Property Window – hides/displays the overview window and property
window on the left pane
8
l
2. Main Menu Options
The pathway viewer provides the following pull-down menus:
• File
• Tools
• Layout
• Actions
• Options
• Helps
These menus provide multiple options as indicated below:
File menu options: See Figure 6.
Figure 6. The File main menu items.
•
•
•
Open – Opens an existing .tom graph in the main display window. A .tom file uses the
text format and contains information about the position, dimensions, and view object
specifications for each element of the graph.
Save As – Saves the pathway graph displayed in the main display window as a .tom file
locally. By default, the name of the file is the pathway name/process name.
Print Setup – Sets up various print options. Users can print either the whole graph, or the
window on which the input focus is, or selected area/nodes & edges. The print setup
options are as shown in Figure 7.
9
•
•
Print Preview – Displays an image of how the output pages look like if they are printed.
Exit – Exits the graph drawing applications.
Figure 7. Print setup options.
Tools menu: The various tools provided under “Tools” menu are as shown in Figure 8.
•
•
•
•
Select – Selects a node, edge or an area containing a set of nodes and/or edges of the
graph. Multiple nodes/edges can be selected by pressing the control key down and
selecting the objects. A rectangle area is selected by pressing the mouse, and dragging
over the area that needs to be selected. After Select menu item is selected, the graph
object properties are shown in the object properties window.
Pan – Moves the graph on the canvas up/down/left/right. It allows the user to manually
drag the focal point of the display graph. After selecting this item, a picture of a hand
appears on the screen. Pressing down the left mouse button and dragging the hand
upwards moves the graph upwards on the canvas, and dragging the hand downwards
moves the graph downwards on the canvas.
Marquee Zoom – Selects an area of the graph and zooms into it. It creates a marquee
that allows the user to enlarge and focus in on the view of a selected rectangular area.
When the user releases the left mouse button, the selected area becomes the new viewing
area.
Interactive Zoom – Zooms in/out the graph. After this tool is selected, a magnifying
glass picture appears. While pressing down the left mouse button, dragging the
magnifying glass upwards zooms out, and dragging the magnifying glass downwards
zooms into the graph.
For Pan, Marquee Zoom or Interactive Zoom tools, the user needs to left-click on any
object on the main display window, hold the left mouse button, and move or drag the
10
•
•
mouse over objects. The difference between Marquee Zoom and Interactive Zoom is that
Marquee tool zooms into the selected area, and the interactive tool zooms into the whole
graph.
Create Node – Creates nodes in the current graph.
Create Edge – Creates edges in the current graph.
Figure 8. The Tools main menu items.
Layout menu: Pathway Viewer supports only the hierarchical layout and Symmetric layout at
present. The hierarchical layout style shows the precedence relationships in a graph, and is
commonly used to represent organizational dependencies, process models, software call graphs,
workflows, and information management system dependencies. The hierarchical layout algorithm
divides the nodes of a graph into levels. It then directs edges from levels with lower level
numbers (topmost levels in a top-down drawing) to levels with higher level number (bottommost
levels in a top-down drawing). If the graph has cycles, a minimal number of edges are chosen to
point against the overall flow. Then the nodes in each level are sorted such that the number of
edge crossings is small. Finally, the exact node positions are determined, and the edges are
routed. The hierarchical algorithm’s constraint system gives precise control over the final
drawing, and emphasizes dependencies by placing a graph’s nodes at different levels.
The symmetric layout style produces graph layouts that emphasize the symmetries inherent in a
graph’s topology. Cofactors and regulatory factors are hidden after symmetric layout.
Actions menu: The options under Actions menu are as shown in Figure 9.
11
Figure 9. The Actions main menu items.
•
•
•
•
•
•
Hide Selected – Hides selected graph objects. Hiding a node simply makes the node as
well as its connected edges invisible. The node and its associated edges are still in the
graph, but just not shown on the canvas. Hidden nodes and edges can later be unhidden.
In a visualization of a very large graph, details may make the graph difficult to
understand. Hiding common molecules such as H2O and CO2 makes the pathway graph
compact and neat.
Unhide All – Unhides all the nodes/edges.
Fold Selected – Folds the selected parts of the pathway graph. Folding removes a
selected set of nodes from a graph, and inserts them into a newly created fold graph that
contains the graph objects to be folded. The selected part of the graph is folded and a fold
sign appears on that part of the graph. Folding lets users remove and reintroduce graph
objects, and allows them to view the removed graph objects in a separate folder node. A
folder node containing the removed items can itself be folded into another folder node
along with other nodes and edges. Unfolding allows nested reintroduction of items that
previously were folded into the folder node (Figure 10 and 11).
Unfold Selected – Unfolds the selected folded part of the pathway graph.
Unfold All – Unfolds all the folders on the pathway graph.
Fit in Window – Fits the entire graph into the current window. After resizing the main
display window, the graph automatically fits the window.
12
Figure 10. Before folding a set of nodes.
Figure 11. After folding a set of nodes, a new node with name “pathway xyz” replaces the
selected nodes.
13
Figure 12. The Options main menu items.
Options menu: allows various toggle operations and changing of the nodes/edges colors. The
options under the Options menu are as shown in Figure 12.
• Hide/Unhide All Cofactors – Hides/unhides all cofactors.
• Hide/Unhide All Regulatory Factors – Hides/unhides all activators, inhibitors,
regulators.
• Common Molecules–Hides or Displays common molecules on the graph. To check the
current common molecule list or delete a molecule from the list, use the Common
Molecules tab on the Overview/Property Window (Figure 13 a, b). To add a molecule to
the common molecule list, use the popup menu from the graph (Figure 14).
• Hide/Show Overview And Inspector – Hides/displays the Overview/Property window.
• Hide/Show Gene Window – Hides/displays the Genome Viewer window.
• Hide/Show Status Bar – Hides/displays the status bar on the bottom of the graph, which
displays the current selected organism and the pathway name.
• Set Substrate/Product Node Color – To change all substrate and product node color as
preferred.
• Set Substrate Edge Color – Changes all substrate edge colors as preferred.
• Set Product Edge Color – Changes all product edge colors as preferred.
• Display Connected Pathways – Displays other pathways that are connected to this
pathway by sharing (consuming or producing) a molecule.
• Connected/Disconnected Processes Involved in Cofactor and enzyme – leads to the
sub menu items that connect/disconnect processes that are not connected to the main
graph.
14
•
•
Turn On/Off Regulatory Factor Editing – Turns on/off the activator/inhibitor/regulator
rectangle editing. The default is “turned-off”. After turned on, the system allows the
movement of regulatory nodes, change color, etc.
Reset Regulatory Factor Nodes – Resets the regulatory factors and makes they aligned
with the process nodes neatly.
a
b
Figure 13. The Tab open the common molecules window (a) and delete a molecule from the
list (b).
15
Figure 14. The pop-up window that defines common molecules. The user may add molecules
into the common molecule list.
16
3. Graph Pop-Up Menu Options
Based on the graph right-clicked object from the main active window, different popup menus are
displayed.
3.1 Substrate or product node pop-up menu options:
• Queries (Figure 15)
o Synonyms of this molecular entity – list all the synonyms of this molecules in
result panel of the main form
o Pathway and Process involving this molecular entity-- list all the processes
and pathways involved in this molecules in result panel of the main form
• Graph Manipulations
o Display all processes consuming or producing this molecule – the graph
window draws all processes related to this molecule.
o Set this molecule as common molecule – set this molecule as common molecule
if it is not a common molecule
Figure 15. The popup menu over a node. Depending on the node type (substrate, product,
enzyme or process), different menu items may show. The figure shows the menu items after
right-clicking a substrate/product node.
17
3.2 Enzyme or process node pop-up menu options (Figure 16):
•
•
Queries
o Synonyms of this molecular entity – list all the synonyms of this molecules in
result panel of the main form
o List all genes involving this process-- list all genes in the selected organisms
involved in this process in result panel of the main form (Figure 17)
Graph Manipulations
o Draw human genes of this process in GeneViewer –draw and highlight all
human genes involved in this process in the Genome Viewer window.
o Draw mouse genes of this process in GeneViewer –draw and highlight all
mouse genes involved in this process in the Genome Viewer window.
Figure 16. The popup menu over an enzyme or a process node.
18
Figure 17. The interaction between the upper right window of the pathway browser and the
pathway viewer. After clicking popup menu items, the upper right window of the pathway
browser displays the output table for the associated queries.
3.3 Edge pop-up menu options (Figure 18):
•
•
Delete all bend points – Delete all be points of this edge. Make the edge a straight line.
Split the substrate or product node this edge connects to -- Splitting a node shared by
multiple processes may improve the graphic representation. This splitting can be done by
heuristics and/or under the direct control of the user. This way, the user can select to view
the pathway with or without controlled redundancy. The split molecules are added into
the Split Molecules panel in the Common Molecules Tab (Figure 19). To delete a split
molecule, just select the molecule from the Split Molecules List and click Merge.
19
Figure 18 . The popup menu over an edge.
Figure 19 . After split the molecule “SAH” from the graph, this molecule is added into
the Split Molecules List.
20
4. Tool Options
The various options provided in the Main Menu can be used by pulling up the appropriate menu
option or by using tools. Following are the tools provided by the Pathway Viewer.
File :
•
•
•
•
Open – Opens a graph file.
Save – Saves the current graph file.
Print – Prints the current graph file.
Print Preview – Prepares a print preview of the file.
Tools :
• Select – Selects a set of node(s)/edge(s). Multiple nodes/edges can be selected by
pressing the control key down and selecting the objects. A rectangle area is selected by
pressing the mouse and dragging over the area that needs to be selected.
• Mouse Pan – Moves the graph up/down on the canvas. After selecting the mouse pan,
the picture of a hand appears on the screen. Pressing down the left button of mouse and
dragging the hand upwards moves the graph upwards on the canvas, and dragging the
hand downwards moves the graph downwards on the canvas.
• Marquee Zoom – Marks a section/area to zoom in (Figure 20 and 21).
Figure 20. Marquee zoom to select a working area.
After the selection of the area is over, the screen in Figure 23 appears:
21
Figure 21. After selecting a working area by marquee zoom tool.
•
Interactive Zoom – Zooms in/out of the entire graph. After the interactive zoom is
selected, a magnifying glass picture appears. Pressing down the left button of mouse, and
dragging the magnifying glass upwards zooms out, and dragging the magnifying glass
downwards zooms into the graph. Figure 22 and 23 illustrate the zoom in and zoom out.
•
•
•
Create Node
Create Edge
Fit In Window
22
Figure 22. Graph zoos out.
Figure 23. Graph zoom in. The overview window displays a rectangle to indicate the
currently displayed area in the main active window.
23
Layout:
• Hierarchical layout – layout the graph hierarchically.
• Symmetric layout – layout the graph symmetrically.
Options:
• Hide/Display cofactor and Regulatory factors – To toggle all cofactors and regulatory
factors on the graph.
• Hide/Unhide common molecule – Hide or display the common molecules on the graph.
• Hide/Display Overview Inspector window – To toggle the overview and property
window on the left pane.
24
5. Overview Window
The upper leftmost corner of the main window is the overview window. It gives an overview of
the graph. The square appearing in this window indicates the graph portion that we are observing
inside the graph window. Figure 24 illustrates selection in the overview window.
Figure 24. The overview window and the main display window. The overview window displays
a rectangle to indicate the currently displayed area in the main active window.
Users can view larger portions of the graph by just stretching the square appearing in the
overview window. Also users can move/view different portions of the graph by just moving the
square inside this overview window to different areas. Figure 25 illustrates with an example.
25
Figure 25. The overview window and the main display window. The overview window
displays a rectangle to indicate the currently displayed area in the main display
window.
Users may resize the overview window and the inspector window horizontally by dragging and
moving the splitters between the overview window and the main window, and by vertically
dragging and moving the splitter between the overview window and the inspector window. Users
can hide the overview window and the inspector window to make a bigger working area by using
the menu “Options| Hide/Show overview and inspector”.
26
6. Inspector (Object Properties) Window
The window appearing below the overview window is the object property window. This window
indicates the properties of the selected object (visual properties as well as Molecular Entity
details). For example if a reaction node is selected, the properties shown in figure 26 are
displayed. Users can change the visual properties of the selected object using the object properties
window.
Figure 26. The inspector window and the main display window. Some of the properties
of the graph object may be set through the inspector window.
27
7. Common Molecules and Split Molecules Window
The Common Molecules and Split Molecules Window can be bringing to front by clicking the
Common Mols tab on the Over/Property window. It consists of 3 components: the search for an
entity pane, Common Molecules, and Split Molecules (Figure 27).
Figure 27. The Common Molecules and Split Molecules Window consists of 3
components: the search for an entity pane, Common Molecules, and Split Molecules.
From the search for an entity, you can search the entity on the graph. Choose a molecule
or a process from the dropdown list and click Search, the entity is highlighted on the
graph with different color (Figure 28).
28
Figure 28. Search for an entity on the graph.
The Common Molecules window lists current common molecules. You can delete selected
molecules from the list. The Split Molecules Window lists current split molecules. You can
merge the selected molecule. Please see the Main Menu section for details.
29
8. Main Display Window
The right portion of the pathway viewer displays the visualization graph of the selected pathway
or process.
Add Node/Edge:
• Nodes can be added to the main graph window by using “Create Node” in the tools menu
or by clicking the tool bar icon.
• Users can set the node/edge properties such as shape, color by using the inspector
property window.
Delete Graph Objects:
• Users can delete a set of node/edge by first selecting the graph object with “Select” tool
and pressing the delete key on the keyboard.
• After deleting an object, all the information associated with the object is lost. Therefore,
this function must be used with care.
Move or Delete a Subgraph:
• A subgraph is defined by selecting a rectangle area on the active window.
• After selecting a subgraph, it can be moved or deleted as a unit.
Tool tips:
• When users move the mouse over a graph object, a tool tip is shown.
For a pathway graph, the tool tip shows the source of the pathway. For a process, the tool tip
shows the process name.
30
9. Genome Viewer Window
The Genome Viewer draws the genes involved in a pathway in an organism. It can hide and
displayed from the Option menu. At present, only human and mouse genes are available. Users
can select species from the top dropdown list. From the second dropdown list, users can select a
gene. After a gene is selected from the list, the gene is highlighted in the Genome Viewer by
changing color to red. In addition, the processes that this gene product involved in are highlighted
on the graph by changing the process node to pink (Figure 29). After users click on a gene on the
Genome Viewer pane, the detail information of the clicked gene is shown on the Query Result
Panel of the Pathway Browser and the processes that use this gene are highlighted on the mina
display window. Currently, only Folate and Homocysteine pathway has complete human and
mouse gene data [KT03]. The remaining pathways data is from the Gene Atlas [MG98] where
instead of specific organisms, organism groups, (e.g. animal, plants) are provided.
Figure 29. After a gene is selected from the list, the gene is highlighted in the Gene Viewer,
and the processes that this gene product involved in are highlighted on the graph.
31
10. Status Bar
The Status Bar is used to display the pathway name and current selected organism information. It
can be hidden and displayed from the Option menu. Right click on the selected organism will
lead to context menu to let you reset the organism.
Figure 30. To reset the graph organism from the Status bar.
32
11. Tips for Pathway Browser
1. When double click on any where on the toolbar, a context menu with the same functions
as the main menu will pop up.
2. Press F12 from the Pathway Browser interface to show the context menu of the Pathway
Viewer.
3. In the Pathway Browser, if the there is no child nodes under the topmost “pathways”
node, double click on this node will get all available pathways.
4. Double click on any pathway or process in the Pathway Browser will draw the pathway
(or process) on the Pathway Viewer window.
[KT03] KITAMI, T., Data for Folate and Homocysteine Pathways in Mouse and Human,
Department of Genetics, CWRU, Unpublished Manuscript, 2003.
[MG98] Michal, G., Biochemical Pathways: An Atlas of Biochemistry and Molecular Biology,
Wiley-Spektrum, 1998, ISBN: 0471331309.
33