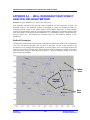
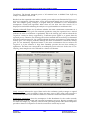
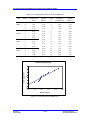
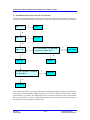
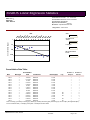
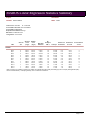
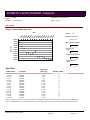
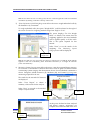
1
HQ Air Force Center for Environmental Excellence Monitoring and Remediation Optimization System (MAROS) SOFTWARE Version 2.1 User’s Guide Julia J. Aziz, Mindy Vanderford, Ph. D. and Charles J. Newell, Ph.D., P.E. Groundwater Services, Inc. Houston, Texas Meng Ling and Hanadi S. Rifai, Ph.D., P.E. University of Houston Houston, Texas James R. Gonzales Technology Transfer Division Air Force Center for Environmental Excellence Brooks AFB, San Antonio, Texas Air Force Center for Environmental Excellence Version 2.1 November, 2004 GSI Job No. 2236 AFCEE MONITORING AND REMEDIATION OPTIMIZATION SYSTEM SOFTWARE AFCEE Monitoring and Remediation Optimization System (MAROS) Software Table of Contents Section Page INTRODUCTION ..................................................................................................1 INTENDED USES FOR MAROS.........................................................................1 FUNDAMENTALS OF COMPLIANCE MONITORING .................................3 QUICK START ......................................................................................................3 MAROS SOFTWARE STEP-BY-STEP ................................................................5 MAROS DETAILED SCREEN DESCRIPTIONS ............................................11 DATABASE COMPACTION .............................................................................82 APPENDICES A.1 DATA IMPORT FILE FORMATS ....................................................... A.1-1 A.2 STATISTICAL TREND ANALYSIS METHODS .............................. A.2-1 A.3 WELL REDUNDANCY/SUFFICIENCY ANALYSIS: DELAUNAY METHOD.......................................................................... A.3-1 A.4 QUALITATIVE EVIDENCE: EMPIRICAL DATA METHOD......... A.4-1 A.5 SPATIAL MOMENT ANALYSIS METHOD ..................................... A.5-1 A.6 DATA SUFFICIENCY ANALYSIS....................................................... A.6-1 A.7 FALSE POSITIVE/NEGATIVE MINIMIZATION ............................ A.7-1 A.8 MAROS SITE RESULTS METHOD.................................................... A.8-1 A.9 SAMPLING FREQUENCY ANALYSIS: MODIFIED CES METHOD ................................................................... A.9-1 A.10 SAMPLE MAROS REPORTS ............................................................A.10-1 A.11 MAROS TUTORIAL...........................................................................A.11-1 Disclaimer: MAROS is made available on an as-is basis without guarantee or warranty of any kind, express or implied. The United States Government, Groundwater Services, University of Houston, the authors and reviewers accept no liability resulting from the use of MAROS or its documentation. Version 2.1 October 2004 i Air Force Center for Environmental Excellence AFCEE MONITORING AND REMEDIATION OPTIMIZATION SYSTEM SOFTWARE Implementation of MAROS and interpretation of the results are the sole responsibility of the user. List of Acronyms ACRONYM DEFINITION AFCEE Air Force Center for Environmental Excellence AR Area Ratio ASTM American Society for Testing and Materials CERCLA Comprehensive Environmental Comprehensive and Liability Act CES Cost Effective Sampling COC Constituent of Concern CR Concentration Ratio CT Concentration Trend DL Detection Limit ERPIMS Environmental Resources Management System LLNL Lawrence Livermore National Laboratory LOE Lines of Evidence LTM Long Term Monitoring MAROS Monitoring and Remediation Optimization System MCL Maximum Concentration Level NAPL Non-Aqueous Phase Liquids ND Non-Detect PRG Preliminary Remediation Goal RCRA Risk-based Corrective Action ROC Rate of Change SF Slope Factor Version 2.1 October 2004 ii Program Response, Information Air Force Center for Environmental Excellence AFCEE MONITORING AND REMEDIATION OPTIMIZATION SYSTEM SOFTWARE UST Version 2.1 October 2004 Underground Storage Tank iii Air Force Center for Environmental Excellence AFCEE MONITORING AND REMEDIATION OPTIMIZATION SYSTEM SOFTWARE INTRODUCTION The AFCEE Monitoring and Remediation Optimization System (MAROS) Software is a Microsoft Access database application developed to assist users with groundwater data trend analysis and long term monitoring optimization at contaminated groundwater sites. This program was developed in accordance with the Long-Term Monitoring Optimization Guide Version 1.1 developed by AFCEE. The Monitoring and Remediation Optimization System (MAROS) methodology provides an optimal monitoring network solution, given the parameters within a complicated groundwater system which will increase its effectiveness. By applying statistical techniques to existing historical and current site analytical data, as well as considering hydrogeologic factors and the location of potential receptors, the software suggests an optimal plan along with an analysis of individual monitoring wells for the current monitoring system. The software uses both statistical plume analyses (parametric and nonparametric trend analysis) developed by Groundwater Services, Inc., as well as allowing users to enter External Plume Information (empirical or modeling results) for the site. These analyses allow recommendations as to future sampling frequency, location and density in order to optimize the current site monitoring network while maintaining while maintaining adequate delineation of the plume as well as knowledge of the plume state over time in order to meet future compliance monitoring goals for their specific site. This User’s Guide will walk the user through several typical uses of the software as well as provide screen-by-screen detailed instructions. INTENDED USES FOR THE MAROS SOFTWARE The MAROS software tool is designed to analyze data from a mature site investigation, specifically a groundwater plume that has been delineated and monitored for more than four sample events. Along with the guidance found in the Long-Term Monitoring Optimization Guide (AFCEE, 1997) you can use the software to answer important compliance monitoring data questions: • • • • • • • What COCs are identified at the site? Is the temporal trend in the groundwater site analytical data significant? What is the spatial distribution of the temporal trends for each COC? Where is the approximate center of mass and is it moving over time? Are there redundant wells in the current monitoring network? What is the suggested future sampling frequency? Do new wells need to be added to the monitoring network to adequately characterize the plume? The MAROS software can be utilized in a step-by-step fashion, with each progressive step along the way yielding information that can be applied to answering site-specific compliance monitoring questions. At each phase in the software, results that are presented are based on increasingly more consolidated data. These data consolidation steps will lead to more stringent assumptions being used in order to reach a result or site specific results (Figure 1). The assumptions you make along the way, will affect the outcome of the software tool results. However, because the assumptions are arranged in a logical, explicit fashion, they can be reviewed and altered should more site data become available. Also, the validity of the results or recommendation will rely on the extent and quality of input data. The data imported into the software must meet minimum data requirements as to the frequency of sampling, duration of the sampling intervals for trend analysis and sampling density for the site as well as the quality of the measurements (decreased amount of false positives/negatives). Version 2.1 October 2004 1 Air Force Center for Environmental Excellence AFCEE MONITORING AND REMEDIATION OPTIMIZATION SYSTEM SOFTWARE • Basic output: 1 page Sampling Plan that is intended to be used as a “strawman” or basis for discussion (not as an authoritative, detailed statistically based product). The user can apply additional tools in MAROS to refine this basic plan. An important premise for the report is knowledge of historical trends for each COC and each well. However, the software is not a kriging tool at this time. Sample data reduction and data analysis tools result in summary reports. Note: For kriging, available software products include: GEOEAS or GEOPack from the U.S. EPA. Also, some commercial software for kriging include "GS+ Geostatistics for the Environmental Sciences", GMS (Groundwater Modeling System), ArcGIS 8.x, and EarthVision. These software products include variograms and kriging for the purpose of interpolation, but are not specifically geared toward groundwater well network optimization. A higher level of statistical knowledge and background would be required to implement these geostatistical tools. The AFCEE MAROS Software should be used in Access 2000 along with Excel 2000 in order to analyze the trends in groundwater data as well as perform statistical optimization of well location, sampling frequency and duration. The software can be used to export data to an Access archive file for future software use. Groundwater data can be imported from Excel or ERPIMS files as well as entered manually. Version 2.1 October 2004 2 Air Force Center for Environmental Excellence AFCEE MONITORING AND REMEDIATION OPTIMIZATION SYSTEM SOFTWARE FIGURE 1 MONITORING AND REMEDIATION OPTIMIZATION SYSTEM (MAROS) PROGRAM FLOW FUNDAMENTALS OF COMPLIANCE MONITORING Remediation monitoring of affected groundwater is a significant cost driver for future environmental restoration activities. These monitoring systems whether applied for process control, performance measurement or compliance purposes, referred to as long-term monitoring, are dictated by RCRA, CERCLA and UST programs. Although an individual longterm monitoring data point is relatively small, the scale of the required data collection effort and the time commitment makes the cumulative costs very high. Consequently, improving the efficiency of these systems through improved methodology for developing future long-term monitoring plans has the potential for substantial cost savings. Version 2.1 October 2004 3 Air Force Center for Environmental Excellence AFCEE MONITORING AND REMEDIATION OPTIMIZATION SYSTEM SOFTWARE The features available in the MAROS software are designed to optimize a site-specific monitoring program that is currently tracking the occurrence of contaminant migration in groundwater. MAROS is a decision support tool based on statistical methods applied to sitespecific data that account for hydrogeologic conditions, groundwater plume stability, and available monitoring data. This process focuses on analyzing relevant current and historical site data and optimizing the current monitoring system in order to efficiently achieve the termination of the monitoring program. For example plumes that appear to be decreasing in extent, based on adequate monitoring data over a several year period, can be analyzed statistically to determine the strength and reliability of the trend. If it can be demonstrated statistically through statistical plume analyses (i.e. Mann-Kendall Trend Analysis and/or Linear Regression Trend Analysis or Moment Analysis) and/or External Plume Information (modeling or empirical) that the plume is shrinking with a high degree of confidence, then future monitoring can either be suspended or reduced in scope (i.e. from annual monitoring to biennial monitoring). MAROS has the option to either use simple rules based on trend analysis results and site information or more rigorous statistical methods to determine the minimum number of wells and the minimum sampling frequency and well density required for future compliance monitoring at the site. These preliminary monitoring optimization recommendations will give the user a basis for which to make more cost effective, scientifically based future long-term monitoring decisions. As the monitoring program proceeds, more recent sampling results can be added to historical data to assess the progress of the current monitoring strategy. Then the optimization process can be reviewed and updated periodically using the MAROS guidance recommendations. QUICK START Minimum System Requirements The AFCEE Monitoring and Remediation Optimization System Software runs with Microsoft Access 2000 database software and Microsoft Excel 2000. Operation requires an IBMcompatible PC with Pentium or later processor. To operate efficiently we recommend that the PC have a minimum of 64 MB RAM (optimal 128 MB RAM), Pentium III, and EGA or VGA graphics display. Microsoft Access 2000, Microsoft Excel 2000, plus Windows 98 or later or Windows NT are required software. Installation and Start Up Copy MAROS_SETUP.EXE to your hard drive, then run MAROS_SETUP.EXE either by selecting Run from the File menu in Program Manager or by double-clicking on the file MAROS_SETUP.EXE in File Manager (or Windows 98/NT/2000/XP Explorer). The installation process creates the C:\AFCEE_MAROS subdirectory on your hard drive, unless you install it elsewhere, and copies the MAROS files into the new directory. This folder contains five files needed to use the software. 1) AFCEE Monitoring and Remediation Optimization System Software: 2) Help file: 3) Optimization Excel File: 4) Trend Visualization Excel File: 5) Location Addition Excel File: Version 2.1 October 2004 4 “afcee_MAROS_v2.mdb” “afcee_MAROS.hlp” “xlsDelaunay2k.xls” “xlsLOEresults.xls” “xlsLocation.xls” Air Force Center for Environmental Excellence AFCEE MONITORING AND REMEDIATION OPTIMIZATION SYSTEM SOFTWARE 6) MAROS Manual: 7) MAROS Tutorial File: “afcee_MAROS_Manual.pdf” “TutorialExampleData.xls” To start the software after installation, double click on the “afcee_MAROS.mdb” file or open the file from within Access 2000. Note: Although some users are likely to have the complete set of libraries “turned on” to run the program, the following procedure should be applied the first time the software is used. 1) Start up main software “afcee_MAROS.mdb”. The Start up screen will appear. Press “F11” on the keyboard. 2) The Main Access Program will appear. Click on the tab “Modules”. Open the Module “A MAROS Initial Start Up References”. 3) Go to the Menu Item “Tools…. References….” A popup list of items will appear. Choose the following libraries to utilize. Click on the following libraries IF they are not already chosen Visual Basic for Application; Microsoft Access 9.0 Object Library; Microsoft DAO 3.6 Object Library; Microsoft Graph 8.0 Object Library; Microsoft Excel 9.0 Object Library, Microsoft Office 9.0 Object Library. Click on “OK” when finished. 4) Exit Access from the Menu Item “File…. Exit” Version 2.1 October 2004 5 Air Force Center for Environmental Excellence AFCEE MONITORING AND REMEDIATION OPTIMIZATION SYSTEM SOFTWARE MAROS SOFTWARE STEP-BY-STEP MAROS Step-by-step instructions will guide the user through the most commonly used features of the software. Figure 1 directs the user through the complete MAROS program flow which will assist the user in becoming familiar with the use of the software. What do I need before I start? The MAROS Software requires a small but specific set of data in order to produce a result. The data must be carefully formatted to fit the entry requirements in MAROS. Data preparation is often the most difficult and time consuming part of the analysis. Detailed descriptions of import file formats are presented in Appendix A.1. 1) Well sampling data including the well name, constituents sampled, sample dates, results and well locations should be entered into either Excel or Access as described in Appendix A1 of this manual. Sample detection limits are required, but can be estimated if the information is not available. Laboratory Quality Assurance/Quality Control data, matrix spikes and field blanks are not required. Water quality parameters such as pH and conductivity are not required. 2) Aquifer and general plume characteristics should be identified before plume analysis begins. The MAROS tool requires a general value for aquifer seepage velocity, porosity, saturated thickness and flow direction. A MAROS file can be run multiple times using different aquifer parameters, to examine sensitivity to varying hydraulic characteristics within an aquifer. The plume length and width as well as an approximate source location and estimate of distance to potential receptors are also required. Groundwater sample locations should be identified as being in the source or tail region of the plume. 3) If you are running MAROS for the first time, it is advisable to start with a limited data input set until you become familiar with the software. MAROS can examine data for up to 5 constituents at once, but a simple file with one to three constituents is easier to handle for a preliminary run. How can I import/enter groundwater data into MAROS? The MAROS Software allows manual data entry or importation of data into the software. To import data within the software: 1) Main Menu: From the Main Menu, select “Data Management” by clicking on the button next to the label. This will take you to the Data Management Menu Screen. 2) Data Management Menu: From the Data Management Menu, select “Import New Data” by clicking on the button next to the label. This will take you to the Import New Data Screen. 3) Import New Data: Choose the type of data import to be performed by clicking on the appropriate button (Excel or ERPIMS). Enter the full file path and filename of the file to import (or click the browse button to find the import file). The Folder and File name you choose will appear in the top two boxes. (See Notes below for ERPIMS and Excel file format/names.) Choose the import option that corresponds to the import data format. (Note that the “Import New Data” option will replace the existing data in the database.) Click Version 2.1 October 2004 6 Air Force Center for Environmental Excellence AFCEE MONITORING AND REMEDIATION OPTIMIZATION SYSTEM SOFTWARE “Import” to proceed with importing the file to the existing database. (See Appendix A.1 for more information). To enter individual data records manually within the software: 1) Main Menu: From the Main Menu, select “Data Management” by clicking on the button next to the label. This will take you to the Data Management Menu Screen. 2) Data Management Menu: From the Data Management Menu, select “Manual Data Addition” by clicking on the button next to the label. This will take you to the Manual Data Addition Screen. 3) Manual Data Addition: Fill in the appropriate information within each field. Fields such as “Constituent Type” and Constituent have dropdown boxes to assist in data entry. Choose Constituent Type before choosing the Constituent. Review information before adding the record. When all the data is entered, click on the “Add Record” button. Note: If the result is “ND” (non-detect) then fill in the Detection Limit in the Result cell. How will MAROS help perform a trend analysis and give a Site-Specific Recommendation based on groundwater data and site conditions? The MAROS Tool can generate a summary report for a selected set of data imported by the user. To generate the summary report for the Mann Kendall or Linear Regression Trend Analysis: 1) Follow directions for Importing/Entering Data above. 2) Main Menu: From the Main Menu, select “Site Details” by clicking the button next to the label. This action will take the user to the Site Information screen. 3) Site Details: In each screen select the information that describes the site, click on “Next” to continue to the next screen. First, enter the site details on the Site Information screen. Next, define sample events on the Sample Events screen. Then select the representative wells in the Source and Tail zones on the Source/Tail Zone Selection screen. Continue to the Constituents of Concern Decision screen to choose the representative COCs for the site. The next screen, Initial Data Table , will show the data to be evaluated. To proceed click “Next”. The site details portion of the software is complete. 4) Main Menu: From the Main Menu, select “Trend Analysis” by clicking the button next to the label. This action will take the user to the Plume Analysis Menu screen. 5) Plume Analysis Menu: From the Plume Analysis Menu, select “Data Reduction” by clicking the button next to the label. This action will take the user to the Data Reduction Part 1 of 2 screen. 6) Data Reduction: In each screen select the information that will define the data you would like to analyze, click “Next” to continue to the next screen. First, enter the period of interest as well as data consolidation options on the Data Reduction Part 1 of 2 screen. Next, define delimit the data on the Data Reduction Part 2 of 2 screen. Continue to the Reduced Data Table screen to view the results of data consolidation. To proceed click “Next”. The data reduction portion of the software is complete. Version 2.1 October 2004 7 Air Force Center for Environmental Excellence AFCEE MONITORING AND REMEDIATION OPTIMIZATION SYSTEM SOFTWARE 7) Plume Analysis Menu: From the Plume Analysis Menu, select “Statistical Plume Analysis” by clicking the button next to the label. This action will take the user to the Mann Kendall Statistics screen. 8) Statistical Plume Analysis: In each screen view the information from both the Mann Kendall and Linear Regression Statistical Analyses, click “Next” to continue to the next screen. Results of the Mann Kendall Trend Analysis are shown on the Mann Kendall Statistics screen. Next, results of the Linear Regression Trend Analysis are shown on the Linear Regression Statistics screen. Continue to the Linear Regression screen to view the results in graphical form. Finally a summary of both the Mann Kendall and Linear Regression results are shown on the Trend Analysis Summary by Well screen. To proceed click “Next”. The Statistical Plume Analysis portion of the software is complete. Plume Analysis Menu: From the Plume Analysis Menu, select “Spatial Moment Analysis” by clicking the button next to the label. This action will take the user to the Moment Site Details screen. 10) Spatial Moment Analysis: First, enter the site details on the Moment Analysis Site Details screen. Then in each screen view the information from the 0th, 1st, and 2nd Moment Analysis Results, click “Next” to continue to the next screen. Finally a summary of both the Moment Analysis results are shown on the Spatial Moment Analysis Summary screen. To proceed click “Next”. The Spatial Moment Analysis portion of the software is complete. 9) 11) Plume Analysis Menu: From the Plume Analysis Menu, select “External Plume Information” by clicking the button next to the label. This action will take the user to the External Plume Information: Modeling Results screen. 12) External Plume Information: In each screen select the information that pertains to the site for both Modeling and Empirical results, click “Next” to continue to the next screen. Results for modeling studies are entered on the External Plume Information: Modeling Results screen. Next, results of any empirical evidence are entered on the External Plume Information: Empirical Results screen. To proceed click “Next”. The External Plume Information portion of the software is complete. 13) Plume Analysis Menu: From the Plume Analysis Menu, select “MAROS Analysis” by clicking the button next to the label. This action will take the user to the Lines of Evidence Summary by Well screen. 14) MAROS Analysis: In each screen select to weight the Lines of Evidence or individual wells as pertains to your site, click “Next” to continue to the next screen. Results for all lines of evidence are summarized on the Lines of Evidence Summary by Well screen. Next, the choice to weight the Lines of Evidence by “All Chemicals” or “Individual Chemicals” is made on the Trend Summary Weighting screen. Continue to the Results of Trend Weighting screen to view the results in table form. Finally the option to weight individual wells is available on the Lines of Evidence by Well Weighting screen. The Monitoring System Category screen shows a summary of the source and tail well results for the COCs chosen, the Monitoring System Category is displayed for these results. To proceed click “Next”. The Trend Analysis portion of the software is complete. 15) Main Menu: From the Main Menu, select “MAROS Output” by clicking the button next to the label. This action will take the user to the MAROS Reports/Graphs screen. Version 2.1 October 2004 8 Air Force Center for Environmental Excellence AFCEE MONITORING AND REMEDIATION OPTIMIZATION SYSTEM SOFTWARE 16) MAROS Reports/Graphs: Select the report or graph you would like to view, then click on the button next to the list. This action will take the user to the report or graph chosen. To print, select the print icon on the tool bar or select “Print” from the file menu. Click “Close” to exit the Report. What COCs should I choose for my site? The MAROS Tool can help the use to choose the Constituents of Concern for your site. Up to five COCs can be analyzed at one time by the MAROS software. However, the tool works best when one to three representative COCs are chosen. To receive input from the software on how to rank or choose COCs: 1) Follow directions for Importing/Entering Data above. 2) Main Menu: From the Main Menu, select “Site Details” by clicking the button next to the label. This action will take the user to the Site Information screen. 3) Site Details: In each screen select the information that describes the site, click on “Next” to continue to the next screen. First, enter the site details on the Site Information screen. Next, define sample events on the Sample Events screen. Then select the representative wells in the Source and Tail zones on the Source/Tail Zone Selection screen. Continue to the Constituents of Concern Decision screen to choose the representative COCs for the site. 4) Constituents of Concern: From the Constituents of Concern screen, click on “Recommended COCs”. The next screen, Risk Level Assessment, will show the data for COCs that are currently in the database to be evaluated. Choose from the list of generic Preliminary Remediation Goal (PRG) recommendations. Choose from the list of generic Preliminary Remediation Goal (PRG) recommendations. Click on the appropriate standard to be used in database comparisons for COC recommendations. Enter your own modifications to cleanup goals under "custom goals" in mg/L. The next screen, COC Decision screen shows up to 10 of the recommended COCs based on Toxicity, Prevalence, and Mobility. Enter up to 5 COCs for the site in the boxes to the left. If you would like a detailed view of the process used to make the COC recommendation, click on “Toxicity”, “Prevalence” or “Mobility” at the left side of the screen. The information displayed in this screen can also be viewed in report form, “COC Assessment Report” from the MAROS Output Screen. To proceed with the next step in the software click “Back”. How can I access the Sampling Optimization module? The Sampling Optimization module is an optional extension of the MAROS software. It may optimize the sampling plan by eliminating redundant sampling locations and determining the lowest sampling frequencies for these sampling locations. It also provides data sufficiency analyses for the current monitoring program. To access the Sampling Optimization module, complete the following steps: 1) Start Screen: After starting the MAROS software, the Start Screen is shown, input user name and project name and click button Start. You will enter the Main Menu. 2) Main Menu: In the Main Menu, the Sampling Optimization module is the fourth option. The Sampling Optimization label is red and the button next to it is deactivated. Follow Version 2.1 October 2004 9 Air Force Center for Environmental Excellence AFCEE MONITORING AND REMEDIATION OPTIMIZATION SYSTEM SOFTWARE instructions and complete the three modules above the Sampling Optimization module in that order. They are Data Management, Site Details and Plume Analysis. After running through the three modules, go back to Main Menu, the button next to label Sampling Optimization will be activated, click this button, the Sampling Optimization screen will appear. 3) Sampling Optimization: The sampling optimization screen is a main menu for three submodules: Sampling Location Analysis, Sampling Frequency Analysis, and Data Sufficiency Analysis. Now you can follow the instructions and perform the three analyses. To View/Print Report: 1) Module-end Results Reports: At the Results screen(s) of each sub-module (e.g., screen RiskBased Power Analysis Results), there is a button named View Report. Click this button and follow instructions to view or print the results report. 2) MAROS Output Reports: After running through the Sampling Optimization module, the MAROS Output Reports screen can be accessed from screen Main Menu. From the Report listbox, select the report you want to view (e.g., Sampling Location Optimization Report) by clicking on that item (available only after that sub-module has been successfully performed). Then click button View/Print Report and follow instructions to view or print the report. How will the Sampling Optimization module help me optimize a sampling plan? The Sampling Optimization module is used to determine the minimal number of sampling locations and the lowest sampling frequencies that can still meet the requirements of spatial sampling and temporal sampling for the monitoring program. A data sufficiency analysis is also provided in this module to examine the cleanup status and the significance of concentration trend at individual wells and the risk-based site cleanup status. These analyses are based on each Constituent of Concern (COC) and the results are given on a COC-by-COC basis. 1) Sampling Location Analysis: This sub-module uses the Delaunay method to eliminate “redundant” wells from the monitoring network based on spatial data analyses. Monitoring data from multiple sampling events can be used in this analysis. Major steps to be followed are: a) Sampling Location: Delaunay Method: In this screen, select the series of sample events intended for analysis by defining the From and To sampling events and click Confirm. Then choose between Access Module and Excel Module (the latter one is available only when a single sampling event is chosen for analysis). b) Sampling Location Analysis - Access Module: In this screen, set up the Selected? and Removable? properties of potential sampling locations and if needed change the optimization parameters by clicking button Options. Then click button Preliminary Analysis to proceed. All COCs will be analyzed and several steps are to be followed to complete this analysis. Or c) Sampling Location Analysis - Excel Module: In this screen, set up the Selected? and Removable? properties of potential sampling locations for a COC and then click Analysis. Version 2.1 October 2004 10 Air Force Center for Environmental Excellence AFCEE MONITORING AND REMEDIATION OPTIMIZATION SYSTEM SOFTWARE The xlsDelaunay2K worksheet will pop up and the user is required to finish optimization there. After sending back the results for that COC from xlsDelaunay2K (by clicking Back To Access in xlsDelaunay2K), this screen will re-appear. Run through all COCs in the same way and click Next to proceed. 2) Sampling Frequency Analysis: This sub-module uses the Modified CES method to determine the lowest sampling frequency for each sampling location. The method is based on the analysis of time-series data by assessing the Rate of Change (ROC) and Concentration Trend (CT) of each Constituent of Concern (COC) and considering both recent trends and overall (long-term) trends of the data. The analysis is performed according to each COC. Major steps to be followed are: a) Sampling Frequency Analysis: In this screen, define the "recent period" by selecting the From and To sampling events and then click button Confirm. Click button Option and change the Rate of Change parameters if necessary. Click Analysis to proceed. b) Sampling Frequency Recommendation: View results for all COCs and click button Next to complete. 3) Data Sufficiency Analysis: This sub-module uses statistical power analysis to determine the cleanup status and the significance of concentration trends at individual wells and the riskbased site cleanup status. Statistical power and the expected sample size associated with each evaluation are provided. Results from this module can be used to assess the sufficiency of monitoring plans, providing auxiliary information for optimizing sampling locations and sampling frequency. Major steps to be followed are: a) Data Sufficiency Analysis Menu: There are two types of analyses to choose at this screen: Power Analysis at Individual Wells and Risk-Based Power Analysis. Before proceeding to either of the analyses, click button Options to enter screen Data Sufficiency Analysis - Options where the user should to check or specify the parameters used in the statistical power analysis. Then click the corresponding button to perform any of the two analyses. b) Power Analysis at Individual Wells: Clicking this button will take the user to the individual well cleanup status evaluation. The user needs to select the series of sample events intended for analysis and define some other parameters. There are several steps to follow to finish this analysis and results reports can be viewed immediately after the evaluations are finished. c) Risk-Based Power Analysis: Clicking this button will take the user to the risk-based site cleanup evaluation. The user needs to specify four sets of parameters in screen Parameters for Risk-Based Power Analysis before continuing the analysis. Regression of plume centerline concentrations, projection of concentrations, and the risk-based site cleanup evaluation are determined sequentially. Results reports become available immediately after each step is finished. The user can choose to run either Sampling Location Analysis or Sampling Frequency Analysis first. Because Data Sufficiency Analysis uses qualitative concentration trend results from Sampling Frequency Analysis, it cannot be selected before Sampling Frequency Analysis is successfully performed. For detailed instructions on how to run these modules, refer to the next chapter MAROS DETAILED SCREEN DESCRIPTIONS. Version 2.1 October 2004 11 Air Force Center for Environmental Excellence AFCEE MONITORING AND REMEDIATION OPTIMIZATION SYSTEM SOFTWARE MAROS DETAILED SCREEN DESCRIPTIONS Start Screen The Start Screen gives the user access to the software system. Enter the User Name and Project Name in the boxes to the left of the Start Button. The User Name and Project Name will appear in the headings of MAROS output reports. Click “Start” to proceed to use the database software. Utilizing the MAROS software is analogous to a train trip. You begin the expedition by importing your raw groundwater data that has been collected over several sampling periods from the field site of interest. As you journey through the software, you can get off at any station along the way. The results that you are presented with at each stop whether graphical or in a report will be based on increasingly more consolidated data. These data consolidation steps will lead to a higher degree of assumptions being used in order to reach a result or site specific recommendation. The assumptions you make along the way, will affect the outcome of the software tool results. Also, the validity of the results or recommendation will rely on the extent and quality of your data. For instance, more data doesn’t necessarily mean better results. The data must meet minimum data requirements as to the frequency of sampling, duration of the sampling intervals for trend analysis and sampling density for the site as well as the quality of the measurements (decreased amount of false positives/negatives). Version 2.1 October 2004 12 Air Force Center for Environmental Excellence AFCEE MONITORING AND REMEDIATION OPTIMIZATION SYSTEM SOFTWARE Main Menu The Main screen serves at the center of the user interface. The user progressively steps through the Compliance Monitoring Trend Analysis and Optimization Evaluation process by navigating through the options displayed. As individual steps of the process are completed, options to select become successively available. The Main Menu screen allows the user to choose between performing: • • • • • Step 1: Data Management Step 2: Site Details Step 3: Plume Analysis Step 4: Sampling Optimization Step 5: MAROS Output Select the desired option by clicking the applicable button. Proceed through Steps 1 – 5. Data Management: Allows data import of Excel and ERPIMS files, archiving current site data, and manual data addition. Site Details: Initial definition of site specific data including choosing the “Source” and “Tail” wells, sample events and providing site-specific Constituents of Concern (COC’s). Plume Analysis: Allows the user to perform data reduction as well as trend analysis through both Statistical Plume Analysis, Spatial Moment Analysis, and External Plume Information. Also allows the user to apply final Analysis Consolidation to the trend results. Sampling Optimization: Allows the user to perform sampling optimization through various statistical methods used to determine the sampling location and sampling frequency. MAROS Output: Allows the user to view/print site-specific summary reports and graphs. Quit: Closes the database program and Access. When the database is closed any data that you are currently working on will be erased. It is suggested that you Archive the current database if necessary before exiting. Help: Provides additional information on software operation and screen-specific input requirements. Version 2.1 October 2004 13 Air Force Center for Environmental Excellence AFCEE MONITORING AND REMEDIATION OPTIMIZATION SYSTEM SOFTWARE Data Management The Data Management Menu (accessed from the Main Menu) is used to perform database operations such as importing, manual data addition and archiving. These operations are used to import initial site data as well as additional data into the software. Import file formats are discussed in detail in Appendix A.1 Choose the option of interest by clicking the applicable button. Import New Data: New data can be imported from Excel, Access or ERPIMS data files. Manual Data Addition: This option allows the user to input data manually. Manual addition is generally useful for a very small amount of supplemental data. contain the site data as well as site details. Import MAROS Archive File: MAROS archive files can be created in the software in two locations after the initial data have been imported. Archive files are in Access and Export MAROS Archive File: MAROS creates an archive database file containing the sample data in a format that can be imported under the previous protocol. Main Menu: Returns the user to the Main Menu. Help: Provides information on the screen-specific input requirements. Version 2.1 October 2004 14 Air Force Center for Environmental Excellence AFCEE MONITORING AND REMEDIATION OPTIMIZATION SYSTEM SOFTWARE Import New Data Import New Data (accessed from the Data Management screen) is used to choose between importing ERPIMS files or an Excel or Access file in the standard MAROS format (see Appendix A.1) to the database as follows: Choose the type of data import to be performed by clicking on the appropriate button. To import data into the software: 1) In the Step 1 dialog box enter the file type for the new data. Next, enter the full file path and filename of the file to import (or click the browse button to find the import file). The Folder and File name you choose will appear in the top two boxes. (See Notes below for ERPIMS, Access, and Excel file format/names.) 2) In the Step 2 dialog box, choose if the data file will replace all data currently in the MAROS toolbox (or replace the empty MAROS files) or if the data should be appended to the current file. 3) Click “Import” to proceed with importing the file to the existing database. A dialog box will appear with the number of wells and the date range of the data—check these data to make sure they are consistent with your import file. Too few wells or too few dates means that some of your data is not importing properly and you may need to repair your input file. Back: Takes the user back to the Data Management screen. Help: Provides information on the screen-specific input requirements. NOTES: To import an Excel 2000 spreadsheet: 1) Type or select the name of the Excel workbook. 2) The import option requires an Excel file format with fields identical in name and structure to those outlined in Appendix A.1. Each field must have the columns filled in. Do not import files with missing data, this will result in incorrect data evaluation within the software. The columns must include the field names in the first line. The template file “MAROS_ExcelImportTemplate.xls” is provided with the software with example data. Also, a list of permissible constituent names is found in the file, “MAROS_ConstituentList.xls”. To import an Access 2000 Table: 1) Type or select the name of the Access File. 2) The import option requires an Access Table format with fields identical to those outlined in Appendix A.1. Only one import table should be in the Access file. Each field must have the columns filled in. Do not import files with missing data, this will result in incorrect data evaluation within the software. The columns must include the field names as they are in the Access Template file and the table name should be “ImportData”. The template file “MAROS_AccessImportTemplate.mdb” is provided with the software with example data. Version 2.1 October 2004 15 Air Force Center for Environmental Excellence AFCEE MONITORING AND REMEDIATION OPTIMIZATION SYSTEM SOFTWARE Also, a list of permissible “MAROS_ConstituentList.xls”. To import ERPIMS files: constituent names is found in the file, 1) Ensure that the source folder contains the .SAM, .TES, .RES and .LDI data files. 2) Type or select only the .RES file to import all needed files**. * * Before importing ERPIMS files they must be saved in text format in Microsoft Word 2000 with fields identical to those already in the database system (i.e. the format matching that used by ERPIMS system). To save the ERPIMS files as text files, open each file (.SAM, .TES, .RES and .LDI files) one at a time in Word. You will be prompted to “Choose the encoding used for loading this file”, check “Plain Text”. When the file is opened in Word, under the Menu option click “Save as”. You will be prompted to “Save as type:”, choose “Text only (*.txt)”. Make sure you do not have the .txt extension on the end of the file name, only the original file name with the .RES, .SAM, .TES or .LDI file extension should appear. All files should have the same name (e.g. Hillgwdata.RES, Hillgwdata.LDI, Hillgwdata.TES and Hillgwdata.TES). No field names should appear in the files. There is a limit on the amount of data that can be opened in Microsoft Word 2000, this will be controlled by the amount of RAM in your computer. The rule of thumb for large files is that your computer should have at least 3 times the amount of RAM as the size of the file. For instance if you have a 80 MB file you should have at least 256 MB of RAM to open this type of file in Word. If you do not know the amount of RAM on your computer, from the “Start” Button go to “Settings” and “Control Panel”. In the control panel, open the “System” Icon and look at the “General” tab. This indicates the amount of RAM in your computer. To import ERPIMS files from an Access 2000 database: 1) Type or select the name of the Access 2000 database. 2) Ensure that the tables included in the database file are named as follows SAM, .TES, .RES and .LDI data tables. The import option requires an Access file format with fields identical to those outlined in Appendix A.7. Each field must have the mandatory columns filled in. Do not import files with missing data, this will result in incorrect data evaluation within the software. The columns must include the field names as outlined in Appendix A.6. The template file “MAROS_ERPMSAccessTemplate.mdb” is provided with the software with example data. Version 2.1 October 2004 16 Air Force Center for Environmental Excellence AFCEE MONITORING AND REMEDIATION OPTIMIZATION SYSTEM SOFTWARE Import MAROS Archive File Import Archive File (accessed from the Data Management Menu screen) is used to import previously archived data files as follows: To import archived data into the full database: 1) Enter the full file path and filename of the archived file to import (or click the browse button to find the import file). The Folder and File name you choose will appear in the top two boxes. 2) Choose the import option that corresponds to the import data. Choose ‘Replace’ if all the data for the analysis are in the file to be imported. ‘Replace’ should be chosen for a new analysis (you are replacing an empty file). After you choose ‘Replace’, a dialog box will ask if you really want to replace the data—select ‘Yes’. Choose ‘Append’ if the file represents additional data to those already present in the database. Appended data may be data for a new sample event or additional well data. 3) Click “Retrieve” to proceed with importing the archived file to the existing database. A dialog box will inform you if the data have been successfully imported. Back: Takes the user back to the Data Management screen after the data have been imported. Help: Provides information on the screen-specific input requirements. Note: To import a MAROS 1.0 archive file, the file must first be converted to Access 2000. To convert a an archive file to Access 2000, open the file within Access 2000 and choose the option “Convert Database” and save the file under a new name. Once the archive file is converted to Access 2000, you will be able to import the file into the MAROS 2.0 software. Version 2.1 October 2004 17 Air Force Center for Environmental Excellence AFCEE MONITORING AND REMEDIATION OPTIMIZATION SYSTEM SOFTWARE Export MAROS Archive File Export Archive File (accessed from the Data Management Menu screen) is used to export a MAROS data file. To export data into an archive database file: 1) Enter the full file path and filename of the archived file to export (or click the browse button to find the archive file to overwrite). The Folder and File name you choose will appear in the top two boxes. 2) Click “Create” to proceed with exporting the data to the archive file. Back: Takes the user back to the Data Management screen. Help: Provides information on the screen-specific input requirements. A MAROS archive file can also be created at the end of the “Site Details” section of the software. The archive file will contain the site details such as seepage velocity and source and tail well designations. Archive files are in Access format (*.mdb), and should be named to distinguish them from MAROS Output files. Version 2.1 October 2004 18 Air Force Center for Environmental Excellence AFCEE MONITORING AND REMEDIATION OPTIMIZATION SYSTEM SOFTWARE Manual Data Addition Manual Record Addition (accessed from the Data Management Menu Screen) can be used to add individual Records to the database. Steps for use: 1) Choose to “Replace Data” or “Append Data” to the groundwater data already in the software. 2) Fill in the appropriate information within each field. Fields such as “Constituent Type” and Constituent have dropdown boxes to assist in data entry. Choose Constituent Type before choosing the Constituent. Note: If the result is “ND” then fill in the Detection Limit. 3) Review information before adding the record. When all the data is entered, click on the “Add Record” button. Add Record: To add a new record, choose the entries from the selection boxes or type in the record information. Delete Record: To delete the record currently shown on the screen. Deleting a record is a permanent operation. Alls fields should be filled in to ensure minimum information for added records. However, if X and Y coordinates are unknown these fields can be left blank. Back: Takes the user back to the Data Management screen. Help: Provides information on the screen-specific input requirements. Version 2.1 October 2004 19 Air Force Center for Environmental Excellence AFCEE MONITORING AND REMEDIATION OPTIMIZATION SYSTEM SOFTWARE Site Details Site Information (accessed from the Main Menu Screen) is the first step in defining the site type as well as parameters unique to the site. Fill in the appropriate information within each field. Fields such as “State” and “Current Source Treatment” have dropdown boxes to assist in data entry. Note: All fields on this form are mandatory entry. The user will be prompted if the fields are not filled in. Under the ‘Downgradient Information’ section, a non-zero number is required in the ‘distance to receptor’ cells. The number can be small (1) or negative, in the event the plume has extended beyond the possible point of exposure. screen. Next: Takes the user to the Sample Events Main Menu: Takes the user back to the Main Menu screen. Help: Provides information on the screen-specific input requirements. Version 2.1 October 2004 20 Air Force Center for Environmental Excellence AFCEE MONITORING AND REMEDIATION OPTIMIZATION SYSTEM SOFTWARE Site Details Sample Events (accessed from the Site Information screen) allows the user to define sample events and dates to be used for graphing and data consolidation. For this section, a sample event is defined as the date range during which one episode in the monitoring program was carried out. For example, if all wells were sampled between 3/1/2002 and 3/5/2002, the sample event could be defined for all the wells as occurring on 3/3/2002. Steps for use: 1) Choose a sample event name from the drop-down box or type in the name you would like to use. 2) Enter a date range for the sample event (e.g. 10/04/1998 to 10/06/1998) and an "effective date" (e.g. 10/04/1998). The "effective date" will be used for plotting purposes and further data consolidation. 3) Select “OK” to update the sample event information. Note: To edit sample events, choose the sample event name and change the range. Auto Event: Allows the user to update sample events automatically. The software will assign the actual sample date as the effective date. Also, each sample event will be assigned to a unique original date. This option should only be used if the data only has one date per sampling event. Next: Takes the user to the Source/Tail Zone Selection screen. Back: Returns the user back to the Site Information screen. Help: Provides information on the screen-specific input requirements. Version 2.1 October 2004 21 Air Force Center for Environmental Excellence AFCEE MONITORING AND REMEDIATION OPTIMIZATION SYSTEM SOFTWARE Site Details Source/Tail Zone Selection (accessed from the Sample Events Screen) allows the user to define the well type for the wells in the database. The MAROS software divides the wells for the site into two different zones (e.g. “Source” zone and “Tail” zone). The “Source” area include zones with NAPLs, contaminated vadose zone soils, and areas where aqueous-phase releases have been introduced into groundwater. The source area is generally the location with the highest groundwater concentrations of constituents of concern. The downgradient groundwater plume (“Tail”) zone is the area downgradient of the contaminant source zone. The Tail only contains contaminants in the dissolved phase and the sorbed phase, but contains no sources of contamination. Select representative wells in the "Source" - S and "Tail" - T zones or "Not Used". Choose either Tail or Source or Not Used by clicking on the box to the right of the well in the table. Select representative wells in the "Source" and "Tail" zones. Next: Takes the user to the Well Coordinates screen. Back: Returns the user back to the Sample Events screen. Help: Provides information on the screen specific input requirements. Well Coordinates (accessed from the Source/Tail Zone Selection Screen) allows the user to define and/or revise the well coordinates if they were not defined in the import file. Well coordinates are mandatory and should be in feet (e.g. State Plane coordinates or arbitrary site coordinates). Next: Takes the user to the COC Decision screen. Back: Returns the user back to the Source/Tail Zone Selection screen. Help: Provides information on the screen specific input requirements. Version 2.1 October 2004 22 Air Force Center for Environmental Excellence AFCEE MONITORING AND REMEDIATION OPTIMIZATION SYSTEM SOFTWARE Site Details Well Locations (accessed from the Well Coordinates Screen) allows the user to review the well coordinates in their relative locations. Well coordinates are mandatory and should be in feet (e.g. State Plane coordinates or arbitrary site coordinates). Back: Returns the user back to the Well Coordinates screen. Constituents of Concern Decision (accessed from the Source/Tail Zone Selection Screen) allows the user to define up to five constituents to be evaluated at the site. Enter up to 5 COCs for the site in the boxes to the right (5 is the maximum - if you have more than 5 then run the software more times). In general, choosing 1 to 3 COCs with different chemical characteristics per analysis works best. If you would like to view a list of suggested COCs click on the button "Recommended COCs". This will result in a summarized list of COC recommendations from the available dataset as well as a criteria ranking system—toxicity, prevalence or mobility-- used to make the COC recommendation (see below). Next: Takes the user to the Initial Data Table screen. Back: Returns the user back to the Well Coordinates screen. Help: Provides information on the screen-specific input requirements. Version 2.1 October 2004 23 Air Force Center for Environmental Excellence AFCEE MONITORING AND REMEDIATION OPTIMIZATION SYSTEM SOFTWARE Site Details Risk Level Assessment (accessed from the COC Decision screen) allows the user to choose a preliminary remediation goal (PRG) used to screen representative concentrations from the dataset. Choose from the list of generic Preliminary Remediation Goal (PRG) recommendations. Click on the appropriate standard to be used in database comparisons for COC recommendations. Enter your own modifications to cleanup goals under "custom goals" in mg/L. Note: User entered cleanup standards will supersede chosen standards. Back: Returns the user to the COC Decision screen. Next: Takes the user to the COC Recommendation Screen. Help: Provides information on the screen-specific input requirements. COC Recommendation (accessed from the Risk Level Assessment screen) allows the user to choose COCs based on Toxicity, Prevalence and Mobility of samples from the dataset. Enter up to 5 COCs for the site in the boxes to the left. If you would like a detailed view of the process used to make the COC recommendation, click on “Toxicity”, “Prevalence” or “Mobility at the left side of the screen. The information displayed in this screen can also be viewed in report form, “COC Assessment Report” from the MAROS Output Screen (see Appendix A.8 for an example report). Back: Returns the user to the Risk Level Assessment screen. Help: Provides information on the screen-specific input requirements. Version 2.1 October 2004 24 Air Force Center for Environmental Excellence AFCEE MONITORING AND REMEDIATION OPTIMIZATION SYSTEM SOFTWARE Site Details COC Decision Mobility shows a list of COC recommendations from the available dataset based on the Mobility of the compounds. Top COCs by mobility were determined by examining each detected compound in the dataset and comparing their mobilities. (Koc's for organics, assume foc = 0.001, and Kd's for metals). Compounds listed first are those above the PRG and are shown on the COC Decision screen. COC Decision Toxicity shows a list of COC recommendations from the available dataset based on the Toxicity of the compounds. Top COCs by toxicity were determined by examining a representative concentration for each compound over the entire site. (Note: The representative concentration can be skewed by high variability in the detection limit for non-detects.) The compound representative concentrations are then compared with the chosen PRG for that compound, with the percentage excedence from the PRG determining the compound's toxicity. Compounds listed first are those above the PRG and are shown on the COC Decision screen. COC Decision Prevalence shows a list of COC recommendations from the available dataset based on the Prevalence of the compounds. Top COCs by prevalence were determined by examining a representative concentration for each well location at the site. The total excedences (values above the chosen PRGs) are compared to the total number of wells to determine the prevalence of the compound. Compounds listed first are those above the PRG and are shown on the COC Decision screen. Back: Returns the user to the COC Decision screen. Version 2.1 October 2004 25 Air Force Center for Environmental Excellence AFCEE MONITORING AND REMEDIATION OPTIMIZATION SYSTEM SOFTWARE Help: Provides information on the screen-specific input requirements. Version 2.1 October 2004 26 Air Force Center for Environmental Excellence AFCEE MONITORING AND REMEDIATION OPTIMIZATION SYSTEM SOFTWARE Site Details Initial Data Table (accessed from the COC Decision screen) allows the user to view the initial data table with the COCs chosen as well as the sample events defined and effective dates. This table is not available for editing, but should be used to check for proper importation and sorting of data for the rest of the analysis.. Back: Returns the user to the COC Decision screen. Next: Takes the user to the Main Menu screen. Help: Provides information on the screenspecific input requirements. At this point your data has been imported, the wells have been divided into source and tail zones, and the constituents of concern have been selected. You may now proceed to Trend Analysis to analyze the plume behavior. Continue to Step 3: Returns the user to the Main Menu to proceed to Trend Analysis to analyze the plume behavior. The Main Menu screen will be displayed. Create MAROS Archive File: There is also an option to create an archive file of the site details which have been entered, “Create MAROS Archive File” links to a dialog box where a ‘mdb’ file containing the imported data, site details and source and tail well designations can be stored for later importation (‘Import MAROS Archive File’ under ‘Data Management’).. The ‘mdb’ file created should be named to distinguish it from MAROS output files and other site related databases.. Version 2.1 October 2004 27 Air Force Center for Environmental Excellence AFCEE MONITORING AND REMEDIATION OPTIMIZATION SYSTEM SOFTWARE Plume Analysis The Plume Analysis Menu screen serves at the center of the trend analysis user interface. The user progressively steps through the Long Term Monitoring Plume Analysis process by navigating through the options displayed. As individual steps of the process are completed, options to select become successively available. The Plume Analysis Menu screen allows the user to choose between performing: • • • • • Step 3a: Data Consolidation Step 3b: Statistical Plume Analysis Step 3c: Spatial Moment Analysis Step 3d: External Plume Information Step 3e: MAROS Analysis Select the desired option by clicking the applicable button. Proceed through Steps 3a – 3e. The functions accessed by each choice are as follows: Data Consolidation: Allows reduction of data based on dates as well as consolidating duplicates based on statistical functions (i.e. average, median, etc.). This step also allows for assigning values to non-detects and J flag data. Statistical Plume Analysis: Perform Mann-Kendall Analysis and Linear Regression Analysis. Spatial Moment Analysis: Perform Moment Analysis (Zero, First, and Second Moments calculated). External Plume Information: Enter applicable modeling data and/or empirical data. MAROS Analysis: Allows user to weight the trend analysis data and weight well data. Final suggested monitoring system categories for each COC are displayed. Help: Provides additional information on software operation and screen-specific input requirements. Version 2.1 October 2004 28 Air Force Center for Environmental Excellence AFCEE MONITORING AND REMEDIATION OPTIMIZATION SYSTEM SOFTWARE Data Reduction Data Reduction: Part 1 of 2 (accessed from the Plume Analysis Menu screen) allows the user to consolidate the data based on time intervals and parameters chosen. Steps for use: 1) The box at the top of the screen indicates the current dataset time range. This is the location to specify the date range for the analysis. For example, if the import data ranges from 1979 to 2004, but the analyst is only interested in the time period from 1999 to 2003, the user can specify the date range at this location in the software. The user should specify the period of interest in the boxes or leave blank if all of the data is to be used. 2) Choose the option to consolidate the time period to consider within the dataset by clicking on the options on the bottom left of the screen. If you do not wish to perform any data consolidation, choose “Do Not Perform Time Consolidation”. 3) Choose the option to define the representative statistical dataset within the consolidated time interval at the bottom right of the screen. Note: This option is not needed if you have chosen “Do Not Perform Time Consolidation”. Back: Returns the user to the Plume Analysis Menu screen. Next: Takes the user to the Data Reduction Part 2 of 2 Screen. Help: Provides information on the screen-specific input requirements. Note: Data consolidation is recommended for datasets with greater than 40 sample events. Version 2.1 October 2004 29 Air Force Center for Environmental Excellence AFCEE MONITORING AND REMEDIATION OPTIMIZATION SYSTEM SOFTWARE Data Reduction Data Reduction: Part 2 of 2 (accessed from the Data Reduction Part 1 of 2 screen) allows the user to consolidate the data based on concentration parameters chosen. Select the factors by which you would like to limit the data. “Duplicates”: Choose the option to consolidate duplicates. Note: Duplicates are samples that have the same constituent, date, and well name. If you have given the same “effective date” to two samples they will be consolidated as duplicates. “Non-Detect (ND)”: Choose the number value you would like to represent a non-detect result in the data. If you would like to apply a specific detection limit for each chemical choose “Specified Detection Limit”. The suggested detection limit is the minimum detection limit. Note: Changes in detection limit over time can create artifacts such as false trends in the analysis when there are several non-detect samples. “Trace (TR)”: Choose the number value you would like to represent a Trace result in the data. (The “TR” flag is equivalent to the “J” flag used by most labs, to indicate a result that is reported but is below the method detection limit) Back: Returns the user to the Data Reduction Part 2 of 2 screen. Next: Takes the user to the Reduced Data Table Screen. Help: Provides information on the screen-specific input requirements. Version 2.1 October 2004 30 Air Force Center for Environmental Excellence AFCEE MONITORING AND REMEDIATION OPTIMIZATION SYSTEM SOFTWARE Data Reduction Reduced Data Table (accessed from the Data Reduction Part 2 of 2 screen) allows the user to view the reduced data table with the COCs chosen as well as the data consolidation performed. This table is not available for editing. Back: Returns the user to the Data Reduction Part 2 of 2 screen. Next: Takes the user to the Reduced Data Plot screen. Help: Provides information on the screenspecific input requirements. Reduced Data Plot (accessed from the Reduced Data Table screen) allows the user to view the reduced data in graphical form. Choose the Well and Chemical of interest from the dropdown boxes at the top of the screen. Choose the graph type (i.e. Log or Linear). Click “Graph” on graph to proceed. View Report: To print the current graph and data, click “View Report” to proceed. Back: Returns the user to the Reduced Data Table screen. Next: Takes the user to the Main Menu screen. Help: Provides information on the screenspecific input requirements. At this point your data has been reduced according to the parameters you entered. You may now proceed to Step 3b Statistical Plume Analysis and analyze the trends in the groundwater data. Version 2.1 October 2004 31 Air Force Center for Environmental Excellence AFCEE MONITORING AND REMEDIATION OPTIMIZATION SYSTEM SOFTWARE Statistical Plume Analysis Mann-Kendall Statistics (accessed from the Plume Analysis Menu) allows the user to view the Mann-Kendall Trend Analysis results by well and constituent. For further details on the MannKendall Analysis Method see Appendix A.2. To navigate the results for individual constituents click on the tabs at the top of the screen. COV: The Coefficient of Variation (COV) is a statistical measure of how the individual data points vary about the mean value. The coefficient of variation, defined as the standard deviation divided by the average. Values near 1.00 indicate that the data form a relatively close group about the mean value. Values either larger or smaller than 1.00 indicate that the data show a greater degree of scatter about the mean. MK (S): The Mann-Kendall Statistic (S) measures the trend in the data. Positive values indicate an increase in constituent concentrations over time, whereas negative values indicate a decrease in constituent concentrations over time. The strength of the trend is proportional to the magnitude of the Mann-Kendall Statistic (i.e., large magnitudes indicate a strong trend). Confidence in Trend: The “Confidence in Trend” is the statistical confidence that the constituent concentration is increasing (S>0) or decreasing (S<0). Concentration Trend: The “Concentration Trend” for each well is determined according to the rules outlined in Appendix A.2. Results for the trend include: Increasing, Probably Increasing, No Trend, Stable, Probably Decreasing, Decreasing or Not Applicable (Insufficient Data). The information displayed in this screen can also be viewed in report form, “Mann-Kendall Statistics Report” from the MAROS Output Screen or by clicking on “View Report” (see Appendix A.10 for an example report).. View Report: To print the “Mann-Kendall Statistics Report” (or save the report in pdf format) and consolidated data, click “View Report” to proceed. Back: Returns the user to the Plume Analysis Menu. Next: Takes the user to the Mann-Kendall Plot Screen. Help: Provides information on the screen-specific input requirements. Version 2.1 October 2004 32 Air Force Center for Environmental Excellence AFCEE MONITORING AND REMEDIATION OPTIMIZATION SYSTEM SOFTWARE Statistical Plume Analysis Mann-Kendall Plot (accessed from the Mann-Kendall Statistics screen) allows the user to view the Mann-Kendall Trend Analysis results by well and constituent. Choose the Well and chemical of interest from the dropdown boxes at the top of the screen. Choose the graph type (i.e. Log or Linear). Click “Graph” on graph to proceed. View Report: To print the current graph, click “View Report” to proceed. Back: Returns the user to the Mann-Kendall Statistics screen. Next: Takes the user to the Linear Regression Statistics screen. Help: Provides information on the screenspecific input requirements. Version 2.1 October 2004 33 Air Force Center for Environmental Excellence AFCEE MONITORING AND REMEDIATION OPTIMIZATION SYSTEM SOFTWARE Statistical Plume Analysis Linear Regression Statistics (accessed from the Mann-Kendall Plot screen) allows the user to view the Linear Regression Analysis results by well and constituent. For further details on the Linear Regression Analysis Method see Appendix A.2. To navigate the results for individual constituents click on the tabs at the top of the screen. COV: The Coefficient of Variation (COV) is a statistical measure of how the individual data points vary about the mean value. The coefficient of variation, defined as the standard deviation divided by the average. Values near 1.00 indicate that the data form a relatively close group about the mean value. Values either larger or smaller than 1.00 indicate that the data show a greater degree of scatter about the mean. Residuals COV: The Coefficient of Variation (COV) of the residuals is a statistical measure of how the residuals (the difference between the predicted values and observed values) vary about the mean value. Values near 1.00 indicate that the data form a relatively close group about the mean value, and that the Linear Regression statistics can be relied upon more strongly. Values either larger or smaller than 1.00 indicate that the data show a greater degree of scatter about the mean, and therefore the Mann-Kendall analysis should be relied upon more strongly. Slope: The slope of the least square fit through the given data indicates the trend in the data. Positive values indicate an increase in constituent concentrations over time, whereas negative values indicate a decrease in constituent concentrations over time. Confidence in Trend: The “Confidence in Trend” is the statistical confidence that the constituent concentration is increasing (slope>0) or decreasing (slope<0). Concentration Trend: The “Concentration Trend” for each well is determined according to the rules outlined in Appendix A.2. Results for the trend include: Increasing, Probably Increasing, No Trend, Stable, Probably Decreasing, Decreasing or Not Applicable (Insufficient Data). The information displayed in this screen can also be viewed in report form, “Linear Regression Statistics Report” from the MAROS Output Screen (see Appendix A.10 for an example report). Back: Returns the user to the Mann Kendall Plot Screen. Next: Takes the user to the Linear Regression Plot Screen. Help: Provides information on the screen-specific input requirements. Version 2.1 October 2004 34 Air Force Center for Environmental Excellence AFCEE MONITORING AND REMEDIATION OPTIMIZATION SYSTEM SOFTWARE Statistical Plume Analysis Linear Regression Plot (accessed from the Linear Regression Statistics screen) allows the user to view the linear regression data in graphical form. Choose the Well and chemical of interest from the dropdown boxes at the top of the screen. Choose the graph type (i.e. Log or Linear). Click “Graph” on graph to proceed. View Report: To print the current graph, click “View Report” to proceed. Back: Returns the user to the Linear Regression Statistics screen. Next: Takes the user to the Statistical Plume Analysis Summary screen. specific input requirements. Version 2.1 October 2004 Help: Provides information on the screen- 35 Air Force Center for Environmental Excellence AFCEE MONITORING AND REMEDIATION OPTIMIZATION SYSTEM SOFTWARE Summarizing Statistical Plume Analysis Trend Analysis Statistics Summary by Well (accessed from the Linear Regression Plot screen) allows the user to view the Mann-Kendall Trend Analysis and Linear Regression Analysis results by well and constituent. To navigate the results for individual constituents click on the tabs at the top of the screen. The information displayed in this screen can also be viewed in report form, “Statistical Plume Analysis Summary Report” from the MAROS Output Screen or by clicking on “View Report”. Back: Returns the user to the Linear Regression Plot. Next: Takes the user to the Main Menu Screen. Help: Provides information on the screenspecific input requirements. At this point the Mann-Kendall Trend Analysis and Linear Regression Analysis have been performed. You may now proceed to the Step 3c: Spatial Moment Analysis. Version 2.1 October 2004 36 Air Force Center for Environmental Excellence AFCEE MONITORING AND REMEDIATION OPTIMIZATION SYSTEM SOFTWARE Spatial Moment Analysis Moment Analysis Site Details (accessed from the Plume Analysis Menu screen) allows the user to enter data by well and constituent to be used in the Moment Analysis. Note: All Data entry items are mandatory. data required includes porosity, groundwater flow direction, approximate contaminant source location, and aquifer saturated thickness. The current version of MAROS only allows for designation of one source location and one saturated thickness. Back: Returns the user to the Plume Analysis Menu. Next: Takes the user to the Moment Analysis Statistics Screen. Help: Provides information on the screen-specific input requirements. Version 2.1 October 2004 37 Air Force Center for Environmental Excellence AFCEE MONITORING AND REMEDIATION OPTIMIZATION SYSTEM SOFTWARE Spatial Moment Analysis Moment Analysis Statistics (accessed from the Moment Analysis Site Details screen) allows the user to view the Spatial Moment Analysis results by well and constituent. To navigate the results for individual constituents click on the tabs at the top of the screen. Zeroth Moment (Estimated Mass): The zeroth moment is a mass estimate for each sample event and COC. The estimated mass is used to evaluate the change in total mass of the plume over time. of mass over time. First Moment (Center of Mass): The first moment estimates the center of mass of the plume (as coordinates Xc and Yc) for each sample event and COC. The center of mass locations indicate the movement of the center Second Moment (Spread of Plume): The second moment indicates the spread of the contaminant about the center of mass (Sxx and Syy), or the distance of contamination from the center of mass. The Second Moment represents the spread of the plume over time. The information displayed in this screen can also be viewed in report form, “Spatial Moment Analysis Report” from the MAROS Output Screen or by clicking on “View Report” (see Appendix A.10 for an example report). The next screens will go through each moment analysis result in detail as well as looking at trends in the data over time. For further details on the Spatial Moment Analysis Method see Appendix A.5. View Report: To print the “Spatial Moment Analysis Report” and analysis results, click “View Report” to proceed. Back: Returns the user to the Moment Analysis Site Details. Next: Takes the user to the Zeroth Moment Plot Screen. Help: Provides information on the screen-specific input requirements. Version 2.1 October 2004 38 Air Force Center for Environmental Excellence AFCEE MONITORING AND REMEDIATION OPTIMIZATION SYSTEM SOFTWARE Spatial Moment Analysis: Change in Dissolved Mass Over Time Zeroth Moment Plot (accessed from the Moment Analysis Statistics screen) allows the user to view the Zeroth Moment Analysis results by constituent over time. The zero moment in MAROS calculates an estimate of the mass of a constituent in the plume for each sample event. The estimated mass over time is then evaluated using the Mann Kendall method to determine the trend in total mass of the plume over time. Choose the chemical of interest from the dropdown boxes at the top of the screen. Choose the graph type (i.e. Log or Linear). Click “Graph” on graph to proceed. Zeroth Moment Trend: The Zero Moment trend over time is determined by using the Mann-Kendall Trend Methodology. The “Zeroth Moment” Trend for each COC is determined according to the rules outlined in Appendix A.2. Results for the trend include: Increasing, Probably Increasing, No Trend, Stable, Probably Decreasing, Decreasing or Not Applicable (Insufficient Data). MK (S): The Mann-Kendall Statistic (S) measures the trend in the data. Positive values indicate an increase in estimated mass over time, whereas negative values indicate a decrease in estimated mass over time. The strength of the trend is proportional to the magnitude of the Mann-Kendall Statistic (i.e., large magnitudes indicate a strong trend). Confidence in Trend: The “Confidence in Trend” is the statistical confidence that the estimated mass is increasing (S>0) or decreasing (S<0). COV: The Coefficient of Variation (COV) is a statistical measure of how the individual data points vary about the mean value. The coefficient of variation, defined as the standard deviation divided by the average. Values near 1.00 indicate that the data form a relatively close group about the mean value. Values either larger or smaller than 1.00 indicate that the data show a greater degree of scatter about the mean. View Report: To print the “Zeroth Moment Analysis Report” and analysis results, click “View Report” to proceed. Back: Returns the user to the Moment Analysis Site Details. Next: Takes the user to the First Moment Plot Screen. Help: Provides information on the screen-specific input requirements. Note: The information displayed in this screen can also be viewed in report form, “Zeroth Moment Report” from the MAROS Output Screen or by clicking on “View Report” (see Appendix A.10 for an example report). For further details on the Mann-Kendall Analysis Method or Moment Analysis see Appendix A.2 and A.5 respectively. Version 2.1 October 2004 39 Air Force Center for Environmental Excellence AFCEE MONITORING AND REMEDIATION OPTIMIZATION SYSTEM SOFTWARE Spatial Moment Analysis: Distance from Source to Center of Mass First Moment Plot: Distance from Source to Center of Mass (accessed from the Zero Moment Plot screen) allows the user to view the First Moment Analysis results by constituent over time. The first moment estimates the center of mass, coordinates (Xc and Yc) for each sample event and COC. The distance from the original source location to the center of mass locations indicate the movement of the center of mass over time relative to the original source. Choose the chemical of interest from the dropdown boxes at the top of the screen. Choose the graph type (i.e. Log or Linear). Click “Graph” on graph to proceed. First Moment Trend: The First Moment trend of the distance to the center of mass over time is determined by using the Mann-Kendall Trend Methodology. The “First Moment” trend for each COC is determined according to the rules outlined in Appendix A.2. Results for the trend include: Increasing, Probably Increasing, No Trend, Stable, Probably Decreasing, Decreasing or Not Applicable (Insufficient Data). MK (S): The Mann-Kendall Statistic (S) measures the trend in the data. Positive values indicate an increase in the distance from the source to the center of mass over time, whereas negative values indicate a decrease in the distance from the source to the center of mass over time. The strength of the trend is proportional to the magnitude of the Mann-Kendall Statistic (i.e., large magnitudes indicate a strong trend). Confidence in Trend: The “Confidence in Trend” is the statistical confidence that the distance to the from the source to the center of mass is increasing (S>0) or decreasing (S<0). COV: The Coefficient of Variation (COV) is a statistical measure of how the individual data points vary about the mean value. The coefficient of variation, defined as the standard deviation divided by the average. Values near 1.00 indicate that the data form a relatively close group about the mean value. Values either larger or smaller than 1.00 indicate that the data show a greater degree of scatter about the mean. View Report: To print the “First Moment: Distance from Source to Center of Mass Report” and analysis results, click “View Report” to proceed. Back: Returns the user to the Zeroth Moment Plot screen. Next: Takes the user to the First Moment Plot: Change in Location of Mass Over Time screen. Help: Provides information on the screen-specific input requirements. Note: The information displayed in this screen can also be viewed in report form, “First Moment Report” from the MAROS Output Screen or by clicking on “View Report” (see Appendix A.10 for an example report). For further details on the Mann-Kendall Analysis Method or Moment Analysis see Appendix A.2 and A.5 respectively. Version 2.1 October 2004 40 Air Force Center for Environmental Excellence AFCEE MONITORING AND REMEDIATION OPTIMIZATION SYSTEM SOFTWARE Spatial Moment Analysis: Change in Location of Mass Center Over Time First Moment Plot: Change in Location of Mass Over Time (accessed from the First Moment Plot: Distance from Source to Center of Mass screen) allows the user to view the First Moment Analysis results by constituent over time. The first moment estimates the center of mass of the plume coordinates (Xc and Yc) for each sample event and COC. The center of mass locations indicate the movement of the center of mass over time. Choose the chemical of interest from the dropdown boxes at the top of the screen. Choose the graph type (i.e. Log or Linear). Click “Graph” on graph to proceed. The source location coordinates are shown on the screen left. To view the data for the graph, choose “View Data”, this shows a table with the Xc, Yc, and Source Distance for all sample events. View Report: To print the “First Moment: Change in Location of Center of Mass Report” and analysis results, click “View Report” to proceed. Back: Returns the user to the First Moment Plot: Distance from Source to Center of Mass screen. Next: Takes the user to the Second Moment Plot screen. Help: Provides information on the screen-specific input requirements. Note: The information displayed in this screen can also be viewed in report form, “First Moment: Change in Location of Mass Center Over Time Report” from the MAROS Output Screen or by clicking on “View Report” (see Appendix A.10 for an example report). Version 2.1 October 2004 41 Air Force Center for Environmental Excellence AFCEE MONITORING AND REMEDIATION OPTIMIZATION SYSTEM SOFTWARE Spatial Moment Analysis: Change in Plume Spread Over Time Second Moment Plot: Change in Plume Spread Over Time (accessed from the First Moment Plot: Change in Location of Mass Over Time screen) allows the user to view the Second Moment Analysis results by constituent over time. The second moment indicates the spread of the contaminant about the center of mass (Sxx and Syy), or the distance of contamination from the center of mass. The Second Moment represents the spread of the plume over time in both the x and y directions. Choose the chemical of interest from the dropdown boxes at the top of the screen. Choose the graph type (i.e. Log or Linear). Choose the Covariance Type (i.e. Sxx or Syy). Click “Graph” on graph to proceed. Applicable (Insufficient Data). Second Moment Trend: The Second Moment trend of the Spread of the Plume in the X or Y direction over time is determined by using the Mann-Kendall Trend Methodology. The “Second Moment” trend for each COC is determined according to the rules outlined in Appendix A.2. Results for the trend include: Increasing, Probably Increasing, No Trend, Stable, Probably Decreasing, Decreasing or Not MK (S): The Mann-Kendall Statistic (S) measures the trend in the data. Positive values indicate an increase in the spread of the plume over time (expanding plume), whereas negative values indicate a decrease in the spread of the plume over time (shrinking plume). The strength of the trend is proportional to the magnitude of the Mann-Kendall Statistic (i.e., large magnitudes indicate a strong trend). Confidence in Trend: The “Confidence in Trend” is the statistical confidence that the spread of the plume in the x or y direction is increasing (S>0) or decreasing (S<0). COV: The Coefficient of Variation (COV) is a statistical measure of how the individual data points vary about the mean value. The coefficient of variation, defined as the standard deviation divided by the average. Values near 1.00 indicate that the data form a relatively close group about the mean value. Values either larger or smaller than 1.00 indicate that the data show a greater degree of scatter about the mean. View Report: To print the “Second Moment: Change Plume Spread Over Time Report” and analysis results, click “View Report” to proceed. Back: Returns the user to the First Moment Plot: Change in Location of Mass Over Time screen. Next: Takes the user to the Spatial Moment Analysis Summary screen. Help: Provides information on the screen-specific input requirements. Note: The information displayed in this screen can also be viewed in report form, “Second Moment: Change Plume Spread Over Time Report” from the MAROS Output Screen or by clicking on “View Report” (see Appendix A.10 for an example report). For further details on the Mann-Kendall Analysis Method or Moment Analysis see Appendix A.2 and A.5 respectively. Version 2.1 October 2004 42 Air Force Center for Environmental Excellence AFCEE MONITORING AND REMEDIATION OPTIMIZATION SYSTEM SOFTWARE Summarizing Spatial Moment Analysis Spatial Moment Analysis Summary (accessed from the Second Moment Plot: Change in Plume Spread Over Time screen) allows the user to view the Moment Analysis Mann-Kendall results by constituent. To navigate the results for individual constituents click on the tabs at the top of the screen. The information displayed in this screen can also be viewed in report form, “Spatial Moment Analysis Summary Report” from the MAROS Output Screen or by clicking on “View Report”. Back: Returns the user to the Second Moment Plot. Next: Takes the user to the Plume Analysis Menu Screen. Help: Provides information on the screenspecific input requirements. At this point the Spatial Moment Analysis has been performed. You may now proceed to the Step 3d: External Plume Information. Version 2.1 October 2004 43 Air Force Center for Environmental Excellence AFCEE MONITORING AND REMEDIATION OPTIMIZATION SYSTEM SOFTWARE External Plume Information External Plume Information: Modeling Results (accessed from the Plume Analysis Menu screen) allows the user to enter statistical modeling results by well and constituent or for all source or all tail wells. Options include entering modeling trend results i) based on separate modeling studies for both source and tail wells; ii) individual well trends based on separate modeling studies. If there are no modeling results choose the option “No separate modeling studies have been performed”. Back: Returns the user to the Plume Analysis Menu. Next: Takes the user to the External Plume Information screen. Note: If “Edit individual well trends based on separate modeling studies” is chosen, the next screen will allow this data entry. Help: Provides information on the screen-specific input requirements. External Plume Information: Modeling Results allows the user to enter modeling results obtained by methods different from Mann-Kendall or Linear Regression. Results of alternative statistical analyses can be entered by well and constituent. Enter the results from modeling studies (e.g. Increasing (I), Stable (S), etc.) in the blanks provided next to the well name. To navigate the results for individual constituents click on the tabs at the top of the screen. If you would like to weight all chemicals the same choose the button "All Chemicals". Otherwise enter the results for each COC and each well when you choose "Individual Chemicals". At a later step in this program you will be able to weight these lines of evidence. Modeling results should be taken from fate and transport models that take site specific data and predict the ultimate extent of constituent migration (either for natural attenuation process or site undergoing remediation). Results for the modeling trend that can be entered in the software include: Increasing (I), Probably Increasing (PI), No Trend (NT), Stable (S), Probably Decreasing (PD), Decreasing (D) or Not Applicable (NA- Insufficient Data). Version 2.1 October 2004 44 Air Force Center for Environmental Excellence AFCEE MONITORING AND REMEDIATION OPTIMIZATION SYSTEM SOFTWARE External Plume Information External Plume Information: Empirical Results (accessed from the External Plume Information: Modeling Results screen) allows the user to enter empirical trend information by well and constituent or for all source or all tail wells. The rationale and limitations to this approach is outlined in Appendix A.4. Options include entering empirical trend results i) based on separate empirical evidence for both source and tail wells; ii) individual well trends based on separate empirical rules. If there are no empirical results choose the option “No separate empirical evidence to be applied”. See Empirical Evidence: Takes the user to the Empirical Evidence, by State. Back: Returns the user to the Modeling Results. Next: Takes the user to the External Plume Information Summary Screen. Note: If “Edit individual well trends based on separate empirical studies” is chosen, the next screen will allow this data entry. Help: Provides information on the screen-specific input requirements. External Plume Information: Empirical Results allows the user to enter empirical results by well and constituent. Enter the results from empirical evidence (e.g. Increasing (I), Stable (S), etc.) in the blanks provided next to the well name. To navigate the results for individual constituents click on the tabs at the top of the screen. If you would like to weight all chemicals the same choose the button "All Chemicals". Otherwise enter the results for each COC and each well when you choose "Individual Chemicals". At a later step in this program you will be able to weight these lines of evidence. Empirical results should be developed on the basis of data from previous similar site studies (e.g. “plume-a-thon” studies such as the Lawrence Livermore study, the BEG studies and the AFCEE chlorinated database). For further Empirical result guidelines see Appendix A.4. Also, state rules are provided to guide the user to site-specific guidelines for natural attenuation. Results for the empirical trend that can be entered in the software include: Increasing (I), Probably Increasing (PI), No Trend (NT), Stable (S), Probably Decreasing (PD), Decreasing (D) or Not Applicable (NA- Insufficient Data). External Plume Information: Empirical Evidence (accessed from the External Plume Information: Empirical Results screen) gives the user guidance for empirical evidence for trends by State. Version 2.1 October 2004 45 Air Force Center for Environmental Excellence AFCEE MONITORING AND REMEDIATION OPTIMIZATION SYSTEM SOFTWARE External Plume Information To view information pertaining to the state of interest, choose the state name from the drop down box at the top left. Information on general guidelines and regulations specific for Long Term Monitoring are shown. Additional Data: Takes the user to the Screen Criteria, by State. Back: Returns the user to the Empirical Results. Help: Provides information on the screenspecific input requirements. Sources for this information include: Martinson, M., 1998 and Groundwater Services, Inc. (www.gsi-net.com/ rbcapol) External Plume Information: Screening Criteria (accessed from the External Plume Information: Empirical Evidence screen) gives the user additional guidance for empirical evidence for trends by State. To view information pertaining to the state of interest, choose the state name from the drop down box at the top left. Information on general guidelines and regulations specific for Long Term Monitoring are shown. Back: Returns the user to the Empirical Evidence. Help: Provides information on the screen-specific input requirements. At this point the Modeling and Empirical Trend results have been entered. You may now proceed to the Step 3e: LTM (Long Term Monitoring) Analysis to weight the Plume Information and analyze the trends in the groundwater data. Version 2.1 October 2004 46 Air Force Center for Environmental Excellence AFCEE MONITORING AND REMEDIATION OPTIMIZATION SYSTEM SOFTWARE MAROS Analysis Statistical and Plume Information Summary by Well (accessed from the Plume Analysis Menu screen) allows the user to view the Mann-Kendall Trend Analysis, Linear Regression Analysis, Modeling and Empirical results by well and constituent. To navigate the individual constituent results, click on the tabs at the top of the screen. The information displayed in this screen can also be viewed in report form, “Lines of Evidence Summary Report” from the MAROS Output Screen (see Appendix A.10 for an example report). Back: Returns the user to the Plume Analysis Menu. Next: Takes the user to the Statistical and Plume Information Summary Weighting Screen. Help: Provides information on the screen-specific input requirements. Version 2.1 October 2004 47 Air Force Center for Environmental Excellence AFCEE MONITORING AND REMEDIATION OPTIMIZATION SYSTEM SOFTWARE MAROS Analysis – Statistical and Plume Information Weighting Statistical and Plume Information Summary Weighting (accessed from the Statistical and Plume Information Summary by Well screen) allows the user to weight the individual lines of evidence (i.e. Mann-Kendall Trend Analysis, Linear Regression Analysis, Modeling and Empirical results). Each trend method is shown in the tab sheets. Choose to weight the trend methods applied to each COC individually by clicking "Individual Chemicals" (difficult approach) or choose to weight all chemicals by selecting "All Chemicals" (easy approach). Choices for weighting methods range from "High" to "Low". If you choose not to weight trend methods, leave the default of "All Chemicals" and "Medium" weight. If you choose to not include the “Empirical Evidence”, choose “Not Used”. When finished, click "Next" to see results of weighting. Back: Returns the user to the Statistical and Plume Information Summary by Well screen. Next: Takes the user to the Results of Information Weighting screen. Help: Provides information on the screen-specific input requirements. Results of Information Weighting (accessed from the Statistical and Plume Information Summary by Well screen) allows the user to view the weighted statistical, modeling and empirical lines of evidence for each COC. To navigate the results for individual constituents, click on the tabs at the top of the screen. Back: Returns the user to the Statistical and Plume Information Summary Weighting screen. Next: Takes the user to the Plume Information by Well Weighting screen. Help: Provides information on the screen-specific input requirements. Version 2.1 October 2004 48 Air Force Center for Environmental Excellence AFCEE MONITORING AND REMEDIATION OPTIMIZATION SYSTEM SOFTWARE MAROS Analysis – Weighting Wells Plume Information by Well Weighting (accessed from the Results of Information Weighting screen) allows the user to weight the individual wells by all chemicals or by constituent. To weight wells, select “Weight Wells” on the right side of the screen. Then, choose to either enter the weight of each well within individual COC datasets by clicking on "Individual Chemicals" (difficult approach) and then entering the weights in the column to the right of the results on each tab. Or choose to weight the data from each well for all COC's by clicking on "All Chemicals" (easy approach) and then entering the data on the front tab. Choices for weighting methods range from "High" to "Low". If you choose to weight trend methods, select “Do Not Weight Wells” on the right side of the screen. When finished, click "Next" to see results of weighting. Back: Returns the user to the Results of Information Weighting screen. Next: Takes the user to the Monitoring System Category screen. Help: Provides information on the screen-specific input requirements. Version 2.1 October 2004 49 Air Force Center for Environmental Excellence AFCEE MONITORING AND REMEDIATION OPTIMIZATION SYSTEM SOFTWARE MAROS Analysis- Overall Analysis Monitoring System Category (accessed from the Plume Information by Well Weighting screen) allows the user to view the suggested design category for each COC. Trend results for both tail and source wells are given. From these results a monitoring system category that characterizes the site for an individual constituent is shown. Categories include Extensive (E), Moderate (M), and Limited (L) long term monitoring required for the site. View Report: To Print a summary report click “View Report”. Back: Returns the user to the Plume Information by Well Weighting screen. Next: Takes the user to the Main Menu screen. Help: Provides information on the screen-specific input requirements. At this point in the software, your data has been analyzed and design category suggestions are complete. You may now proceed to the Main Menu and choose to either perform Well-by-Well Sampling Optimization Analysis or choose MAROS Output (Print Standard Reports/Graphs). Standard Approach Detailed Approach OVERALL PLUME RESULTS WELL SPECIFIC RESULTS MAROS Output: (Choose to Print/View Reports). Standard Reports, including the one-page heuristic approach to sampling optimization based on plume stability and site parameters with results for sampling frequency, duration and density. GOTO PAGE 82 Version 2.1 October 2004 Sampling Optimization: Rigorous detailed statistical approach to sampling optimization with modules to optimize sampling location by Delaunay Triagulation and Sampling Frequency by the Modified CES method or Power Analysis. GOTO PAGE 47 50 Air Force Center for Environmental Excellence AFCEE MONITORING AND REMEDIATION OPTIMIZATION SYSTEM SOFTWARE Sampling Optimization: Detailed Approach The Sampling Optimization Menu screen (accessed from the Main Menu screen by clicking Sampling Optimization) is the main menu for sampling optimization and data sufficiency analysis. It allows the user to choose between performing: • Sampling Location Analysis • Sampling Frequency Analysis • Data Sufficiency Analysis The functions accessed by each choice are as follows: Sampling Location Analysis Determines sampling locations by the Delaunay method, removing "redundant" sampling locations from the monitoring network, and/or add new sampling locations. The theoretical basis of the Delaunay method is given in Appendix A.3. Sampling Frequency Analysis Determines the sampling interval for each sampling location by the Modified CES method. The procedures used in the Modified CES method are given in Appendix A.9. Data Sufficiency Analysis Evaluates the cleanup status and concentration trend accuracy for individual wells and the riskbased site cleanup status using statistical power analysis. The theoretical basis of this analysis is given in Appendix A.6. Main Menu: Returns the user to the Main Menu screen. Reports on sampling optimization results are available by choosing MAROS Output in the Main Menu screen. Help: Provides additional information on software operation and screen-specific input requirements. Steps for use: 1) Either Sampling Location Analysis or Sampling Frequency Analysis can be performed first. Data Sufficiency Analysis (red label means it cannot be accessed) will become available only after Sampling Frequency Analysis has been successfully finished. 2) Result reports are available either during the analysis process or by choosing MAROS Output in the Main Menu screen. Version 2.1 October 2004 51 Air Force Center for Environmental Excellence AFCEE MONITORING AND REMEDIATION OPTIMIZATION SYSTEM SOFTWARE Well Redundancy Analysis: Delaunay Method Well Redundancy Analysis: Delaunay Method (accessed from the Sampling Optimization screen by clicking Sampling Location Analysis) is used to perform well redundancy analysis by the Delaunay method. This is designed to eliminate “redundant” locations from the monitoring network based on analysis of spatial sampling data. Details of the Delaunay method can be found in Appendix A.3. Confirm: Confirms the series of continuous sampling events selected by the user. The user can also choose to analyze one sampling event. Access Module: Applies the Delaunay method built within Microsoft Access to optimize sampling locations (suitable for multiple events). Excel Module: Applies the Delaunay method built within Microsoft Excel that includes a graphical interface and flexible operations. Data are sent to Excel Module and results will be transferred back. This is applicable to the analysis of only one sampling event. Back: Returns the user to the Sampling Optimization screen. Help: Provides additional information on software operation and screen-specific input requirements. Steps for use: 1) Select the sampling events for analysis by choosing from the From and To dropdown lists or typing in the names of the sampling events. The From sampling event should be no later than the To sampling event. If one sampling event is to be analyzed, simply select the same sampling event in both dropdown lists. 2) Click button Confirm to confirm the selection. After confirmation, the Access Module button will be activated. The Excel Module button will be activated only if the sampling events in both From and To dropdown lists are the same. 3) Click either Access Module or Excel Module (if activated) to proceed. Version 2.1 October 2004 52 Air Force Center for Environmental Excellence AFCEE MONITORING AND REMEDIATION OPTIMIZATION SYSTEM SOFTWARE Access Module – Potential Locations Setup This screen (accessed from the Well Redundancy Analysis: Delaunay Method screen by clicking Access Module) is used to set up the properties of potential locations and the options used in the Delaunay method. Selected?: Decides whether or not a location is included in the analysis. Check the button to include or uncheck the button to remove this location from the list of potential locations. Removable?: Decides whether or not a location is allowed to be eliminated by the optimizing process if it is considered to be redundant. For example, a sentinel well might be unchecked since it cannot be eliminated. Select All: Sets all the sampling locations as potential locations. The Selected? status will be set to True for all locations for the selected COC. Back: Returns the user to the Well Redundancy Analysis: Delaunay Method screen. Options: Shows screen Well Redundancy Analysis – Options, where the optimization parameters can be set. Otherwise, the default settings or the settings from the previous analysis will be used. Preliminary Analysis: Calculates the sampling-events-averaged Slope Factor (SF) values for all locations for each COC and then proceeds to the Access Module – Slope Factor Values screen. Help: Provides additional information on software operation and screen-specific input requirements. Steps for use: 1) Browse sampling locations for each COC by clicking the tab on the page frame. For example, click “Benzene” to view sampling locations where Benzene concentrations were measured. 2) Remove a location from the potential locations by unselecting the Selected? check box. Select Removable? check box to decide if a location can be eliminated by the optimizing process. 3) Set up the properties of potential locations for all COCs and then proceed to Preliminary Analysis. During the process, you can click button Options to change the optimization parameters that are used by the Delaunay method. Each COC has its own parameters. Note: The Slope Factor in MAROS is a parameter indicating the relative importance of a location in the monitoring network, and is not related to toxicological values for a particular COC (i.e., carcinogenic risk). Version 2.1 October 2004 53 Air Force Center for Environmental Excellence AFCEE MONITORING AND REMEDIATION OPTIMIZATION SYSTEM SOFTWARE Well Redundancy Analysis - Options This screen (accessed from the Access Module – Potential Locations Setup screen by clicking Options) is used for setting the optimization parameters (thresholds) that are used by the Delaunay method. Each COC has its own set of parameters. These parameters include Inside node Slope Factor (SF), Hull node Slope Factor, Area Ratio (AR), and Concentration Ratio (CR). The default values for these parameters are 0.10, 0.01, 0.95 and 0.95, respectively, for all COCs. For detailed explanations of these parameters, refer to Appendix A.3. The user can change parameters by entering new values in the corresponding fields directly. Locations Setup screen. Back: Keeps the changes made by the user and returns the user to the Access Module – Potential Set to default: Sets all parameters for all COCs to the system default. Help: Provides additional information on software operation and screen-specific input requirements. Version 2.1 October 2004 54 Air Force Center for Environmental Excellence AFCEE MONITORING AND REMEDIATION OPTIMIZATION SYSTEM SOFTWARE Access Module - Slope Factor Values This screen (accessed from the Access Module – Potential Locations Setup screen by clicking Preliminary Analysis) is used to display the sampling-events-averaged SF values of sampling locations for each COC. The lumped SF value of a location provides a measure of its overall importance to a monitoring network. Avg. SF: Displays the lumped SF value of a location that is calculated by averaging the SF values obtained in each sampling event across all sampling events selected by the user. Min. SF: Displays the minimum SF value of a location obtained from one of the sampling events. Max. SF: Displays the maximum SF value of a location obtained from one of the sampling events. Back: Returns the user to the Access Module – Potential Locations Setup screen. Optimize by COC: Performs optimization for each COC by eliminating redundant sampling locations in each COC and then proceeds to the Access Module – Results by COC screen. Help: Provides additional information on software operation and screen-specific input requirements. Note: the Slope Factor in MAROS is a parameter indicating the relative importance of a location in the monitoring network, and is not related to toxicological values for a particular COC (i.e., carcinogenic risk). Version 2.1 October 2004 55 Air Force Center for Environmental Excellence AFCEE MONITORING AND REMEDIATION OPTIMIZATION SYSTEM SOFTWARE Access Module - Results by COC This screen (accessed from the Access Module – Slope Factor Values screen by clicking Optimize by COC) is used to display the sampling location optimization results for each COC. Redundant locations that are eliminated are marked. The remaining locations are unmarked and are recommended for the next round of sampling. Elimination of a location from a COC only means to stop sampling for that COC at that location, since other COCs may still need to be sampled at this location. SF value: Displays the lumped SF value of a location that is calculated by averaging the SF values obtained in each sampling event across all sampling events selected by the user. Eliminated?: Displays whether or not a location is considered redundant and should be eliminated. A check mark in this field stands for the elimination of a location. Back: Returns the user to the Access Module – Slope Factor Values screen. View Report: Generates a report with sampling location optimization results for each COC. This report can be viewed or printed. The user can go back to re-run the analysis by changing parameters or selecting a different series of sampling vents. Compare Across COCs: Determines the conservative all-in-one results by considering all COCs and then proceeds to the Access Module – All-in-one Results screen. Help: Provides additional information on software operation and screen-specific input requirements. Version 2.1 October 2004 56 Air Force Center for Environmental Excellence AFCEE MONITORING AND REMEDIATION OPTIMIZATION SYSTEM SOFTWARE Access Module - All-in-one Results This screen (accessed from the Access Module – Results by COC screen by clicking Compare Across COCs) is used to display the conservative all-in-one sampling location optimization results. A location is marked for elimination only if this location is eliminated from all COCs. Here elimination of a location is equivalent to stopping sampling at this location. Eliminated?: Displays whether or not a location is considered redundant and should be eliminated. A check mark in this field stands for the elimination of a location. Back: Returns the user to the Access Module – Results by COC screen. View Report: Generates a report with the all-in-one sampling location optimization results. This report can be viewed or printed. The user can go back to re-run the analysis by changing parameters or selecting a different series of sampling events. Next: Proceeds to the Well Sufficiency Analysis screen. Help: Provides additional information on software operation and screen-specific input requirements. Version 2.1 October 2004 57 Air Force Center for Environmental Excellence AFCEE MONITORING AND REMEDIATION OPTIMIZATION SYSTEM SOFTWARE Well Sufficiency Analysis – New Locations This screen (accessed from the Access Module – All-in-one Results screen by clicking Next) is a control screen for applying a Microsoft Excel module that is used to perform well redundancy analysis, that is, recommending potential areas for new sampling locations. COC: Selects the COC you want to analyze from the dropdown list. Selected?: Decides whether or not a location is included in the analysis of new sampling locations. All wells are selected by default. Analysis: Runs the Microsoft Excel module. The xlsNewLocation worksheet will pop up and becomes the current screen. The analysis is performed for the currently selected COC. Reset: Selects all the sampling locations for the current COC. The Selected? status of each location will be set to True. Back: Returns the user to the Access Module – All-in-one Results screen. Next: Proceed to the Sampling Location Analysis Complete – Access Module screen. Help: Provides additional information on software operation and screen-specific input requirements. Steps for use: 1) Choose the COC for analysis by selecting from the COC dropdown list or typing in the name. 2) Set the Selected? check box of a location to decide whether this location is included in the analysis. 3) Click the Analysis button and the screen will switch to Excel worksheet xlsNewLocation. The data will be transferred to xlsNewLocation. 4) Run xlsNewLocation following instructions given in screen xlsNewLocation (introduced below). Version 2.1 October 2004 58 Air Force Center for Environmental Excellence AFCEE MONITORING AND REMEDIATION OPTIMIZATION SYSTEM SOFTWARE xlsNewLocation xlsNewLocation (accessed from the Well Sufficiency Analysis – New Locations screen by clicking Analysis) is a Microsoft Excel worksheet used to display the well sufficiency analysis results, i.e., recommending potential areas for new sampling locations. Method details can be found in the last section of Appendix A.3 The results are shown in the Well Locations chart-sheet, which is shown below. A plot area is located in the center where the sampling locations are plotted in the state coordinate system (or relative coordinate system). Graph legends and command buttons are on the right side of the chart. Estimated SF Level: The estimated Slope Factor (SF) value at a potential area (indicated by a triangle formed by blue lines) for new sampling locations. The SF value is used to quantify the concentration estimation error at a potential area. The larger the SF value, the greater the estimation error. Potential areas with high SF values could be regions in which new wells can be placed. SF values are classified into four levels: S–Small (<0.3), M–Moderate (0.3~0.6), L–Large (0.6~0.9), and E–Extremely large (0.9~1.0). A colored label around the center (centroid) of each triangle is used to indicate the SF level at a potential area. Back to Access: Switches to the MAROS interface in Microsoft Access. The user loads and enters this module from the Well Sufficiency Analysis – New Locations screen by clicking the Analysis button. The data will be transferred from Microsoft Access and the Version 2.1 October 2004 59 Air Force Center for Environmental Excellence AFCEE MONITORING AND REMEDIATION OPTIMIZATION SYSTEM SOFTWARE analysis is completed once the xlsNewLocation interface shows up. The user can proceed with the following steps: 1) Search the potential areas for new sampling locations with L (large) or E (extremely large) labels. New wells could be placed inside these regions, e.g., at the centroid of a triangle. 2) Click Back to Access to return to Microsoft Access. The xlsNewLocation worksheet will remain open until the user closes it. The user can save the file with another name to prevent the current results from being overridden by a new analysis. 3) To perform another analysis, choose a COC from the Well Sufficiency Analysis – New Locations screen and then click the Analysis button to enter the xlsNewLocation module, then go to step 1. WARNING: folders. Do not change the name of worksheet xlsNewLocation or move it to other However, you can use the Excel menu option ‘Save As’, and save the file under a different name. It will open with the saved data in the future. The data display can also be saved as a pdf file using the Adobe Acrobat application. Version 2.1 October 2004 60 Air Force Center for Environmental Excellence AFCEE MONITORING AND REMEDIATION OPTIMIZATION SYSTEM SOFTWARE Sampling Location Analysis Complete – Access Module This screen (accessed from the Well Sufficiency Analysis – New Locations screen by clicking Next) is a message screen telling that sampling location determination by the Access Module has been completed and the user can go back to proceed to other analyses. Back: Returns the user to the Well Sufficiency Analysis – New Locations screen. The user can go back to re-run the analysis by changing parameters or selecting a different series of sampling vents. Sampling Optimization: Returns the user to the Sampling Optimization screen. Version 2.1 October 2004 61 Air Force Center for Environmental Excellence AFCEE MONITORING AND REMEDIATION OPTIMIZATION SYSTEM SOFTWARE Well Redundancy Analysis – Excel Module Well Redundancy Analysis – Excel Module (accessed from the Well Redundancy Analysis: Delaunay Method screen by clicking Excel Module) is a control screen for applying the Delaunay method in a stand-alone Microsoft Excel module. It is used for 1) setting up the properties of potential locations; 2) proceeding to the Excel module for optimization; and 3) displaying the results transferred back from the Excel Module. The stand-alone Excel module "xlsDelaunay2K" is explained below. The data table is similar to that in the screen Access Module - Potential Locations Setup. COC: Selects the COC you want to analyze from the dropdown list. Analysis: Runs the Excel module. The xlsDelaunay2K worksheet will be opened and becomes the current screen. The analysis is performed for the currently selected COC and for one sampling event only. Reset: Sets all the sampling locations in a COC as potential locations. The Selected? status of each location will be set to True. Back: Returns the user to the Well Redundancy Analysis: Delaunay Method screen. View Report: Generates a report with sampling location optimization results for the one sampling event selected by the user. The user should analyze COCs before viewing the report. After getting feedback from the report, the user can go back to re-run the analysis by changing parameters or selecting a different series of sampling vents. Next: Proceed to the Excel Module – All-in-one Results screen. Help: Provides additional information on software operation and screen-specific input requirements. Steps for use: 1) Choose the COC for analysis by selecting from the COC dropdown list or typing in the name. 2) Set the Selected? check box of a location to decide whether this location is included in the analysis. Set Removable? check box to decide whether a location can be eliminated by the optimizing process. Or 2) Set the Selected? and Removable? status of a location by using the Shortcut Menu in worksheet xlsDelaunay2K. This can be performed only when the worksheet xlsDelaunay2K is running. 3) Press button Analysis and the screen will switch to worksheet xlsDelaunay2K. The data will be transferred to worksheet xlsDelaunay2K. Version 2.1 October 2004 62 Air Force Center for Environmental Excellence AFCEE MONITORING AND REMEDIATION OPTIMIZATION SYSTEM SOFTWARE 4) Run worksheet xlsDelaunay2K by following the instructions shown in screen xlsDelaunay2K (introduced shortly). 5) After finishing analysis in worksheet xlsDelaunay2K, send results back by pressing Back to Access button. The screen will switch back and locations that have been eliminated will be shown in field Eliminated?. Selected? and Removable? fields will also be updated if any change has been made in module xlsDelaunay2K. 6) Select other COCs and go back to step 1 until all the COCs have been analyzed. Version 2.1 October 2004 63 Air Force Center for Environmental Excellence AFCEE MONITORING AND REMEDIATION OPTIMIZATION SYSTEM SOFTWARE xlsDelaunay2K xlsDelaunay2K (accessed from the Well Redundancy Analysis – Excel Module screen by clicking Analysis) is a stand-alone Microsoft Excel worksheet used to perform well redundancy analysis by the Delaunay method. This worksheet contains two parts: a chart-sheet Well Locations and a datasheet DataSheet. The user can click the sheet tab on the lower left corner of the worksheet to switch between the two parts. The Well Locations chart-sheet is shown on the next page. The figure below shows the DataSheet. Back to Access: Sends results back to the Microsoft Access screen Well Redundancy Analysis – Excel Module. The user can also do this by clicking the button with the same name in the Well Locations chart-sheet. Source Data Part: Stores the data transferred from Microsoft Access. Output Part: Outputs some of the intermediate results generated during the optimizing process, including the wells eliminated, area ratio and concentration ratio. WARNING: Before clicking the Back to Access button, the user should have performed the optimization by using the Well Locations chart-sheet (see instructions on the next page). If not, the original set of data will be returned. Do not make changes in this sheet. Furthermore, it is recommended that the user operate in the Well Locations chart-sheet. Version 2.1 October 2004 64 Air Force Center for Environmental Excellence AFCEE MONITORING AND REMEDIATION OPTIMIZATION SYSTEM SOFTWARE The Well Locations chart-sheet is shown below. A plot area is located in the center where the sampling locations are plotted in the EAST-NORTH coordinate system (or relative coordinates system). The legend is in the upper right side. The middle right side contains the command buttons used to control the optimization process. INIT/Apply: Initializes the program in order to begin an analysis. This is a starting point. Reset All: Allows all potential locations to be selected. This is very helpful when you have eliminated some locations and then want to recover them. Clear/Resume: To clear/resume all the lines drawn on the plot area. It is only a switch for graphic output. Data will not be altered. Terminate: Clears memory and stops the program while remaining in the worksheet. To restart an analysis after pressing this button, press INIT/Apply again. Optimize: Performs optimization, i.e., eliminating "redundant" locations from the network. Options: Shows the Options Form that includes optimization parameters used in the Delaunay method and the options for graphic output. Back to Access: Sends results back to the Microsoft Access screen Well Redundancy Analysis – Excel Module. Version 2.1 October 2004 65 Air Force Center for Environmental Excellence AFCEE MONITORING AND REMEDIATION OPTIMIZATION SYSTEM SOFTWARE The Options Form can only be used in the Well Locations chart-sheet. The Option Form is accessed by clicking the Options button. It has two pages. Shown on the left is the Optimization page. Parameters include Inside node Slope Factor (SF), Hull node Slope Factor, Area Ratio (AR), and Concentration Ratio (CR). The default values are the same as those in the Access Module. Set to default: Sets the parameters to system default. The button will be activated only if the parameter value is not equal to the default value. Shown on the left is the Drawing Control page. Plot Delaunay Triangulation: By checking this box, the blue triangulation lines will be plotted in the plot area of the chart-sheet. Plot Voronoi Diagram: By checking this box, the Voronoi diagram (or Thiessen polygon) will be plotted in the plot area of the chart-sheet. Ok: Saves user changes to the parameters and closes this form. The changes will be effective the next time the user performs an optimization. The drawing options will be effective immediately. Cancel: Cancels user changes and quits the form. The Shortcut Menu allows you to locate a node (location) on the graph and sets its Selected? status and Removale? status easily. The shortcut menu is available only in the Well Locations chart-sheet. To access the Shortcut Menu, click left mouse button on a node or the name of the node beside it. Click again at the same place and the shortcut menu will pop up. The first click ensures the data-series has been selected. The second click returns the node information to the program. Remove from system: Excludes a node from the network by setting Selected? status to False. Add to system: Includes or inserts a node into the network by setting Selected? status to True. Make Removable: Makes a node removable by setting Removable? status to True. Make Irremovable: Makes a node irremovable by setting Removable? status to False. Version 2.1 October 2004 66 Air Force Center for Environmental Excellence AFCEE MONITORING AND REMEDIATION OPTIMIZATION SYSTEM SOFTWARE Steps for use: 1) Start the program (only if it is not automatically loaded) by clicking the INIT/Apply button in the Well Locations chart-sheet. The Delaunay triangles are plotted by default. 2) Set the optimization and drawing control parameters in the Options Form. Activate this form by clicking the Options button in the Well Locations chart-sheet. You can skip this step if you want to use the default parameters. 3) If you do not want to see graphs in the plot area, click the Clear/Resume button in the Well Locations chart-sheet. Clicking it again will turn on the graph output. You can also achieve this by deselecting the two drawing parameters in the Options Form. 4) If you want to use all locations as potential locations for analysis when some of them have previously been eliminated, click the Reset All button in the Well Locations chart-sheet. This action will reset the potential locations and redraw the graph. 5) Perform optimization by clicking the Optimize button in the chart-sheet Well Locations. If locations are eliminated from the network, you may notice the change in the graph, if the graph output is turned on. 6) Check the results in the plot area in the Well Locations chart-sheet or in the Output Part in the DataSheet. If you want to change parameters and run the analysis again, go back to step 2. 7) Send results back to Access (the Well Redundancy Analysis – Excel Module screen) by clicking the Back to Access button. This will work only when this worksheet is loaded through MAROS. Or 7) Stop the program by clicking the Terminate button in the Well Locations chart-sheet. Go to Step 1 if you want to re-analyze. The xlsDelaunay2K worksheet will remain open until the user closes it. All the results and graph output are kept if the user chooses to save the file before closing it. The graph output in the plot area is similar to the screen shot shown below: WARNING: Version 2.1 October 2004 Do not change the name of worksheet xlsDelaunay2K or move it to other folders. 67 Air Force Center for Environmental Excellence AFCEE MONITORING AND REMEDIATION OPTIMIZATION SYSTEM SOFTWARE Excel Module - All-in-one Results This screen (accessed from the Well Redundancy Analysis – Excel Module screen by clicking Next) is used to display the all-in-one sampling location optimization results for the analysis of only one sampling event. A location is marked for elimination only if this location is eliminated for all COCs. Elimination of a location is interpreted as stopping sampling at this location. If in the previous step some COCs were not analyzed, the results given in this form may be incorrect due to incomplete analyses. Eliminated?: Displays whether a location is considered redundant and should be eliminated. A check mark in this field stands for the elimination of a location. Back: Returns the user to the Well Redundancy Analysis – Excel Module screen. Next: Proceeds to the Sampling Location Analysis Complete – Excel Module screen. View Report: Generates a report with the all-in-one sampling location optimization results. The user can then go back to re-run the analysis by changing parameters or by selecting a different series of sampling events. If not all COCs are analyzed in the previous step, results shown in the report may be incorrect due to incomplete analysis. Help: Provides additional information on software operation and screen-specific input requirements. Sampling Location Analysis Complete – Excel Module This screen (accessed from the Excel Module – All-in-one Results screen by clicking Next) is a message screen indicating that the sampling location determination by the Excel module has been completed and the user can proceed to other analyses. Back: Returns the user to the Excel Module – All-inone Results screen. The user can go back to re-run the analysis by changing parameters or by selecting a different series of sampling vents. Go to Sampling Optimization: Returns the user to the Sampling Optimization screen. Version 2.1 October 2004 68 Air Force Center for Environmental Excellence AFCEE MONITORING AND REMEDIATION OPTIMIZATION SYSTEM SOFTWARE Sampling Frequency Analysis Sampling Frequency Analysis (accessed from the Sampling Optimization screen by clicking Sampling Frequency Analysis) is the control screen to determine the frequency of sampling at each location. The Modified CES method (adopted from Cost Effective Sampling by Ridley et al. 1998) is applied. This method is based on the analysis of recent and overall trends of COC concentrations. Details of the method are available in Appendix A.9. The term “recent period” refers to the time period in which the latest series of sampling events occurred. It is used to differentiate for example, the latest two years of sampling, from the history of sampling (all sampling events). The “recent period” could contain any series of continuous sampling events ending with the latest sampling event. From: Selects a sampling event from the dropdown list as the beginning of the “recent period”. To: Selects a sampling event as the end of the “recent period”. Confirm: Confirms the “recent period” defined by the user. Options: Shows the Sampling Frequency Analysis - Options screen, where the Rate of Change parameters for analyzing the concentration trends can be set. Back: Returns the user to the Sampling Optimization screen. Analysis: Determines sampling frequencies at all sampling locations for each COC by using the Modified CES method. The Sampling Frequency Recommendation screen will pop up. Help: Provides additional information on software operation and screen-specific input requirements. Steps for use: 1) Define the “recent period” first. The ending sampling event should be later than the beginning sampling event. A minimum of six sampling events is recommended for the analysis. For analysis with less than six samples, the results could be inaccurate. Or 1) Use previously selected sampling events shown on the From and To dropdown lists. 2) Click the Confirm button to confirm the selection. 3) Click the Options button and enter the Sampling Frequency Analysis – Options screen. Define field specific Rate of Change parameters for COCs there. Close that screen and return. Default values will be used if parameters are not defined. 4) Click the Analysis button to perform the analysis. Version 2.1 October 2004 69 Air Force Center for Environmental Excellence AFCEE MONITORING AND REMEDIATION OPTIMIZATION SYSTEM SOFTWARE Sampling Frequency Analysis - Options This screen (accessed from the Sampling Frequency Analysis screen by clicking Options) is used for setting the Rate of Change (ROC) parameters that are required by the Modified CES method. Appendix A.9 for details. These parameters include Low Rate, Medium Rate and High Rate. Here Cleanup Goal (PRG: Preliminary Remediation Goal, mg/L) is used as a reference for defining the rate of change parameters. By default, the low rate is defined as 0.5 PRG/year, medium rate is defined as 1.0 PRG/year and high rate is defined as 2.0 PRG/year, for a certain COC. When Cleanup Goal of a COC is not available in the database, the user is prompted to enter the value and the three rate parameters. Otherwise, this COC will not be analyzed. The user should provide specific Rate of Change values for a specific field of study, if available. Refer to Back: Closes this screen and returns to the Sampling Frequency Analysis screen. Set to default: Sets all these parameters to system default. Help: Provides additional information on software operation and screen-specific input requirements. Version 2.1 October 2004 70 Air Force Center for Environmental Excellence AFCEE MONITORING AND REMEDIATION OPTIMIZATION SYSTEM SOFTWARE Sampling Frequency Recommendation Sampling Frequency Recommendation (accessed from the Sampling Frequency Analysis screen by clicking Analysis) is used to display the frequency of sampling for each sampling location and each COC. Select the page with a certain COC name to display the recommended results for that COC. Sampling Frequency: The final frequency recommendation determined based on overall and recent trends and other factors. Recent Result: The frequency determined based on the recent period of data. Overall Result: The frequency determined based on the overall period of data. Back: Returns the user to the Sampling Frequency Analysis screen, where the user can change Rate of Change parameters and perform a new analysis. View Report: Generates a report with sampling frequency recommendations for the sampling events selected by the user. The user can go back to re-run the analysis by changing parameters or selecting a different series of sampling vents. Next: Proceed to the Sampling Frequency Analysis Complete screen. Help: Provides additional information on software operation and screen-specific input requirements. Version 2.1 October 2004 71 Air Force Center for Environmental Excellence AFCEE MONITORING AND REMEDIATION OPTIMIZATION SYSTEM SOFTWARE Sampling Frequency Analysis Complete This screen (accessed from the Sampling Frequency Recommendation screen by clicking Next) is a message screen indicating that sampling frequency determination has been completed and the user can proceed to other analyses. Back: Returns to the Sampling Frequency Recommendation screen. The user can go back to rerun the analysis by changing parameters or selecting a different series of sampling vents. Sampling Optimization: Returns the user to the Sampling Optimization screen. Version 2.1 October 2004 72 Air Force Center for Environmental Excellence AFCEE MONITORING AND REMEDIATION OPTIMIZATION SYSTEM SOFTWARE Data Sufficiency Analysis Menu Data Sufficiency Analysis Menu (accessed from the Sampling Optimization screen by clicking Data Sufficiency Analysis) is the main menu for data sufficiency analysis that includes two types of statistical power analyses. It allows the user to choose between performing: • Power Analysis at Individual Wells • Risk-Based Power Analysis The analyses accessed by each choice are as follows: Power Analysis at Individual Wells Determines the cleanup status of individual wells using a sequential t-test from EPA (1992). An optional power analysis based on the Student’s t-test on mean difference is also provided. Refer to Appendix A.6 for details. Risk-based Power Analysis Determines the risk-based site cleanup status using estimated concentrations projected to the compliance boundary (delineated based on the nearest downgradient receptor). Concentrations from wells in a sampling event are used as a group in this analysis. Refer to Appendix A.6 for details. Back: Returns the user to the Sampling Optimization screen. Options: Shows the Data Sufficiency Analysis – Options screen where the parameters for the two types of analyses are defined. Help: Provides information on the screen-specific input requirements. Steps for use: 1) Check data sufficiency analysis parameters by clicking the Options button. The user can choose to use the default values or specify new values for the parameters. Missing or invalidated values of certain parameters may prevent the analysis from proceeding. 2) Since the two analyses are independent from each other, the user can choose to perform any analysis first. Version 2.1 October 2004 73 Air Force Center for Environmental Excellence AFCEE MONITORING AND REMEDIATION OPTIMIZATION SYSTEM SOFTWARE Data Sufficiency Analysis – Options This screen (accessed from the Data Sufficiency Analysis Menu screen by clicking Options) is used for setting the parameters required in the statistical power analysis. These parameters include Cleanup Goal (the PRG, mg/L), Target Level (mg/L), Alpha Level (the significance level), Target Power, and Detection Limit (mg/L). The Cleanup Goal is by default set to the Maximum Contaminant Level (MCL) of a COC. If there is no available Cleanup Goal for a COC in the database, the user is asked to define it and the Target Level. Otherwise, the analysis for that COC will be canceled. By default, the Target Level is set to 0.8PRG), the Alpha Level (the significance level of a statistical test) is set to 0.05 and the Target Power (false negative rate) is set to 0.80. In the risk-based power analysis, the Detection Limit specified here is used to indicate whether the projected concentration is less than it. If the user has already specified uniform Detection Limits in the Data Reduction: Part 2 of 2 screen, they will show up in this screen as default values. Refer to Appendix A.6 for details. Back: Returns to the Data Sufficiency Analysis Menu screen. Set to default: Sets all parameters to the system default. Help: Provides information on the screen-specific input requirements. Version 2.1 October 2004 74 Air Force Center for Environmental Excellence AFCEE MONITORING AND REMEDIATION OPTIMIZATION SYSTEM SOFTWARE Individual Well Cleanup Status This screen (accessed from the Data Sufficiency Analysis Menu screen by clicking Analysis 1) is used for selecting the type of data (yearly averages or original data) and time period (defined by a series of sampling events) used in the cleanup status evaluation for individual wells. 1. Select the type of data: Two types of data can be used: yearly averages or original data from each sampling event. A yearly average is obtained by averaging data for that year and is treated as one sample. The original data from each sampling event can be reduced in Data Reduction. Yearly averages are recommended if there are more than 4 years of data. At least 4 data (yearly averages or original data) are required for the analysis. Click on the option box to select the type of data you want to use. 2. Select the time period for evaluation: Concentration data from an individual well over the time period specified will be used in the analysis. Selecting a different time period may lead to different results. From: Selects the starting year from the dropdown list. To: Selects the ending year from the dropdown list. Back: Returns the user to the Data Sufficiency Analysis Menu screen. Analysis: Calculates the cleanup status, power, and expected sample size for each individual well for each COC for the time period selected by the user. The Individual Well Cleanup Status Results screen will pop up. Help: Provides additional information on software operation and screen-specific input requirements. Version 2.1 October 2004 75 Air Force Center for Environmental Excellence AFCEE MONITORING AND REMEDIATION OPTIMIZATION SYSTEM SOFTWARE Individual Well Cleanup Status Results This screen (accessed from the Individual Well Cleanup Status screen by clicking Analysis) is used to display the results for individual well cleanup status evaluations, grouped by COC. Sample Size: The number of data records (yearly averages or original data) that is used in the evaluation. Cleanup Achieved?: Indicates whether the cleanup goal is achieved in the well. Results could be Attained, Cont. Sampling (continue sampling), Not Attained, or N/C (not conducted due to insufficient data). To facilitate the power analysis, concentration data are assumed to be either normally or lognormally distributed. Results for both assumptions are calculated and provided for comparison. See Appendix A.6 for detailed explanations. View Normal: Views results calculated under the assumption that data are normally distributed. View Log: Views results calculated under the assumption that data are lognormally distributed. Optional Power Analysis: Shows the Individual Well Cleanup Status – Optional Power Analysis screen where power analyses results based on the Student’s t-test on mean difference are given. Back: Returns the user to the Individual Well Cleanup Status screen. View Report: Generates a report with individual well cleanup status results for the type of data and time period selected by the user. The user can go back to re-run the analysis by selecting a different type of data or by selecting a different time period. Visualize: Views the results in a map in which wells are shown spatially with different colors indicating their cleanup status. This provides a way to visualize the individual well cleanup status spatially on the site scale. Next: Proceeds to the Individual Well Power Analysis Complete screen. Help: Provides information on the screen-specific input requirements. Version 2.1 October 2004 76 Air Force Center for Environmental Excellence AFCEE MONITORING AND REMEDIATION OPTIMIZATION SYSTEM SOFTWARE Individual Well Cleanup Status – Optional Power Analysis This screen (accessed from the Individual Well Cleanup Status Results screen by clicking Optional Power Analysis) is used to show power analysis results of whether the mean concentration of a well is significantly lower than the cleanup goal, based on the Student's t-test on mean difference. Sample Size: The number of data (yearly averages or original data) that is used in the evaluation. Significantly < Cleanup Goal?: Indicates whether the mean concentration of a well is significantly lower than the cleanup goal. Results could be YES (significantly lower than the cleanup goal), NO (not significantly lower or higher than the cleanup goal), or N/C (not conducted due to insufficient data). Power of Test: The probability that the correct conclusion can be made when the average concentration from a well is truly lower than the cleanup goal. The power values range from 0 to 1.0. N/C indicates the analysis is not conducted because of insufficient data (sample size < 4). S/E indicates the analysis is not conducted because the mean concentration significantly exceeds the cleanup goal. Expected Sample Size: The amount of data required to achieve the expected power with the variability shown in the data. <=3 indicates that the data have a very small variability, resulting in a high power. >100 indicates the opposite. N/C indicates the analysis is not conducted because of insufficient data (sample size < 4). S/E indicates the analysis is not conducted because the mean concentration significantly exceeds the cleanup goal. To facilitate the power analysis, concentration data are assumed to be either normally or lognormally distributed. Results for both assumptions are calculated and provided for comparison. In most cases, they agree with each other. See Appendix A.6 for detailed explanations. View Normal: Views results calculated under the assumption that data are normally distributed. View Log: Views results calculated under the assumption that data are lognormally distributed. Back: Closes this screen and returns to the Individual Well Cleanup Status Results screen. View Report: Generates a report with optional power analysis results for the type of data and time period selected by the user. The user can go back to re-run the analysis by selecting a different type of data or by selecting a different time period. Help: Provides information on the screen-specific input requirements. Version 2.1 October 2004 77 Air Force Center for Environmental Excellence AFCEE MONITORING AND REMEDIATION OPTIMIZATION SYSTEM SOFTWARE Individual Well Cleanup Status Visualization This screen (accessed from the Individual Well Cleanup Status Results screen by clicking Visualize) allows the user to view the individual well cleanup status spatially on the site scale. Results based on the period specified by the user are shown graphically for each COC. A diamond indicates a well location. The well’s cleanup status is indicated by its color. Well names are not shown for readability. Choose the COC of interest from the dropdown list at the top of the screen. Then choose button Normal or Lognormal (see explanations below) or click button Graph to view. The default graph type is Normal. To facilitate the statistical power analysis, concentration data are assumed to be either normally or lognormally distributed. Results for both assumptions are calculated and provided for comparison. See Appendix A.6 for detailed explanations. Groundwater Flow Direction: Indicates the general groundwater flow direction specified by the user in the Spatial Moment Analysis module. If the flow direction is not previously specified, a default direction is shown. Normal: Views results calculated under the assumption that data are normally distributed. Lognormal: Views results calculated under the assumption that data are lognormally distributed. Graph: Plots or refreshes the graph. Back: Closes this screen and returns to the Individual Well Cleanup Status Results screen. Help: Provides information on the screen-specific input requirements. Note: This graph can also be viewed and printed from the MAROS Output screen. See Appendix A.10 for an example graph. Version 2.1 October 2004 78 Air Force Center for Environmental Excellence AFCEE MONITORING AND REMEDIATION OPTIMIZATION SYSTEM SOFTWARE Individual Well Power Analysis Complete This screen (accessed from the Individual Well Cleanup Status Results screen by clicking Next) is a message screen indicating that individual well power analysis has been completed and the user can proceed to other analyses. Back: Returns to the Individual Well Cleanup Status Results screen. The user can go back to re-run the previous analyses by changing parameters or selecting a different time period. Data Sufficiency Analysis Menu: Returns the user to the Data Sufficiency Analysis Menu screen. Version 2.1 October 2004 79 Air Force Center for Environmental Excellence AFCEE MONITORING AND REMEDIATION OPTIMIZATION SYSTEM SOFTWARE Parameters for Risk-Based Power Analysis This screen (accessed from the Data Sufficiency Analysis Menu screen by clicking Analysis 2) is used for specifying the parameters used in the risk-based power analysis. The user should ensure the correctness of the selected parameters before proceeding to further analysis. 1. Groundwater Flow Angle: The preferential groundwater flow direction measured in degrees counter-clockwise from the X-axis or the Easting in State coordinate systems. If the angle is provided earlier in the Plume Moment Analysis, it will be shown in the gray textbox as a default value. This angle is very important for the risk-based analysis and errors in this value may cause erroneous results. 2. Distance to Receptor: The distance in feet from the most downgradient well to the compliance boundary, delineated according to the nearest downgradient receptor. The value shown in the gray textbox is the distance from plume tail to receptors provided in Site Details and is used as a reference only. The compliance boundary can be at or upgradient of the nearest downgradient receptor. See Appendix A.6 and Figure A.6.4 for details about this parameter. 3. Select Sampling Events for Analysis: Selects the starting and ending sampling events from the From and To dropdown lists, respectively. The user can choose to analyze one or more sampling events. 4. Select Plume Centerline Wells: Selects the representative wells along the plume centerline from source to tail. Data from these wells will be used in the regression of plume centerline concentrations against the distance down the plume centerline. The plume centerline wells should be selected in the same way as in the BIOSCREEN and BIOCHLOR applications. To select, click on the well in the Wells for select listbox and then click the >> button. To deselect, click on the well in the Plume centerline wells listbox and then click the << button. At least three wells are needed for the regression analysis. The selected wells do not have to be ordered. Refer to Appendix A.6 for details. Back: Returns the user to the Data Sufficiency Analysis Menu screen. Analysis: Determines the plume centerline concentration regression coefficients based on the selected plume centerline wells for the sampling events selected by the user. The screen Plume Centerline Regression Results will pop up. Help: Provides additional information on software operation and screen-specific input requirements. Version 2.1 October 2004 80 Air Force Center for Environmental Excellence AFCEE MONITORING AND REMEDIATION OPTIMIZATION SYSTEM SOFTWARE Plume Centerline Regression Results This screen (accessed from the Parameters for Risk-Based Power Analysis screen by clicking Analysis) is used to display the results for the plume centerline concentration regression, grouped by COC. No. of Wells: The number of plume centerline wells that are available for analysis in the sampling event. If this number is less than three, regression will not be performed. Regression Coefficient: The first order coefficient (1/ft) of the exponential model where plume centerline concentrations are expressed as a function of the distance down the plume centerline. This regression coefficient is equivalent to the slope of the regression line of log-transformed centerline concentrations against the distance down the plume centerline. A negative coefficient indicates that the centerline concentrations drop with an increase in distance from the source. If the coefficient is positive, the user should go back to check if the flow angle or selected wells are correct. Confidence in Coefficient: The statistical confidence that the estimated coefficient is different from 0. Refer to “Confidence in Trend" in Linear Regression Analysis for details. Back: Returns the user to the Parameters for Risk-Based Power Analysis screen. View Report: Generates a report with selected parameters and regression results for each COC. The user can go back to re-run the regression by selecting a different set of parameters. Next: Proceeds to the Centerline Regression – Projected Concentrations screen. Help: Provides information on the screen-specific input requirements. Version 2.1 October 2004 81 Air Force Center for Environmental Excellence AFCEE MONITORING AND REMEDIATION OPTIMIZATION SYSTEM SOFTWARE Centerline Regression – Projected Concentrations This screen (accessed from the Plume Centerline Regression Results screen by clicking Next) is used to display the projected concentrations calculated using regression coefficients obtained in the previous screen. Refer to Appendix A.6 for details. Projected Concentrations: Estimated concentrations (mg/L) projected to the compliance boundary, delineated based on the downgradient receptor. The distance to the compliance boundary is introduced into the exponential model to calculate the projected concentration. Data are not available for sampling events with less than three centerline wells. Below DL: Indicates whether the projected concentration is below the user-provided detection limit for the COC. If true, a check mark is shown in the checkbox. Use in Analysis: Indicates whether the projected concentration at this well will be used in the risk-based site cleanup evaluation. The user can make selections in screen Well Selection Form by clicking button Select Wells. Back: Returns the user to the Parameters for Risk-Based Power Analysis screen. Select Wells: Opens the Well Selection Form screen where the user can choose which wells (i.e., projected concentrations) to use in the risk-based power analysis. View Report: Generates a report with projected concentrations for the sampling events selected by the user for each COC. The user can go back to re-run the regression by selecting a different set of parameters. Analysis: Determines the risk-based site cleanup status for the sampling events selected by the user. The Risk-Based Power Analysis Results screen will pop up. Help: Provides information on the screen-specific input requirements. Version 2.1 October 2004 82 Air Force Center for Environmental Excellence AFCEE MONITORING AND REMEDIATION OPTIMIZATION SYSTEM SOFTWARE Well Selection Form This screen (accessed from the Centerline Regression – Projected Concentrations screen by clicking Select Wells) is for selecting the wells (i.e., the projected concentrations) that the user wants to use in the risk-based power analysis. Use in Analysis?: Indicates whether the well will be used in the risk-based site cleanup evaluation. If a well is selected, a check mark is displayed in the checkbox. The user can select/deselect a well by clicking on the checkbox. Back: Returns the user to the Centerline Regression – Projected Concentrations screen. Use All Wells: Selects all wells for analysis. Help: Provides additional information on software operation and screen-specific input requirements. Note: if a well is selected/deselected here, it will be selected/deselected for all COCs. Version 2.1 October 2004 83 Air Force Center for Environmental Excellence AFCEE MONITORING AND REMEDIATION OPTIMIZATION SYSTEM SOFTWARE Risk-Based Power Analysis Results This screen (accessed from the Centerline Regression – Projected Concentrations screen by clicking Analysis) is used to display the results for risk-based site cleanup evaluations, grouped by COC. Sample Size: The number of projected concentrations (i.e., wells) available for analysis in the current sampling event. Cleanup Achieved?: Indicates whether the cleanup goal is achieved for the entire site. Results could be Attained, Not Attained, or N/C (not conducted due to insufficient data). This evaluation is based on the estimated concentrations projected to the compliance boundary and therefore is a risk-based evaluation. Power of Test: The probability that the correct conclusion can be made when the average projected concentrations at the site are truly below the cleanup level. The power values range from 0 to 1.0. N/C indicates the analysis is not conducted because of insufficient data (sample size < 4). S/E indicates the analysis is not conducted because the mean concentration significantly exceeds the cleanup goal. Expected Sample Size: The number of data required to achieve the expected power with the observed variability of the projected concentrations. <=3 indicates a very small data variability, leading to a high power. >100 indicates the opposite. N/C indicates the analysis is not conducted because of insufficient data (sample size < 4). S/E indicates the analysis is not conducted because the mean concentration significantly exceeds the cleanup goal. To facilitate the power analysis, projected concentration data are assumed to be normally or lognormally distributed. Results for both assumptions are calculated and provided for comparison. In most cases, they agree with each other. See Appendix A.6 for detailed explanations. View Normal: Views results calculated under the assumption that data are normally distributed. View Log: Views results calculated under the assumption that data are lognormally distributed. Back: Returns the user to the Centerline Regression – Projected Concentrations screen. View Report: Generates a report with the risk-based power analysis results for the sampling events selected by the user. The user can go back to re-run the analysis by selecting a different time set of parameters. Next: Proceeds to the Risk-Based Power Analysis Complete screen. Help: Provides information on the screen-specific input requirements. Version 2.1 October 2004 84 Air Force Center for Environmental Excellence AFCEE MONITORING AND REMEDIATION OPTIMIZATION SYSTEM SOFTWARE Version 2.1 October 2004 85 Air Force Center for Environmental Excellence AFCEE MONITORING AND REMEDIATION OPTIMIZATION SYSTEM SOFTWARE Risk-Based Power Analysis Complete This screen (accessed from the Risk-Based Power Analysis Results screen by clicking Next) is a message screen indicating that risk-based power analysis has been completed and the user can proceed to other analyses. Back: Returns to the Risk-Based Power Analysis Results screen. The user can go back to re-run the analysis by selecting a different set of parameters. Data Sufficiency Analysis Menu: Returns the user to the Data Sufficiency Analysis Menu screen. Version 2.1 October 2004 86 Air Force Center for Environmental Excellence AFCEE MONITORING AND REMEDIATION OPTIMIZATION SYSTEM SOFTWARE MAROS Output Reports/Graphs MAROS Output Reports/Graphs (accessed from the Main Menu screen) allows the user to view/print reports and graphs from the site trend analyses as well as a preliminary Site Recommendation Report. Sample Reports are located in Appendix A.10. View/Print Report: To view/print reports choose the report of interest and click “View/Print Report”. View/Print Graph: To view/print a graph choose the graph of interest and click “View/Print Graph”. Export MAROS Analysis Results: Results can be exported to a Microsoft Access database. The user can then use the results, displayed in tables, to plot data in a GIS software or export data to other software programs. The database containing results can be compared against other MAROS runs for the same data set to evaluate the impact of changing parameters such as hydraulic characteristics, different methods of data consolidation and data time periods. Main Menu: Returns the user to the Main Menu. Help: Provides information on the screen-specific input requirements. The Export MAROS Analysis Results to Access File (accessed from the MAROS Output Reports screen) allows the user to export MAROS analysis results to a Microsoft Access file. To export results into a database: 1) Enter the full file path and filename of the archived file to export (or click the browse button to find the archive file to overwrite). The Folder and File name you choose will appear in the top two boxes. 2) Click “Create” to proceed with exporting the data to a database file. Back: Takes the user back to the MAROS Output Reports/Graphs screen. Help: Provides information on the screen-specific input requirements. Version 2.1 October 2004 87 Air Force Center for Environmental Excellence AFCEE MONITORING AND REMEDIATION OPTIMIZATION SYSTEM SOFTWARE Trend Summary Results: Graphing (accessed from the MAROS Output Reports screen) allows the user to view/print graphical Trend summary results in Excel. Excel Graph(s): Takes the user to the Excel Graph screens. Back: Returns the user to the MAROS Output Reports screen. Help: Provides information on the screenspecific input requirements. Trend Summary Results: Graph (accessed from the Trend Summary Results: Graphing screen) allows the user to view/print graphical Trend summary results in Excel. This will open Excel on your computer to provide the trend result graphs. Excel Graph(s): Takes the user to the Excel Graph screens. Print Chart: Prints the current summary graph. Back to Access: Returns the user to the Trend Summary Results: Graphing screen. Note: Do not change the name or content of the worksheet xlsLOETrendResults or move it to other folders. Also, the xlsLOETrendResults worksheet will remain open until the user closes it. All the results and graph output are kept if the user chooses to save the file before closing it. The user should save the file under a different name by choosing “Save as…” under the Excel menu option “File.” Version 2.1 October 2004 88 Air Force Center for Environmental Excellence AFCEE MONITORING AND REMEDIATION OPTIMIZATION SYSTEM SOFTWARE Version 2.1 October 2004 89 Air Force Center for Environmental Excellence AFCEE MONITORING AND REMEDIATION OPTIMIZATION SYSTEM SOFTWARE DATABASE COMPACTION To maintain performance, the database must be routinely compacted to remove unused space whenever data is added or changed, using the following procedures. • • Return to the Main Menu screen. On the “Tool” option of the upper toolbar, select “Database Utilities” and then select “Compact Database”. WARNING: It is good practice to keep a backup copy of the database before compacting. Should the compact process fail, the original database software will still be available. Initial Database configuration This software is an automated interface for an Access database containing groundwater data. An experienced Access user can work directly with the database at any time by clicking on the command “F11” or by choosing “Unhide” from the Windows Menu to reveal the Access database (“afcee_MAROS”). The advanced user can use the Access database tools to develop customized queries or reports which provide more detailed analysis and presentation of the dataset. Version 2.1 October 2004 90 Air Force Center for Environmental Excellence AFCEE MONITORING AND REMEDIATION OPTIMIZATION SYSTEM SOFTWARE APPENDICES A.1. Data Import File Formats A.2. Statistical Trend Analysis Methods A.3 Well Redundancy/Sufficiency Analysis: Delaunay Method A.4. Qualitative Evidence: Empirical Data Method A.5. Spatial Moment Analysis Method A.6. Data Sufficiency Analysis A.7. False Positive/Negative Minimization Methodology A.8. MAROS Site Results Method A.9. Sampling Frequency Analysis: Modified CES Method A.10. Sample MAROS Reports A.11. MAROS Tutorial Version 2.1 October 2004 85 Air Force Center for Environmental Excellence AFCEE MONITORING AND REMEDIATION OPTIMIZATION SYSTEM SOFTWARE APPENDIX A.1 DATA IMPORT FILE FORMATS A few words on data management As a general rule, assembling site data for the analysis is the most difficult and time consuming step in the optimization protocol. The simple input file required by MAROS is the culmination of years of painstaking sampling and documentation. Often, the necessary data are not in database format, and may need to be entered into electronic format manually. Assembling the information with fidelity and clarity is the most important step in reaching an optimum well network solution. The following two suggestions may make the process easier: 1) Limit your data at first. Perform a preliminary analysis with a small file of the most recent data in electronic format to check for data format issues. Creating a small test file may highlight common problems with data such as misspellings of well names and COCs, numbers entered as text, and missing data. Finding and correcting these issues early can save considerable time. 2) Precise data input. All constituents must be spelled exactly as in the “MAROS_ConstituentList.xls” under the heading ‘MAROS Constituent Names (see table A.1.6). For example ‘BENZENE’ is recognized by MAROS, but not ‘benzene’ or ‘BZ’. Cutting and pasting names from the constituent list is a good strategy. Results and detection limits should be entered as numbers and not as text. Detailed data input formats are discussed below. Excel and Access Formats The following format for Microsoft Excel and Microsoft Access Table Files (Table A.1.1) should be used for importing files into MAROS from Excel and Access. The Well Name is a text field, and dashes and other symbols can be included in the name. The Well Name should be spelled consistently throughout the file. The X and Y Coordinates should be in feet. The coordinates can be in a geographic coordinate system such as State Plane or in a custom system such as plant coordinates. The Constituent Naming convention follows ERPIMS. As described above, all constituent names must be spelled exactly as in the “MAROS_ConstituentList.xls” file under ‘MAROS Constituent Names’. The sample date should be one date in short date format (i.e. 3/12/2004) with no ranges or partial year designations. For the input file, the Result field should have one number (no text) corresponding to the laboratory result. Non-detect results should be blank. Trace or ‘J’ flag values can be included as a number. The units should be included as indicated in Table A.1.1. MAROS analysis requires detection limits for analytical data. Often, detection limits are uncertain or unknown for historic data. In the case of missing detection limits, a reasonable guess or setting one consistent detection limit for all data points is a good alternative. Data flags are limited to ‘ND’ for non-detect and ‘TR’ for trace detections. ‘ND’ should always be in the flag field for an empty Result cell. ‘TR’ corresponds to ‘J’ values. The Excel template file “MAROS_ExcelImportTemplate.xls” or the Access template file “MAROS_AccessImportTemplate.mdb” should be used to create an import file for the MAROS software. Each row in the import file should contain one COC, for one well and date. Do not Version 2.1 October 2004 A.2-1 Air Force Center for Environmental Excellence AFCEE MONITORING AND REMEDIATION OPTIMIZATION SYSTEM SOFTWARE enter spike matrices or blanks. Use the Constituent list found in the “MAROS_ConstituentList.xls” file for naming conventions (contains about 2,100 constituents). Example names for common constituents can be found in Table A.1.6. Note: if using the Access file for importing, the name of the Access table should be “ImportData”, as in the “MAROS_AccessImportTemplate.mdb” file. TABLE A.1.1 REQUIRED FIELD FORMAT FOR EXCEL AND ACCESS IMPORT FILES: SAMPLING RESULTS Column Number Field Name Description Name of the groundwater well sampled, be sure all wells are "spelled" the same. 1 WellName 2 XCoord 3 YCoord 4 Constituent X coordinate of the well, although not mandatory, it is suggested that you enter this field, for graphing purposes Y coordinate of the well, although not mandatory, it is suggested that you enter this field, for graphing purposes Compound measured - mandatory entry: Follow the ERPIMS format of the naming convention found in the Excel template file (included with software). 5 SampleDate Date Sample was collected: format mm/dd/yyyy 6 Result Analytical result: enter result as a number, if non-detect then leave blank 7 Units Measurement units for result: choices mg/L; ug/L; ng/L; g/L; pg/L 8 DetLim 9 Flags Reporting Limit (detection limit) - same units as "Result" Flag "ND" for non-detect (must enter the detection limit), or "TR" for trace amount (must enter both detection limit and the result), if there is a detect in the Result column, leave the flag blank. ERPIMS Format The following format for ERPIMS files in Microsoft Access (Table A.1.2-5) or ERPIMS text files should be used for importing files into MAROS. The Constituent Naming convention follows ERPIMS. The Access template file “MAROS_AccessTemplate.mdb” should be followed to import an ERPIMS Access import file for the MAROS software. Only the fields with an asterix (*) below are mandatory fields for the ERPIMS Access import file. Version 2.1 October 2004 A.2-2 Air Force Center for Environmental Excellence AFCEE MONITORING AND REMEDIATION OPTIMIZATION SYSTEM SOFTWARE TABLE A.1.2 REQUIRED FIELD FORMAT FOR LDI IMPORT FILES: LOCATION RESULTS Column Number Field Name 1 2 3 4 5 6 7 8 9 10 11 12 13 14 15 16 17 18 19 20 21 22 23 24 25 26 27 28 29 30 31 Version 2.1 October 2004 AFIID LOCID LTCODE LPRCODE NCOORD ECOORD CRDTYPE CRDMETH CRDUHN CRDUNITS ESTDATE ESCCODE DRLCODE EXCCODE CMCCODE ELEV ELEVMETH ELEVUN ELEVUNITS ELFLAG WINTDEPTH BHDIAM BHANGLE BHAZIM DATUM STPZONE STPPROJ UTMZONE GEOLOG MAPID LOCDESC Description * Air Force Installation * Location Identifier Location Classification Code Location Proximity Code * North State Plane Coordinate * East State Plane Coordinate * Coordinate System Type Coordinate System Method Precision of the Coordinates * Coordinates Units of Measure Date Established Establishing Company Code Drilling Company Code Excavating Company Code Construction Method Code Surface Elevation Elevation Determination Method Precision of the Elevation Elevation Units of Measure More Current Elevation Available in Borehole Depth Borehole Diameter Angle of Borehole Drilling Azimuth of Borehole Drilling Geodetic Datum Identifier Coordinate Zone for Geodetic Datum attribute Geographic Projection Unit of Coordinate Zone for Geodetic Datum attribute References Drilling Logs Map Identifier Location Description A.2-3 Air Force Center for Environmental Excellence AFCEE MONITORING AND REMEDIATION OPTIMIZATION SYSTEM SOFTWARE TABLE A.1.3 REQUIRED FIELD FORMAT FOR TES IMPORT FILES: TESTING RESULTS Column Number 1 2 3 4 5 6 7 8 9 10 11 12 13 14 15 16 17 18 19 20 21 Version 2.1 October 2004 Field Name Description SAMPLESEQ * Sample Sequence Number * Test Sequence Number TESTSEQ Laboratory Company Code LABCODE Analytical Method Code ANMCODE Extraction Method Code EXMCODE RUN_NUMBER Run Number LABSAMPID Laboratory Sample Identification LABRECDATE Date/time of Reception by Lab LABRECTEMP Sample Temperature at Reception LABRECUNITS Celsius or Fahrenheit Date/time of Extraction EXTDATE Date/time of Leaching LCHDATE Method of Leaching LCHMETH Designator of a Group of Samples Leachated Together LCHLOT Date/time of Analysis ANADATE Designator of a Group of Samples Analyzed Together ANALOT Laboratory Lot Control Number LABLOTCTL LABLOT_SEQ Sequence Number of Lab Lot Reference Link Between Samples and Corresponding Calibration CALREFID Remediation Technology Type RTTYPE Basis BASIS A.2-4 Air Force Center for Environmental Excellence AFCEE MONITORING AND REMEDIATION OPTIMIZATION SYSTEM SOFTWARE TABLE A.1.4 REQUIRED FIELD FORMAT FOR SAM IMPORT FILES: SAMPLE RESULTS Column Number Field Name 1 2 3 4 5 6 7 8 9 10 11 12 13 14 15 16 17 18 19 20 21 Version 2.1 October 2004 SAMPLESEQ AFIID CONTRACTSEQ LOCID LOGDATE MATRIX SBD SED SACODE SAMPNO LOGCODE SMCODE WETCODE FLDSAMPID COOLER COCID ABLOT EBLOT TBLOT SAPROG REMARKS Description * Sample Sequence Number * Air Force Installation Contract Sequence Number * Location Identifier * Log Date (Note: the time of sampling should NOT be included) * Sampling Matrix Sample Beginning Depth Sample Ending Depth * Sample Type Code * Sample Number Logging Company Code Sampling Method Code Moisture Content * Field Sample Identifier Cooler Identifier Chain of Custody Identifier Ambient Blank Identifier Equipment Blank Identifier Trip Blank Identifier Program Authorization Comments About the Sample A.2-5 Air Force Center for Environmental Excellence AFCEE MONITORING AND REMEDIATION OPTIMIZATION SYSTEM SOFTWARE TABLE A.1.5 REQUIRED FIELD FORMAT FOR RES IMPORT FILES: RESULTS Column Number Field Name 1 2 3 4 5 6 7 8 9 10 11 12 13 14 15 16 17 18 19 20 21 22 23 24 25 26 27 28 29 30 31 32 33 34 35 Version 2.1 October 2004 TESTSEQ RESULTSEQ PARLABEL PRCCODE PARVQ PARVAL PARUN PRESICION EXPECTED EVEXP EVMAN EVPREC MDL RL UNITS VQ_1C VAL_1C FCVALEXP FCVALMAN FCVALPREC VQ_CONFIRM VAL_CONFIRM CNFVALEXP CNFVALMAN CNFVALPREC DILUTION DILEXP DILMAN DILPREC UNCVALEXP UNCVALMAN CRVALEXP CRVALMAN DQTYPE EPA_FLAGS Description * Tests Sequence Number * Results Sequence Number * Parameter Label * Parameter Classification Code * Parameter Value Qualifier * Parameter Value Parameter Value Uncertainty Parameter Value Precision Expected Parameter Value Integer Value of Expected Value Decimal Value of Expected Value Precision of Expected Value * Method Detection Limit * AFCEE Reporting Limit * Units of Measure 1st Column Value Qualifier 1st Column Value 1st Column Value Integer Value 1st Column Value Decimal Value Precision of 1st Column Value 1st Column Value Qualifier Confirm Column Value Confirming Value Integer Value Confirming Value Decimal Value Precision of Confirming Value Dilution Value Dilution Value Integer Value Dilution Value Decimal Value Precision of Dilution Value Uncorrected Value Integer Value Uncorrected Value Decimal Value Corrected Value Integer Value Corrected Value Decimal Value Data Qualifier Type * EPA Data Qualifier Codes A.2-6 Air Force Center for Environmental Excellence AFCEE MONITORING AND REMEDIATION OPTIMIZATION SYSTEM SOFTWARE TABLE A.1.6 EXAMPLE MAROS CONSTITUENT NAME CONVENTION CAS Number Constituent BTEX AND MTBE 71-43-2 Benzene 100-41-4 Ethylbenzene 108-88-3 Toluene 1330-20-7 Xylene (mixed isomers) 108-30-3 Xylene, m95-47-6 Xylene, o1634-04-4 Methyl t-Butyl Ether Abreviation or Synonym ERPIMS Code MAROS Constituent Name Constituent Type B E T X X X MTBE BZ EBZ BZME XYLENES XYLENES1213 XYLENES1213 TBUTMEE BENZENE ETHYLBENZENE TOLUENE XYLENES, TOTAL XYLENES, o & m XYLENES, o & m tert-BUTYL METHYL ETHER ORG ORG ORG ORG ORG ORG ORG BDCME BROMODICHLOROMETHANE ORG CTCL CARBON TETRACHLORIDE ORG CLBZ CHLOROBENZENE ORG CLEA CHLOROETHANE ORG TCLME CHLOROFORM ORG CHLORINATED COMPOUNDS 75-27-4 Bromodichloromethane 56-23-5 Carbon tetrachloride 108-90-7 Chlorobenzene 75-00-3 Chloroethane CT Trichlorometh ane Methyl Chloride 67-66-3 Chloroform 74-87-3 Chloromethane CLME CHLOROMETHANE ORG 95-57-8 Chlorophenol, 2- CLPH2 2-CHLOROPHENOL ORG 124-48-1 DBCME DIBROMOCHLOROMETHANE ORG DCBZ12 1,2-DICHLOROBENZENE ORG DCBZ14 1,4-DICHLOROBENZENE ORG 75-71-8 Dibromochloromethane Dichlorobenzene (1,2) (o) Dichlorobenzene, (1,4) (p) Dichlorodifluoromethan e FC12 DICHLORODIFLUOROMETHANE ORG 75-34-3 Dichloroethane, 1,1- 1,1 DCA DCA11 1,1-DICHLOROETHANE ORG 107-06-2 Dichloroethane, 1,2- 1, 2 DCA, EDC DCA12 1,2-DICHLOROETHANE ORG 156-59-2 Dichloroethene, cis-1,2- 1,2 cis DCE DCE12C cis-1,2-DICHLOROETHYLENE ORG 156-60-5 DCE12T trans-1,2-DICHLOROETHENE ORG 75-09-2 Dichloroethene,1,2-trans- 1,2 trans DCE Dichlorometh Methylene chloride ane MTLNCL METHYLENE CHLORIDE ORG 79-34-5 Tetrachloroethane, 1,1,2,2- PCA 1,1,2,2-TETRACHLOROETHANE ORG 127-18-4 Tetrachloroethene PCE TETRACHLOROETHYLENE(PCE) ORG 120-82-1 Trichlorobenzene, 1,2,4- TCB124 1,2,4-TRICHLOROBENZENE ORG 71-55-6 Trichloroethane, 1,1,1- TCA111 1,1,1-TRICHLOROETHANE ORG 79-00-5 Trichloroethane, 1,1,2- TCA TCA112 1,1,2-TRICHLOROETHANE ORG 79-01-6 Trichloroethene TCE 75-69-4 Trichlorofluoromethane 75-01-4 Vinyl chloride 95-50-1 106-46-7 PAH COMPOUNDS 83-32-9 Acenaphthene PCE, Perc VC TCE TRICHLOROETHYLENE (TCE) ORG FC11 TRICHLOROFLUOROMETHANE ORG VC VINYL CHLORIDE ORG ACNP ACENAPHTHENE ORG 208-96-8 Acenaphthylene ACNPY ACENAPHTHYLENE ORG 120-12-7 Anthracene ANTH ANTHRACENE ORG 205-99-2 Benzo (b)Fluoranthene BZBF BENZO(b)FLUORANTHENE ORG 191-24-2 Benzo (g,h,i)Perylene BZGHIP BENZO(g,h,i)PERYLENE ORG 207-08-9 Benzo (k) Fluoranthene BZKF BENZO(k)FLUORANTHENE ORG Version 2.1 October 2004 A.2-7 Air Force Center for Environmental Excellence AFCEE MONITORING AND REMEDIATION OPTIMIZATION SYSTEM SOFTWARE CAS Number 56-55-3 Constituent Benzo(a)Anthracene 50-32-8 Benzo(a)Pyrene 218-01-9 Chrysene 53-70-3 Dibenzo(a,h) Anthracene 206-44-0 Fluoranthene 86-73-7 Fluorene 193-39-5 Abreviation or Synonym ERPIMS Code BZAA MAROS Constituent Name BENZO(a)ANTHRACENE Constituent Type ORG ORG BZAP BENZO(a)PYRENE CHRYSENE CHRYSENE ORG DBAHA DIBENZ(a,h)ANTHRACENE ORG FLA FLUORANTHENE ORG FL FLUORENE ORG Indeno(1,2,3,c,d)Pyrene INP123 INDENO(1,2,3-c,d)PYRENE ORG 91-20-3 Naphthalene NAPH NAPHTHALENE ORG 85-01-8 Phenanthrene PHAN PHENANTHRENE ORG 129-00-0 Pyrene PYR PYRENE ORG OTHER COMPOUNDS 67-64-1 Acetone ACE ACETONE ORG BZACID BENZOIC ACID ORG BTOH n-BUTANOL ORG CDS CARBON DISULFIDE ORG ETEGLY ETHYLENE GLYCOL ORG Hexane, n- C6N n-HEXANE ORG Methanol MEOH ORG MEK METHANOL METHYL ETHYL KETONE (2BUTANONE) PHENOL PHENOL ORG 65-85-0 Benzoic acid 71-36-3 Butanol, n- 75-15-0 Carbon disulfide 107-21-1 Ethylene glycol 110-54-3 67-56-1 78-93-3 Methyl ethyl ketone 108-95-2 Phenol Version 2.1 October 2004 MEK A.2-8 ORG Air Force Center for Environmental Excellence AFCEE MONITORING AND REMEDIATION OPTIMIZATION SYSTEM SOFTWARE APPENDIX A.2: STATISTICAL TREND ANALYSIS METHODS Authors: Newell, C.J. and Aziz, J.J., Groundwater Services, Inc. This appendix details the data evaluation and remedy selection procedures employed by the Monitoring and Remediation Optimization System (MAROS) Software. The procedures outlined below were developed to assess appropriate response measures for affected groundwater plumes based on scientifically sound quantitative analyses of current and historical site groundwater conditions. Initial Site Investigation Evaluation of groundwater plume conditions and appropriate response measures requires adequate site characterization, including plume delineation. Therefore, for the compliance monitoring evaluation, the minimum required site information includes: • Constituents of Concern (COCs): Individual constituents must be identified along with their relevant source areas and transport mechanisms. • Site Hydrogeology: Site stratigraphy and groundwater flow velocity and direction must be identified. • Affected Groundwater: Plume must be completely delineated for each COC to ensure that the results of the compliance monitoring assessment are reliable and not erroneously influenced by a migrating plume. • Time-Series Groundwater Monitoring Data: Historical record must be compiled for each COC and meet the minimum data requirements described below. • Actual and Potential Groundwater Receptors: Well locations, groundwater-to-surface water discharge locations, underground utilities, or other points of exposure must be identified. • Current or Near-Term Impact?: Any current or near-term receptor impact (defined for this evaluation as occurring in zero to two years) must be assessed. Plumes posing current or near-term impact on applicable receptors are referred for immediate evaluation of appropriate risk management measures. Site Conceptual Model The EPA recommends the use of conceptual site models to integrate data and guide both investigative and remedial actions (e.g., see EPA, 1999). A conceptual site model (CSM) is a three-dimensional representation that conveys what is known or suspected about contamination sources, release mechanisms, and the transport and fate of those contaminants. The conceptual model provides the basis for assessing potential remedial technologies at the site. In the context of the MAROS software, conceptual model development prior to software use would allow the user to better utilize the information gained through the various software modules as well as provide guidance for assessing the data that would best typify historical site conditions. It is recommended that available site characterization data should be used to develop a conceptual model for the site prior to the use of the MAROS software. The conceptual model Version 2.1 October 2004 A.2-1 Air Force Center for Environmental Excellence AFCEE MONITORING AND REMEDIATION OPTIMIZATION SYSTEM SOFTWARE should include a three-dimensional representation of the source area as a NAPL or region of highly contaminated ground water, of the surrounding uncontaminated area, of ground water flow properties, and of the solute transport system based on available geological, biological, geochemical, hydrological, climatological, and analytical data for the site (EPA, 1998). Data on the contaminant levels and aquifer characteristics should be obtained from wells and boreholes which will provide a clear three-dimensional picture of the hydrologic and geochemical characteristics of the site. High concentrations of dissolved contaminants can be the result of leachates, rinse waters and rupture of water conveyance lines, and are not necessarily associated with NAPLs. This type of conceptual model differs from the more generic conceptual site models commonly used by risk assessors that qualitatively consider the location of contaminant sources, release mechanisms, transport pathways, exposure points, and receptors. However, the conceptual model of the ground water system facilitates identification of these risk-assessment elements for the exposure pathways analysis. After development, the conceptual model can be used to help determine optimal placement of additional data collection points, as necessary, to aid in the natural attenuation investigation and to develop the solute fate and transport model. Contracting and management controls must be flexible enough to allow for the potential for revisions to the conceptual model and thus the data collection effort. Successful conceptual model development involves (EPA, 1998): • • • • Definition of the problem to be solved (generally the three dimensional nature, magnitude, and extent of existing and future contamination). Identification of the core or cores of the plume in three dimensions. The core or cores contain the highest concentration of contaminants. Integration and presentation of available data, including: - Local geologic and topographic maps, - Geologic data, - Hydraulic data, - Biological data, - Geochemical data, and - Contaminant concentration and distribution data. Determination of additional data requirements, including: - Vertical profiling locations, boring locations and monitoring well spacing in three dimensions, - A sampling and analysis plan (SAP), and - Other data requirements. Conceptual model development prior to use of the MAROS software will allow more accurate site evaluation through quality data input (i.e. identification of source and tail wells, etc.), as well as viewing the MAROS results in light of site-specific conditions. The conceptual model will also allow the user to gain insight into the type and extent of site data that is needed to fulfill minimum data requirements in order to fully utilize the MAROS software. Minimum Data Requirements Compliance Monitoring data evaluation must be based on data from a consistent set of wells over a series of periodic sampling events. Statistical validity of the constituent trend analysis requires constraints on the minimum data input. To ensure a meaningful comparison of COC Version 2.1 October 2004 A.2-2 Air Force Center for Environmental Excellence AFCEE MONITORING AND REMEDIATION OPTIMIZATION SYSTEM SOFTWARE concentrations over time and space, the following minimum requirements were imposed on the time-series groundwater monitoring data: • Number of Wells: Evaluation should include data from at least four wells (ASTM , 1998) in which COCs have been detected. May include up to two wells which have not exhibited COCs during more recent sampling events being analyzed, but in which COCs were previously detected. As many wells should be included in the evaluation as possible, subject to the other minimum data requirements. • Minimum Data per Well: Data for each well should include at least four measured concentrations over six sampling events during the time period being analyzed. For any well, data may not be missing from more than two consecutive sampling events. Guidelines given by ASTM, 1998 notes that a minimum of more than one year of quarterly monitoring data of 4 or 5 wells is needed to establish a trend. • Number of Sampling Events: Evaluation should include at least six most-recent sampling events which satisfy the minimum groundwater data requirements specified above. For this evaluation, it is suggested that the user consolidate multiple sampling dates within a single quarter to consider them to be a single sampling event, with multiple measurements of the same constituent subject to a user defined consolidation (e.g. average). The sampling events do not need to be the same for each well. Sufficient Data: At least four wells with four or more independent sampling events per well are available Insufficient Data: Fewer than four wells or fewer than 4 independent sampling events per well are available. Although the software will calculate trends for fewer than four wells and a minimum of 4 sampling events, the above criteria will ensure a meaningful evaluation of COC trends over time. The minimum requirements described would apply only to “well behaved” sites, for most sites more data is required to obtain an accurate representation of COC trends. Sites with significant variability in groundwater monitoring data (due to water table fluctuation, variations in groundwater flow direction, etc.) will require more data to obtain meaningful stability trends. Essentially, the plume you are evaluating should be delineated with adequate consecutive sampling data to accurately evaluate the concentration trend with time. Plume Stability Analysis Confirmation of the effective performance of monitored natural attenuation as a stand-alone remedial measure requires the demonstration of primary lines of evidence, i.e., actual measurement of stable or shrinking plume conditions based on evaluation of historical groundwater monitoring data. For a delineated plume, a stable or shrinking condition can be identified by a stable or decreasing concentration trends over time. For this analysis, an overall plume condition was determined for each COC based on a statistical trend analysis of concentrations at each well, as described below. STATISTICAL TREND ANALYSIS: CONCENTRATION VS. TIME Under optimal conditions, the natural attenuation of organic COCs at any site is expected to approximate a first-order exponential decay for compliance monitoring groundwater data. With actual site measurements, apparent concentration trends may often be obscured by data scatter arising from non-ideal hydrogeologic conditions, sampling and analysis conditions. However, Version 2.1 October 2004 A.2-3 Air Force Center for Environmental Excellence AFCEE MONITORING AND REMEDIATION OPTIMIZATION SYSTEM SOFTWARE even though the scatter may be of such magnitude as to yield a poor goodness of fit (typically characterized by a low correlation coefficient, e.g., R2 << 1) for the first-order relationship, parametric and nonparametric methods can be utilized to obtain confidence intervals on the estimated first-order coefficient, i.e., the slope of the log-transformed data. Nonparametric tests such as the Mann-Kendall test for trend are suitable for analyzing data that do not follow a normal distribution. Nonparametric methods focus on the location of the probability distribution of the sampled population, rather than specific parameters of the population. The outcome of the test is not determined by the overall magnitude of the data points, but depends on the ranking of individual data points. Assumptions on the distribution of the data are not necessary for nonparametric tests. The Mann-Kendall test for trend is a nonparametric test which has no distributional assumptions and irregularly spaced measurement periods are permitted. The advantage gained by this approach involves the cases where outliers in the data would produce biased estimates of the least squares estimated slope. Parametric tests such as first-order regression analysis make assumptions on the normality of the data distribution, allowing results to be affected by outliers in the data in some cases. However, the advantage of parametric methods involve more accurate trend assessments result from data where there is a normal distribution of the residuals. Therefore, when the data is normally distributed the nonparametric method, the Mann-Kendall test, is not as efficient. Both tests are utilized in the MAROS software. Primary Line of Evidence 1: Mann-Kendall Analysis GENERAL The Mann-Kendall test is a non-parametric statistical procedure that is well suited for analyzing trends in data over time (Gilbert, 1987). The Mann-Kendall test can be viewed as a nonparametric test for zero slope of the first-order regression of time-ordered concentration data versus time. The AFCEE MAROS Tool includes this test to assist in the analysis of groundwater plume stability. The Mann-Kendall test does not require any assumptions as to the statistical distribution of the data (e.g. normal, lognormal, etc.) and can be used with data sets which include irregular sampling intervals and missing data. The Mann-Kendall test is designed for analyzing a single groundwater constituent, multiple constituents are analyzed separately. For this evaluation, a decision matrix was used to determine the “Concentration Trend” category for each well, as presented on Table 2. MANN-KENDALL STATISTIC (S) The Mann-Kendall statistic (S) measures the trend in the data. Positive values indicate an increase in constituent concentrations over time, whereas negative values indicate a decrease in constituent concentrations over time. The strength of the trend is proportional to the magnitude of the Mann-Kendall Statistic (i.e., large magnitudes indicate a strong trend). Data for performing the Mann-Kendall Analysis should be in time sequential order. The first step is to determine the sign of the difference between consecutive sample results. Sgn(xj - xk) is an indicator function that results in the values 1, 0, or –1 according to the sign of xj - xk where j > k, the function is calculated as follows sgn(xj – xk) = 1 Version 2.1 October 2004 if xj - xk > 0 A.2-4 Air Force Center for Environmental Excellence AFCEE MONITORING AND REMEDIATION OPTIMIZATION SYSTEM SOFTWARE sgn(xj – xk) = 0 sgn(xj – xk) = -1 if xj - xk = 0 if xj - xk < 0 The Mann-Kendall statistic (S) is defined as the sum of the number of positive differences minus the number of negative differences or n −1 S =∑ ∑ sgn (x n k =1 j = k +1 j − xk ) . The confidence on the Mann-Kendall statistic can be measured by assessing the S result along with the number of samples, n, to find the confidence in the trend by utilizing a Kendall probability table found in many statistical textbooks (e.g. Hollander, M. and Wolfe, D.A., 1973). The resulting confidence in the trend is applied in the Mann Kendall trend analysis as outlined in Table A.1.1. The Mann-Kendall test is limited to 40 sample events. AVERAGE The arithmetic mean of a sample of n values of a variable is the average of all the sample values written as n x= ∑x i =1 i n STANDARD DEVIATION The standard deviation is the square root of the average of the square of the deviations from the sample mean written as n s= ∑ (x i =1 − x) 2 i n −1 . The standard deviation is a measure of how the value fluctuates about the arithmetic mean of the data. COEFFICIENT OF VARIATION (COV) The Coefficient of Variation (COV) is a statistical measure of how the individual data points vary about the mean value. The coefficient of variation, defined as the standard deviation divided by the average or C.O.V . = s x Values less than or near 1.00 indicate that the data form a relatively close group about the mean value. Values larger than 1.00 indicate that the data show a greater degree of scatter about the mean. Version 2.1 October 2004 A.2-5 Air Force Center for Environmental Excellence AFCEE MONITORING AND REMEDIATION OPTIMIZATION SYSTEM SOFTWARE RESULTS AND INTERPRETATION OF RESULTS: MANN-KENDALL ANALYSIS The Constituent Trend Analysis results are presented in the Mann-Kendall Analysis Screen (accessed from the Plume Analysis Menu). The software uses the input data to calculate the Coefficient of Variation (COV) and the Mann-Kendall statistic (S) for each well with at least four sampling events (see Figure A.2.1). A “Concentration Trend” and “Confidence in Trend” are reported for each well with at least four sampling events. If there is insufficient data for the well trend analysis, N/A (Not Applicable) will be displayed in the “Concentration Trend” column. FIGURE A.2.1 MANN-KENDALL ANALYSIS RESULTS • The Coefficient of Variation (COV) is a statistical measure of how the individual data points vary about the mean value. Values less than or near 1.00 indicate that the data form a relatively close group about the mean value. Values larger than 1.00 indicate that the data show a greater degree of scatter about the mean. • The Mann-Kendall statistic (MK (S) measures the trend in the data. Positive values indicate an increase in constituent concentrations over time, whereas negative values indicate a decrease in constituent concentrations over time. The strength of the trend is proportional to the magnitude of the Mann-Kendall Statistic (i.e., large magnitudes indicate a strong trend). • The “Confidence in Trend” is the statistical confidence that the constituent concentration is increasing (S>0) or decreasing (S<0). • The “Concentration Trend” for each well is determined according to the following rules, where COV is the coefficient of variation: Version 2.1 October 2004 A.2-6 Air Force Center for Environmental Excellence AFCEE MONITORING AND REMEDIATION OPTIMIZATION SYSTEM SOFTWARE TABLE A.2.1 MAROS MANN-KENDALL ANALYSIS DECISION MATRIX Mann-Kendall Statistic Confidence in Trend Concentration Trend S>0 > 95% Increasing S>0 90 - 95% Probably Increasing S>0 < 90% No Trend S≤0 < 90% and COV ≥ 1 No Trend S≤0 < 90% and COV < 1 Stable S<0 90 - 95% Probably Decreasing S<0 95% Decreasing The MAROS Mann-Kendall Analysis Decision Matrix was developed in-house by Groundwater Services Inc. The user can choose not to apply one of the two statistical plume analysis decision matrices. Choose “Not Used” in the Trend Result weighting screen. If the user would like to use another decision matrix to determine stability of the plume, they would need to do this outside the software. Statistical Plume Analysis 2: Linear Regression Analysis GENERAL Linear Regression is a parametric statistical procedure that is typically used for analyzing trends in data over time. However, with the usual approach of interpreting the log slope of the regression line, concentration trends may often be obscured by data scatter arising from nonideal hydrogeologic conditions, sampling and analysis conditions, etc. Even though the scatter may be of such magnitude as to yield a poor goodness of fit (typically characterized by a low correlation coefficient, e.g., R2 << 1) for the first-order relationship, confidence intervals can nonetheless be constructed on the estimated first-order coefficient, i.e., the slope of the logtransformed data. Using this type of analysis, a higher degree of scatter simply corresponds to a wider confidence interval about the average log-slope. Assuming the sign (i.e., positive or negative) of the estimated log-slope is correct, a level of confidence that the slope is not zero can be easily determined. Thus, despite a poor goodness of fit, the overall trend in the data may still be ascertained, where low levels of confidence correspond to “Stable” or “No Trend” conditions (depending on the degree of scatter) and higher levels of confidence indicate the stronger likelihood of a trend. The coefficient of variation, defined as the standard deviation divided by the average, is used as a secondary measure of scatter to distinguish between “Stable” or “No Trend” conditions for negative slopes. The Linear Regression Analysis is designed for analyzing a single groundwater constituent, multiple constituents are analyzed separately. The MAROS software includes this test to assist in the analysis of groundwater plume stability. For this evaluation, a decision matrix was used to determine the “Concentration Trend” category for each well, as presented on Table A.2.2. LINEAR REGRESSION The objective of linear regression analysis is to find the trend in the data through the estimation of the log slope as well as placing confidence limits on the log slope of the trend. Regression begins with the specification of a model to be fitted. A linear relationship is one expressed by a linear equation. The Linear Regression analysis in MAROS is performed on Ln (COC Concentration) versus Time. The regression model assumes that for a fixed value of x (sample Version 2.1 October 2004 A.2-7 Air Force Center for Environmental Excellence AFCEE MONITORING AND REMEDIATION OPTIMIZATION SYSTEM SOFTWARE date) the expected value of y (log COC concentration) is some function. For a particular value, xi or sample date the predicted value for y (log COC concentration) is given by yˆ i = a + bx i . The fit of the predicted values to the observed values (xi, yi) are summarized by the difference between the observed value yi and the predicted value ŷ i (the residual value.) A reasonable fit to the line is found by making the residual values as small as possible. The method of least squares is used to obtain estimates of the model parameters (a, b) that minimize the sum of the squared residuals, S2 or the measure of the distance between the estimate and the values we want to predict (the y’s). n S 2 = ∑ ( y i − yˆ i ) 2 i =1 The values for the intercept (a) and the slope (b) of the line that minimize the sum of the squared residuals (S2), are given by n b= ∑ (x − x )(y i − y ) i i =1 n ∑ (x and − x) a = y − bx 2 i i =1 where x and y are the mean x and y (log COC concentration) values in the dataset. In order to test the confidence on the regression trend, there is a need to place confidence limits on the slope of the regression line. In this stage of the trend analysis, it is assumed that for each x value, the y-distribution is normal. A t-test may be used to test that the true slope is different from zero. This t-test is preferentially used on data that is not serially correlated or seasonally cyclic or skewed. The variance of yi ( σ ) is estimated by the quantity S y .x where this quantity is defined as 2 n S y2 x = ∑ (y 2 − yˆ i ) 2 i i −1 n−2 where n is the number of samples. The estimation of the standard deviation or standard error of the slope (s.e.b.) is defined as s.e.b. = S y2 x n ∑ (x i − xi ) . 2 i −1 To test significance of the slope calculated, the following t-test result can be used to find the confidence interval for the slope. Version 2.1 October 2004 A.2-8 Air Force Center for Environmental Excellence AFCEE MONITORING AND REMEDIATION OPTIMIZATION SYSTEM SOFTWARE t= b s.e.b. The t result along with the degrees of freedom (n-2) are used to find the confidence in the trend by utilizing a t-distribution table found in most statistical textbooks (e.g. Fisher, L.D. and van Belle, G., 1993). The resulting confidence in the trend is utilized in the linear regression trend analysis as outlined in Table A.2.2. RESULTS AND INTERPRETATION OF RESULTS: LINEAR REGRESSION ANALYSIS The Constituent Trend Analysis Results are presented in the Linear Regression Analysis Screen (accessed from the Mann-Kendall Analysis screen). The software uses the input data to calculate the Coefficient of Variation (COV) and the first-order coefficient (Ln Slope) for each well with at least four sampling events. A “Concentration Trend” and “Confidence in Trend” are reported for each well with at least four sampling events. If there is insufficient data for the well trend analysis, N/A (Not Applicable) will be displayed in the “Concentration Trend” column (Figure A.2.2) FIGURE A.2.2 LINEAR REGRESSION ANALYSIS RESULTS • The Coefficient of Variation (COV) is a statistical measure of how the individual data points vary about the mean value. Values less than or near 1.00 indicate that the data form a relatively close group about the mean value. Values larger than 1.00 indicate that the data show a greater degree of scatter about the mean. • The Log Slope (Ln Slope) measures the trend in the data. Positive values indicate an increase in constituent concentrations over time, whereas negative values indicate a decrease in constituent concentrations over time. • The “Confidence in Trend” is the statistical confidence that the constituent concentration is increasing (ln slope>0) or decreasing (ln slope<0). Version 2.1 October 2004 A.2-9 Air Force Center for Environmental Excellence AFCEE MONITORING AND REMEDIATION OPTIMIZATION SYSTEM SOFTWARE • The “Concentration Trend” for each well is determined according to the following rules, where COV is the coefficient of variation: TABLE A.2.2 MAROS LINEAR REGRESSION ANALYSIS DECISION MATRIX Confidence in Trend Ln Slope Positiv e Negative <90% No Trend 90% – 95% > 95% Probably Increasing Increasing COV < 1 Stable COV > 1 No Trend Probably Decreasing Decreasing COV = Coefficient of Variation The MAROS Linear Regression Analysis Decision Matrix was developed in-house by Groundwater Services Inc. The user can choose not to apply one of the two statistical plume analysis decision matrices. Choose “Not Used” in the Trend Results weighting screen. If the user would like to use another decision matrix to determine stability of the plume, they would need to do this outside the software. Further Considerations The results of a constituent concentration trend analysis form just one component of a plume stability analysis. Additional considerations in determining the over-all plume stability include: • • • Multiple constituent concentration trend analyses Adequate delineation of the plume Proximity of monitoring wells with stable or decreasing constituent trends to the downgradient edge of the plume References Gilbert, R. O., 1987, Statistical Methods for Environmental Pollution Monitoring, Van Nostrand Reinhold, New York, NY, ISBN 0-442-23050-8. Berthouex, P.M., and Brown, L.C., 1994, Statistics for Environmental Engineers, CRC Press, Boca Raton, FL, ISBN 1-56670-031-0. Gibbons, R.D., 1994, Statistical Methods for Groundwater Monitoring, John Wiley & Sons, New York, NY, ISBN 10158-0012. Fisher, L.D. and van Belle, G., 1993, Biostatistics: A Methodology for the Health Sciences, John Wiley & Sons, New York, NY, ISBN 0-471-58465-7. Hollander, M. and Wolfe, D.A., 1973, Nonparametric Statistical Methods, Wiley, New York, NY. ASTM, 1998 Standard Guide for Remediation of Groundwater by Natural Attenuation at Petroleum Release Sites, E 1943-98, 43 p. U.S. Environmental Protection Agency, 1999. Use of Monitored Natural Attenuation at Superfund, RCRA Corrective Action, and Underground Storage Tank Site, Office of Solid Waste and Emergency Response (OSWER), Directive 9200.4-17P, Final Draft, Washington, D.C., April 21, 1999. U.S. Environmental Protection Agency, 1998. Technical Protocol for Evaluating Natural Attenuation of Chlorinated Solvents in Groundwater, EPA/600/R/128, Washington D.C., Sept. 1998. Version 2.1 October 2004 A.2-10 Air Force Center for Environmental Excellence AFCEE MONITORING AND REMEDIATION OPTIMIZATION SYSTEM SOFTWARE APPENDIX A.3 WELL REDUNDANCY/SUFFICIENCY ANALYSIS: DELAUNAY METHOD Authors: Ling, M. and Rifai, H. S., University of Houston. This appendix introduces the approach used in MAROS for well sufficiency analysis, the Delaunay method. The Delaunay method is designed to select the minimum number of sampling locations based on the spatial analysis of the relative importance of each sampling location in the monitoring network. The approach allows elimination of sampling locations that have little impact on the historical characterization of a contaminant plume. A well sufficiency analysis method (i.e., recommend new locations) based on the Delaunay method is also introduced. Method Description The Delaunay method is developed based on Delaunay triangulation, which is the triangulation of a point set with the property that no point in the point set falls in the interior of the circumcircle of any triangle in the triangulation. As seen in Figure A.3.1, all nodes (potential well locations) are joined by the blue lines, which form the edges of Delaunay triangles. The yellow lines form many polygons called Thiessen polygons or Voronoi diagrams, which are the dual parts of Delaunay triangles. Yellow lines Voronoi diagram Blue lines Version 2.1 October 2004 A.4-1 Air Force Center for Environmental Excellence AFCEE MONITORING AND REMEDIATION OPTIMIZATION SYSTEM SOFTWARE Figure A.3.1 Illustration of the Delaunay Triangulation Delaunay triangles and Voronoi diagrams have been widely used for centuries for solving spatial distribution problems (Okabe et al. 1992, Watson 1994). In MAROS, Delaunay triangulation is first used to generate a grid for the studied site with potential sampling locations as its nodes. Then based on the formation of Delaunay triangles and Voronoi diagrams, spatial analyses are made to determine the relative importance of each sampling location. Finally, spatial-redundant locations are eliminated from the monitoring network. To determine the relative importance of potential locations in the monitoring network, we define Slope Factor (SF) for each potential location to measure the information conveyed by each of them. The SF of a location is defined as the standardized difference between the logarithmic scales of its measured concentration and its estimated concentration. Since the spatial distribution of groundwater quality data tends to follow lognormal distribution, using logarithmic scale of the concentrations will make the plume surface more smoothly. Using logarithmic transformations of the concentrations for estimating the average plume concentration were seen in some studies (Rice et al. 1995; Mace et al. 1997). To be consistent, the SF calculation is thus based on the logarithmic scale of the concentrations. The following steps are used to calculate SF. 1) For a given node N0, find its natural neighbors Ni, i.e., the set of nodes that are directly connected to this node by an edge of a Delaunay triangle (Figure A.3.2). N2 N3 Delaunay triangle d02 d03 N0 d01 d04 N1 N4 d05 Voronoi diagram N5 Figure A.3.2 Illustration of Natural Neighbors 2) The estimated logarithmic concentration EC0 of node N0 is computed as the inversedistance-weighted average of logarithmic concentrations of its natural neighbors: n 1 EC0 = ∑ NCi ⋅ d oi i =1 n 1 ∑d i =1 oi where: n = number of natural neighbors NCi = measured concentration in logarithmic scale at node Ni, i = 1, 2, …, n Version 2.1 October 2004 A.4-2 Air Force Center for Environmental Excellence AFCEE MONITORING AND REMEDIATION OPTIMIZATION SYSTEM SOFTWARE d0i = distance between node N0 and its natural neighbor Ni 3) The SF is then calculated as: SF = EC0 − NC0 Max( EC0 , NC0 ) where: EC0 = estimated logarithmic concentration at node N0 NC0 = measured concentration in logarithmic scale at node N0 The magnitude of SF ranges from 0 to 1 (not including 1). Value 0 means that the concentration at a location can be exactly estimated by its surrounding locations, thus, sampling at this location provides no extra information to our knowledge of the plume. A value larger than 0 indicates the existence of estimation error. The larger is the estimation error, the larger the discrepancy would be between the estimated concentration and the measured concentration at a location. Consequently, it becomes more reasonable to keep sampling at this location so that the plume can be better defined. In summary, the larger the SF value of a location is, the more important is this location and vice versa. Our objectives in spatial sampling are to accurately map a contaminant plume and track the change in this plume. It is clear that with more monitoring wells these can be achieved in a higher degree of accuracy. Unfortunately, there is always a trade-off between degree of accuracy and budget. The limitation of resources forces us to find a way to use as few monitoring wells as possible as far as certain degree of accuracy can be kept (no significant information loss). To ensure that the elimination of sampling locations from monitoring network will not cause significant information loss, two indicators are developed to measure the information loss. One is Average Concentration Ratio (CR) and the other is Area Ratio (AR), which are defined as: CR = Cavr ,Current C avr ,Original AR = ACurrent AOriginal where: Cavr,Current = average plume concentration estimated after elimination of locations in the current step of optimization Cavr,Original = average plume concentration estimated from the potential locations (before elimination of any locations) ACurrent = Triangulation area based on locations after elimination of locations in the current step of optimization AOriginal = Triangulation area based on potential locations before any optimization (before elimination of any locations) Version 2.1 October 2004 A.4-3 Air Force Center for Environmental Excellence AFCEE MONITORING AND REMEDIATION OPTIMIZATION SYSTEM SOFTWARE The average plume concentration is taken as the area-weighted average of the average concentrations of all Delaunay triangles: N Cavr = ∑ TCi ⋅ TAi i =1 N ∑ TA i =1 i where: N = number of all Delaunay triangles in the triangulation TAj = area of each Delaunay triangle, i = 1, 2, …, N TCi = average concentration of each Delaunay triangle, i = 1, 2, …, N TCi is computed as (refer to Figure A.2.3): TCi = NC1 ⋅ A1 + NC2 ⋅ A2 + NC3 ⋅ A3 A1 + A2 + A3 where: NC1 = logarithmic concentration at vertex N1 NC2 = logarithmic concentration at vertex N2 NC3 = logarithmic concentration at vertex N3 A1 = Area of sub-part A1 A2 = Area of sub-part A2 A3 = Area of sub-part A3 After elimination of "unimportant" locations (those with smallest SF values), the estimation of average plume concentration and triangulation area might be affected. By judging the values of CR and AR, information loss can be evaluated. CR and AR values close to 1 indicate that the information about the plume after elimination of locations is well kept. CR and AR values closing to 0 represent a large estimation discrepancy and thus indicate greater information loss. By setting the acceptable level of information loss, we can judge when to stop eliminating locations. Those eliminated locations are called "redundant" locations and the rest of potential locations are non-redundant ones and should be kept. An interpretation of the above decision process is given in Figure A.3.4. The optimization process is iterative. It starts by eliminating the location(s) with smallest SF value(s), then followed by a check of information loss. If information loss is not significant (within the acceptable range), repeat the process until significant information loss happens. Two kinds of thresholds are defined to judge whether or not to 1) eliminate a location or 2) to terminate the optimization. The SF threshold is defined for the first purpose. For example, if the SF threshold for all nodes is 0.10, those nodes with SF values less than 0.10 are potential nodes to be eliminated. CR and AR thresholds are defined for the second purpose. For example, if CR Version 2.1 October 2004 A.4-4 Air Force Center for Environmental Excellence AFCEE MONITORING AND REMEDIATION OPTIMIZATION SYSTEM SOFTWARE threshold is 0.95, elimination of locations is valid if the CR value is greater than 0.95. In this case, the acceptable level of information loss is 1 - 0.95 = 0.05, that is, 5%. If CR value is less than 0.95, the optimization should be terminated and the locations eliminated at this step should be reinstated. Details about these thresholds will be discussed shortly. N1 A1 N2 A2 A3 N3 Circumcircle Figure A.3.3 Division of a Delaunay Triangle Figure A.3.4 Decision Process of the Elimination of a Location The Delaunay method performs the redundancy reduction by using an algorithm that considers all or a series of sampling events, of which optimization based on a single sampling event is a special case. Since each sampling event represents only one snapshot of the contaminant plume, we need to examine all sampling events (or parts of them) to reveal the general spatial pattern of the contaminant distribution in a specific site. This general spatial pattern is the underlying assumption for the spatial analysis. In the Delaunay method, we find the general pattern by Version 2.1 October 2004 A.4-5 Air Force Center for Environmental Excellence AFCEE MONITORING AND REMEDIATION OPTIMIZATION SYSTEM SOFTWARE averaging across sampling events. In addition, since the spatial patterns of COCs may be different from each other, the optimization is performed based on each COC. Therefore, results are given separately in terms of each COC. Finally, we provide the all-in-one results simply by considering the most conservative result from all COCs. The major steps of this algorithm are as follows: 1) Select a series of continuous sampling events for analysis. They could be all sampling events in the monitoring history. They could also be any segment of sampling events in the monitoring history, e.g., sampling events in the past five years. 2) Calculate SF values of potential locations for all sampling events selected by the users, and for each COC. 3) Average SF values of potential locations across the selected sampling events for each COC, weighted by the number of locations contained in each sampling event. The results are lumped SF values of potential locations for each COC. 4) Eliminate one location at a step from each COC starting from the location with smallest lumped SF value. Calculate CR and AR ratios for each sampling event and then average them across sampling events to provide sampling-events-averaged CR and AR values. Compare sampling-events-averaged CR or AR values to thresholds and if there is no significant information loss, repeat this step with the next available location. 5) Provide the COC-categorized results after eliminating all redundant locations from each COC. In this step, elimination of a location in a COC means to stop sampling for that COC at that well in the next round of sampling. 6) Provide the all-in-one results by eliminating only those locations that are eliminated from all COCs. Here elimination of a location is equivalent to abandoning it, i.e., to stop service of a well since no COC needs to be sampled at this well any more. The user can also choose to analyze only one sampling event, e.g., the latest sampling event. In this case, the step of averaging across sampling events is skipped. Figure A.3.5 shows the detailed procedures of optimization in this simplified process. In MAROS, two modules are developed based on the Delaunay Method. One is the Access Module starting with screen Well Redundancy Analysis: Delaunay Method, which is introduced in chapter MAROS Detailed Screen Descriptions. The other one is the Excel Module – xlsDelaunay2K, which is a stand alone Microsoft Excel Worksheet, discussed in chapter MAROS Detailed Screen Descriptions. The Access Module is designed to deal with multi-sampling-events analyses recognizing that a general spatial pattern may lie beneath what are revealed by each single sampling event. It can also be used to analyze a single sampling event, a special case of the multi-sampling-events analyses. The Excel Module is designed for one-sampling-event analyses, which provides the user with graphical interface and convenient controls to the optimization process, making the process of the Delaunay method better understood. Version 2.1 October 2004 A.4-6 Air Force Center for Environmental Excellence AFCEE MONITORING AND REMEDIATION OPTIMIZATION SYSTEM SOFTWARE For each well in order (Removable wells with SF values less than the threshold) Remove it from the system Delaunay Triangulation of the remaining wells Calculate CR, AR and Slope Factor values of all remaining wells Is CR less than its threshold? Yes Is AR less than its threshold? Will this lead to significant information loss about the plume? Wells left in the prior step are recommended No No The last well? Yes All wells in the list are recommended Figure A.3.5 Steps in Sampling Location Optiomization for One Sampling Event Optimization Parameters Inside node Slope Factor: The SF threshold for nodes (locations) located inside the triangulation domain. When SF of an inside node is less than this threshold, and if the node is Removable, it will be eliminated from the monitoring network. The current default value for this parameter is 0.1. Removable stands for the elimination property of a location. If the Removable property of a location is False, optimization cannot eliminate it no matter how small its SF value is. This is important if you want to keep a location (e.g., a POC well) in the monitoring network. The default values for all potential locations are True. Version 2.1 October 2004 A.4-7 Air Force Center for Environmental Excellence AFCEE MONITORING AND REMEDIATION OPTIMIZATION SYSTEM SOFTWARE Hull node Slope Factor: The SF threshold for nodes (locations) located on the edge (convex hull) of the triangulation domain. When SF of a hull node is less than this threshold, and if the node is Removable, it will be eliminated from the monitoring network. The current default value for this parameter is 0.01. The threshold for hull node is usually more stringent than that of the inside node, because the elimination of a hull node may cause reduction in the triangulation area, thereby causing greater information loss (reduction in AR). For contrast, the elimination of an inside node will only affect the average concentration ratio (CR). Area Ratio (AR): The ratio of triangulation area (represents the area of a contaminant plume) at current optimization step to the original triangulation area before optimization. If the AR value in an optimization step is less than the threshold, the optimization will be stopped and locations eliminated in this step will be resumed. The default value is 0.95. Concentration Ratio (CR): The ratio of average concentration of a contaminant plume at current optimization step to that of the original value before optimization. If the CR value in an optimization step is less than the threshold, the optimization will be stopped and locations eliminated in this step will be resumed. The default value is 0.95. For the setting of these parameters, the user is referred to the corresponding parts in chapter MAROS Detailed Screen Descriptions. Well Sufficiency Analysis Augmentation of a monitoring network is needed when the existing network cannot achieve certain monitoring goals. Augmentation in this document means more sampling locations and/or more frequent sampling. In this section, a method for determining new sampling locations is introduced, which is intended to enhance the spatial plume characterization. This method utilizes the SF values obtained from the previous analysis to assess the concentration estimation error at potential areas inside which new sampling locations can be placed. Among these potential areas, those with a high estimation error may be designated as regions for new sampling locations. Conceptually, the method is to overlay a grid onto the study area and interpolate the SF values at existing sampling locations to grid cells that do not contain sampling locations. These grid cells serve as potential areas for new sampling locations. Those potential areas with a high estimated SF value (i.e., high estimation error) are therefore candidate regions for new sampling locations. This approach is further simplified in MAROS in order to adapt to the visualization limitations of Microsoft Access and Excel. In the simplified approach, Each Delaunay triangle in the triangulated monitoring network is used as a potential area for new sampling locations (Figure A.2.6). The SF value at a Delaunay triangle is estimated as follows. Consider a Delaunay triangle with vertices N1, N2, and N3 (Figure A.2.7). Assume A1, A2, and A3 are sub-parts of the triangle divided based on the centroid of the triangle. The average SF value for this triangle is estimated as: SFAvg = SF1 ⋅ A1 + SF2 ⋅ A2 + SF3 ⋅ A3 A1 + A2 + A3 where: SF1 = the sampling-events-averaged SF value at vertex N1 Version 2.1 October 2004 A.4-8 Air Force Center for Environmental Excellence AFCEE MONITORING AND REMEDIATION OPTIMIZATION SYSTEM SOFTWARE SF2 = the sampling-events-averaged SF value at vertex N2 SF3 = the sampling-events-averaged SF value at vertex N3 The estimated SF values at these potential areas reflect the concentration estimation error at these regions for the time period specified by the sampling events. For example, a value of 0.9 indicates the ratio of the estimated to measured concentration is 1:10 or 10:1, a large discrepancy. A value of 0.5 indicates the ratio of the estimated to measured concentration is only 1:2 or 2:1, a relatively small estimation error. Existing sampling locations Potential areas for new sampling locations (Delaunay triangles marked by blue lines) Figure A.3.6 Illustration of the potential areas for new sampling locations. N1 Delaunay triangle A1 Centroid Bisectors A2 A3 N2 N3 Figure A.3.7 Division of a Delaunay triangle for estimating its average SF value. Version 2.1 October 2004 A.4-9 Air Force Center for Environmental Excellence AFCEE MONITORING AND REMEDIATION OPTIMIZATION SYSTEM SOFTWARE In MAROS, a Microsoft Excel module, xlsNewLocation, is developed to implement the method. To help visualize the analysis results in xlsNewLocation, potential areas (the triangles) for new sampling locations are marked by blue dash lines. A colored label is placed around the center of each triangle to indicate the estimated SF level at a potential area. The estimated SF values are classified into four levels: S–Small (<0.3), M–Moderate (0.3~0.6), L–Large (0.6~0.9), and E– Extremely large (>0.9). Those potential areas with the estimated SF value at the Extremely large or Large level are candidate regions for new sampling locations. New sampling locations can then be placed inside these regions, e.g., at the centroid of a triangle region. Refer to the MAROS Detailed Screens Description chapter for details on the usage of xlsNewLocation. It is emphasized that recommendations from the well sufficiency analysis are derived solely from the spatial configuration of the monitoring network and the spatial pattern of the contaminant plume. No hydrogeologic conditions are considered in the analysis. Therefore, professional judgement and regulatory considerations must be used to decide whether an area for new sampling locations recommended using the above method is appropriate. Other Considerations One thing to keep in mind is that if the coordinates of a sampling location are not available, this location will be excluded and will not be shown in the analysis. The potential locations for analysis are only those with coordinates from the raw set of locations in the raw database (ERPIMS or others). The minimum number of wells valid for analysis is 6. If there are less than 6 wells, the Delaunay method is not applied and will give no recommendations. Also, before applying the Delaunay method for spatial redundancy analysis, it is important to select the appropriate set of wells for analysis, i.e., only the wells that contribute to the spatial delineation of the plume. For example, if wells are far from the plume and contribute little or nothing to the delineation of the plume (e.g., some sentry wells or background wells far from the plume), they should be excluded from the analysis. One reason not to use these wells is that these wells usually are on the boundary of the triangulation and are hard to be eliminated since the Delaunay method protects boundary wells from being easily removed. The elimination status of these wells, in fact, should be determined from the regulatory standpoint. Another well type that could be excluded from analysis is one of a clustered well set because the Delaunay method is a two-dimensional method. Generally, only one well is picked from the clustered well set to represent the concentration at this point. This well can be the one that has the highest concentration or is screened in the representative aquifer interval with the geologic unit. Data from clustered wells can also be averaged to form a single sample and then used in the Delaunay method. References Mace, R. E. et al., 1997, Extent, Mass, and Duration of Hydrocarbon Plumes from Leaking Petroleum Storage Tank Sites in Texas, University of Texas at Austin and TNRCC. Okabe, A., Boots, B., and Sugihara, K., 1992, Spatial Tessellations: Concepts and Applications of Voronoi Diagrams, Wiley & Sons, New York. Rice, D. W. et al., 1995, California Leaking Underground Fuel Tank (LUFT) Historical Analyses, UCRL-AR-122207, California State Water Resources Control Board. Watson, D., 1994, Nngridr − An Implementation of Natural Neighbor Interpolation, D. F. Watson, Claremont, WA, Australia. Version 2.1 October 2004 A.4-10 Air Force Center for Environmental Excellence AFCEE MONITORING AND REMEDIATION OPTIMIZATION SYSTEM SOFTWARE APPENDIX A.4 QUALITATIVE EVIDENCE: EMPIRICAL DATA Authors: Newell, C.J. and Aziz, J. J., Groundwater Services, Inc. Objective There is a growing body of empirical knowledge about the general behavior of groundwater plumes that in some cases might be a useful secondary line of evidence for evaluating plume behavior. Webster’s New Riverside Dictionary defines “empirical” as “Relying on or gained from observation or experiment rather than theory” The idea behind using empirical data as a line of evidence is summarized by one of the conclusions from an extensive chlorinated solvent plume study performed by the Lawrence Livermore National Laboratory: "Statistical methods, such as general linear models and comparison of probability distributions of plume length indices are useful to quantify expected relationships between plume length and site and CVOC variables within a population of CVOC plumes. In addition, they provide population statistics that may be used to bound the uncertainty inherent in expected plume behaviors." McNab et al, 1999 The empirical data for groundwater plumes has been derived from a series of multiple-site statistical studies sometimes called “plume-a-thon” studies. These include: plume-a-thon studies of: • • • BTEX plumes in California, Texas, Florida, and nationwide (four studies); MTBE plumes in California and Texas (two studies); Chlorinated solvent plumes nationwide (two studies) In the MAROS system, the user has the option, but not the requirement, to use the body of empirical data on plume behavior to help design and optimize a monitoring system. Key Points/Caveats Key points regarding the use empirical data as a secondary line of evidence are summarized below: • Use of empirical data as a line of evidence is optional to the user; • The empirical data, if used, should be considered secondary evidence and not weighted as much as the primary evidence • The application of the empirical data is subjective and controlled by the user; i.e., MAROS does not take data, compare to the empirical data, and make a conclusion. • To use empirical data as a secondary line of evidence, the user Version 2.1 October 2004 A.4-1 Air Force Center for Environmental Excellence AFCEE MONITORING AND REMEDIATION OPTIMIZATION SYSTEM SOFTWARE i) reviews the empirical data in this appendix; ii) based on the user’s judgement assigns a plume stability class for each COC (i.e., designates each COC plume in the source and tail as Increasing, Probably Increasing, No Trend, Stable, Probably Decreasing, or Decreasing; iii) assigns a weighting where the importance of the empirical data (a secondary line of evidence) is compared to the importance of the other three lines of evidence (i.e., MannKendall analysis, a primary line of evidence; Linear Regression, a primary line of evidence; and modeling results, a secondary line of evidence). (see “LTM Analysis” section for a discussion of weighting the different lines of evidence). (Note that the default weighting system in the software is to weight the two Statistical Plume Analyses with a “medium” weight, while the two External Plume Information (including empirical rules) is weighted “low”. Again, if the users does not want to use empirical rules as a secondary line of evidence then the user can select that option in the software, or select “Don’t Use” in the weighting selection.) Using Empirical Data as Secondary Evidence APPROACH Step 1. Determine if you have a plume in one of the following general categories: a) BTEX Plumes, Small Releases: BTEX plume from a small fuel release (such as a gas station release) (SEE PAGE A.4-4) b) BTEX Plumes, Larger Releases: BTEX plume from a larger fuel release (such as from a tank farm) (SEE PAGE A.4-8) c) MTBE plumes from a small fuel release (such as a gas station release) (SEE PAGE A.4-9) d) Chlorinated solvent plumes (SEE PAGE A.4-12) Step 2. Compare the length of you plume to the statistical characteristics of the other plumes from its class by going to the appropriate section (A. B. C. or D. below) Step 3. If your plume is much shorter than most of the other plumes in its class, there may be secondary evidence that your plume has a higher potential to expand. You should select “Increasing” or “Probably Increasing” and enter in software. (Of course if you feel the evidence is not strong enough to be significant, you have the option to not use empirical rules as a line of evidence.) If your plume is much longer than most of the other plumes in its class, there may be secondary evidence that your plume has a lower potential to expand. You should select “Decreasing” or “Probably Decreasing” and enter in software. (Of course if you feel the evidence is not strong enough to be significant, you have the option to not use empirical rules as a line of evidence.) If your plume is about the same length than most of the other plumes in its class, may be weak secondary evidence that your plume may neither increase or decrease in length. You should select “Stable” or “No Trend” and enter in software. (Of course if you feel the evidence is not strong enough to be significant, you have the option to not use empirical rules as a line of evidence.) Version 2.1 October 2004 A.4-2 Air Force Center for Environmental Excellence AFCEE MONITORING AND REMEDIATION OPTIMIZATION SYSTEM SOFTWARE Step 4. If available, review the data about plume stability for your particular plume class of interest. For example, plume-a-thon studies of fuel plumes in California (Rice et al, 1995) and Texas (Mace et al., 1997) indicate that most BTEX plumes from small gasoline station releases are either stable, shrinking, or exhausted. If your plume is a BTEX plume from a small release such as a gas station, there may be additional secondary evidence that your plume is more likely “Stable” or “Probably Decreasing” or “Decreasing” as opposed to “Increasing.” It is important that the user’s experience about the site is used when applying the empirical rules. For example, a very recent release has a much higher potential for expanding than most of the plumes in the plume-a-thon databases. In summary, the empirical data are designed to be supporting, External Plume Information that are used carefully based on the user’ s experience and site knowledge. Version 2.1 October 2004 A.4-3 Air Force Center for Environmental Excellence AFCEE MONITORING AND REMEDIATION OPTIMIZATION SYSTEM SOFTWARE A. Empirical Data, BTEX Plumes – Small Releases Recent studies of over 600 groundwater contamination sites throughout the U.S. provide important information regarding the fate and transport of petroleum hydrocarbons in the subsurface. An API research summary (Newell and Connor, 1998) examined the findings of four independent research studies and addressed several key technical issues regarding the assessment and remediation of BTEX (benzene, toluene, ethylbenzene, xylene) plumes. Each study involved detailed analysis of data from a large number of sites (primarily leaking underground storage tanks) to identify the salient characteristics of groundwater contaminant plumes caused by petroleum hydrocarbon releases. Two studies (California and Texas) evaluated the trends in dissolved petroleum hydrocarbon plumes. PLUME LENGTH DATA (USED FOR STEP 3) Title: 2236_API_pic_A_ZAPF.eps Creator: Canvas Preview: This EPS picture was not saved with a preview included in it. Comment: This EPS picture will print to a PostScript printer, but not to other types of printers. FIGURE A.4.1. LOCATION OF “BTEX PLUMES, SMALL RELEASE” STUDIES Version 2.1 October 2004 A.4-4 Air Force Center for Environmental Excellence AFCEE MONITORING AND REMEDIATION OPTIMIZATION SYSTEM SOFTWARE Title: 2236_API_PIC_B_FX2.eps Creator: Canvas Preview: This EPS picture was not saved with a preview included in it. Comment: This EPS picture will print to a PostScript printer, but not to other types of printers. FIGURE A.4.2. LIMIT OF MIGRATION OF PETROLEUM HYDROCARBON PLUMES, BASED ON COMBINED RESULTS FROM FOUR STUDIES (NEWELL AND CONNOR, 1998). FOUR STUDIES INCLUDED THE LAWRENCE LIVERMORE STUDY (RICE ET AL. 1996), TEXAS BEG STUDY (MACE ET AL., 1997), FLORIDA RBCA STUDY (GSI, 1997), AND UNPUBLISHED DATA FROM THE HGDB DATABASE (NEWELL ET AL., 1990). Title: 2236_API_PIC_C_REV.eps Creator: Canvas Preview: This EPS picture was not saved with a preview included in it. Comment: This EPS picture will print to a PostScript printer, but not to other types of printers. FIGURE A.4.3. SUMMARY STATISTICS FOR INDIVIDUAL PLUME-A-THON STUDIES. MOST STUDIES FOCUSED ON BENZENE OR BTEX RELEASES FROM SMALL FUEL RELEASES SUCH AS UNDERGROUND STORAGE TANKS (USTS) AT SERVICE STATIONS. Version 2.1 October 2004 A.4-5 Air Force Center for Environmental Excellence AFCEE MONITORING AND REMEDIATION OPTIMIZATION SYSTEM SOFTWARE PLUME TREND DATA (USED FOR STEP 4) Two studies (California and Texas) evaluated the trends in dissolved petroleum hydrocarbon plumes. Rice et al, (1995) developed the following classification system to evaluate BTEX plume trends: • Expanding: Residual source present. Mass flux of contaminants exceeds assimilative capacity of aquifer. • Stable: Insignificant changes. Active or passive remediation processes are controlling plume length. • Shrinking: Residual source nearly exhausted, and active or passive remediation processes significantly reducing plume mass. • Exhausted: Average plume concentration very low (e.g., 1 ppb) and unchanging over time. Final stages of source zone dissolution over a relatively small area at a site. As shown in the conceptual plume lifecycle figure below (see Figure A.4.4), of the nearly 500 sites addressed by this analysis, nearly 75% were found to be in either a stable or shrinking condition, based on analyses of both plume length and concentration. Plume concentrations were predominantly shrinking (47 to 59%), whereas lengths were frequently stable (42 to 61%). These results suggest that dissolved hydrocarbon plumes tend to reduce more rapidly in concentration than in length. Version 2.1 October 2004 A.4-6 Air Force Center for Environmental Excellence AFCEE MONITORING AND REMEDIATION OPTIMIZATION SYSTEM SOFTWARE Title: 2236_API_PIC_D_REV.eps Creator: Canvas Preview: This EPS picture was not saved with a preview included in it. Comment: This EPS picture will print to a PostScript printer, but not to other types of printers. FIGURE A.4.4 TEMPORAL TRENDS FOR PLUME LENGTH (TOP) AND AVERAGE PLUME CONCENTRATION (BOTTOM) FOR BTEX PLUMES, SMALL RELEASES. Version 2.1 October 2004 A.4-7 Air Force Center for Environmental Excellence AFCEE MONITORING AND REMEDIATION OPTIMIZATION SYSTEM SOFTWARE B. Empirical Data, BTEX Plumes – Larger Releases PLUME LENGTH DATA (USED FOR STEP 3) Data from other releases besides UST sites suggests that longer BTEX plumes are possible. One data set, derived from a plume data compiled by Wiedemeier et al. (1999) shows 18 Air Force plumes with a median BTEX plume length of 530 ft (see Table A.4.1). TABLE A.4.1. LENGTH OF BTEX PLUMES FROM LARGER FUEL RELEASES (DATA FROM WIEDEMEIER ET AL., 1999) BTEX SITES , LARGER RELEASES Elmendorf AFB Dover AFB State AK DE Plume Length (ft) 3000 3000 Hill AFB Myrtle Beach - POL Facility Battle Creek King Salmon AFB Madison ANGB Pope AFB- FPTA #4 Elmendorf AFB Griffis AFB UT SC MI AK WI NC AK NY 1650 1150 900 850 750 720 700 360 Columbus AFB MacDill AFB Seymour Johnson AFB Eglin AFB- POL Facility MacDill AFB Westover AFB- Fire Training Fairchild AFB Langley AFB MS FL NC FL FL MA WA VA 350 350 315 300 250 200 175 140 Maximum 90% Percentile 75% Percentile MEDIAN 25% Percentile Minimum Number of Sites 3000 2055 888 530 304 140 18 PLUME LENGTH CORRELATION EQUATIONS (USED FOR STEP 3) A second approach to compare your plume against empirical plume data is using correlation equations. One takes site data from your site, applies the correlation equation, and then obtains a predicted plume length. Then one uses the approach outlined in Step 3 to estimate plume behavior. Version 2.1 October 2004 A.4-8 Air Force Center for Environmental Excellence AFCEE MONITORING AND REMEDIATION OPTIMIZATION SYSTEM SOFTWARE For example, if your plume is much shorter than predicted plume length, then there may be secondary evidence that your plume has a higher potential to expand. You should select “Increasing” or “Probably Increasing” and enter in software. On the other hand, if your plume is much longer than the predicted plume length, there may be secondary evidence that your plume has a lower potential to expand. You should select “Decreasing” or “Probably Decreasing” and enter in software. Correlation Equations for BTEX Plumes Some correlation equations for BTEX plumes are provided in Wiedemeier et al. (1999; see page 229-230). A more detailed correlation analysis was performed for the American Petroleum Study by Nevin et al. analyzed plume length data UST and petroleum release sites taken from the four sources (the HGDB Air Force plumes, the Texas BEG study, and Florida RBCA study). The database includes sites ranging from small retail gas stations to large distribution sites covering thousands of square feet. This wide range of site sizes makes the study database different from the databases used in the Lawrence Livermore (LLNL, see Rice, et al., 1995) and Texas BEG (see Mace, et al., 1997) studies, which were almost entirely retail sites. Using this database, correlations were performed on a number of hydrogeologic and source parameters. The correlation results agreed with results from the California and Texas plume-athon studies (Rice et al., 19995; Mace et al, 1997) that showed that plume length is not correlated with groundwater velocity or other hydrogeologic characteristics of the site. The correlation study also confirmed that the source size is a major determining factor for plume length. Because transverse dispersion is a relatively weak process (Pankow and Cherry, 1996), the plume width was used as an approximation for the source width. As shown below, there is high degree of correlation (R2 = 0.67) was found between plume length and plume width. Although this may appear to be self-evident, it is a key conclusion in that it supports the idea that BTEX plume length is largely driven by source factors, and much less by hydrogeologic factors. The resulting plume length prediction equation is: Plume Length (ft) = 2.0 • Plume Width (ft) 2 R = 0.67 This results is supported by qualitative conclusions by the California and Texas plume-a-thon studies. Rice et. al (1995) concluded "These hypothetical plume-length controlling variables may be source mass and passive bioremediation rate." Mace et al. (1997) identified other factors, such as the amount of spilled fuel and natural biodegradation rate, as having a greater influence than hydrogeology or previous remediation activities. C. Empirical Data, MTBE Plumes Two plume-a-thon studies have been conducted on MTBE plumes, one if California and one in Texas. Version 2.1 October 2004 A.4-9 Air Force Center for Environmental Excellence AFCEE MONITORING AND REMEDIATION OPTIMIZATION SYSTEM SOFTWARE MTBE PLUME LENGTH DATA (USED FOR STEP 3) California Study Happel et al., 1998) performed a study of 63 MTBE sites in California. They concluded that: “MTBE plumes were typically equivalent in length, or shorter than benzene plumes. On a siteby-site basis, this was also true in approximately 81% of the cases. Further at an individual LUFT site, the length of a benzene plume was only moderately correlated with the length of the corresponding MTBE plume; thus the length of a benzene plume cannot be used to predict the extent of MTBE impact.” TABLE A.4.2 CUMULATIVE DISTRIBUTIONS OF 1995/96 PLUME LENGTHS (IN FT) FOR BENZENE AND MTBE (SOURCE: FIGURE 4.1, HAPPEL ET AL., 1998). Maximum 1000 ft 90% Percentile 75% Percentile MEDIAN 325 250 120 25% Percentile Minimum 85 0 Number of Sites 50 The median MTBE plume length was approximately 120 ft. Mace and Choi studies 99 MBTE plumes in Texas, and compiled the following distribution for MTBE plume lengths: TABLE A.4.3 CUMULATIVE DISTRIBUTIONS OF 10 PPB MTBE PLUME LENGTHS (IN FT) FOR 99 SITES IN TEXAS (SOURCE: FIGURE 3, MACE AND CHOI, 1998). Maximum 90% Percentile 750 ft 386 75% Percentile MEDIAN 25% Percentile Minimum 255 174 Number of Sites 99 120 0 Mace and Choi found that MTBE plumes were, on average, only slightly longer than their companion benzene plumes. Version 2.1 October 2004 A.4-10 Air Force Center for Environmental Excellence AFCEE MONITORING AND REMEDIATION OPTIMIZATION SYSTEM SOFTWARE MTBE PLUME TREND DATA (USED FOR STEP 4) Caution should be take before using MTBE plume distributions as secondary evidence, as Happel et al. (1998) concluded that most of the MTBE plumes are not stable compared to the contaminant (e.g., BTEX) plumes: “Although our results using 1995/96 data indicate that, at the majority of sites, individual MTBE plumes were nearly equivalent or shorter than their corresponding benzene plumes (defined by action levels of 20 and 1 µg L -1 respectively), our results predict that at a portion of these sites this relationship will change over time as the contaminant plumes gradually dissociate.” (Happel et al., 1998) The Texas study arrived at the opposite conclusion, however: “Analysis of temporal data (83 percent of wells have stable, decreasing, or nondetection of MTBE concentration; co-occurrence with benzene has remained the same for the past several years; and limited plume length data shows sites with stable plumes) suggests that MTBE plumes may be naturally attenuated at many sites in Texas.” (Mace and Choi, 1998). More research is needed before MTBE plume-a-thon data can be used as adequate secondary evidence for determining plume stability. Version 2.1 October 2004 A.4-11 Air Force Center for Environmental Excellence AFCEE MONITORING AND REMEDIATION OPTIMIZATION SYSTEM SOFTWARE D. Empirical Data, Chlorinated Solvent Plumes Two chlorinated solvent plume-a-thons are available for use as secondary evidence, one performed for the Air Force Center for Environmental Excellence Tech Transfer Division by Groundwater Services, Inc., and one performed by the Lawrence Livermore National Laboratory. CHLORINATED SOLVENT PLUME LENGTH DATA (USED FOR STEP 3) AFCEE Study The AFCEE database (Aziz et al., in review), used data from site investigation, treatability, and natural attenuation reports to compile the database. Questionnaires were completed using mean hydrogeologic property values extracted from the site reports for the most contaminated unit. Plume lengths were determined using isopleths for each chlorinated ethene or chlorinated ethane constituent included in the site report. The project developed several correlations to plume length and estimated first order biodegradation rates for both parent compounds and daughter products using the BIOCHLOR model (Aziz et al., 1999) When comparing the chlorinated ethenes (i.e., PCE, TCE, c-DCE, t-DCE, and vinyl chloride), TCE and the DCE isomers have the longest median plume lengths, all in the 1200 ft range, as shown in Table A.5.4. Vinyl chloride has the shortest median plume length of 860 ft, followed by PCE with a plume length of 970 ft. TABLE A.4.4 CUMULATIVE DISTRIBUTIONS OF CHLORINATED SOLVENT PLUME LENGTHS (IN FT) AND ASSOCIATED COMPOUNDS PLUME LENGTHS (IN FT) (SOURCE: TABLE 3, AZIZ ET AL, IN REVIEW). Minimum 25th Percentile PCE TCE cis-DCE tran s-DCE VC Ethene Chloride BTEX TCA 1,1 -DCA 1,1 -DCE 1 00 2 50 200 440 1 80 120 2 70 60 130 1040 1000 000 228 450 540 1190 398 320 863 595 365 1370 1245 Plum e Leng ths (ft) Median 75th Percen tile 1335 2600 3100 1890 1310 1045 2900 1270 2183 1925 1643 970 1215 1205 1200 860 600 1418 750 865 1650 1470 Maximu m Mean n 13700 11900 9400 2750 3300 1500 4520 3600 2700 2500 1820 1933 2137 2046 1494 1084 675 1848 1183 1230 1675 1438 11 21 20 5 15 11 14 15 6 8 6 Key results from this study are (Aziz et al., in review): • At sites contaminated with chlorinated ethenes only, TCE or c-DCE was the most likely constituent to have the longest plumes at the site. TCE and c-DCE had median plume lengths of 1215 ft and 1205 ft, respectively. • VC had the shortest median plume length of 860 ft. Because the daughter product plumes were coincident or almost coincident with the parent plumes, these results indicate that vinyl chloride is unlikely to be the longest plume at a site. This is an encouraging result given the relatively high associated carcinogenicity of vinyl chloride. Version 2.1 October 2004 A.4-12 Air Force Center for Environmental Excellence AFCEE MONITORING AND REMEDIATION OPTIMIZATION SYSTEM SOFTWARE • The plume width in the source area (or source area width) was used to represent the size of the NAPL-affected source area. The product of the source area width and the maximum dissolved phase solvent concentration was strongly correlated with plume length. This finding indicates that source characteristics, including the extent of DNAPL migration, are the most important factors impacting the maximum dissolved chlorinated solvent plume length. • Chlorinated ethene plume lengths were moderately correlated with seepage velocity and groundwater travel distance, indicating that advection is also an important factor impacting chlorinated solvent plumes. Therefore, the seepage velocity should be accurately determined to predict plume lengths. • Environmental factors, such as temperature, pH, dissolved oxygen, and redox potential were not strongly correlated with chlorinated ethene plume length. However, there was a strong trend of increasing PCE plume length with increasing redox potential, once the PCE plume length was normalized to remove the effects of advection. These results suggest that source width and strength and seepage velocity are more important factors impacting overall plume length than environmental conditions that are conducive to reductive dechlorination. Lawrence Livermore Study McNab et al. (1999) collected and analyzed data from 65 sites representing a variety of hydrogeologic settings and release scenarios (e.g., large industrial facilities, dry cleaners, and landfills). Data collection involved a variety of federal and state agencies and included participation from the U.S. Department of Defense, the Department of Energy, and private industry. The distribution of chlorinated solvent plume lengths from their database is shown in Table A.4.5: TABLE A.4.5. SUMMARY OF FREQUENCY DISTRIBUTIONS OF MAXIMUM CVOC PLUME LENGTHS (FT) TO THE 10 PPB-DEFINED PLUME PER SITE, BASED ON THE INDICATED CONCENTRATION CONTOUR DEFINITION. 6030 ft 90% Percentile 3210 75% Percentile 1600 MEDIAN 790 25% Percentile 120 10% Percentile Number of Sites 99 Key results from this study were: • Statistical methods, such as general linear models and comparison of probability distributions of plume length indices are useful to quantify expected relationships between plume length and site and CVOC variables within a population of CVOC plumes. In addition, they provide population statistics that may be used to bound the uncertainty inherent in expected plume behaviors. • An important conclusion of this study is that the presence of a vinyl chloride plume indicates that reductive dehalogenation may be playing a role in reducing the extent of CVOC plumes at approximately one-third of the sites examined. In contrast, the Version 2.1 October 2004 A.4-13 Air Force Center for Environmental Excellence AFCEE MONITORING AND REMEDIATION OPTIMIZATION SYSTEM SOFTWARE presence of a cis-1,2-DCE plume in the absence of a vinyl chloride plume appears to indicate reductive dehalogenation rates that are insufficient to effectively reduce the extent of CVOC plumes at a site. Little evidence was found in the data to suggest that plume lengths and plume growth rates are substantially affected by reductive dehalogenation in these circumstances. • There are no statistically significant differences between CVOC species with regard to their log-transformed 10-ppb plume lengths, including likely transformation daughter products such as cis-1,2-DCE and vinyl chloride. Plume lengths are positively correlated with maximum historical CVOC concentrations and mean groundwater velocity at each site. Large daughter product plumes do not commonly extend a large distance downgradient of the parent product plumes. PLUME LENGTH CORRELATION GRAPHS (USED FOR STEP 3) AFCEE Study Aziz et al, (2000) also evaluated correlations to chlorinated solvent plume lengths. In general, the best correlation to log plume length (in ft) was log (Plume Width x Maximum Concentrations) as shown in Figure A.4.5. Title: logPCElogPWPCE_Orig.eps Creator: Canvas Preview: This EPS picture was not saved with a preview included in it. Comment: This EPS picture will print to a PostScript printer, but not to other types of printers. Title: logDCElogPWDCE.eps Creator: Canvas Preview: This EPS picture was not saved with a preview included in it. Comment: This EPS picture will print to a PostScript printer, but not to other types of printers. Title: logTCElogPWTCE_.eps Creator: Canvas Preview: This EPS picture was not saved with a preview included in it. Comment: This EPS picture will print to a PostScript printer, but not to other types of printers. Title: logVClogPWVC_.eps Creator: Canvas Preview: This EPS picture was not saved with a preview included in it. Comment: This EPS picture will print to a PostScript printer, but not to other types of printers. FIGURE A.4.5. CORRELATION OF LOG PLUME LENGTH WITH LOG (PLUME WIDTH X MAXIMUM CONCENTRATION ) (AZIZ ET AL., 2000) Version 2.1 October 2004 A.4-14 Air Force Center for Environmental Excellence AFCEE MONITORING AND REMEDIATION OPTIMIZATION SYSTEM SOFTWARE Lawrence Livermore Study Numerous correlations were conducted as part of this chlorinated solvent plume study. The authors concluded that: Another important conclusion is that CVOC transformation rates through dehalogenation exert less impact on plume length than source strength and groundwater velocity. Thus, plumes with weaker source strength and slower groundwater velocities may be better candidates for the application of natural attenuation remedies. CHLORINATED SOLVENT TREND DATA (USED FOR STEP 4) Lawrence Livermore Study As part of the Lawrence Livermore National Laboratory chlorinated solvent plume study (McNab et al, 1999), a time series analysis was performed. This analysis divided the chlorinated solvent plumes into two groups: a group with Strong Reductive Dechlorination processes (see Table A.4.6) and No or Weak Reductive Dechlorination processes (see Table A.4.7). TABLE A.4.6. TEMPORAL TRENDS IN PLUME LENGTH FOR CVOC PLUMES FROM THE STRONG REDUCTIVE DECHLORINATION GROUP CHARACTERIZED BY MONITORING DATA FROM THREE OR MORE YEARS. SOURCE: MCNAB ET AL, 1999 p-value 0.01 0.05 0.1 0.2 0.3 0.5 Plumes Decreasing In Length % Sites Number sites 9% 4 11% 5 13% 6 21% 10 21% 10 23% 11 Plumes Increasing In Length % Sites Number sites 4% 2 13% 6 15% 7 19% 9 26% 12 28% 13 Plumes With No Significant Trend % Sites Number sites 87% 41 77% 36 72% 34 60% 28 53% 25 49% 23 TABLE A.4.7. TEMPORAL TRENDS IN PLUME LENGTH FOR CVOC PLUMES FROM THE NO REDUCTIVE DECHLORINATION AND WEAK REDUCTIVE DECHLORINATION GROUPS CHARACTERIZED BY MONITORING DATA FROM THREE OR MORE YEARS. SOURCE: MCNAB ET AL, 1999 p-value 0.01 0.05 0.1 0.2 0.3 0.5 Plumes Decreasing In Length % Sites Number sites 9% 8 10% 9 12% 11 14% 13 17% 16 19% 18 Plumes Increasing In Length % Sites Number sites 14% 13 21% 20 27% 25 34% 32 38% 36 44% 41 Plumes With No Significant Trend % Sites Number sites 78% 73 69% 65 62% 58 52% 49 45% 42 37% 35 The authors concluded that: Version 2.1 October 2004 A.4-15 Air Force Center for Environmental Excellence AFCEE MONITORING AND REMEDIATION OPTIMIZATION SYSTEM SOFTWARE “Regardless of the confidence level, the two populations of plumes do appear to differ from one another according to this analysis in that the plumes from the Strong RD group exhibit a diminished tendency toward increases in plume length than those plumes from the No RD and Weak RD groups. Previous historical case analyses of fuel hydrocarbon plumes (Rice et al., 1995, Mace et al., 1997) indicated that only a small minority of hydrocarbon plumes (on the order of 10%) were experiencing discernable plume growth, presumably as a result of the limiting effects of biotransformation processes. Thus, the differences in apparent CVOC plume growth rates provides an independent line of evidence to support the conclusion that reductive dehalogenation influences plume length behavior at sites where vinyl chloride plumes are present.” References Aziz, C.E., C.J. Newell, A.P. Smith, C.J. Newell, P.A Haas, and J. Gonzales, 2000. BIOCHLOR Database Natural Attenuaton Decision Support System, Air Force Center for Environmental Excellence, Brooks AFB, Texas, June 2000. www.gsi-net.com Aziz, C.E., C.J. Newell, J.R. Gonzales, P. Haas, T.P. Clement, and Y. Sun, 1999. BIOCHLOR Natural Attenuaton Decision Support System vers. 1.0 User’s Manual. Air Force Center for Environmental Excellence, Brooks AFB, Texas. www.gsi-net.com Happel, A.M., E.H. Beckenbach, and R.U. Halden, 1998. An Evaluation of MTBE Impacts to California Water Resources, Lawrence Livermore National Laboratory, University of California, UCRL-AR-130897, Livermore California, June 11, 1998. http://www.api.org/ehs/mtbelink.htm Newell, C.J., and J.A. Connor, 1998. Characteristics of Dissolved Hydrocarbon Plumes: Results of Four Studies, American Petroleum Institute, Washington D.C., December, 1998. ww.gsinet.com Newell, C. J., L. P. Hopkins, and P. B. Bedient, A Hydrogeologic Database for Groundwater Modeling, Ground Water, September 1990. Mace, R.E., R.S. Fisher, D.M. Welch, and S.P. Parra, Extent, Mass, and Duration of Hydrocarbon Plumes from Leaking Petroleum Storage Tank Sites in Texas, Bureau of Economic Geology, University of Texas at Austin, Austin, Texas. Geologic Circular 97-1, 1997. Mace, R.E. and W. Choi, 1998. Size and Behavior of MTBE Plumes in Texas, Conference on Petroleum Hydrocarbons and Organic Chemical in Groundwater, NGWA, 1998. http://www.api.org/ehs/mtbelink.htm McNab, W.W., D.W.R.J. Bear, R. Ragaini, C. Tuckfield, and C. Oldenburg, 1999. Historical Case Analysis of Chlorinated Volatile Organic Compound Plumes, Lawrence Livermore Laboratory, University of California, Livermore, Ca, 1999. http://searchpdf.adobe.com/proxies/0/5/69/6.html Rice, D.W.; R.D. Grose; J.C. Michaelsen; B.P. Dooher; D.H. MacQueen; S.J. Cullen; W.E. Kastenberg; L.G. Everett; M.A. Marino., California Leaking Underground Fuel Tank (LUFT) Historical Case Analysis, Environmental Protection Dept., Nov. 16, 1995. Groundwater Services, Inc., Florida RBCA Planning Study, Prepared for Florida Partners in RBCA Implementation, Groundwater Services, Inc., Houston, Texas. 1997. (713) 522-6300 or www.GSI-net.com Wiedemeier, T.H., Rifai, H.S., Newell, C.J., and Wilson, J.W. 1999. Natural Attenuation of Fuels and Chlorinated Solvents, John Wiley & Sons, New York. Version 2.1 October 2004 A.4-16 Air Force Center for Environmental Excellence AFCEE MONITORING AND REMEDIATION OPTIMIZATION SYSTEM SOFTWARE APPENDIX A.5 SPATIAL MOMENT ANALYSIS Authors: Aziz, J. J. and Newell, C. J., Groundwater Services, Inc. This appendix details the moment analysis procedures employed by the Monitoring and Remediation Optimization System (MAROS) Software. The procedures outlined below were developed to assess plume stability for groundwater plumes based on scientifically sound quantitative analyses of current and historical site groundwater conditions. The moment analysis results can also be used to further assess possible information loss due to eliminating sample locations in the long-term monitoring network. Plume Stability Analysis Confirmation of the effective performance of monitored natural attenuation as a stand-alone remedial measure requires the demonstration of actual measurement of stable or shrinking plume conditions based on evaluation of historical groundwater monitoring data. For this analysis, an overall plume condition was determined for each COC based on a statistical trend analysis of moments for each sample event, as described below. The function that describes residence time of mass in a field is difficult to characterize exactly. An infinite set of parameters are needed to fully characterize the distribution and the mean residence time and variance are often inadequate, as well. It is more convenient to characterize the approximate distribution rather than the exact distribution, in terms of the moments. (Rasmuson 1985). The moment calculations can predict how the plume will change in the future if further statistical analysis is applied to the moments to identify a trend (in this case, Mann Kendall Trend Analysis is applied). The role of moment analysis in MAROS is to provide a relative measure of plume stability and condition, but can also assist the user in evaluating the impact on plume delineation in future sampling events by removing identified “redundant” wells from a longterm monitoring program. Plume stability may vary by constituent, therefore the MAROS Moment analysis can be used to evaluate multiple COCs simultaneously which can be used to provide a quick way of comparing individual plume parameters to determine the size and movement of constituents relative to one another. To estimate the mass, center of mass, and the spread of the plume at each sample event, spatial moment analysis of the discrete groundwater monitoring data was performed. The ijkth moment of the 2-D concentration distribution in space Mijk (t) is defined as (Freyburg, 1986): M ijk (t ) = +∞ +∞ +∞ ∫ ∫ ∫ ηC (x, y, z, t )x y i j z k dxdydz −∞ −∞ −∞ where C(x,y,z) is the concentration at a monitoring point; ηis the porosity; and x, y, z are the spatial coordinates. The zeroth, first, and second moments (i+j+k = 0, 1, or 2, respectively) provide measures of the mass, location of the center of mass, and spread of the plume. The moment trends over time can be assessed by the Mann-Kendall test, which is a nonparametric statistical procedure that is well suited for analyzing trends in data over time (Gilbert, 1987). The Mann-Kendall test can be viewed as a nonparametric test for zero slope of the first-order regression of time-ordered concentration data versus time. The AFCEE MAROS Tool includes this test to assist in the analysis of groundwater plume stability and plume Version 2.1 November 2004 A.5-1 Air Force Center for Environmental Excellence AFCEE MONITORING AND REMEDIATION OPTIMIZATION SYSTEM SOFTWARE changes over time. The Mann-Kendall test does not require any assumptions as to the statistical distribution of the data (e.g. normal, lognormal, etc.) and can be used with data sets which include irregular sampling intervals and missing data. The Mann-Kendall test is designed for analyzing a single groundwater constituent, multiple constituents are analyzed separately. For more details on the Mann-Kendall Trend Analysis refer to Appendix A.1. ZEROTH MOMENT: SHOWS CHANGE IN MASS OVER TIME The zeroth moment is the sum of concentrations for all monitoring wells and is a mass estimate. The zeroth moment calculation can show high variability over time, largely due to the fluctuating concentrations at the most contaminated wells as well as varying monitoring well network. Plume analysis and delineation based exclusively on concentration can exhibit a fluctuating degree of temporal and spatial variability. The mass estimate is also sensitive to the extent of the site monitoring well network over time. Therefore, the plume should be adequately delineated for the mass estimates to be considered. The 3-D Zeroth Moment or Mass estimate was calculated using the following formula: M 0 , 0, 0 = +∞ +∞ +∞ ∫ ∫ ∫ ηC dxdydz i −∞ −∞ −∞ where Ci is the concentration of the COC, η is the porosity; and x, y, z are the spatial coordinates. Because the data are spatially discontinuous, a numerical approximation to this equation is required. To conduct the numerical integration the horizontal plane (x,y) was divided into contiguous triangular regions with the apex of each triangle defined by a well sampling location with an associated COC concentration and saturated thickness at each sample location. A spatial interpolation method over these triangles allows the zeroth moment calculations using Delaunay Triangulation (see Appendix A.2 for methodology). An approximation of the mass is obtained from calculating: Mass Estimated ≅ ∑ ηVi Ci avg where Ciavg is the geometric mean concentration of each triangle for a particular COC(i) , Vi is the volume of the triangle (calculated by d*Ai, where d is the averaged saturated thickness and Ai is the are of the triangle). Zeroth Moment Trend: The Zeroth Moment trend over time is determined by using the MannKendall Trend Methodology. The “Zeroth Moment” Trend for each COC is determined according to the rules outlined in Appendix A.1. The Zeroth Moment trend test will allow the user to understand how the plume mass has changed over time. Results for the trend include: Increasing, Probably Increasing, No Trend, Stable, Probably Decreasing, Decreasing or Not Applicable (Insufficient Data). Mann-Kendall Statistic (S): The Mann-Kendall Statistic (S) measures the trend in the data. Positive values indicate an increase in estimated mass over time, whereas negative values indicate a decrease in estimated mass over time. The strength of the trend is proportional to the magnitude of the Mann-Kendall Statistic (i.e., large magnitudes indicate a strong trend). However, the zeroth moment calculation can show high variability over time, largely due to the Version 2.1 November 2004 A.5-2 Air Force Center for Environmental Excellence AFCEE MONITORING AND REMEDIATION OPTIMIZATION SYSTEM SOFTWARE fluctuating concentrations at the most contaminated wells as well as varying monitoring well network sampling. Confidence in Trend: The “Confidence in Trend” is the statistical confidence that the distance to the from the source to the center of mass is increasing (S>0) or decreasing (S<0). COV: The Coefficient of Variation (COV) is a statistical measure of how the individual data points vary about the mean value. The coefficient of variation, defined as the standard deviation divided by the average. Values near 1.00 indicate that the data form a relatively close group about the mean value. Values either larger or smaller than 1.00 indicate that the data show a greater degree of scatter about the mean. FIRST MOMENT: SHOWS CHANGE IN CENTER OF MASS OVER TIME The first moment estimates the center of mass, coordinates (Xc and Yc) for each sample event and COC. The changing center of mass locations indicate the movement of the center of mass over time. Whereas, the distance from the original source location to the center of mass locations indicate the movement of the center of mass over time relative to the original source. The 2-D coordinates for the center of mass of the plume for a given sample event can be calculated from: +∞+∞+∞ Xc = M 1, 0,0 M 0, 0,0 ∫ ∫ ∫ηC xdxdydz +∞+∞+∞ i = −∞−∞−∞ + ∞ +∞ +∞ ∫ ∫ ∫ηC dxdydz Yc = M 0,1 M 0,0 i ∫ ∫ ∫ηC ydxdydz i = −∞−∞−∞ +∞ +∞ +∞ ∫ ∫ ∫ηC dxdydz i −∞ −∞ −∞ −∞ −∞ −∞ where Ci is the concentration of the COC, η is the porosity; and x, y are the spatial coordinates. Similar to the Zeroth Moment calculation, the data are spatially discontinuous therefore a numerical approximation to this equation is required. To conduct the numerical integration the horizontal plane (x,y) was divided into contiguous triangular regions with the apex of each triangle defined by a well sampling location with an associated COC concentration at each sample location. A spatial interpolation method over these triangles allows the first moment calculations using Delaunay Triangulation (see Appendix A.2 for methodology). The Delaunay triangulation is a rough way to discretize the domain. The following formulas represent the 2-D approximation of the center of mass: Xc ≅ ∑ X VC ∑V C i i i i avg Yc ≅ iavg ∑YV C ∑V C i i i i avg iavg where Ciavg is the geometric mean concentration of the each triangle for a particular COC(i) , Xi, Yi are the spatial coordinates of the center of each triangle, Vi is the volume of the triangle (calculated by d*Ai, where d is the averaged saturated thickness and Ai is the area of the triangle) and Xc, Yc are the coordinates of the center of mass. Version 2.1 November 2004 A.5-3 Air Force Center for Environmental Excellence AFCEE MONITORING AND REMEDIATION OPTIMIZATION SYSTEM SOFTWARE Calculation of the first moment normalizes the spread by the concentration indicating the center of mass. Analysis of the movement of mass should be viewed as it relates to 1) the original source location of contamination and 2) the direction of groundwater flow. Spatial and temporal trends in the center of mass can indicate spreading or shrinking or transient movement based on season variation in rainfall or other hydraulic considerations. No appreciable movement or a neutral trend in center of mass would indicate plume stability. Distance from Source to Center of Mass: To calculate the distance from the center of mass of the plume for a particular COC and sample event to the source location, the following formula is used: D fromcenter = ( X source − X c )2 + (Ysource − Yc )2 where Dfromcenter is the distance from the source location to the center of mass for a particular COC(i) and sample event , Xc, Yc are the coordinates of the center of mass, Xsource, Ysource are the coordinates of the source location for a particular COC. First Moment Trend: The First Moment trend of the distance to the center of mass over time is determined by using the Mann-Kendall Trend Methodology. The “First Moment” trend for each COC is determined according to the rules outlined in Appendix A.1. Results for the trend include: Increasing, Probably Increasing, No Trend, Stable, Probably Decreasing, Decreasing or Not Applicable (Insufficient Data). MK (S): The Mann-Kendall Statistic (S) measures the trend in the data. Positive values indicate an increase in the distance from the source to the center of mass over time, whereas negative values indicate a decrease in the distance from the source to the center of mass over time. The strength of the trend is proportional to the magnitude of the Mann-Kendall Statistic (i.e., large magnitudes indicate a strong trend). Confidence in Trend: The “Confidence in Trend” is the statistical confidence that the distance to the from the source to the center of mass is increasing (S>0) or decreasing (S<0). COV: The Coefficient of Variation (COV) is a statistical measure of how the individual data points vary about the mean value. The coefficient of variation, defined as the standard deviation divided by the average. Values near 1.00 indicate that the data form a relatively close group about the mean value. Values either larger or smaller than 1.00 indicate that the data show a greater degree of scatter about the mean. SECOND MOMENT: SHOWS SPREAD OF THE PLUME OVER TIME The second moment indicates the spread of the contaminant about the center of mass (σxx and σyy or equivalently Sxx and Syy), or the distance of contamination from the center of mass for a particular COC and sample event. The Second Moment represents the spread of the plume over time in the x and y directions with x-axis representing its major migration direction. Freyberg (1986) describes the second moment about the center of mass as the spatial covariance tensor. The components of the covariance tensor are indicative of the spreading of the contaminant Version 2.1 November 2004 A.5-4 Air Force Center for Environmental Excellence AFCEE MONITORING AND REMEDIATION OPTIMIZATION SYSTEM SOFTWARE plume about the center of mass. The components of the covariance tensor can be described in terms of an ellipse (x the major axis and y the minor axis). The values of σxx and σyy represent the axes of the covariance ellipse. The 2-D covariance or second moment equations (axial terms) are as follows: σ xx = M 2, 0 , 0 M 0, 0,0 − Xc M 2 , 0, 0 σ yy = 2 M 0,0, 0 − Yc 2 where σxx and σyy are the second moments for a particular COC (i) and sample event , Xc, Yc are the coordinates of the center of mass. Similar to the other Moment calculations, the data are spatially discontinuous therefore a numerical approximation to this equation is required. To conduct the numerical integration the horizontal plane (x, y) was divided into contiguous triangular regions with the apex of each triangle defined by a well sampling location with an associated COC concentration at each sample location. A spatial interpolation method over these triangles allows the first moment calculations using Delaunay Triangulation (see Appendix A.2 for methodology). The Delaunay triangulation is a rough way to discretize the domain. The following formulas represent the 2-D approximation of the spatial covariance tensors: S xx ∑(X ≅ − X c ) Vi Ci avg 2 i ∑V C i S xy ≅ ∑ (X i S yy ≅ ∑ (Y − Y )V C ∑V C i c i iavg i i avg iavg − X c )(Yi − Yc )ViCi avg ∑V C i iavg Where Sxx, Syy, and Sxy (the diagonal term) are the spatial covariance tensors for a particular COC(i) and sample event, where Ciavg is the geometric mean concentration of each triangle for a particular COC(i) , Xi and Yi are the spatial coordinates (the easting-northing coordinates) of the center of each triangle, Vi is the volume of the triangle (calculated by d*Ai, where d is the averaged saturated thickness and Ai is the are of the triangle). In order to analyze the behavior of the plume, the values of the spatial covariance tensors need to be adjusted relative to the orientation of the plume elliptical axes. It is assumed that the major elliptical axis (x’) is parallel to the estimated mean groundwater velocity vector and the minor elliptical axis (y’) is perpendicular to the groundwater direction. The components are estimated using the field coordinate system and then rotated counterclockwise using the standard Cartesian tensor rotational transformation with the following formulas: S xx ' = S xx (cos θ ) 2 + 2S xy sin θ cos θ + S yy (sin θ ) 2 S yy ' = S xx (sin θ ) 2 − 2 S xy sin θ cos θ + S yy (cos θ ) 2 Version 2.1 November 2004 A.5-5 Air Force Center for Environmental Excellence AFCEE MONITORING AND REMEDIATION OPTIMIZATION SYSTEM SOFTWARE where θ is the representative groundwater direction measured anti-clockwise from the X-axis field coordinate system. These are the actual values reported as second moments in MAROS. Second Moment Trend: The Second Moment trend of the Spread of the Plume in the X or Y direction over time is determined by using the Mann-Kendall Trend Methodology. The “Second Moment” trend for each COC is determined according to the rules outlined in Appendix A.1. Results for the trend include: Increasing, Probably Increasing, No Trend, Stable, Probably Decreasing, Decreasing or Not Applicable (Insufficient Data). MK (S): The Mann-Kendall Statistic (S) measures the trend in the data. Positive values indicate an increase in the spread of the plume over time (expanding plume), whereas negative values indicate a decrease in the spread of the plume over time (shrinking plume). The strength of the trend is proportional to the magnitude of the Mann-Kendall Statistic (i.e., large magnitudes indicate a strong trend). Confidence in Trend: The “Confidence in Trend” is the statistical confidence that the spread of the plume in the x or y direction is increasing (S>0) or decreasing (S<0). COV: The Coefficient of Variation (COV) is a statistical measure of how the individual data points vary about the mean value. The coefficient of variation, defined as the standard deviation divided by the average. Values near 1.00 indicate that the data form a relatively close group about the mean value. Values either larger or smaller than 1.00 indicate that the data show a greater degree of scatter about the mean. RESULTS AND INTERPRETATION OF RESULTS: MOMENT TREND ANALYSIS The Moment Trend Analysis results are presented in the Spatial Moment Analysis Results screen (accessed from the Moment Analysis Site Details screen). The software uses the input data to calculate the Zeroth, First, and Second Moments for each sampling event (see Figure A-5.1). Figure A.5.1 Moment Analysis Results RESULTS AND INTERPRETATION: The role of moment analysis in MAROS is to provide a relative measure of plume stability and condition over time, but can also assist the user in evaluating the impact on plume delineation in Version 2.1 November 2004 A.5-6 Air Force Center for Environmental Excellence AFCEE MONITORING AND REMEDIATION OPTIMIZATION SYSTEM SOFTWARE future sampling events by removing identified “redundant” wells from a long-term monitoring program. Plume stability may vary by constituent, therefore the MAROS Moment analysis can be used to evaluate multiple COCs simultaneously which can be used to provide a quick way of comparing individual plume parameters to determine the size and movement of constituents relative to one another. Zeroth Moment Trend: The Zeroth Moment trend over time will allow the user to understand how the plume mass has changed historically. A “Concentration Trend” and “Confidence in Trend” are reported for each sample event (see Figure A.5.2). Zeroth moment calculations can show high variability over time, largely due to the fluctuating concentrations at the most contaminated wells. Field data can be highly variable due to changes in physical factors such as aquifer recharge and temperature. Plume analysis and delineation based exclusively on concentration can exhibit a large degree of temporal and spatial variability. When considering the results of the Zeroth moment trend, take into consideration the following factors which could effect the calculation and interpretation of the plume mass over time: 1) Change in the spatial distribution of the wells sampled historically 2) Different wells sampled within the well network over time (addition and subtraction of well within the network). 3) Adequate versus inadequate delineation of the plume over time Figure A.5.2 Moment Analysis Mann-Kendall Trend Results First Moment Trend: The First Moment trend of the distance to the center of mass over time is shows movement of the plume in relation to the original source location over time. Analysis of the movement of mass should be viewed as it relates to 1) the original source location of contamination 2) the direction of groundwater flow and/or 3) source removal or remediation. Spatial and temporal trends in the center of mass can indicate spreading or shrinking or transient movement based on season variation in rainfall or other hydraulic considerations. No appreciable movement or a neutral trend in the center of mass would indicate plume stability. However, changes in the first moment over time do not necessarily completely characterize the changes in the concentration distribution (and the mass) over time. Therefore, in order to fully Version 2.1 November 2004 A.5-7 Air Force Center for Environmental Excellence AFCEE MONITORING AND REMEDIATION OPTIMIZATION SYSTEM SOFTWARE characterize the plume the First Moment trend should be compared to the Zeroth moment trend (mass change over time), refer to Figures A.5.3 – A.5.5. Figure A.5.3 Moment Analysis Mann-Kendall First Moment Trend Results: Zeroth Moment (Dissolved Mass) Increases over time and the First Moment Increases over time. Figure A.5.4 Moment Analysis Mann-Kendall First Moment Trend Results: Zeroth Moment (Dissolved Mass) Decreases over time and the First Moment Increases over time. Figure A.5.5 Moment Analysis Mann-Kendall First Moment Trend Results: Zeroth Moment (Dissolved Mass) Decreases over time and the First Moment Decreases over time. Version 2.1 November 2004 A.5-8 Air Force Center for Environmental Excellence AFCEE MONITORING AND REMEDIATION OPTIMIZATION SYSTEM SOFTWARE Second Moment Trend: The Second Moment trend indicates the spread of the plume about the center of mass. Analysis of the spread of the plume should be viewed as it relates to the direction of groundwater flow. An increasing trend in the second moment indicates an expanding plume, whereas a declining trend in the plume indicates a shrinking plume. No appreciable movement or a neutral trend in the center of mass would indicate plume stability. The second moment provides a measure of the spread of the concentration distribution about the plume’s center of mass. However, changes in the second moment over time do not necessarily completely characterize the changes in the concentration distribution (and the mass) over time. Therefore, in order to fully characterize the plume the Second Moment trend should be compared to the Zeroth moment trend (mass change over time), refer to Figures A.5.6 – A.5.8. Figure A.5.6 Moment Analysis Mann-Kendall Second Moment Trend Results: No Change in trend of either Sxx or Syy (both parallel and perpendicular to the plume center line), Mass Decreases over time. Figure A.5.7 Moment Analysis Mann-Kendall Second Moment Trend Results: Decreasing Trend in both Sxx and Syy (both parallel and perpendicular to the plume center line), no change in Mass over time. Version 2.1 November 2004 A.5-9 Air Force Center for Environmental Excellence AFCEE MONITORING AND REMEDIATION OPTIMIZATION SYSTEM SOFTWARE Figure A.5.8 Moment Analysis Mann-Kendall Second Moment Trend Results: Decreasing Trend in Syy (perpendicular to the plume center line), no change in mass over time. Redundant Well Removal Moment analysis can also be used to evaluate the effect of removing wells from a monitoring program. The question this analysis answers is whether or not removing a well from the well network will appreciably effect future plume delineation. The application of this technique involves analyzing how the moments would change if wells were removed from historical data sets. Historical data used in plume delineation is evaluated for zeroth, first and second moments including all wells in a monitoring program and then again, excluding the wells proposed for elimination. The values determined for mass, center of mass and spread of mass can be compared to determine how plume delineation would change if wells are removed. If removal of a well has significant impact on plume delineation, then the well should be maintained in the monitoring program. For example, if one were to choose a candidate (or several) well to remove from the monitoring program, you could go back into the historic data and perform moment analysis on the data set minus the candidate well. If similar zeroth, first and second moments were generated, then removing the wells would be not significantly effect the future delineation of the plume through a revised groundwater sampling network. Validation of removing a well from a monitoring program can be especially helpful when the water analysis alternates between non-detect and detection of very low concentrations. References Chiang, C. Y., P. D. Petkovsky, et al. (1995). Remediation and clean site-closure of a contaminated aquifer at the Wexford CPF. Petroleum Hydrocarbons and Organic Chemicals in Ground Water: Prevention, Detection, and Remediation, Houston, TX. Freyberg, D. L. (1986). "A natural gradient experiment on solute transport in a sand aquifer 2. Spatial moments and the advection and dispersion of non-reactive tracers." Water Resources Research 22(13): 2031-2046. Version 2.1 November 2004 A.5-10 Air Force Center for Environmental Excellence AFCEE MONITORING AND REMEDIATION OPTIMIZATION SYSTEM SOFTWARE Knox, R. C. (1993). "Spatial moment analysis for mass balance calculations and tracking movement of a subsurface hydrocarbon mound." Groundwater Monitoring and Remediation Summer 1993: 139-147. Rasmuson, A. (1985). "Analysis of hydrodynamic dispersion in discrete fracture networks using the method of moments." Water Resources Research 21(11): 1677-1683. Version 2.1 November 2004 A.5-11 Air Force Center for Environmental Excellence AFCEE MONITORING AND REMEDIATION OPTIMIZATION SYSTEM SOFTWARE APPENDIX A.6 DATA SUFFICIENCY ANALYSIS Authors: Ling, M. and Rifai, H. S., University of Houston. The sufficiency of data, in the statistical context, refers to whether the observed data are adequate, both in quantity and in quality, for revealing changes in the variable of interest. In long-term groundwater monitoring, there are at least two conditions that require sufficiency analysis: 1) the need to further increase confidence in monitoring results or to detect more subtle changes in contaminant concentrations; and 2) an overall adequate monitoring program that is not adequate at specific sampling points (e.g., the sampling frequency in a well at the plume edge is too low to reflect a possible sudden change in concentrations). Statistical power analysis can be used to evaluate the sufficiency of data for groundwater LTM plans. This appendix details the two posterior statistical power analysis methods employed in the Data Sufficiency Analysis module of the MAROS software. These statistical power analysis methods are designed to assess: 1) the cleanup status at individual wells; and 2) the risk-based cleanup status for the entire site. An example question arising from these evaluations is what to do next if cleanup cannot be confirmed because of large data variability. Results from these analyses provide hints that are helpful in answering these questions and suggestions for expansion or redundancy reduction of future sampling plans. The two statistical power analysis methods are introduced in two different sections in this Appendix following a brief introduction of the technique itself. The Basics of Statistical Power Analysis Statistical hypothesis tests are widely used in monitoring evaluations such as the statistical tests involved in the three tasks mentioned above. In any statistical tests, there are two types of error associated with the null hypothesis (H0) and the alternative hypothesis (H1): false positive (type I error) and false negative (type II error). These concepts are illustrated in Table A.6.1. False positive refers to the decision that the null hypothesis is rejected when in fact it is true; false negative is failing to reject the null hypothesis when it does not hold. Correspondingly, the false positive rate (denoted by α) is the probability of incorrectly declining the null hypothesis and the false negative rate (denoted by β) is the probability of incorrectly accepting the null hypothesis. Statistical power is equal to 1 - β, the probability of correctly rejecting the null hypothesis when it is not true. Table A.6.1 Two types of error in a statistical test True condition in the well Not Contaminated Contaminated Version 2.1 October 2004 Decision based on a statistical sample H0: Site Not Contaminated H1: Site Contaminated Correct Conclusion ( Probability = 1- α ) False Positive ( Probability = α ) False Negative ( Probability = β ) Correct Conclusion (power) ( Probability = 1- β ) A.6-1 Air Force Center for Environmental Excellence AFCEE MONITORING AND REMEDIATION OPTIMIZATION SYSTEM SOFTWARE The power of statistical tests is dependent upon the following design parameters: 1) the false positive rate (also called the significance level); 2) level of sampling effort (i.e., number of sampling points, frequency, and duration); 3) minimum detectable difference in the effect that can be detected; and 4) natural variability within the sampling environment. This relationship between the power of a statistical test and the design parameters makes several types of power analyses possible. The power of the test can be determined as a function of any of these design parameters. Alternatively, the value of any individual design parameter required to obtain a specified power of a statistical test can be determined as a function of the other parameters. With this type of approach, a relationship between the number of sampling locations, sampling frequency, the minimum difference that can be detected in the monitored variable, and the natural variability of the monitored variable can be established, and their trade-offs can be studied. For example, Figure A.6.1 includes two power curves for the detection of changes in dissolved oxygen with a sample size of 8 and a significance level of 0.05. If the minimum detectable difference is 0.4 mg/L and the sample standard deviation is 0.5 mg/L, the power to detect this change is 0.7. If the sample standard deviation is 1.0 mg/L, the power to detect this change is dramatically reduced to less than 0.3. If the same level of power (0.7) is to be maintained, the minimum detectable difference doubles (0.8 versus 0.4) for the sample with a higher variability (σ = 1.0). Therefore, the sufficiency or power of a sampling plan can be evaluated in terms of the goal established in the sampling plan. 1.0 Power (Probability of Detection) 0.9 σ = 0.5 0.8 0.7 0.6 0.5 σ = 1.0 0.4 0.3 N=8 α = 0.05 0.2 0.1 0.0 0 0.2 0.4 0.6 0.8 1 Minimum Detectable Difference (mg/L) Figure A.6.1 Power curves for different variability Statistical power analysis provides additional information for interpreting the results of statistical tests. The additional information includes: 1) the power of the statistical test (e.g., tests for trend or mean difference for individual wells or a group of wells); and 2) the expected sample size of a future sampling plan given the minimum detectable difference it is supposed to detect. Such information can assist users in modifying sampling plans to effectively achieve monitoring goals. Version 2.1 October 2004 A.6-2 Air Force Center for Environmental Excellence AFCEE MONITORING AND REMEDIATION OPTIMIZATION SYSTEM SOFTWARE Power Analysis for Individual Well Cleanup Status Before testing the cleanup status for individual wells, one important issue must be considered: the stability or trend of the contaminant plume. Only after the plume has reached or is reaching steady state can we conduct a test to examine the cleanup status of wells. Applying the analysis to wells in an expanding plume may cause incorrect conclusions and is less meaningful. Although in long-term monitoring the site may require many years to attain site cleanup, individual wells become clean gradually, beginning with the tail wells and followed by the source wells. If we can show that the average concentration in a well is below the cleanup level with statistical significance, we can eliminate it from the monitoring network or at least reduce its frequency of sampling. If the average concentration is lower than the cleanup level but is not significant, we can find out by power analysis how many more samples need to be collected to confirm the cleanup (with data variability unchanged). For cleanup status evaluation, a modified sequential t-test for assessing attainment of cleanup standards based on the mean contaminant levels is adopted (U.S. EPA 1992). The test procedures involve several steps. First, two statistics, δ and t, need to be calculated based on the yearly averages, i.e., the annual mean concentrations. When calculating δ and t, the untransformed yearly averages are used if they follow normal distribution (U.S. EPA 1992, p912). The log-transformed yearly averages are used if they are more likely to be lognormally distributed. Second, the likelihood ratio estimator LR is calculated as: n−2 n t LR = exp δ − + t2 1 n n (Equation A.6-1) where n is the number of yearly averages or log-transformed yearly averages. LR is then compared with two critical statistics A and B to determine the cleanup status. A and B are defined as: (1 − β ) β and (Equation A.6-2) B= 1−α α where α is the type I error (i.e., significance level or false positive rate) and β is the type II error (i.e., false negative rate). When LR < A, cleanup standards have not been attained. When LR > B, cleanup standards have been attained (statistically significant). When LR is between A and B, future tests need to be performed when more sampling data become available (not statistically significant). In the MAROS Data Sufficiency Analysis module, a well is considered to have attained the cleanup standards only when LR > B and the concentration trend is not “Increasing” as defined in the Modified CES method. A= The sequential t-test uses an easy-to-calculate approximation for the likelihood ratio. The use of log-transformed yearly averages improves the test performance with skewed data. It reduces the number of samples compared to that for an equivalent fixed sample size test, and has a low false positive rate and an acceptable false negative rate. According to the simulation results, for correlated data, skewed data, or correlated and skewed data, either normally distributed or lognormally distributed data, the log likelihood ratio method performs best among the other methods tested (U.S. EPA 1992). This sequential t-test has several advantages. First, for assessing attainment, the objective is to test a hypothesis rather than to obtain an unbiased estimate of the mean or construct a confidence interval. Second, if the concentrations at the site are indeed below the cleanup Version 2.1 October 2004 A.6-3 Air Force Center for Environmental Excellence AFCEE MONITORING AND REMEDIATION OPTIMIZATION SYSTEM SOFTWARE standards, maintaining the expected power at the alternative hypothesis can protect against incorrectly concluding that additional cleanup or monitoring is required. Third, reducing the sampling size results in cost savings for the monitoring program. Fourth, a good estimate of the measurement variance for calculating the sample size for the fixed size test may not be available. In cases where there are not enough yearly averages available for analysis, the original data from each sampling event (without being yearly-averaged) are also allowed for the sequential ttest. An option is provided in MAROS for the user to choose between the two types of data. An optional power analysis to the cleanup status evaluation is also provided. This analysis uses the Student’s t-test on mean difference to determine: 1) whether the mean concentration in a well is significantly below the cleanup goal; 2) the power associated with this test; and 3) the expected sample size in order to achieve the desired power. Because power analysis is difficult to perform for the sequential t-test but easy for the Student’s t-test, the optional power analysis is provided in MAROS as an alternative for assessing data sufficiency associated with the cleanup status evaluation. To determine if the mean concentration is statistically below the cleanup goal, a significance test based on the following statistic is used: t= m−c (Equation A.6-3) s/n where c is the cleanup goal (e.g., MCL), m and s are the sample mean and standard deviation respectively, n is the number of concentration data in the sample, and t is the test statistic following the Student’s t distribution with n-1 degrees of freedom. When log-transformed data are used (i.e., under lognormal distribution assumption), c is the logarithmic cleanup goal, and m and s are the mean and standard deviation of the log-transformed data, respectively. Same as in the sequential t-test, both yearly averages and original data can be used in the optional analysis. The significance of the test is found by comparing the test statistic t with the critical t value under significance level α. If t is less than the critical t value and both of them are negative, the test is Significant indicating the mean concentration is below the cleanup goal. Otherwise, the test is Not Significant indicating the mean concentration is not significantly below or is higher than the cleanup goal. The critical t value, or quantile, is obtained using the Microsoft Excel function TINV(). In calculating statistical power and the expected sample size associated with the Student’s t-test, an approximate power equation from Cohen (1988) is adopted in MAROS Data Sufficiency Analysis. The approximate power equation is: Z1− β = d (n − 1) 2n − Z1−a 2(n − 1) + 1.21(Z1− a − 1.06) (Equation A.6-4) where α is the significance level, β is the type II error, n is the sample size, d is the effect size, and Z is the percentile of the standard normal distribution. The effect size d is calculated as: d= m−c 2 s (Equation A.6-5) where c is the cleanup level (e.g., MCL), m and s are sample mean and standard deviation, respectively. When log-transformed data are used, c is the logarithmic cleanup goal, and m and s are the mean and standard deviation of the log-transformed data, respectively. Version 2.1 October 2004 A.6-4 Air Force Center for Environmental Excellence AFCEE MONITORING AND REMEDIATION OPTIMIZATION SYSTEM SOFTWARE Statistical power (i.e., 1-β) is obtained by transforming Z1-β to probability using Microsoft Excel function NORMSDIST(). Given α, β (i.e., 1-power), and d of the sample, the expected sample size n can be solved from Equation A.6-4 using Newton-Raphson algorithm. Two tests for the cleanup status evaluation are introduced above: the sequential t-test and the Student’s t-test. Results from the two tests on a same dataset have the following relationships: 1) Not Attained always corresponds to Not Significant; 2) Attained always corresponds to Significant; and 3) Cont. Sampling may correspond to Not Significant or Significant because of the difference between the two tests. Significance result from the Student’s t-test can be used as a secondary indication of cleanup status. Power and the expected sample size from the optional analysis can be used to indicate data sufficiency. RESULTS AND INTERPRETATION OF RESULTS The results of individual well cleanup status evaluation are presented in the Individual Well Cleanup Status Results and Individual Well Cleanup Status – Optional Power Analysis screens described in the MAROS Detailed Screens Description chapter. Power analysis parameters involved in the evaluation (see screen Data Sufficiency Analysis – Options) include: Cleanup Goal: The cleanup standard for a COC, also called the primary remediation goal (PRG). The default cleanup goal for a COC is its MCL, if available in MAROS database. Figure A.6.2 Individual well cleanup status – results based on the Sequential t-test. TargetLevel: The concentration level of COC in the well after attaining the cleanup goal. The default value for this parameter is set to 0.8 times the cleanup goal. This parameter is only used in the sequential t-test. The difference between the Cleanup Goal and the TargetLevel is the minimum detectable difference the sequential t-test is supposed to detect. AlphaLevel: The significance level (type I error or false positive error rate) used for all statistical tests in MAROS Data Sufficiency Analysis. The default value for this parameter is 0.05. Version 2.1 October 2004 A.6-5 Air Force Center for Environmental Excellence AFCEE MONITORING AND REMEDIATION OPTIMIZATION SYSTEM SOFTWARE TargetPower: The desired statistical power of all statistical tests in MAROS Data Sufficiency Analysis. The default value is 0.80. Results from the sequential t-test and the optional power analysis are illustrated in Figure A.6.2 and A.6.3, respectively. Cleanup status, power, and expected sample size for each well with at least four samples (yearly averages or original data) are calculated for two distributional assumptions: normal and lognormal. When there are less than four data records, NC is displayed in result fields indicating the analysis is not performed due to insufficient data. Cleanup Achieved? (Figure A.6.2) indicates whether the mean contaminant concentration at a well is below the cleanup goal with statistical significance using the sequential t-test. Attained indicates the mean concentration is significantly below the cleanup goal, and has achieved the TargetLevel. Attained is always supported by a sufficient power (equal to or greater than the expected power). Therefore, the cleanup goal has been attained and the well may be eliminated from the monitoring network. Not Attained indicates the mean concentration is higher than the cleanup goal. Cont. Sampling indicates although the mean concentration is below the cleanup goal, it is not statistically significant because 1) the mean concentration does not achieve the TargetLevel or 2) the existence of large data variability prevents the test from resulting in significance. The latter case corresponds to an inadequate power in the test. In the case of Cont. Sampling, more samples are to be collected for a future re-evaluation. Figure A.6.3 Individual well cleanup status – results from the optional analysis. Yearly averages? indicates the type of data used in the evaluation (yearly averages or original data without being yearly-averaged). If there are many years of data, using yearly averages is recommended because it can reduce the influence of seasonal variation and serial correlation. Distribution Assumption shows the assumption of data distribution for the results currently shown. Results for both normal and lognormal assumptions are given. Because normality tests for small size sample (e.g., <20) may not be accurate, presenting results under both assumptions provides a chance for comparison so that the conservative results may be used. Version 2.1 October 2004 A.6-6 Air Force Center for Environmental Excellence AFCEE MONITORING AND REMEDIATION OPTIMIZATION SYSTEM SOFTWARE Significantly < Cleanup Goal? (Figure A.6.3) indicates whether the mean contaminant concentration at a well is below the cleanup goal with statistical significance using the Student’s t-test in the optional analysis. YES indicates the mean concentration is significantly below the cleanup goal, supported by a power equal to or greater than 50%, although may not be as high as the expected power. Therefore, this result is also an indication of well cleanup but secondary to the sequential t-test. NO indicates the mean concentration is 1) higher than the cleanup goal or 2) below the cleanup goal but not statistically significant because the existence of large data variability prevents the test from resulting in significance. The latter case corresponds to an inadequate power in the test. In the case of NO, sampling should be continued. In the case of YES, the result from the sequential t-test should be consulted as to whether to continue sampling or stop sampling. Power of Test (Figure A.6.3) is the probability (associated with the Student’s t-test) that a well is confirmed to be clean when the mean contaminant concentration is truly below the cleanup goal. A value close to 1.0 may indicate that the data are distributed very close to the sample mean or the coefficient of variation is very small (a small variability). A value close to 0 indicates the opposite, requiring collecting more samples for a future re-evaluation. A value greater than the expected power indicates data in the well provide sufficient information. Expected Sample Size (Figure A.6.3) is the number of samples (associated with the Student’s ttest) required to achieve the expected power with the variability shown in the data. The smaller the value, the smaller the data variability and the higher the statistical power. If the expected sample size is smaller than the sample size, the sampling frequency at this well may be reduced. If the expected sample size is greater than the sample size, more samples are needed to confirm the cleanup status. Risk-Based Power Analysis for Site Cleanup Evaluation The use of risk-based goals in managing contaminated sites requires that cleanup standards be met at the compliance boundary. In order to perform a sufficiency analysis at the compliance boundary, a strategy was developed as follows. First, select monitoring wells along the plume centerline and regress concentrations from these centerline wells against their distances down the plume centerline with an exponential model. Second, for each monitoring well, project its concentration to the compliance boundary using the exponential model with its distance to the compliance boundary. Third, these projected concentrations at the compliance boundary constitute a group of estimated concentrations that can be evaluated by statistical power analysis. The result from this type of power analysis provides a statistical interpretation of whether the risk-based site cleanup goal has been met. The exponential regression model is: y = A ⋅ EXP(Bx) (Equation A.6-13) where A and B are regression coefficients, x is the distance from a plume centerline well to the plume source, and y is the concentration at this well. This regression follows the concept of bulk attenuation rate in natural attenuation, which assumes that the spatial change in plume concentrations can be modeled as exponentially decaying with distance downgradient from the source (ASTM 1998). Two types of data can be used for this regression: 1) data from monitoring wells points located on or close to the centerline; and 2) data estimated from hypothetical sampling points on the centerline through plume contouring. The first type of data yields more accurate results than the second type and therefore is used in the risk-based power analysis. The user should select at least three plume centerline wells for the regression analysis (see screen Version 2.1 October 2004 A.6-7 Air Force Center for Environmental Excellence AFCEE MONITORING AND REMEDIATION OPTIMIZATION SYSTEM SOFTWARE Parameters for Risk-Based Power Analysis in chapter Detailed Screen Description). For convenience, linear regression with log-transformed concentrations is used in MAROS Data Sufficiency Analysis to estimate coefficients A and B. Note B should be a negative value indicating declining concentrations away from the source. The compliance boundary is assumed to be a line perpendicular to the preferential ground flow direction that is located at or upgradient of the nearest downgradient receptor (Figure A.6.5). The user is asked to specify the whereabouts of the compliance boundary by providing the distance from the most downgradient well to the compliance boundary (see screen Parameters for Risk-Based Power Analysis in chapter MAROS Detailed Screen Description). The projected concentrations are calculated by using Equation A.6-12 with the distance from each well to the compliance boundary. The projected concentrations from each sampling event are then used in the risk-based power analysis. Since there may be more than one sampling event selected by the user, the risk-based power analysis results are given on an event-by-event basis. To determine the site cleanup status, a significance test based on the following statistic is used: t= m−c (Equation A.6-14) s/n where c is the cleanup goal, m and s are the mean and standard deviation estimated from the projected concentrations respectively, n is the number of projected concentrations, and t is the test statistic following t distribution with n-1 degrees of freedom. When log-transformed data are used (i.e., under lognormal distribution assumption), c is the logarithmic cleanup level, and m and s are the mean and standard deviation of the projected concentrations, respectively. Compliance boundary Concentrations projected to this line The nearest downgradient receptor Groundwater flow direction Figure A.6.5 Illustration of projected concentrations for risk-based power analysis. The significance of the site cleanup test is found by comparing the test statistic t with the critical t value under significance level α. In calculating statistical power and the expected sample size, Equation A.6-4 and Equation A.6-5 are used but with the statistics introduced in Equation A.614. Version 2.1 October 2004 A.6-8 Air Force Center for Environmental Excellence AFCEE MONITORING AND REMEDIATION OPTIMIZATION SYSTEM SOFTWARE RESULTS AND INTERPRETATION OF RESULTS The results of risk-based site cleanup evaluations are presented in the Risk-Based Power Analysis Results screen introduced in the MAROS Detailed Screens Description chapter. The site cleanup status, power, and expected sample size for each sampling event with at least six projected concentrations are calculated under both normal and lognormal assumptions (Figure A.6.6). When a sampling event has less than six projected concentrations (insufficient data) or the mean projected concentration is higher than the cleanup goal, N/C or S/E, respectively, are displayed in result fields indicating the analysis is not conducted. Cleanup Achieved? presents the risk-based site cleanup status at the compliance boundary at the time when the sampling event was taken. The result indicates whether the mean projected concentration at the compliance boundary is below the cleanup level with statistical significance. Results could be Attained (cleanup goal achieved), Not Attained (cleanup goal not achieved), or NC (not conducted due to insufficient data). The results may be different over time (i.e., over sampling events selected). The results as a function of time can be used to evaluate the effectiveness of site remedial actions. Power of Test is the probability that the site is confirmed to be clean when the projected mean concentration level at the compliance boundary is truly below the cleanup goal. A value close to 1.0 may indicate that the data are distributed very close to the sample mean or the coefficient of variation is very small (a small variability). A value close to 0 indicates the opposite, requiring more sampling locations for the analysis to reach a higher power. A value greater than the expected power means that data from the monitoring network provides sufficient information for the risk-based site cleanup evaluation. Figure A.6.6 Individual well concentration trend results Expected Sample Size is the number of projected concentrations (i.e., the number of wells) required to achieve the expected power (e.g., 0.80) with the variability shown in the projected concentrations. The smaller the value, the smaller the data variability and the higher the statistical power. If the expected sample size is smaller than the sample size, the monitoring network has more than enough wells to detect the risk-based site cleanup status. If the expected Version 2.1 October 2004 A.6-9 Air Force Center for Environmental Excellence AFCEE MONITORING AND REMEDIATION OPTIMIZATION SYSTEM SOFTWARE sample size is greater than the sample size, more sampling locations are needed to confirm the cleanup status. Distribution Assumption shows the assumption of data distribution for the results currently shown. Results for both normal and lognormal assumptions are given. Because normality tests for small size sample (e.g., <20) may not be accurate, presenting results under both assumptions provides a chance for comparison so that the conservative results may be used. In addition to AlphaLevel and TargetPower, power analysis parameters used in the risk-based site cleanup evaluation include: Detection Limit: The uniform detection limit for a COC specified by the user. It is only used in the risk-based power analysis to indicate that the projected concentrations are below the detection limit. The detection limit for a COC is by default set to 20% of the MCL of a COC, if available in MAROS database. References ASTM, 1998, Standard Guide for Remediation of Groundwater by Natural Attenuation at Petroleum Release Sites, American Society of Test and Material, E1943-98. Cohen, J., 1988, Statistical Power Analysis for the Behavioral Sciences, Lawrence Erlbaum Associates, Hillsdale, New Jersey. U.S. EPA, 1992, Methods for Evaluating the Attainment of Cleanup Standards Volume 2: Ground Water, Environmental Statistics and Information Division, Office of Policy, Planning, and Evaluation, U.S. Environmental Protection Agency. Version 2.1 October 2004 A.6-10 Air Force Center for Environmental Excellence AFCEE MONITORING AND REMEDIATION OPTIMIZATION SYSTEM SOFTWARE APPENDIX A.7 FALSE POSITIVE/NEGATIVE MINIMIZATION METHODOLOGY Authors: Ling, M. and Rifai, H. S., University of Houston. This appendix introduces the methods and strategies for minimizing false positive and false negative error rates in the statistical analysis of monitoring data. Most of the methods introduced in this appendix have not been implemented in the MAROS software. This appendix serves as a supplementary information source for those who have a deeper interest in this issue. Introduction Data evaluation is an essential part of a long-term monitoring program in that it aids in making decisions regarding plume conditions and the appropriate response measures. Uncertainty in the sample data can cause false positives and false negatives in the data evaluation procedure resulting in misleading or incorrect conclusions. False positive refers to falsely concluding the presence of a condition when it is in fact not present. False negative refers to the failure of recognizing the presence of a condition when it is present. In groundwater monitoring, for example, this condition could be the contamination of groundwater by petroleum hydrocarbons. The uncertainty that causes false positives and false negatives comes from three primary sources: (1) sampling uncertainty, which originates from sampling procedures; (2) analytical uncertainty, which governs the ability to detect and quantify the level of a particular contaminant; and (3) spatial and temporal variations, which control the ability to determine the significance of changes within a population using the sample data. Sampling uncertainty is the result of field sampling procedures where systematic errors or random errors may exist in the processes of purging the well, collecting a sample, performing field tests, recording the test results, and preserving and transporting the sample. Designing appropriate sampling routines and employing an experienced sampling team can reduce sampling uncertainty. Analytical uncertainty is caused by uncertainty associated with laboratory analysis of a sample. Lab analysis is affected by the detection and quantitation methods of a particular contaminant and the stability of laboratory performance. Using approved analytical methods and having samples analyzed by a laboratory with rigorous quality control protocols can reduce analytical uncertainty. Spatial variation and temporal variation are caused by natural variability, which is inherent in any subsurface system. Spatial variation refers to the different level of contamination or different degree of uncertainty at different spatial locations. Temporal variation refers to systematic time effects in addition to random measurement errors. Unlike the first two kinds of uncertainty, which can be avoided or reduced by a well-planned sampling strategy and analytical protocols, uncertainty associated with natural variability can only be understood using appropriate statistical techniques. The intent of this appendix is to develop data evaluation strategy using appropriate statistical techniques which will reduce the probability of making false positive and false negative decisions. Therefore only the last type of uncertainty (i.e., uncertainty due to natural variability) is considered in this study, assuming that the first two types have already been addressed. Problems involving spatial correlation or temporal correlation between measurements will also be considered. These correlations, if not addressed, cause violations of the statistical Version 2.1 October 2004 A.7-1 Air Force Center for Environmental Excellence AFCEE MONITORING AND REMEDIATION OPTIMIZATION SYSTEM SOFTWARE assumptions that underlie most statistical methods and cause excessive false positive and false negative rates during the statistical tests. A thorough evaluation for optimization of a long-term monitoring program not only includes the development of an appropriate data evaluation strategy, but also requires a qualitative review of the program to determine the value of the information generated by monitoring each well. Factors such as the location of the screened intervals of monitoring wells in relation to water-bearing zones and the hydrogeologic position of each monitoring point in relation to the plume should be considered. For example, a well screened at an incorrect interval in relation to the water-bearing zone will provide misleading information regarding contaminant concentrations. The use of sample data from this well in the data evaluation process will lead to high false positive or false negative rates. Therefore, before proceeding with the details of this study we will briefly review major problems that affect the quality of sample data and ways to address them. QUALITATIVE EVALUATION OF GROUNDWATER MONITORING PROBLEMS Kufs (1994) has provided a comprehensive analysis of problems that may affect groundwater monitoring and has provided response measures for these problems. The identified problems include sample space, system implementation, program implementation, geologic uniformity, hydrologic uniformity, and geochemical interaction. The first three types of problems that are relatively important in terms of generating useful information are reviewed below. Sample space problems occur when the wells in a system are inappropriately located for monitoring a specified volume of the aquifer. Typical sample space problems include: • • • Inadequate arrangement of wells for evaluating the extent of contamination; Improper selection of screen setting or length; Inappropriate overall system design. For example, well screens not set to span an appropriate hydrostratigraphic zone can cause sample space problems. The remedies for sample space problems include installing additional wells, resampling the wells, or deleting anomalous data collected from the suspect wells. Details for the prevention, recognition and correction of typical sample space problems are presented in Table A.7.1. System implementation problems refer to situations in which wells or other elements of the system do not perform as designed. Typical problems include: • • • • • • Well does not produce sufficient water; Well silts up after installation; Sand pack becomes clogged; Well seals leak; Well materials degrade; Well is poorly constructed. For example, a well that dries or recharges too slowly to be sampled effectively is an indication of system implementation problems. The remedies for system implementation problems include redeveloping the well, redesigning a new well, or abandoning and replacing the well. Details for the prevention, recognition, and correction of typical system implementation problems are presented in Table A.7.2. Program implementation problems refer to situations in which field data collection or laboratory analysis procedures fail to produce high quality data. Typical problems include: Version 2.1 October 2004 A.7-2 Air Force Center for Environmental Excellence AFCEE MONITORING AND REMEDIATION OPTIMIZATION SYSTEM SOFTWARE • • • • Well construction is not adequately documented; Field data collection procedures are inadequate; Sample collection procedures are inappropriate; Sample analysis procedures are inadequate or undocumented. Examples of program implementation problems include missing or ambiguous data, different results for duplicated samples, and presence of chemicals in blanks. The remedies for program implementation problems include resampling using improved protocols, employing more experienced personnel, and employing a reputable laboratory for analysis. Details for the prevention, recognition, and correction of typical program implementation problems are presented in Table A.7.3. A monitoring system with the above problems will appear to be functioning properly, but will actually be producing data that are misleading, uninterpretable, or incorrect. The qualitative evaluations described above should be the initial steps used to reduce false positive and false negative rates. These steps should be performed before any of the data analyses or statistical approaches presented later in this appendix are employed. Version 2.1 October 2004 A.7-3 Air Force Center for Environmental Excellence AFCEE MONITORING AND REMEDIATION OPTIMIZATION SYSTEM SOFTWARE Table A.7.1 Prevention, Recognition and Correction of sample space problems* Problem Prevention Recognition Correction 1. Wells not positioned for identifying groundwater flow directions 2. Wells not positioned for evaluating the extent of contamination Use basic hydrogeologic assumptions to estimate flow directions. Use ground-penetrating radar (GPR), if possible, to evaluate the validity of the assumptions. Estimate the distance the contaminant plume may have migrated from the site based on site history, hydrogeology, and contaminant geochemistry. Use aerial images or electromagnetic conductivity (EM) and soil-gas surveys to check estimation. Use background geologic and geochemical information and geophysical surveys to project contaminant flow. Compare information to on-site soil samples collected from boreholes. Use background information and geophysical surveys to project correct screen length to meet study objectives. Confirm length using soil samples collected from boreholes. Identify ultimate use of data and methods of data analysis to estimate minimum sample size. Water elevations do not produce a unique contour pattern; too few wells screened in the same zone; wells installed essentially along a line. Contaminant concentrations do not produce a unique contour pattern; the contamination plume does not appear to be related to the suspected source, or the contaminant pattern suggests undocumented sources. Water elevations appear to be anomalous; apparent flow directions seem illogical or overly complex; information for on-site soil samples lower than expected. Water elevations appear to be anomalous; contaminant concentrations lower than expected. Install additional wells or find existing wells screened in the same water-bearing zone. Groundwater flow or contaminant migration appears to be ambiguous or illogical. Resample wells and/or install additional wells. Augment direct data with indirect data (e.g., geophysics and soil-gas). Delete anomalous data collected from suspect wells. 3. Screen settings not correctly selected 4. Screen length not correctly selected 5. System not adequately designed to accomplish study Install additional wells or find existing wells screened in the same aquifer. In some cases, soil-gas or EM surveys can be used to augment monitoring well networks. Install additional wells or find existing wells screened in the same aquifer. In some cases, packers can be used to test specific zones. Use packers to isolate zones in open-hole wells. Install additional wells. * Adapted from Table 1 in Kufs (1994). Version 2.1 October 2004 A.7-4 Air Force Center for Environmental Excellence AFCEE MONITORING AND REMEDIATION OPTIMIZATION SYSTEM SOFTWARE Table A.7.2 Prevention, Recognition and Correction of System implementation problems* Problem Prevention Recognition 1. Well does not produce sufficient amounts of water If consistent with monitoring objectives, screen well in coarse granular or highly fractured medium. 2. Well silts up after installation Select screen opening size and sand pack gradation to be compatible with geologic materials to be screened. Add a sump below the well screen. Specify a well-sorted (poorly graded) coarse-grained, washed quartz sand or gravel consistent with the aquifer material. Design seals to be compatible with projected use of well and site hydrogeology and geochemistry. Monitor installation of seals closely by repeatedly measuring the depth to the seal. Well is dry or recharges too Redevelop well. Deepen slowly to sample effectively. bedrock well if consistent with study objectives. Redesign new well. Water is murky or bottom of Redevelop well well feels "mushy" when periodically. sounded. 3. Sand pack becomes clogged 4. Well seals leak 5. Well materials are degraded by contaminants or fail structurally 6. Well is poorly constructed Correction Well recharges much more slowly than expected. Redevelop well periodically. Redesign new well. Water elevation and quality on either side of the seal are more similar than expected. Abandon leaking wells to prevent inter-aquifer leakage, and replace well. Obstructions found in the well. Aquifer materials that are larger than screen slots enter the well. Well yields decrease over time. Phthalates or inorganics increase over time. Evidence of poor Hire a reliable driller. Have an experienced hydrogeologist monitor well workmanship at surface. Well is not vertical and installation. aligned. Water levels and quality appear anomalous. Specify stainless steel for areas of high organic contamination and PVC or Teflon in areas of extreme pH. Specify appropriate material strength based on expected loads. Screen or overdrill highly fractured bedrock wells. Abandon and replace well. Abandon and replace well. * Adapted from Table 2 in Kufs (1994). Version 2.1 October 2004 A.7-5 Air Force Center for Environmental Excellence AFCEE MONITORING AND REMEDIATION OPTIMIZATION SYSTEM SOFTWARE Table A.7.3 Prevention, Recognition and Correction of program implementation problems* Problem Prevention Recognition Correction 1. Well construction not adequately documented Require contractors to produce boring logs and as-built diagrams for each well installed. Have an experienced hydrogeologist monitor installation. Use trained field staff and detailed protocols. Adapt the protocols to the geologic conditions and contaminants expected. Use trained field staff and detailed protocols. Adapt the protocols to the geologic conditions and contaminants expected. Construction details are missing, confusing, or are not consistent with measurements taken for the well. Use downhole sensors and Data are missing or are ambiguous. If necessary, resample the well using improved protocols and/or more experienced personnel. If necessary, resample the well using improved protocols and/or more experienced personnel. 2. Field data collection procedures are inadequate 3. Sample collection procedures are inadequate 4. Sample analysis procedures are inadequate or are undocumented Work closely with a reputable laboratory to design an appropriate analytical program. Water quality data are confusing; usually volatile chemicals are at lower concentrations than expected, and other chemicals are present when they were not projected, especially in blanks. Documentation is poor; duplicate samples yield varied results; laboratory blanks are severely contaminated; spike recoveries are poor. geophysical logs to approximate well construction details. If necessary, resample the well and have analyses conducted by a reputable laboratory. * Adapted from Table 3 in Kufs (1994). Statistical Concerns Regarding False Positive and False Negative Rates As mentioned previously, false positives and false negatives are the two types of errors existing in any statistical tests concerning the null hypothesis (denoted as H0; the alternative hypothesis is denoted by H1). From the statistical definition, false positive refers to the decision that the null hypothesis is rejected when in fact it is true; false negative is failing to reject the null hypothesis when it does not hold. Correspondingly, the false positive rate (type I error rate α) is the probability of incorrectly declining the null hypothesis and false negative rate (Type II error rate β) is the probability of incorrectly accepting the null hypothesis. α is also referred to as the significance level of a statistical test. 1-β is equivalent to the power or sensitivity of a statistical test, and is the probability of correctly rejecting the null hypothesis when it is not true. These concepts are illustrated in Table A.7.4 and Table A.7.5 for two types of groundwater monitoring programs, respectively. Two questions arise regarding the control of false positive and false negative rates in groundwater monitoring: (1) is it possible to completely avoid false posititves and false negatives? and (2) to what level can we reduce false positive and false negative rates? For the first question it is important to recognize that false positives and false negatives in groundwater monitoring are inevitable because of natural variability or uncertainty due to spatial and temporal variations. In addition, analytical determinations associated with method detection limits (MDL) and practical quantitation limits (PQL) have false positive rates by design. For example, the false positive rate associated with MDLs for rarely detected constituents such as volatile organic chemicals (VOCs), is intended to be 1% or larger (Clayton 1987). In practice, limiting factors such as the monitoring budget control the levels to which the false positive and false negative rates can be reduced. A lower error rate is generally achieved by increasing monitoring which can be expressed as cost. The additional cost of lowering false positive rates comes from taking additional samples and using more precise analytical Version 2.1 October 2004 A.7-6 Air Force Center for Environmental Excellence AFCEE MONITORING AND REMEDIATION OPTIMIZATION SYSTEM SOFTWARE protocols. Lowering false negative rates and requiring a simultaneous reduction of false positive rate usually can only be achieved by increasing sample size. Therefore, if a sampling strategy is sufficiently sensitive to detecting changes in contaminant concentrations at regulatory levels, its false positive and false negative rates should be acceptable and need not be further reduced. Table A.7.4 Two types of error in detection monitoring True condition in the well Not Contaminated Contaminated Decision based on a statistical sample H0: Site Not Contaminated H1: Site Contaminated Correct Conclusion False Positive Rate* ( Probability = 1- α ) ( Probability = α ) False Negative Rate Correct Conclusion (power) ( Probability = β ) ( Probability = 1- β ) * The type of error that may cause facility-wide problems Table A.7.5 Two types of error in corrective action monitoring True condition in the well Clean Contaminated Decision based on a statistical sample H0: Contaminated (Does not attain the cleanup standard) H1: Clean (Attains the cleanup standards) False Negative Rate* Correct Conclusion (power) ( Probability = β ) ( Probability = 1- β ) Correct Conclusion False Positive Rate ( Probability = 1- α ) ( Probability = α ) * The type of error that may cause facility-wide problems TYPES OF GROUNDWATER MONITORING IN A LONG-TERM MONITORING PROGRAM The type of groundwater monitoring program used affects the development of strategies for the control of false positive and false negative rates. In long-term monitoring programs, three kinds of groundwater monitoring may be involved: detection monitoring, compliance or assessment monitoring, and corrective action monitoring. These three types of groundwater monitoring are mandated by the Resource Conservation and Recovery Act (RCRA) and the Comprehensive Environmental Response, Compensation and Liability Act (CERCLA or Superfund). The purposes and relationships of these monitoring programs are listed in Table A.7.6. As is shown in Table A.7.6, each of the monitoring programs addresses different problems and therefore requires different statistical methods for testing the corresponding hypothesis. Since each monitoring program has a different objective, definitions of null hypotheses and their implications are different. Table A.7.4 and Table A.7.5 illustrate the differences in definition of the two types of error for detection monitoring and corrective action monitoring. In detection monitoring, the false positive refers to the decision that the contamination is present in the groundwater when in fact Version 2.1 October 2004 A.7-7 Air Force Center for Environmental Excellence AFCEE MONITORING AND REMEDIATION OPTIMIZATION SYSTEM SOFTWARE it is not. The false negative is the decision that there is no contamination when in fact contamination is present. However, in corrective action monitoring, where the site is undergoing active or passive remediation such as monitored natural attenuation, the definition of the null hypothesis turns to the opposite. The false positive is then the mistake of concluding that the groundwater is clean when contamination is still present. The false negative becomes the conclusion that the groundwater requires additional treatment when in fact it has attained the cleanup standards. For compliance monitoring, the definition of null hypothesis could take the form of the detection monitoring or the corrective action monitoring, depending on the statistical methods used. Table A.7.6 Three types of groundwater monitoring programs* Type Purpose Intensity Implemented when Detection monitoring Detect a release to groundwater Sampling and analysis of 15 inorganic and 47 organic compounds No release to groundwater has been confirmed Compliance monitoring Determine if the groundwater impact is significant Extended sampling of up to 17 inorganic and 213 organic compounds Release to groundwater has been confirmed by detection monitoring Corrective action monitoring Document the effectiveness of remediation and the attainment of cleanup standards Extensive sampling for site characterization combined with remedial actions A statistically significant groundwater impact has been confirmed by compliance monitoring * Adapted from Weber (1995) STATISTICAL ANALYSIS: UNDERLYING ASSUMPTIONS An important statistical assumption that underlies all statistical methods used in groundwater monitoring is the assumption that observations are independently and identically distributed. This can be clarified using the following three assumptions: • • Independence Data values used in a statistical test are independent of each other. This assumption forms the basis of both parametric and nonparametric tests used in groundwater monitoring. Correlation between observations resulting from spatial or temporal correlation may violate this assumption. Homogeneity of Variances Data values used in a statistical test have equal variances for all values of the independent variables. This assumption forms the basis of both parametric and nonparametric tests used in groundwater monitoring. Natural spatial variation tends to violate this assumption when performing inter-well analyses. Inter-well analysis refers to statistical tests performed using measurements from different wells, e.g., upgradient versus downgradient comparisons. Intra-well analysis refers to statistical tests or analyses performed using measurements from the same well, e.g., comparing new monitoring measurements to statistics computed from historical measurements from the same well. The use of intra-well analysis can eliminate the problem caused by spatial variability between wells in different locations and should be used whenever possible. • Identically distributed Samples used in a statistical test have the same population distributions. This assumption forms the basis of parametric and most nonparametric tests used in groundwater monitoring. Most parametric statistical methods assume data Version 2.1 October 2004 A.7-8 Air Force Center for Environmental Excellence AFCEE MONITORING AND REMEDIATION OPTIMIZATION SYSTEM SOFTWARE or their transformations are normally distributed. For nonparametric tests, the distribution of data does not have to be normal but need to be identical in most cases. Sometimes the normality of data can be achieved by transforming the original observations to make them normally distributed (e.g., lognormal). An algorithm for choosing the best transformation power is available in Neter et al. (1996). Usually parametric methods need a smaller sample size and have a higher power than their nonparametric counterparts. It is recommended that parametric methods be used for data evaluation whenever possible. The use of any statistical method that fails to take the above assumptions into consideration may result in excessive false positive and false negative rates. FACILITY-WIDE FALSE POSITIVE/NEGATIVE RATE Another issue needing consideration is the facility-wide false positive rate (FWFPR), also called site-wide or experiment-wise false positive rate. This happens when the monitoring status of a facility or site depends on the probability of obtaining a false positive with any parameter at any well at the facility or site. For example, in detection monitoring when any of the constituents in any monitoring well indicates an exceedence over the background, the site is declared contaminated and must enter into more extensive compliance monitoring. Even if the comparison-wise false positive rate is very low, the FWFPR associated with a large program can be greatly exaggerated and can often lead to a declaration of contamination. For instance, assuming the significance level or false positive rate of an individual comparison is α, and all comparisons are independent, the probability of at least one of n comparisons being significant by chance alone is given by: α * = 1 − (1 − α ) n (Eq-1) If α = 0.05 and n = 60, the FWFPR α* is 0.95. This indicates the site is almost certain to be declared contaminated when in fact no contamination is present. The most effective way to control FWFPR is the combined use of Bonferroni inequality and verification resampling (Davis et al. 1994, Gibbons 1994). Bonferroni inequality works by inversely specifying the comparison-wise significance level α with a fixed FWFPR α*: α* α= (Eq-2) n However, when n is large, α becomes too small and results in a dramatic decrease in the statistical power of an individual comparison. For example if α*=0.05 and n=50, α is then 0.001. This is one tenth of the regulatory performance standard of RCRA Interim Final Guidance Document (EPA 1989), which requires that the comparison-wise false positive rate α should be no less than 0.01. The use of verification resampling can solve this problem. Davis et al. (1987) found that the controlled use of verification resampling can control FWFPR while maintaining sensitivity to contamination. There are two types of widely used verification resampling strategies: 1 of m plans and California plans. 1 of m plans declare a statistically significant increase when an initial sample and all of m-1 resamples indicate exceedence. California plans declare a statistically significant increase when both the initial and any of the m-1 resamples indicate exceedence. An example of 1 of m plans illustrates the effects of verification resampling on the control of both FWFPR and the false negative rate. Assuming α=0.01 and n=50 (future comparisons), for one verification resample the FWFPR is: α* = 1 - Probability (all wells okay) Version 2.1 October 2004 A.7-9 Air Force Center for Environmental Excellence AFCEE MONITORING AND REMEDIATION OPTIMIZATION SYSTEM SOFTWARE = 1 - (Probability (one well okay)) n = 1 - (1 - α + α (l - α)) n = 1 - (1 - 0.01 + 0.01(1 - 0.01)) 50 = 0.005 < 0.05 In this case the verification resample has limited the FWFPR to within 5%. In using α=0.01 instead of α=0.001 (0.05/50=0.001) with other conditions unchanged, the sensitivity of the individual comparison will be significantly increased. However, in corrective action monitoring for evaluating the attainment of cleanup standards, the FWFPR no longer poses a threat. Assuming the site is declared clean only when all constituents of concern in all wells attain the cleanup standards, the FWFPR will always be less than or equal to the maximum comparison-wise false positive rate. For example, if the maximum comparison-wise false positive rate is αmax=0.2 for n=10 independent future comparisons, the FWFPR is given by: α∗ = Probability (all wells clean) ≤ αmax n = 0.2 10 = 1 × 10 -7 << αmax However, the facility-wide false negative rate (FWFNR) may now cause problems if cleanup of the site is declared only when all constituents at all wells attain cleanup standards. In this case and for large monitoring programs, even if all wells have attained the cleanup standard, a nonattainment decision could still be reached due to FWFNR. The cause of the problem associated with FWFNR can be analyzed in the same way as that of detection monitoring. Regardless of the strategy used, simultaneous analysis of more wells and more constituents will increase facility-wide false error rates, either FWFPR or FWFNR. Therefore, a non-statistical suggestion for reducing the FWFPR and FWFNR is to choose as few constituents and wells as possible. This will be valid and safe if the selected constituents are most likely to be different from their null hypotheses. Using Appropriate Statistical Methods This section details the statistical approaches that can be used in the data evaluation procedures for the control of false positive and false negative rates. First, scientifically sound statistical methods widely used for assessing the conditions of groundwater contamination and for making decisions about regulatory requirements are outlined. Second, procedures for dealing with problems that arise from violations of statistical assumptions will be presented. In practice, the procedures for dealing with violations of statistical assumptions should be performed first. In this appendix, the statistical methods are presented first so that assumptions of these methods are understood and strategies dealing with violations of these assumptions can be developed. METHOD 1 COMBINED SHEWART-CUSUM CONTROL CHART The combined Shewart-CUSUM control chart (ASTM 1996; EPA 1989; Gibbons 1994) is a statistical method for intra-well comparisons used in detection monitoring to determine if the groundwater at the well is contaminated. The combined Shewart-CUSUM control chart method is sensitive to both immediate and gradual releases. Also, since it is an intra-well comparison method, problems associated with spatial variations can be avoided. Version 2.1 October 2004 A.7-10 Air Force Center for Environmental Excellence AFCEE MONITORING AND REMEDIATION OPTIMIZATION SYSTEM SOFTWARE Statistical Assumptions: Data values are independent and normally distributed with mean µ and standard deviation of σ. If original measurements follow lognormal distribution, their logarithms will follow normal distribution and should be used in the computation. Procedures: Step 1. Estimate µ and σ by computing the mean x and standard deviation s of at least eight historical independent samples collected in a period of no less than one year. Setp 2. Select the three Shewart-CUSUM parameters, h (the value against which the cumulative sum will be compared), c (a parameter related to the displacement that should be quickly detected), and SCL (the upper Shewart limit that is the number of standard deviation units for an immediate release). It is suggested that c = 1, h = 5, and SCL = 4.5 are most appropriate for groundwater monitoring applications. The false positive rate associated with these parameters is about 1%. Step 3. Denote the new data value at time-point ti as xi and compute the standardized value zi: zi = xi − x s Step 4. At each time period, ti, compute the cumulative sum Si, as: S i = max[ 0, ( z i − c ) + S i −1 ] where max[A, B] is the maximum of A and B, starting with S0 = 0. Step 5. Plot the values of Si (y-axis) versus ti (x-axis) on a time chart. Step 6. Make decisions: Declare an "out-of-control" situation for sampling period ti if for the first time, Si ≥ h (gradual release) or zi ≥ SCL (immediate release). Any such designation must be verified on the next round of sampling before further investigation is deemed necessary. Once confirmed, the test results indicate that groundwater at the well is "contaminated". As monitoring continues and no exceedence is found, the combined Shewart-CUSUM control charts should be updated periodically to incorporate these new data. Davis (1994) suggests that every two years all new data that are in control should be pooled with the initial samples to calculate the new background mean and variance. Example: Step 1. The data from Gibbons (1994), Example 8.1, page 165 are used and listed in Table A.7.7. The mean and standard deviation are estimated to be 50 µg/L and 10 µg/L, respectively, from eight previous background measurements in the same well. Setp 2. The three Shewart-CUSUM parameters are selected as h = 5, c = 1, and SCL = 4.5, in units of standard deviation. Step 3. The standardized value zI for each new measurement is computed and presented in the fifth column of Table A7.7. For example, z3 = (60 - 50) / 10 = 1. Version 2.1 October 2004 A.7-11 Air Force Center for Environmental Excellence AFCEE MONITORING AND REMEDIATION OPTIMIZATION SYSTEM SOFTWARE Step 4. The quantity Si is computed and presented in the seventh column of Table A.7.7. For example, S6 = max [0, (3-1)+1] = max [0, 3] = 3. Step 5. The control chat is presented in Figure 1 with Si plotted verses ti. From Figure A.7.1 and Table A.7.7 we can see the process is out of control both in terms of absolute value and trend on the third quarter of 1991. This result is confirmed in the fourth quarter of 1991. Table A.7.7 Example dataset for constructing the Shewart-CUSUM charts Quarter Year Period ti Concentration xi Standardized zi 1 90 1 50 0 2 90 2 40 -1 3 90 3 60 1 4 90 4 50 0 1 91 5 70 2 2 91 6 80 3 3 91 7 100 5a 4 91 8 120 7a a Shewart "out-of-control" limit exceeded (zi > SCL = 4.5). b CUSUM "out-of-control" limit exceeded (Si > h = 5). zi - c CUSUM Si -1 -2 0 -1 1 2 4 6 0 0 0 0 1 3 7b 13b Concentration in standardizd unit Combined Shewart-CUSUM Charts 14 13 12 11 10 9 8 7 6 h=5 5 4 SCL=4.5 3 2 1 0 -1 -2 Jan-90 Apr-90 Standardized Mean Jul-90 Oct-90 Jan-91 CUSUM Apr-91 Jul-91 Oct-91 Jan-92 Sam pling period Figure A.7.1 Example Combined Shewart-cusum charts Version 2.1 October 2004 A.7-12 Air Force Center for Environmental Excellence AFCEE MONITORING AND REMEDIATION OPTIMIZATION SYSTEM SOFTWARE METHOD 2 PREDICTION LIMITS IN DETECTION MONITORING Prediction limits are statistical estimates of the minimum or maximum concentration (or both) that will contain the next series of k measurements with a specified level of confidence (e.g., 99% confidence) based on a sample of n background measurements. In groundwater detection monitoring, we are concerned with the upper prediction limit, the limit with a known confidence of not being exceeded by the next k measurements. If any of the k measurements exceeds the limit, it is probable that contamination occurs and compliance monitoring may be initiated. The Simultaneous Normal Prediction Limit for the Next r of m Measurements at Each of k Monitoring Wells presented by Davis and McNichols (1987) is recommended for both inter-well and intra-well comparisons. This method uses Bonferroni inequality to control the facility-wide false positive rate (FWFPR) and verification resampling to minimize the false positive and false negative rates associated with a single comparison. Furthermore, the dependence in multiple comparisons against the same background (inter-well comparisons) and the correlation due to repeated comparison of the resamples to the same prediction limit (intra-well comparisons) are also handled. Statistical Assumptions: Data values are independent and normally distributed. If original measurements follow lognormal distribution, their logarithms will follow normal distribution and should be used in the computation. When spatial variations between wells are significant, the assumption of homogeneity of variances will be violated and the use of inter-well data should be avoided. In this case, intra-well prediction limits can be used instead. Procedures (background verses downgradient comparisons): Step 1. Determine the facility-wide false positive rate α that needs to be controlled for the site. For example, α = 0.05, α = 0.005, etc. If N constituents need to be tested simultaneously, use Bonferroni inequality to obtain α*, the overall significance level for a single constituent as α* = α N Step 2. Determine the resampling plan that will be used: One of Two Samples in Bounds plan (exceedence is declared when both the initial sample and the resample exceed the limit), One of Three Samples in Bounds plan (exceedence is declared when both the initial sample and the two resamples exceed the limit), or First or Next Two Samples in Bounds plan (exceedence is declared when both the initial sample or any of the two resamples exceed the limit). Usually One of Two Samples in Bounds plan and One of Three Samples in Bounds plan are used (ASTM 1998). Step 3. Compute the mean x and standard deviation s of the n background samples (at least 4) for the single constituent. Step 4. Determine k, the number of monitoring wells that will be sampled for the single constituent. Step 5. Consult the tables in Davis and McNichols (1987) or Gibbons (1994) with n, α* and k to locate the factor K. Version 2.1 October 2004 A.7-13 Air Force Center for Environmental Excellence AFCEE MONITORING AND REMEDIATION OPTIMIZATION SYSTEM SOFTWARE Step 6. Calculate the prediction limit as follows: x + Ks Step 7. Make decisions: For any downgradient well, if its initial sample exceeds the prediction limit and if the verifying resamples confirm this exceedence, then the groundwater is declared "contaminated". Note that different plans have different requirements. For application in intra-well comparisons, the prediction limit is computed separately in each monitoring well for each constituent and the procedures will vary slightly. Procedures (intra-well comparisons): Step 1. Determine the facility-wide false positive rate α that needs to be controlled. Usually α = 0.05. Since the prediction limit is constructed separately for each well and each constituent, α*, the significance level for each of the k comparisons (i.e., monitoring wells & constituents) can be calculated using the Bonferroni inequality: α* = α k Step 2. Determine the resampling plan that will be used. Step 3. Compute the mean x and standard deviation s using the first available n measurements (at least 4) as background, for each well for each constituent. Step 5. Consult the tables for intra-well comparisons in Davis and McNichols (1987) or Gibbons (1994) with n and α* to locate the factor K. Step 6. Calculate the prediction limit as follows for each well for each constituent: x + Ks Step 7. Make decisions: For any downgradient well for any constituent, if its initial sample exceeds the prediction limit and if the verifying resamples confirm this exceedence, then the groundwater is declared "contaminated". Note that different plans have different requirements. The above two varieties of prediction limits not only control the facility-wide false positive rates at specified level but also minimize false negative rates for a certain number of n and k. For a fixed number of k, increasing n will increase the power of the test. For a fixed number of n, decreasing k will increase the power of the test. Example: Step 1. A set of hypothetical data representing a single constituent is presented in Table A.7.8 for demonstration. As in most cases of groundwater quality data, the eight independent background measurements are transformed by taking their natural logarithm. Then the background mean and standard deviation of the transformed data are computed as 1.029 and 0.672, respectively. Version 2.1 October 2004 A.7-14 Air Force Center for Environmental Excellence AFCEE MONITORING AND REMEDIATION OPTIMIZATION SYSTEM SOFTWARE Step 2. The facility-wide false positive rate α of 0.05 is chosen and the One of Two Samples in Bounds plan (exceedence is declared when both the initial sample and the resample exceed the limit) is specified. Since only one constituent is considered, α* = α. Step 3. Assume there are ten monitoring wells (k = 10) for future comparison. Step 4. Consulting the tables in Davis and McNichols (1987) or Gibbons (1994) with n = 8, α* = 0.05 and k = 10 and we find K = 2.03 (e.g., in Gibbons 1994, page 23, Table 1.5). Step 5. Calculate the prediction limit as x + Ks = 1.029 + 2.03 × 0.672 = 2.393 . Step 6. Make decisions: Comparisons are made in logarithmic scale. Since the initial exceedence xe is not confirmed by the verifying resample xr, which is within the prediction limit, the conclusion of contamination cannot be drawn. Version 2.1 October 2004 A.7-15 Air Force Center for Environmental Excellence AFCEE MONITORING AND REMEDIATION OPTIMIZATION SYSTEM SOFTWARE Table A.7.8 Example dataset for constructing prediction limits Original background data (n=8) Ln transformed data (xi ) Mean x Standard deviation s Prediction limit Original exceedencea xe 2.339 0.850 12.606 1.435 0.361 3.071 1.122 5.146 1.638 Ln(xe) 4.949 1.599 1.029 0.672 2.393 2.534 6.466 1.867 0.912 -0.092 2.418 0.883 a Assume there is only one exceedence in the 10 "future" measurements. Verifying resample xr 9.107 Ln(xr) 2.209 METHOD 3 CONFIDENCE LIMITS IN COMPLAINCE MONITORING Confidence limits are statistical estimates of the minimum or maximum population parameter (e.g., mean concentration), or both, that will include the true parameter value with a specified level of confidence (e.g., 99% confidence) based on a sample of n measurements. In groundwater compliance monitoring, concern is with the lower confidence limit being exceeded by a predetermined standard such as the alternate concentration limit (ACL). If the lower confidence limit built from a compliance well exceeds the ACL, it may indicate that the groundwater contamination is significant and corrective action monitoring may be initiated. The confidence limit should only be constructed from data collected during compliance monitoring and should be compared to the ACL computed from the average of background samples (EPA 1992). It should not be compared to the maximum concentration limits (MCLs). The use of tolerance limits in compliance monitoring is questioned by Gibbons (1994) and should be avoided. The method to construct a lower confidence limit for the mean concentration from EPA guidance (EPA 1992) is presented below. Statistical Assumptions: Data values are independent and normally distributed. If original measurements follow lognormal distribution, their logarithms will follow normal distribution and should be used in the computation. Procedures: Step 1. Use pre-determined ACL or estimate ACL from the average of background samples. Step 2. Compute the mean x and standard deviation s from the n observations (at least four) at a compliance well for a constituent. To reduce the false negative rate of the test (i.e., to increase the power of the test), a larger sample size n should be used. Step 3. Calculate its lower 99% confidence limit as: x− Version 2.1 October 2004 t ( n−1,α ) s n A.7-16 Air Force Center for Environmental Excellence AFCEE MONITORING AND REMEDIATION OPTIMIZATION SYSTEM SOFTWARE where t(n-1, α) is the one-sided (1- α)100% point of Student's t distribution with n-1 degrees of freedom. Step 4. Make decisions: If the lower confidence limit of any constituent in any compliance well exceeds the ACL, then there is statistically significant evidence of contamination. Otherwise, the site is within compliance. Gibbons (1994) argues that when the ACL is estimated from the background mean and since the compliance monitoring is conditional on prior demonstration of a significant increase over background, the test is in fact a two-sample t test instead of the above confidence limit method which is a one-sample t test. The dependence due to repeated comparisons of multiple compliance well means to a single pooled background mean should also be considered. This suggests that a Dunnett-type test should be used. Readers can consult Gibbons (1994) and Dunnett (1955) for details. Example: Step 1. Example TOC concentration data (Table A.7.9) in three compliance wells are used to construct lower confidence limits and the result is compared to the ACL that is estimated from background samples as 5.00 mg/L. Step 2. Calculate the mean and standard deviation of the concentrations for each monitoring well. They are shown in Table A.7.9. Step 3. From EPA guidance (EPA 1989) the t value for 5 degrees of freedom and significance level of 1% is 3.365. The lower 99% confidence limit for each monitoring well is computed and presented in Table A.7.9. For example, the lower 99% confidence interval for MW-1 is x − t (6−1, 0.01) s / 6 = 3.33 − 3.365 × 0.70 / 2.45 = 2.36 . Step 4. Make decisions: Although the confidence limits for both MW-1 and MW-2 are lower than the ACL, they represent different conditions. MW-1 is well within compliance since all of its concentrations are below the ACL. Even though all concentrations in MW-2 are above the ACL, no statistically significant evidence is available to conclude its non-compliance. More samples are needed in the future to verify whether this is a true non-compliance. For MW-3, it is statistically significant that the mean TOC level at this well is out of compliance. Version 2.1 October 2004 A.7-17 Air Force Center for Environmental Excellence AFCEE MONITORING AND REMEDIATION OPTIMIZATION SYSTEM SOFTWARE Table A.7.9 Example TOC concentrations for confidence limits Monitoring well MW-1 MW-2 MW-3 x 4.19 2.91 4.26 2.93 2.32 3.34 3.33 6.97 5.20 5.03 6.41 6.79 5.34 5.96 6.97 8.64 8.69 6.54 10.12 8.84 8.30 s 0.70 0.79 1.21 2.36 4.87 6.64a Concentrations (mg/L) x − t ( n−1,α ) s a n ACL 5.00 99% lower confidence limit is below the ACL, indicating non-compliance. METHOD 4 THE SEQUENTIAL T-TEST IN CORRECTIVE ACTION MONITORING One purpose of groundwater corrective action monitoring is to document the effectiveness of the remedial action. More specifically, the groundwater contamination should be cleaned up and this attainment should be proved by appropriate statistical tests. In Methods for Evaluating the Attainment of Cleanup Standards Volume 2: Ground Water (EPA 1992b), two methods for assessing the attainment of cleanup standards were given: a fixed sample size test based on a confidence limit, and a sequential t-test using a likelihood ratio. Both can be used to determine whether: (1) the mean concentration is below the cleanup standard; and (2) a selected percentile of all samples is below the cleanup standard. The sequential t-test will be presented here as it has the following advantages: • The number of samples required to reach a decision need not be known at the beginning of the sampling period. In a fixed sample size test, the number of samples required to reach a decision should be determined in advance based on specified false positive and false negative rates (e.g., α=0.05, β=0.20). This is to ensure for a known or presumed degree of uncertainty in the sample population, that the statistical test with the number of samples that will be collected will provide enough power (1-β) to detect the expected difference between the cleanup goal and the cleanup standard. • On average and under the same levels of false positive and false negative rates, the sequential t-test will require fewer samples and therefore a shorter time to make the attainment decision than the fixed sample size test. This method can be used to test wells individually or in a group and requires at least three years of data. Yearly averages of samples are used in the sequential t-test in order to reduce the effects of any serial correlation in the measurements. The test can only be performed after the termination of treatment (remedial action) and after the groundwater has returned back to steady state (i.e., after the disappearance of the post-effects of treatment). Version 2.1 October 2004 A.7-18 Air Force Center for Environmental Excellence AFCEE MONITORING AND REMEDIATION OPTIMIZATION SYSTEM SOFTWARE Statistical Assumptions: Yearly averages are independent and normally distributed. If yearly averages follow lognormal distribution, their logarithms will follow normal distribution and should be used in the computation. When spatial variations between wells are significant, joint testing of wells should be avoided. Procedures (testing wells individually): Step 1. Determine the false positive rate α and false negative rate β for control. Calculate parameters A and B as: A= β 1−α B= 1− β α Since the facility-wide false negative rate (FWFNR) becomes important in corrective action monitoring, the β of single test should be controlled at a low level. For example, if β = 0.2 and there are 10 wells, the FWFNR could be as high as 0.89. So β = 0.1 or 0.05 can be used when the number of comparisons is large. By contrast, α of a single test can be moderately increased (α = 0.10 or 0.05). Step 2. Determine the cleanup standard Cs and the cleanup goal µ1 (µ1 < Cs). Step 3. Compute the yearly average x k using nk samples (at least four) in year k for the m years of data collected so far as: xk = 1 nk nk ∑x j =1 (k = 1, 2, …, m) jk where x jk is the jth measurement at year k. 2 Step 4. Compute the mean x , and variance s x of the yearly averages as: x= 1 m ∑ xk m k =1 m s x2 = ∑ (x k =1 − x) 2 k m −1 The restrictions of using yearly averages and at least four samples a year can be eased as long as there are no seasonal effects and no significant serial correlation between samples. For example, this test can be used for cases in which there are only two samples per year, or there are only a series of annual or biennial samples. Step 5. Calculate the t and δ for the likelihood ratio as: t= Version 2.1 October 2004 x− Cs + µ1 2 2 sx m A.7-19 Air Force Center for Environmental Excellence AFCEE MONITORING AND REMEDIATION OPTIMIZATION SYSTEM SOFTWARE δ = µ1 − Cs s x2 m Step 6. Calculate the likelihood ratio as: m−2 m t LR = exp δ m m −1 + t 2 Step 7. Compare LR with parameters A and B to make decisions: If LR ≤ A, conclude that the groundwater at this well or site does not attain the cleanup standard. Reconsider treatment effectiveness. If LR > B, conclude that the mean groundwater concentration in this well is less than the cleanup standard. If the yearly averages in this well do not show a statistically significant increasing trend, conclude that the groundwater at this well attains the cleanup standard. Otherwise, conclude that the groundwater at this well does not attain the cleanup standard and reconsider treatment effectiveness or resume sampling. If A < LR ≤ B, collect an additional year’s worth of data and perform the test again. If the groundwater from all wells or group of wells attain the cleanup standard, conclude that groundwater at this site attains the cleanup standard. When testing a group of wells, data for the individual wells at each point in time should be used to produce a summary measure for the group as a whole. This summary measure may be an average, a maximum, or a median. These summary measures will be averaged over the yearly period. Then the same steps for testing wells individually can be followed to make the hypothetical test. Example: Step 1. Hypothetical arsenic measurements presented in Table A.7.10 are used in this example. Here we consider the false positive rate and false negative rate as equally important: α = β = 0.10. Therefore, A = β / (1 - α) = 0.11 and B = (1 - β) / α = 9. Step 2. The cleanup standard Cs is 5 ppb and the cleanup goal µ1 is expected to be 4.5 ppb. Step 3. Compute the yearly average x k for each of the four years. The results are listed in the fourth column of Table A.7.10. For example, the yearly average of 1990 is x = (5.67 + 4.65 + 2.62 + 4.07) / 4 = 4.25 2 Step 4. The mean and variance of yearly averages are x = 4.58, and s x = 0.107, respectively. Table A.7.10 Example arsenic measurements for sequential test Year Version 2.1 October 2004 Quarter Measurements Yearly average Meana Varianceb (ppb) xk x s x2 A.7-20 Air Force Center for Environmental Excellence AFCEE MONITORING AND REMEDIATION OPTIMIZATION SYSTEM SOFTWARE 5.67 1990 1 4.65 1990 2 2.62 1990 3 4.07 1990 4 3.02 1991 1 7.99 1991 2 3.17 1991 3 3.44 1991 4 4.53 1992 1 6.60 1992 2 3.71 1992 3 3.80 1992 4 4.41 1993 1 4.90 1993 2 5.96 1993 3 4.73 1993 4 a Mean of the yearly averages. b Variance of the yearly averages. 4.25 4.41 4.58 0.107 4.66 5.00 Step 5. Calculate t and δ: t= x− δ = Cs + µ 1 5 + 4.5 4.25 − 2 = −1.04 2 = 2 0.107 sx 4 m µ 1 − Cs 2 x s m = 4 .5 − 5 0.107 4 = −3.06 Step 6. The likelihood ratio is m−2 m LR = exp δ t m m − 1+ t 2 4 = exp − 3.06 × 4 − 2 × ( −1.04) × 4 4 − 1 + ( −1.04) 2 = 4.83 Step 7. Since A < LR ≤ B (0.11<4.83 ≤ 9), more data need to be collected to perform the test again. Inn the above test, we use α = β = 0.10, which represents stringent control of error rates, especially in terms of false negative rate. If in the above test α = β = 0.20 or α = 0.1 and β = 0.6, then we will get B = 4. This may lead to a different conclusion since LR is greater than B in these two cases. Therefore, the test result is dependent on the levels of false error rates which we hope to control. METHOD 5 MANN-KENDALL TEST FOR TRENDS IN CONCENTRATION DATA The Mann-Kendall test is a non-parametric statistical procedure that is well suited for analyzing trends in data over time (Gilbert, 1987). The Mann-Kendall test can be viewed as a Version 2.1 October 2004 A.7-21 Air Force Center for Environmental Excellence AFCEE MONITORING AND REMEDIATION OPTIMIZATION SYSTEM SOFTWARE nonparametric test for linear zero slope of the time-ordered concentration data versus time. The Mann-Kendall test does not require any assumptions as to the statistical distribution of the data (e.g. normal, lognormal, etc.) and can be used with data sets which include irregular sampling intervals and missing data. The Mann-Kendall test is designed for analyzing a single groundwater constituent in a single monitoring well; multiple constituents are analyzed separately. The Mann-Kendall statistic (S) measures trends in the data. Positive values indicate an increase in constituent concentrations over time, whereas negative values indicate a decrease. The strength of the trend is proportional to the magnitude of the Mann-Kendall Statistic, that is, large magnitudes indicate a strong trend. A variation of the Mann-Kendall test developed by GSI (Groundwater Services Inc. 2000) is presented in this section for the characterization of both variability and the direction of the trend. This modified Mann-Kendall test evaluates the S statistic, confidence level of the S statistic, and the coefficient of variation (COV) of a time series in order to accurately characterize the concentration trend. This trend is classified in six categories: Decreasing, Probably Decreasing, Stable, No Trend, Probably Increasing, and Increasing. Statistical Assumptions: Observations in the time series must be mutually independent. Since a single constituent in a single monitoring well is tested, the homogeneity of variance is generally true. Procedures (testing wells individually): Step 1. Arrange measurements xi (i = 1, 2, …, n) in time sequential order and determine the sign of the difference between consecutive measurements for all xi as sgn(xj – xk) = 1 if xj - xk > 0 sgn(xj – xk) = 0 if xj - xk = 0 sgn(xj – xk) = -1 if xj - xk < 0 where sgn(xj - xk) is an indicator function that results in the values 1, 0, or –1 according to the sign of xj - xk and j > k. Step 2. Calculate the Mann-Kendall statistic S, which is defined as the sum of the number of positive differences minus the number of negative differences or n −1 S=∑ ∑ sgn(x n k =1 j = k +1 j − xk ) Step 3. Consult a Kendall probability table with the unsigned Mann-Kendall statistic S and the number of samples, n, to find the confidence in the trend (CT). The Kendall probability table can be found in many statistics textbooks (e.g. Hollander, M. and Wolfe, D.A., 1973). Step 4. Calculate coefficient of variation (COV), which measures how individual data points vary about the mean value. The COV is defined as the standard deviation of the data divided by the mean or Version 2.1 October 2004 A.7-22 Air Force Center for Environmental Excellence AFCEE MONITORING AND REMEDIATION OPTIMIZATION SYSTEM SOFTWARE COV = s x A COV near 1.00 indicates that the data form a relatively close group about the mean value. A COV either larger or smaller than 1.00 indicates a greater degree of scatter about the mean. Step 5. Determine the concentration trend by checking the decision matrix presented in Table A.7.11 with Mann-Kendall statistic (S), confidence in trend (CT), and coefficient of variation (COV). For example, if S > 0, and CT > 95%, the concentration trend is Increasing. Table A.7.11 Mann-Kendall analysis decision matrix Mann-Kendall Statistic S>0 Confidence in the Trend > 95% Concentration Trend Increasing S>0 90 - 95% Probably Increasing S>0 < 90% No Trend S≤0 < 90% and COV ≥ 1 No Trend S≤0 < 90% and COV < 1 Stable S<0 90 - 95% Probably Decreasing S<0 95% Decreasing Example: Step 1. Benzene concentrations from a monitoring well are presented in Table A.7.12. The signs of the difference between consecutive measurements are presented in the third to ninth rows of Table A.7.12. For example, the sign of the difference between the first and third measurements is sgn(x3-x1) = sgn(0.034-0.026) = sgn(0.008) = 1. Step 2. The Mann-Kendall statistic S is found to be -8. The calculations are shown in Table A.7.12. Step 3. Consulting a Kendall probability table with S = 8 and n = 8 finds the confidence in the trend to be 0.801 or 80.1%. In fact, the Kendall probability table provides the probability that the unsigned Mann-Kendall statistic S equals or exceeds the specified value of the unsigned S when no trend is present. So the confidence in the trend is calculated as 1 minus this probability. Step 4. The mean and standard deviation of this sample are 0.024 and 0.010, respectively. Therefore, the coefficient of variation is COV = 0.010 / 0.024 = 0.435 Step 5. From Table A.7.11with S ≤ 0, the confidence in the trend < 0, and the COV < 1, the concentration trend is Stable. Two meanings are thus indicated: 1) the slope of the times Version 2.1 October 2004 A.7-23 Air Force Center for Environmental Excellence AFCEE MONITORING AND REMEDIATION OPTIMIZATION SYSTEM SOFTWARE series is not statistically significantly different from zero; and 2) the fluctuation of benzene concentrations within the time period in this monitoring well is quite small. Table A.7.12 Benzene data and computation of the Mann-Kendall statistic Time 2/5/98 3/9/98 4/6/98 5/15/98 6/29/98 7/17/98 9/1/98 10/8/98 Data (mg/L) 0.026 0.028 0.034 0.018 0.027 0.036 0.011 0.008 1 1 1 -1 -1 -1 1 -1 -1 1 1 1 1 1 1 -1 -1 -1 -1 -1 -1 1 0 2 0 0 3 Sign of difference between consecutive measurements No. of + signs No. of - signs -1 -1 -1 -1 -1 -1 -1 2 5 0 0 2 0 6 7 Mann-Kendall statistic S = 10 - 18 = Total 10 18 -8 METHOD 6 METHODS FOR TESTING NORMALITY There are many methods available for checking the normality of data, among which the normal probability plot is particularly useful for spotting irregularities (EPA 1992) within the data and the Shapiro Wilk test is superior to most other tests for testing normality of the data (EPA 2000). In normal probability plots, an observed value is plotted on the x-axis and the proportion of observations less than or equal to each observed value is plotted as the y-coordinate. The scale of the plot is constructed so that, if the data are normally distributed, the plotted points will approximate a straight line. Visually apparent curves or bends indicate that the data do not follow a normal distribution. Evaluation by means of normal a probability plot is only qualitative. As a quantitative test, the Shapiro Wilk test is based on the premise that if data are normally distributed, the ordered values should be highly correlated with corresponding quantiles taken from a normal distribution. The Shapiro Wilk test statistic (W) will be relatively high if the normal probability plot is approximately linear. When the normal probability plot contains significant bends or curves, the statistic will be relatively low. If the Shapiro Wilk test is applied to data from multiple wells (e.g., background wells), the spatial variability (both mean and variance differences among wells) exhibited in data from these wells must be negligible. Otherwise, one should use the multiple group version of the Shapiro Wilk test (ASTM 1998), which is suitable for the joint assessment of normality in multiple wells. Details about the multiple-group Shapiro Wilk test are available in Wilk and Shapiro (1968) and Gibbons (1994). The Shapiro Wilk test can be used for sample sizes up to 50. When the sample size is larger than 50, a slight modification of the procedure called the Shapiro-Francia test can be used instead. The Probability Plot Correlation Coefficient (Filliben's statistic) test is roughly equivalent to these two tests. A brief evaluation is provided in EPA guidance (EPA 2000) as to the scope of use and performance of each of these alternatives. Since these test statistics (i.e., W statistic and Filliben's statistic) are difficult to compute manually, this section only presents the construction Version 2.1 October 2004 A.7-24 Air Force Center for Environmental Excellence AFCEE MONITORING AND REMEDIATION OPTIMIZATION SYSTEM SOFTWARE of a normal probability plot. Readers can refer to EPA guidance (EPA 1992, EPA 2000) for detailed procedures for these quantitative tests. Procedures (Normal Probability Plot): Step 1. Arrange data in order from smallest to largest and denote them as xi, i = 1, 2, …, n. The data can be measurements from a single well or from a group of wells. Step 2. The cumulative probability corresponding to each measurement is computed as φi = i , where i is the order of the ith smallest measurement. n +1 Step 3. Compute the normal quantiles corresponding to the cumulative probabilities obtained from Step 2 as y i = Φ −1 (φ i ) , where Φ -1 denotes the inverse of the cumulative normal distribution. Step 4. Plot the normal quantiles verses the concentration of each measurement, i.e., yi verses xi. If these points approximate a straight line, it is evidence that the data are normally distributed. Significant bends or curves in the plot indicate departures from a normal distribution. Example: Step 1. Hypothetical arsenic data from four wells are presented in Table A.7.13. These measurements are ordered from smallest to largest in the fourth column of Table A.7.13. The order of each measurement is listed in the fifth column of Table A.7.13. Step 2. The cumulative probability corresponding to each measurement is given in the sixth column of Table A.7.13. For example for the third smallest measurement φ3 = 3 3 = = 0.18 . n + 1 16 + 1 Step 3. The normal quantile corresponding to each of the cumulative probabilities is listed in the last column of Table A.7.13. In this example, they are calculated with the function NORMINV() in Microsoft Excel. Step 4. The normal probability plot is presented in Figure A.7.2. The points do not approximate a straight line very well but bends in the plot are not significant, indicating the data are approximately normally distributed. Version 2.1 October 2004 A.7-25 Air Force Center for Environmental Excellence AFCEE MONITORING AND REMEDIATION OPTIMIZATION SYSTEM SOFTWARE Table A.7.13 Example aresenic data for normal porbability plot Well Quarter Original data (ppb) Ordered data (xi ) Order (i) Cumulative probability (φi ) Normal quantile (yi ) 1 2 3 4 1 2 3 4 1 2 3 4 1 2 3 4 13.96 12.77 9.66 8.46 8.77 3.87 5.15 10.11 8.56 8.16 8.97 8.84 11.05 10.82 8.68 7.00 3.87 5.15 7.00 8.16 8.46 8.56 8.68 8.77 8.84 8.97 9.66 10.11 10.82 11.05 12.77 13.96 1 2 3 4 5 6 7 8 9 10 11 12 13 14 15 16 0.06 0.12 0.18 0.24 0.29 0.35 0.41 0.47 0.53 0.59 0.65 0.71 0.76 0.82 0.88 0.94 -1.56 -1.19 -0.93 -0.72 -0.54 -0.38 -0.22 -0.07 0.07 0.22 0.38 0.54 0.72 0.93 1.19 1.56 MW-1 MW-2 MW-3 MW-4 Normal Probbility Plot 2 2 Normal quantiles 1 1 0 -1 -1 -2 -2 5.00 7.00 9.00 11.00 13.00 15.00 Benzene (mg/L) Figure A.7.2 Example normal probability plot Version 2.1 October 2004 A.7-26 Air Force Center for Environmental Excellence AFCEE MONITORING AND REMEDIATION OPTIMIZATION SYSTEM SOFTWARE METHOD 7 METHODS FOR TESTING HOMOGENEITY OF VARIANCE The assumption that variances of different groups of data are approximately equal is required for many statistical methods that make references from different groups of data, such as the analysis of variance (ANOVA, parametric or non-parametric) presented in EPA guidance (EPA 1989, EPA 1992) for detection monitoring. Violation of this assumption when using these kinds of statistical methods may result in excessive false positive rate or false negative rate (Davis and McNichols 1994). Natural spatial variability inherent in a site is the reason for unequal variances in different spatial locations. Bartlett's test and Levene's test (EPA 1992, EPA 2000) are most widely used for checking the assumption of equal variances. Levene's test is less sensitive to departures from normality than Bartlett's test and has power superior to Bartlett's test for non-normal data. In addition, Levene's test has power nearly as great as Bartlett's test for normally distributed data. Therefore, we introduce Levene's test in this section. An exploratory method worth mentioning is the Box Plots, through which one can visualize the spread or dispersion within a dataset and compare across groups to see if the assumption of equal variances is reasonable. Details for Box Plots can be found in EPA guidance (EPA 1992). Procedures (Levene's test): Step 1. For each of the k groups, calculate the group mean as xi = 1 ni ni ∑x j =1 , where i = 1, 2, …, k; nj = number of data in group i. ij Step 2. Compute the absolute residuals as z ij = xij − xi and calculate the group means of these absolute residuals as zi = 1 ni ni ∑z j =1 ij Also calculate the overall mean of he absolute residuals as z= 1 N k ni ∑∑z i =1 j =1 ij , where N = n1 + n2 +…+ nk. Step 3. Compute the following sums of squares for the absolute residuals: k ni 2 SS TOTAL = ∑∑ z ij − Nz 2 , SS GROUPS = ∑ ni z i2 − Nz 2 , and SS ERROR = SSTOTAL − SS GROUPS i =1 j =1 k i =1 Step 4. Compute the F-statistic as f = Version 2.1 October 2004 SS GROUPS /( k − 1) SS ERROR /( N − k ) A.7-27 Air Force Center for Environmental Excellence AFCEE MONITORING AND REMEDIATION OPTIMIZATION SYSTEM SOFTWARE Step 5. Consult an F-distribution table with the desired significance level α, (k-1) numerator degrees of freedom, and (N-k) denominator degrees of freedom to find the critical F value. If f is greater than F, reject the assumption of equal variances. Example: Step 1. The arsenic data presented in Table A.7.13 are used again in Table A.7.14 (second column) to illustrate the Levene's test. Assuming MW-1 and MW-2 are upgradient wells and MW-3 and MW-4 are downgradient wells, we want to test the assumption of equal variances before using a parametric ANOVA test. Each group mean is calculated and presented in the fourth column of Table A.7.14. For example, x1 = 1 n1 1 x1 j = (13.96 + 12.77 + 9.66 + 8.46) = 11.21 ∑ n1 j =1 4 Step 2. The absolute residuals are listed in the fifth column of Table A.7.14. Group means of these absolute residuals are 2.15, 2.46, 0.27, and 1.55 and the overall mean is 1.61 (presented in the sixth and seventh columns of Table A.7.14, respectively). For example, z 23 = x 23 − x 2 = 5.15 − 6.97 = − 1.82 = 1.82 z= 1 N k ni ∑∑z i =1 j =1 ij = 1 ∑ (2.75 + 1.56 + ... + 0.70 + 2.39) = 1.61 16 Step 3. The sums of squares for the absolute residuals are ni k ( ) SS TOTAL = ∑ ∑ z ij − Nz 2 = ∑ 2.75 2 + 1.56 2 + ... + 2.39 2 − 16 × 1.612 = 15.95 2 i =1 j =1 k ( ) SS GROUPS = ∑ n i z i2 − Nz 2 = ∑ 4 × 2.15 2 + 4 × 2.46 2 + 4 × 0.27 2 + 4 × 1.55 2 − 16 × 1.612 = 11.28 i =1 SS ERROR = SSTOTAL − SSGROUPS = 15.95 − 11.28 = 4.67 Step 4. The F-statistic, f, is f = SS GROUPS /( k − 1) 11.28 /( 4 − 1) 3.76 = = = 9.65 SS ERROR /( N − k ) 4.67 /(16 − 4) 0.39 Step 5. The critical value F for F-distribution with α = 0.01, 3 numerator degrees of freedom, and 12 denominator degrees of freedom is 5.95. Therefore, f = 9.65 > F = 5.95, the assumption of equal variances is rejected. Version 2.1 October 2004 A.7-28 Air Force Center for Environmental Excellence AFCEE MONITORING AND REMEDIATION OPTIMIZATION SYSTEM SOFTWARE Table A.7.14 Example calculation for Levene's test Well MW-1 MW-2 MW-3 MW-4 Original data (xij) 13.96 12.77 9.66 8.46 8.77 3.87 5.15 10.11 8.56 8.16 8.97 8.84 11.05 10.82 8.68 7.00 Group mean ( xi ) 11.21 6.97 8.63 9.39 Absolute residuals (zij) Residual group Overall residual mean ( z i ) mean ( z ) 2.75 1.56 1.55 2.75 1.79 3.11 1.82 3.14 0.07 0.47 0.34 0.21 1.66 1.43 0.70 2.39 2.15 2.46 1.61 0.27 1.55 If we are confident that the variability estimated from the above set of data is true, the parametric ANOVA test for detecting differences among the group means is not advisable. Approaches that account for unequal variances, such as data transformation to stabilize variances, intra-well Shewart-CUSUM control charts, or intrawell prediction limits, should be used instead. Conversely, the conclusion of unequal variances might not be true if we consider the effect of small sample size (4 observations per well), which is far from adequate to characterize the real spatial variability. METHOD 8 METHODS FOR TESTING SERIAL CORRELATION Most statistical methods are based on the assumption of independence between observations. This assumption is violated if serial correlation, or autocorrelation, exists in observations separated in time (a time series). This is common for groundwater quality data that are measured in high frequency such as weekly or monthly sampling. To check if a time series dataset is significantly correlated, the Durbin-Watson test recommended in EPA guidance (EPA 1992b) can be used. The Durbin-Watson test is based on the first order (or lag 1) autocorrelation model (Box et al. 1994), or AR(1) model, which states that the residual of an observation is dependent on the residual of its previous observation by a factor of ρ (1 > ρ > -1), or correlation coefficient. The residuals are obtained from detrended and deseasonalized observations, if any. The AR(1) model can be expressed as et = ρet −1 + ε t , where et (et-1) is the residual, or error term, at time t (t-1), and εt is a random shock which is independent and normally distributed at time t. Version 2.1 October 2004 A.7-29 Air Force Center for Environmental Excellence AFCEE MONITORING AND REMEDIATION OPTIMIZATION SYSTEM SOFTWARE If there is no serial correlation between observations, the expected value of ρ will be close to zero. However, the estimated value of ρ is unlikely to be zero even if the actual serial correlation is zero. The Durbin-Watson statistic can be used to test whether the observed value of ρ, denoted as φ, is significantly different from zero. The procedures below introduce how to calculate φ, the observed value of ρ, followed by the Durbin-Watson test. Procedures: Step 1. List the observations measured consecutively at a constant interval ordered by time, denoting them as xi, i=1,2,…,N, where N is the number of total observations. Estimate the trend and/or seasonality from this set of data. The trend is commonly estimated by the least square method and expressed as a linear trend: yˆ i = b0 + b1t i , where b0 and b1 are the intercept and slope of the regression line, respectively; ŷ is the estimate of the observation at time ti. In the case of no obvious trend in the time series, the model is yˆ = b0 , where b0 is the overall mean of the observations. Seasonal variability is generally indicated by a regular pattern that is repeated every year. The seasonal mean or median is usually used to characterize the average concentration level of a season. This average level is simply the mean or median of the detrended observations in a certain season, denoted as µj, j = 1, 2,…, k, where j represents a season and k is the total number of seasons in a year. Step 2. Calculate the residuals, ei, by subtracting the observations from their trend and/or respective seasonal means or medians as ei = xi − yˆ i − µ j , where the observation at time i must be in the season j. Step 3. Estimate φ, the observed serial correlation as N φ= ∑e e i=2 N i i −1 ∑e i =1 2 i Step 4. Calculate D, the Durbin-Watson statistic as N D= ∑ (e i =2 i − ei −1 ) 2 N ∑e i =1 2 i Step 5. Consult the Durbin-Watson table (Neter et al. 1996) for test bounds with desired significance level (α, usually 0.05) and the number of observations (n). Use the first column (p-1=1) in this table to find du, the upper critical value for the test. If D < du, conclude that there is a significant serial correlation and keep φ, the observed serial correlation, for future use. If D > du, conclude that there is no serial correlation, or a serial correlation that is negligible. Version 2.1 October 2004 A.7-30 Air Force Center for Environmental Excellence AFCEE MONITORING AND REMEDIATION OPTIMIZATION SYSTEM SOFTWARE Example: Step 1. A hypothetical dataset containing quarterly measurements of manganese concentration from a monitoring well during a four years period is presented in Table A.7.15. The time series plot of this dataset is given in Figure A.7.3, from which no obvious trend or seasonal effects can be inferred. Therefore, we calculate the sample mean of this time series, which is 4.97, as the estimate of the overall mean from which the residuals can be obtained. Step 2. Calculate residuals by subtracting the overall mean (4.97) from each observation. They are listed in the third column of Table A.7.15. For example, e2 = 5.51-4.97 = 0.54. Step 3. The observed serial correlation, φ, is N φ= ∑e e i=2 N i i −1 ∑e = 2 i ∑ ((−0.151) + 0.318 + ... + (−1.035)) = 2.03 = 0.13 ∑ (0.076 + 0.297 + ... + 0.986) 15.17 i =1 Step 4. The Durbin-Watson statistic, D, is N D= ∑ (e i =2 i − ei −1 ) 2 N ∑e i =1 2 = ∑ (0.674 + 0.002 + ... + 4.142) = 1.66 15.17 i Step 5. Consulting the Durbin-Watson table (Neter et al. 1996, page 1349) with α = 0.05 and n = 16 in the column titled p-1=1, we find du = 1.37. Since D = 1.66 > du = 1.37, conclude that there is no serial correlation in this set of manganese measurements. Therefore, in future use of this time series data, independence between data can be assumed true. The serial correlation between successive observations, computed from the above procedures, depends on the time interval between collecting groundwater samples. For the AR(1) process, the serial correlation between successive observations decays exponentially with the increase of separation interval: ρkt = ρtk, where ρt is the serial correlation for time interval t and ρkt is the serial correlation for the time interval that is k times as long as time interval t. The inverse of this relation also holds. As the time interval becomes longer (e.g., from monthly to semiannual sampling), the serial correlation between successive observations approximates zero. This is the theoretical basis for achieving serially independent observations in a sampling design. When data are strongly correlated, methods like collapsing and averaging data over a longer interval (Ward et al., 1988 and 1990) can be applied to remove serial correlation. Version 2.1 October 2004 A.7-31 Air Force Center for Environmental Excellence AFCEE MONITORING AND REMEDIATION OPTIMIZATION SYSTEM SOFTWARE Table A.7.15 Example calculation for test of serial correlation Quarter Data (mg/L) Residuals (ei ) 4.69 5.51 5.55 5.09 6.08 4.59 3.73 3.10 4.93 5.28 3.23 5.94 6.22 5.52 6.01 3.97 4.97 -0.28 0.54 0.58 0.13 1.11 -0.37 -1.24 -1.87 -0.04 0.32 -1.74 0.97 1.26 0.56 1.04 -0.99 1 2 3 4 5 6 7 8 9 10 11 12 13 14 15 16 Mean = ei ei-1 -0.151 0.318 0.074 0.141 -0.414 0.460 2.314 0.068 -0.012 -0.555 -1.692 1.224 0.704 0.583 -1.035 2.03 0.13 Σ= φ= ei 2 (ei -ei-1)2 0.076 0.297 0.342 0.016 1.241 0.138 1.535 3.486 0.001 0.102 3.024 0.946 1.584 0.313 1.086 0.986 15.17 D= 0.674 0.002 0.210 0.974 2.206 0.753 0.394 3.352 0.126 4.236 7.354 0.082 0.488 0.233 4.142 25.23 1.66 7.00 Concentration (mg/L) 6.00 5.00 4.00 3.00 2.00 1.00 0.00 0 1 2 3 4 5 6 7 8 9 10 11 12 13 14 15 16 17 Time (No. Quarter) Figure A.7.3 Time series plot of quarterly manganese concentrations Version 2.1 October 2004 A.7-32 Air Force Center for Environmental Excellence AFCEE MONITORING AND REMEDIATION OPTIMIZATION SYSTEM SOFTWARE METHOD 9 METHODS FOR DEALING WITH NONDETECTS If data generated from chemical analysis contains nondetects, i.e., measurements that are below the detection limit (DL) of the analytical procedure, the traditional statistical methods based on all quantified values do not work. Special procedures must be used to handle these nondetects. Nondetects are usually reported with the appropriate limit of detection and refer to concentrations that lie somewhere between zero and the detection limit. Data that include both detect and non-detect results are called censored data in statistical literature. General guidelines (EPA 1992, ASTM 1998) that usually prove adequate in handling data with nondetects are introduced below. If less than 15% percent of all samples are nondetects, replace nondetects by half their detection limit (or DL, or a fraction of DL, or zero) and proceed with a parametric analysis, such as prediction limits or confidence limits. It is shown that the results of parametric tests will not be substantially affected by this simple substitution (EPA 1992). If the percent of nondetects is between 15 and 50, use Cohen's adjustment (EPA 1989) or Aitchison's adjustment (EPA 1992) to the sample mean and variance, followed by a parametric analysis. Aitchison's method imputes nondetects as zero concentration. Cohen's method assumes nondetects are below detection limit but not necessarily zero. Both methods require that data without nondetects be normally distributed. A useful approach to selecting between the two methods is described in the EPA guidance (EPA 2000). Davis et al. (1994) point out that Aitchison's adjustment is not appropriate for log-transformed data and that there is a substantial amount of spatial variation involved. This section only introduces Cohen's adjustment. If the percent of nondetects is between 50 and 90, use nonparametric versions of statistical interval estimates. For detection monitoring, the nonparametric prediction limits developed by Davis et al. (1992) can be used. The nonparametric prediction limit is simply the largest or next to largest concentration found in the background, or upgradient, measurements. Complete tabulations of confidence levels for these nonparametric prediction limits for different combinations of background sample size, number of future comparisons, and resample plans are available in Gibbons (1994). For compliance monitoring or corrective action monitoring, the nonparametric confidence interval presented in the EPA document (EPA 1989) or test of proportion from other sources (EPA 1992b, EPA 2000) can be used. This section introduces the nonparametric prediction limit. If the percent of nondetects is greater than 90, a situation that is not uncommon in detection monitoring, use either the Poisson prediction limits (ASTM 1998) or the nonparametric prediction limits discussed above. Detailed discussion of Poisson prediction limits is provided in Gibbons (1994). Loftis et al. (1999) doubted the validity of using the Poisson model for modeling concentration data because the variance of distribution varies with changing units of measurement. Therefore, we suggest that the Poisson prediction limits should be used only for counts of analytical hits, usually for VOCs. In the case of 100% nondetects, i.e., detection frequency equals zero, one can also use the laboratory-specific quantitation limit or limits required by the applicable regulatory agency (ASTM 1998) as the nonparametric prediction limits. In this case, one should question whether the constituent is a useful indicator of contamination and if not, statistical testing of the constituent should not be performed. Statistical independence of data is still the underlying assumption of all of the above-suggested procedures. Note that the above-suggested percentages are not hard and fast rules, and should be based on judgement (EPA 2000). Version 2.1 October 2004 A.7-33 Air Force Center for Environmental Excellence AFCEE MONITORING AND REMEDIATION OPTIMIZATION SYSTEM SOFTWARE Procedures (Cohen's Adjustment): Step 1. Let n be the total number of measurements and denote them as xi, i = 1, 2, …, n, among which m measurements are above detection limit (DL). Thus, there are (n-m) measurements that are below the DL (nondetects). Step 2. Compute the sample mean from the data above the DL as: xd = 1 m ∑ xi m i =1 Step 3. Compute the sample variance from the data above the DL as: m sd = 2 ∑ (x i =1 i − xd ) 2 m −1 Step 4. Compute two parameters h and γ as: sd (n − m) h= and γ = n ( x d − DL) 2 2 Step 5. Consult Cohen's table (e.g., EPA 2000, Table A-10 of Appendix A) with h and γ to determine the value of the parameter λ̂ . If the exact value of h and γ do not appear in the table, use double linear interpolation to estimate λ̂ . Step 6. Estimate the corrected sample mean, x , and sample variance, s2, which account for the data below the DL, as 2 x = x d − λˆ ( x d − DL) and s 2 = s d + λˆ( x d − DL) 2 An example of this adjustment is available in EPA guidance (EPA 2000), pages 4-44. Procedures (Nonparametric Prediction Limit): Step 1. Let n be the total number of background measurements and denote the number of monitoring wells for future comparison as r. Step 2. Determine the resample plan (e.g., One of Two Samples in Bounds plan or One of Three Samples in Bounds plan) and use the largest or next to largest background measurement as the nonparametric prediction limit. Step 3. Use n, r, and choices from step 2 in the tables from Davis and McNichols (1994) or Gibbons (1994) to determine the Per-Constituent significance level (α) or Per-Constituent confidence level (1-α), respectively. Step 4. Inverse problems can be solved by fixing the desired Per-Constituent significance level (α) and using the tables to inversely determine the number of background measurements (n), or the number of wells for future comparison (r). If N constituents are involved, the Per-Constituent significance level (α) should be calculated as Version 2.1 October 2004 A.7-34 Air Force Center for Environmental Excellence AFCEE MONITORING AND REMEDIATION OPTIMIZATION SYSTEM SOFTWARE α= a* , where α* is the desired facility-wide false positive rate. N Step 5. The use of this nonparametric prediction limit for future comparisons is the same as in the parametric prediction limit described in METHOD 2. Procedures (Poisson Prediction Limit): Step 1. Let y be the total number of detections (analytical hits) from multiple-constituent scans (e.g., for VOCs) of n background samples. Denote the number of future measurements (i.e., number of monitoring wells or number of measurements in one well) as k. Step 2. Determine the resample plan and the facility-wide false positive rate (α*). Calculate the significance level (α) associated with each individual test as the minimum of 0.01 or one of the following: α = (1 − (1 − α *)1 / k )1 / 2 for One of Two Samples in Bounds plan; α = (1 − (1 − α *)1 / k )1 / 3 for One of Three Samples in Bounds plan; α = 1 − (1 − α *)1 / k 1 / 2 for First or Next Two Samples in Bounds plan. Step 3. Compute the Poisson prediction limit as: PoissonPL = y z2 z z2 (detections per scan) + + y (1 + n) + n 2n n 4 where z is the (1-α) 100 upper percentage point of the standard normal distribution. Step 4. If the average number of detections per scans of the k future samples is greater than this prediction limit, it may indicate exceedence but must be verified by resamples. The verification procedure is same as in the parametric prediction limit described in METHOD 2. Example (Nonparametric Prediction Limit): Step 1. Consider developing a nonparametric prediction limit for a facility with r = 15 monitoring wells. In n = 10 background measurements of benzene concentrations, two were above the detection limit (percentage of nondetects is greater than 50). These detects are, 5 ppb, and 8 ppb. Nondetects are reported as "< 2 ppb". Step 2. Plan I: use One of Two Samples in Bounds plan. Plan II: use One of Three Samples in Bounds plan. Use the largest background measurement, 8 ppb, as the nonparametric prediction limit for both plans. Step 3. For Plan I, in Table 2a on page 164 of Davis and McNichols (1994), for n = 10 and r = 15, the Per-Constituent significance level is 0.159, which is much higher than 5%. For Plan II, in Table 3a on page 165 of Davis and McNichols (1994), for n = 10 and r = 16, the PerConstituent significance level is 0.0428, which is within 5%. Therefore Plan II is an eligible plan if the facility-wide false positive rate (α*) is to be controlled at 5%, and only one constituent, benzene, is considered. Version 2.1 October 2004 A.7-35 Air Force Center for Environmental Excellence AFCEE MONITORING AND REMEDIATION OPTIMIZATION SYSTEM SOFTWARE Step 4. If Plan I must be used to control the Per-Constituent significance level (α) at 5%, then in Table 2a on page 164 of Davis and McNichols (1994), for r = 15, we find α = 0.388 if n = 25. This means 25 background measurements are needed to meet the 5% requirement. Example (Poisson Prediction Limit): Step 1. Consider developing a Poisson prediction limit for a facility with k = 15 monitoring wells. In n = 12 background samples for which a 32-constituent VOC scan was conducted, there were y = 6 detections. The percentage of nondetects in this case is far less than 10% (6/12/32 = 0.016 = 1.6%). Step 2. Use the One of Two Samples in Bounds plan and set the facility-wide false positive rate α* = 0.05. The α for this resample plan is: α = (1 − (1 − α *)1 / k )1 / 2 = (1 − (1 − 0.95) 1 / 15 )1 / 2 = 0.058 Since the minimum of 0.01 and 0.058 is 0.01, the significance level associated with each individual test is therefore α = 0.01. The z value associated with α = 0.01 is 2.236. Step 3. The Poisson prediction limit is: PoissonPL = 6 2.236 2 2.236 2.236 2 + + = 2.452 (detections per scan) 6(1 + 12) + 12 2 × 12 12 4 This Poisson detection limit can also be translated into a total of 2.452 × 15 ≈ 36 detections out of scans of 15 future samples. For comparison, the background samples have only 6/12 = 0.5 detections per scan. METHOD 10 METHODS FOR DEALING WITH SEASONAL EFFECTS AND SERIAL CORRELATION When the data exhibit regular seasonal patterns or significant serial correlation, the assumption of independence is violated and adjustments must be taken to remove these effects. As is described in METHOD 8, adjusting for seasonal effects is usually achieved by removing the seasonal means from the data. While the methods of calculating and testing the significance of the serial correlation coefficient are given in METHOD 8, procedures for adjusting serial correlation are not provided. In this section, approaches from EPA guidance (1992b) for dealing with seasonal effects and serial correlation are presented. These adjustments aid in determining the standard error of the mean and degrees of freedom associated with it when seasonal effects and/or serial correlation exist. Standard error of the mean is crucial in constructing confidence limits that are widely used in compliance monitoring and corrective action monitoring. Recall in METHOD 3, the lower confidence limit is calculated as x− t ( n −1,α ) s n , where associated with s n s n is the standard error of a sample mean and the degrees of freedom is n-1. Now we denote the standard error of the mean as s x and thus a lower confidence limit is generally in the form of x − t ( Df ,α ) s x and an upper confidence limit in the form of x + t ( Df ,α ) s x , Version 2.1 October 2004 A.7-36 Air Force Center for Environmental Excellence AFCEE MONITORING AND REMEDIATION OPTIMIZATION SYSTEM SOFTWARE where Df is the degrees of freedom associated with s x . The following procedures provide for calculating s x in the presence of seasonal effects or serial correlation or both, assuming that no obvious trend exists in the data. In the presence of trends in the data, detrend the data first the method described in METHOD 8 before using the following procedures. Procedures (Seasonal Effects Only): Step 1. Consider a time series of N observations that exhibit m seasonal patterns. The jth (j = 1, 2, …, m) seasonal average is: xj = 1 nj nj ∑x k =1 jk , where nj is the number of non-missing observations for season j. Step 2. Calculate the sample residuals after correcting for the seasonal means as: e jk = x jk − x j Step 3. Compute the mean square error as: m se = 2 nj ∑∑ e j =1 k =1 2 jk N −m Step 4. The standard error of the mean is 2 sx = se and the Df associated with it is N-m. N Procedures (Serial Correlation Only): Step 1. Consider a time series of N observations that exhibit serial correlation but no seasonal effects. The observed serial correlation coefficient is φ, which has been proved as statistically significant using the Durbin-Watson test presented in METHOD 8. Step 2. Assume the variance estimated from this time series is s2. The standard error of the mean when N is large is approximately sx = s 2 (1 + φ ) and the Df associated with it is approximately N − 1 , rounded to the N (1 − φ ) 3 nearest smaller integer. Procedures (Seasonal Effects and Serial Correlation): Step 1. Consider a time series of N observations that exhibit m seasonal patterns and serial 2 correlation. The mean square error calculated from this set of data is s e , which is estimated by using Procedures (Seasonal Effects Only). The observed serial correlation Version 2.1 October 2004 A.7-37 Air Force Center for Environmental Excellence AFCEE MONITORING AND REMEDIATION OPTIMIZATION SYSTEM SOFTWARE coefficient is φ, which has been proven to be statistically significant using the DurbinWatson test presented in METHOD 8. Step 2. The standard error of the mean when N is large is approximately s e (1 + φ ) and the Df associated with it is approximately N − m , rounded to the N (1 − φ ) 3 2 sx = nearest smaller integer. Example: Step 1. A hypothetical dataset containing quarterly measurements of a contaminant from a monitoring well during a four year period (N = 16) is presented in Table A.7.16. The time series plot of this dataset is given in Figure A.7.4, which shows clear seasonal patterns (m = 4). To determine whether this well is in compliance, a lower confidence limit on the sample mean needs to be constructed to compare to the background standard, which is 6.5 mg/L. Step 2. The four seasonal means are 6.52, 9.85, and 8.08, and 4.87 mg/L, respectively. For example, the first seasonal mean x1 = (6.74 + 7.64 + 5.30 + 6.40) / 4 = 6.52. The deseasonalized residuals, ei, are listed in the fourth column of Table A.7.16. Step 3. Based on the deseasonalized residuals, the observed serial correlation coefficient is N φ= ∑e e i i −1 i =2 N ∑e = 2 4.084 = 0.33 , and the Durbin-Watson statistic is 12.261 i i =1 N D= ∑ (e i =2 i − ei −1 ) 2 N ∑e i =1 2 = 16.027 = 1.31 . 12.261 i Step 4. Consulting the Durbin-Watson table given (Neter et al. 1996, page 1349) with α = 0.05 and n = 16 in the column titled p-1=1, we find du = 1.37. Since D = 1.31 < du = 1.37, there is significant serial correlation in this time series and procedures adjusting for seasonal effects and serial correlation must be used as shown in the following steps. Step 5. The mean square error of the deseasonalized residuals is nj m se = 2 ∑∑ e j =1 k =1 2 jk N −m = 12.261 = 1.022 . Thus the standard error of the mean is 16 − 4 s e (1 + φ ) 1.022 (1 + 0.33) = = 0.357 and the Df associated with it is 16 (1 − 0.33) N (1 − φ ) 2 sx = Version 2.1 October 2004 A.7-38 Air Force Center for Environmental Excellence AFCEE MONITORING AND REMEDIATION OPTIMIZATION SYSTEM SOFTWARE N − m 16 − 4 = = 4. 3 3 Step 6. The lower confidence limit on the sample mean is therefore x − t ( Df ,α ) s x = 7.33 − t ( 4, 0.05) × 0.357 = 7.33 − 2.78 × 0.357 = 6.34 mg/L. Since this lower confidence limit contains the background standard, which is 6.5 mg/L, it can be concluded that the contaminant concentration at this well is within compliance. Version 2.1 October 2004 A.7-39 Air Force Center for Environmental Excellence AFCEE MONITORING AND REMEDIATION OPTIMIZATION SYSTEM SOFTWARE Table A.7.16 Example data for adjusting seasonal effects and serial correlation Quarter Seasonal average Deseasonalized Residuals (ei ) ei 2 1st = 6.52 2nd = 9.85 3rd = 8.08 4th = 4.87 0.22 -0.74 -0.82 1.13 1.12 0.94 1.86 -0.34 -1.22 -0.72 0.14 -0.26 -0.12 0.52 -1.17 -0.53 0.048 0.543 0.678 1.268 1.247 0.885 3.455 0.114 1.484 0.519 0.019 0.069 0.014 0.267 1.373 0.278 12.261 0.33 Data (mg/L) 1 6.74 2 9.11 3 7.25 4 5.99 5 7.64 6 10.79 7 9.94 8 4.53 9 5.30 10 9.13 11 8.21 12 4.60 13 6.40 14 10.36 15 6.91 16 4.34 Overall mean = 7.33 Σ= φ= ei ei-1 (ei -ei-1)2 -0.162 0.607 -0.927 1.257 1.050 1.749 -0.627 0.411 0.878 -0.098 -0.036 0.031 -0.061 -0.606 0.618 4.084 D= 0.916 0.007 3.801 0.000 0.031 0.843 4.823 0.776 0.248 0.734 0.158 0.021 0.403 2.851 0.415 16.027 1.31 12.00 Concentration (mg/L) 10.00 8.00 6.00 4.00 2.00 0.00 0 1 2 3 4 5 6 7 8 9 10 11 12 13 14 15 16 17 Time (No. Quarter) Figure A.7.4 Time series plot of quarterly contaminant concentrations Version 2.1 October 2004 A.7-40 Air Force Center for Environmental Excellence AFCEE MONITORING AND REMEDIATION OPTIMIZATION SYSTEM SOFTWARE The Strategy for Data Evaluation The use of an appropriate data evaluation strategy in a long-term monitoring program will result in reduction or better control of false positive and false negative rates. In this study, the strategies for assessing data before testing are presented and appropriate statistical methods for testing the data are recommended. A summary of these methods and strategies are presented in tables A.7.17 through A.7.20. The general data evaluation procedures are described below. This is a general outline and is not intended to be a guidance-style flowchart. Table A.7.17 Appropriate statistical methods used in long-term monitoring programs Method Scope of Use Objective Method Description Detection Method 1: monitoring Combined Shewart-CUSUM control chart To determine if groundwater is contaminated and if compliance monitoring is required. The control chart method is sensitive to both immediate and gradual releases. As an intra-well comparison method, problems associated spatial variations can be completely avoided. Detection Method 2: monitoring Inter-well and intra-well prediction limits. To determine if groundwater is contaminated and if compliance monitoring is required. The method is capable of controlling the facility-wide false positive rate (FWFPR) and minimizing the false positive and false negative rates associated with a single comparison. Compliance To find if there is Method 3: Confidence limits monitoring statistically significant evidence of contamination and if corrective action monitoring is required. The method is easy to perform. The requirement that the confidence limit be compared to the ACL from background samples instead of the MCL is protective of human health or the environment (EPA 1992a). Method 4: Sequential test method Corrective action monitoring To test if groundwater The method requires fewer samples and a has attained the cleanup corresponding shorter time to make the standards. attainment decision than the fixed sample size test, under the same levels of false positive and false negative rates. Method 5: Mann-Kendall test for trends Where needed To determine whether the trend of concentration data vs. time is increasing, decreasing, or stable, etc. This method does not require a test for normality of data. Test results of the GSI style Mann-Kendall test are classified more reasonably. Procedures: 1. Distinguish the type of monitoring program in which the statistical tests will be used and set up the correct null hypothesis. Refer to tables A.7.4, A.7.5, and A.7.6. 2. Estimate the percentage of nondetects in the observations and choose the correct "category" of statistical approach based on the percentage of nondetects. Refer to Table A.7.19. This may need to be done on a well-by-well basis. Version 2.1 October 2004 A.7-41 Air Force Center for Environmental Excellence AFCEE MONITORING AND REMEDIATION OPTIMIZATION SYSTEM SOFTWARE 3. Adjust for seasonal patterns and serial correlation, if needed, before testing for the distributional assumption. Refer to tables A.7.20 and A.7.18. This may need to be done on a well-by-well basis. 4. Evaluate the possibility of using intra-well analysis to avoid the influence of spatial variability based on the sufficiency of data from the historical database. Tests for homogeneity of variance (refer to Table A.7.18, Method 17) can be performed to determine the significance of spatial variation. 5. Choose the appropriate statistical approaches from the correct "category" based on considerations from the first four steps. Refer to Table A.7.17. This may need to be done on a well-by-well basis. Note: If any of the above conditions change during the process of long-term monitoring, reevaluate the above steps. For example, if the monitoring requirement in the site changes from compliance monitoring to corrective action monitoring, all above steps should be re-evaluated. Considerations: Methods that control FWFPR or FWFNR should be used if FWFPR or FWFNR is critical to making a monitoring decision. Sensitivity or power of a statistical approach should always be evaluated and in some cases compared to EPA references. When more than one method is eligible, the one with highest power at the range of observed variability is preferred as long as it meets the requirement of the false positive rate. Table A.7.18 Methods for testing statistical assumptions Method Objective Method Description Method 6: Shapiro Wilk test To test the normality of data. The method is a superior alternative to the Chi-Square test and is widely used (EPA 1992a, 1992b). Method 7: Levene's test To test the homogeneity of variances between data from different wells. The method is a more formal procedure than Box Plots visual method. It has a high power that Bartlett's test for non-normal data. Method 8: Durbin-Watson test To test if there is significant serial correlation in data This test is a widely used method (EPA 1992b, Neter et al. 1996) Version 2.1 October 2004 A.7-42 Air Force Center for Environmental Excellence AFCEE MONITORING AND REMEDIATION OPTIMIZATION SYSTEM SOFTWARE Table A.7.19 Methods for dealing with nondetects % Nondetects METHOD 9 Distributional Assumption Method Description < 15% Sub Method 1: Normal or Simple replacement Lognormal The method replaces nondetects with half of their MDLs for "undetected" measurements, or PQLs for "detected but not quantified" measurements. 15% ~ 50% Sub Method 2: Normal or Cohen's adjustment Lognormal The method makes Cohen's adjustments by including nondetects in the calculation. 50% ~ 90% Sub Method 3: Nonparametric methods Not known The method uses a nonparametric version of statistical interval estimates (e.g., prediction limit and confidence limit). 90% ~ 100% Sub Method 4: Poisson model Poisson The method uses the Poisson prediction limit or tolerance limit constructed from counts of analytical hits only. 100% Sub Method 5: Specified limits Not known The method uses laboratory-specific QL or limits required by applicable regulatory agency. Table A.7.20 Methods for dealing with serial correlation and seasonal effects Condition METHOD 10 Method Description No seasonal patterns but may be serially correlated Sub Method 1: Lag 1 adjustment The method adjusts for serial correlation based on AR(1) model (first order autoregressive model) Seasonal patterns but no serial correlation Sub Method 2: Seasonal adjustment The method makes inferences out of seasonally adjusted residuals (remove seasonal mean) Seasonally-adjusted residuals exhibit serial correlation Sub Method 3: Combined adjustment The method adjusts for serial correlation of seasonally adjusted residuals References ASTM, 1998. Standard Guide for Developing Appropriate Statistical Approaches for Ground-Water Detection Monitoring Programs. D6312-98, American Society for Testing and Materials (ASTM), Pennsylvania. Barcelona, M. J., Wehrman, H. A., Schock, M. R., Sievers, M. E. and Karny, J. R., 1989. Sampling Frequency for Ground-Water Quality Monitoring. Nevada: Office of Research and Development, U.S. Environmental Protection Agency. Clayton, C. A., Hines, J. W. and Elkins, P. D., 1987. Detection Limits with Specified Assurance Probabilities. Analytical Chemistry, Vol. 59, No. 20. Version 2.1 October 2004 A.7-43 Air Force Center for Environmental Excellence AFCEE MONITORING AND REMEDIATION OPTIMIZATION SYSTEM SOFTWARE Cohen, J., 1988. Statistical Power Analysis for the Behavioral Sciences. New Jersey: Lawrence Erlbaum Associates. Davis, C. B. and McNichols, R. J., 1987. One-sided Intervals for at Least p of m Observations from a Normal Population on Each of r Future Occasions. Technometrics Vol. 29, pp.359-70. Davis, C. B. and McNichols, R. J., 1994a. Ground Water Monitoring Statistics Update: Part I: Progress Since 1988. Ground Water Monitoring and Remediation, Vol. 14, No. 4, pp.148-158. Davis, C. B. and McNichols, R. J., 1994b. Ground Water Monitoring Statistics Update: Part II: Nonparametric Prediction Limits. Ground Water Monitoring and Remediation, Vol. 14, No. 4, pp. 159-175. EPA, 1989. Statistical Analysis of Ground Water Monitoring Data at RCRA Facilities - Interim Final Guidance. Washington, D.C.: Office of Solid Waste, U.S. Environmental Protection Agency. EPA, 1991a. Monitoring Guidance for the National Estuary Program - Interim Final. Washington, D.C.: Office of Wetlands, Oceans, and Watersheds, U.S. Environmental Protection Agency. EPA, 1991b. Solid Waste Disposal Facility Criteria: Final Rule. Federal Register 56: 50,978-51,119. EPA, 1992a. Statistical Analysis of Ground Water Monitoring Data at RCRA Facilities: Addendum to Interim Final Guidance. Washington, D.C.: Office of Solid Waste, U.S. Environmental Protection Agency. EPA, 1992b. Methods for Evaluating the Attainment of Cleanup Standards Volume 2: Ground Water. Washington, D.C.: Office of Policy, Planning, and Evaluation, U.S. Environmental Protection Agency. EPA, 2000. Guidance for Data Quality Assessment Practical Methods for Data Analysis EPA QA/G-9, QA00 Update. Washington, DC: Office of Environmental Information, U.S. Environmental Protection Agency, July 2000. EPA/600/R-96/084. Gibbons, R. D., 1994. Statistical Methods for Groundwater Monitoring. New York: John Wiley & Sons. Gilbert, R. O., 1987. Statistical Methods for Environmental Pollution Monitoring. New York: John Wiley & Sons. Kufs, C. T., 1994. Journal of Environmental Hydrology, Vol. 2, No. 1, pp.3-13. Loftis, J. C., Iyer, H. K. and Baker, H. J., 1999. Rethinking Poisson-Based Statistics for Ground Water Quality Monitoring. Ground Water, Vol. 37, No. 2, pp. 275-281. Neter, J., Kutner, M. H., Nachtsheim, C. J., Wasserman, W., 1996. Applied Linear Statistical Models (fourth edition). WCB/McGrow-Hill. Tuckfield, R. C., 1994. Estimating an Appropriate Sampling Frequency for Monitoring Ground Water Well Contamination. Westinghouse Savannah River Company, WSRC-MS-94-0111. Available from the National Technical Information Service, U.S. Department of Commerce. Weber, E. F., 1995. Statistical Methods for Assessing Groundwater Compliance and Cleanup: A Regulatory Perspective. Groundwater Quality: Remediation and Protection, International Association of Hydrological Sciences (IAHS) Publication No. 225. GSI, 2000. Personal contacts. Groundwater Services, Inc, Houston, TX. See also Monitoring and Remediation Optimization System (MAROS) User's Guide, Version 2.0, November 2003, Air Force Center for Environmental Excellence. Version 2.1 October 2004 A.7-44 Air Force Center for Environmental Excellence AFCEE MONITORING AND REMEDIATION OPTIMIZATION SYSTEM SOFTWARE APPENDIX A.8 MAROS SITE RESULTS Authors: Newell, C.J. and Aziz, J. J., Groundwater Services, Inc. The preliminary monitoring system optimization results are based on site classification, source treatment and monitoring system category (Figure A.8.1). The decision matrices below are heuristic rules based on the judgment of the authors. Users are expected to review and modify as necessary to reflect site specific hydrogeology, contaminants, risks and regulatory considerations. General recommendations by more rigorous statistical methods can be obtained by using the more detailed optimization approaches outlined in Appendices A.2 and A.3. General site results are outlined by for Sampling Frequency, Well Sample Density and Duration of Sampling. These criteria take into consideration: plume stability, type of plume, and groundwater velocity. The results are specific to only one COC. Each COC considered in the MAROS software is assigned a result based on the criteria outlined here. Tail PI I NT S PD D PI E Source I NT M S L PD D FIGURE A.8.1 DECISION MATRIX FOR ASSIGNING MONITORING SYSTEM CATEGORIES: MODERATE (M); EXTENSIVE (E); LIMITED (L); PLUME STABILITY: INCREASING (I); PROBABLY INCREASING (PI); NO TREND (NT); STABLE(S); PROBABLY DECREASING (PD); DECREASING(D). Weighted Average Two types of weighting are available within the MAROS Analysis software (i.e. LOE weighting and well weighting). The weighting for these analyses follow a simple weighted average defined as: n Weighted Average = ∑W X i i =1 n ∑W i =1 i , where Wi ≥ 0. i Wi is the weight of the value, Xi, in the MAROS software, high, medium, and low weight correspond to values 3, 2 and 1 respectively. Version 2.1 October 2004 A.8-1 Air Force Center for Environmental Excellence AFCEE MONITORING AND REMEDIATION OPTIMIZATION SYSTEM SOFTWARE No Current Site Treatment Or Monitored Natural Attenuation Sites not currently undergoing site treatment (i.e. no current site remediation method other than monitored natural attenuation) have separate decision matrices applied (Tables A.8.1 to A.8.3) FREQUENCY MAROS uses a simple decision matrix to indicate how often wells at the site should be sampled to be sufficient for adequate groundwater monitoring. Users can compare the frequency of the sampling at their site to the suggested frequency of monitoring evaluated based on the decision matrix below. If their site has wells being sampled at a significantly higher interval, then some reduction in the sampling frequency could be applied. Note that user can apply the sampling optimization (Sample Frequency) wing of the software to perform a more rigorous analysis of the sampling frequency required for monitoring for individual well sampling frequency recommendations. Another possibility for sites with slow moving groundwater (higher TTR) involves a comparison study of trends for a complete dataset and a censored dataset. For example, the user can choose to analyze all existing monitoring data, then censor the data (consistently choose 1 quarter’s worth of data, e.g. the first sample event for each year) and run the trend analysis again. Run the MAROS trend results on both the sets of data and then compare the results. If both trend results are the same, then the trend results could have been obtained from using only annual sampling. Similarly, if you would like to be able to sample at a frequency greater than biennial, this same type of analysis could be applied. You could choose to monitor the well greater than every 2 years if the trend results are consistent with less data. This type of analysis is only appropriate with adequately characterized plumes and long time period sample datasets (> 8 years). The sampling frequency at the site is determined by the Monitoring System Category assigned by the results from the Source and Tail Stability as well as the “Time to Receptor”. Sites with both decreasing Source and Tail Results are recommended for closure. TABLE A.8.1 FREQUENCY DETERMINATION FOR SITES WITH NO GROUNDWATER FLUCTUATIONS AND MONITORED NATURAL ATTENUATION. TTR Close (TTR < 2 yrs) Medium (2 < TTR < 5 yrs) Far (TTR > 5 yrs) Monitoring System Category M L Biannually Annually (6 months) Biannually Annually Annually (6 months) Annually Annually Biennially (2 year interval) E Quarterly TTR: time to receptor (distance to receptor/seepage velocity) Version 2.1 October 2004 A.8-2 Air Force Center for Environmental Excellence AFCEE MONITORING AND REMEDIATION OPTIMIZATION SYSTEM SOFTWARE TABLE A.8.2 FREQUENCY DETERMINATION FOR SITES WITH GROUNDWATER FLUCTUATIONS AND MONITORED NATURAL ATTENUATION. TTR Close (TTR < 2 yrs) Medium (2 < TTR < 5 yrs) Far (TTR > 5 yrs) E Quarterly Quarterly Monitoring System Category M L Quarterly Biannually Biannually Biannually Biannually Biannually Annually TTR: time to receptor (distance to receptor/seepage velocity) DURATION MAROS uses a simple decision matrix to assess when the design of the groundwater monitoring network should be reassessed for reducing the scope of the system or to stop monitoring altogether. Users can compare the projected duration of the sampling at their site to the suggested duration of monitoring evaluated based on the decision matrix below. The matrix was developed based on engineering judgment and experience of the authors. It is not based on any kind of statistical analysis. If their site has groundwater monitoring planned for a significantly longer time period, then some reduction in the monitoring duration could be applied, subject to local and federal regulations. The sampling duration at the site is determined by the Monitoring System Category assigned by the results from the combined Source and Tail Stability Category as well as the length of the sampling record available. Sites with both decreasing Source and Tail Results are suggested to end the sampling. TABLE A.8.3 DURATION DETERMINATION FOR SITES WITH MONITORED NATURAL ATTENUATION. Source or Tail Trend Category I or PI Trends NT or N/A S Trends Sampling Record Small (< 2 yrs) Medium (2 < TTR < 10 yrs) Large (> 10 yrs) Consider reassessment of network if concentrations begin to decrease. Consider reassessment of network if concentrations begin to decrease. Consider reassessment of network if concentrations begin to decrease. Insufficient Data, continue sampling Insufficient Data, continue sampling Insufficient Data, continue sampling PD or D Trends 6 more years 3 more years 4 more years 2 more years 2 more years 1 more year SAMPLING DENSITY MAROS uses a simple rule of thumb to indicate how many wells at the site may be sufficient for groundwater monitoring. Users can compare the number of wells at their site to the number of wells from the rule of thumb. If their site has significantly more wells being sampled, then some reduction in the number of wells is possible. Note that users can use the sampling optimization (Sample Location) wing of the software to perform a more rigorous analysis of the number of wells required for monitoring. Version 2.1 October 2004 A.8-3 Air Force Center for Environmental Excellence AFCEE MONITORING AND REMEDIATION OPTIMIZATION SYSTEM SOFTWARE The simple rule of thumb is based on two large databases of historical plume data were considered when evaluating the minimum well density reflecting both BTEX and chlorinated solvent plume information (Mace, 1997 and McNab, 1999). Mace (1997) used data from 138 BTEX plumes while McNab (1999) presented data from 37 the chlorinated solvent plumes. These data were combined, plotted, and then used to develop the following equation: sampling density (number of wells) = 1.5( plumelength ) 0.4 = where plume length is in units of feet and the sampling density is the number of wells for the entire plume. In other words, this equation indicates the monitoring well density actually in use at the sites in the database and is based on plumes of different sizes (roughly 50 ft to 5000 ft). MAROS uses this equation to indicate a well density that is typical at many sites. Based on recommendations developed by ASTM (1998), a minimum of four wells is specified for all plumes. User should also consider the well density in light of adequately defining/characterizing the plume through gathering sufficient site information. Current Site Treatment Sites currently undergoing site treatment (i.e. pump and treat system, etc.) have separate site suggestions for sampling frequency, duration and density applied. FREQUENCY No recommendation is given for the sampling frequency at a site that is currently undergoing remediation. DURATION MAROS uses a simple decision matrix to assess when the design of the groundwater monitoring network should be reassessed for reducing the scope of the system or to stop monitoring altogether. Users can compare the projected duration of the sampling at their site to the suggested duration of monitoring evaluated based on the decision matrix below. The matrix was developed based on engineering judgment and experience of the authors. It is not based on any kind of statistical analysis. If their site has groundwater monitoring planned for a significantly longer time period, then some reduction in the monitoring duration could be applied, subject to local and federal regulations. TABLE A.8.4 DURATION DETERMINATION FOR SITES WITH CURRENT SITE TREATMENT. I or PI Trends Remediate indefinitely or consider increasing performance or remediation mechanism. Source or Tail Trend Category NT or N/A S Trends Insufficient Stop treatment if PRG Data, met. Consider stopping continue treatment if plume has sampling. been stable for extended period. D or PD Trends Consider stopping treatment if decreasing trends have been occurring for extended period. The sampling duration at the site is determined by the Source and Tail Stability results. Sites with both decreasing Source and Tail trends are suggested to consider stopping treatment if Version 2.1 October 2004 A.8-4 Air Force Center for Environmental Excellence AFCEE MONITORING AND REMEDIATION OPTIMIZATION SYSTEM SOFTWARE decreasing trends have been occurring for an extended period or PRG’s have been met. Sites with Source or Tail results that indicate an increasing plume size are recommended for indefinite remediation or consider increasing performance or remediation mechanism. Sites with Stable in the Source and Tail suggest to consider removing the treatment system if previously reducing concentration or PRG met. SAMPLING DENSITY The sampling density determination for a site currently undergoing remediation is identical to that not currently undergoing site treatment. However, the results should be considered in the context of evaluating both regulatory compliance as well as remediation method performance evaluation. References Mace, R.E., R.S. Fisher, D.M. Welch, and S.P. Parra, Extent, Mass, and Duration of Hydrocarbon Plumes from Leaking Petroleum Storage Tank Sites in Texas, Bureau of Economic Geology, University of Texas at Austin, Austin, Texas. Geologic Circular 97-1, 1997. McNab, W.W., D.W.R.J. Bear, R. Ragaini, C. Tuckfield, and C. Oldenburg, 1999. Historical Case Analysis of Chlorinated Volatile Organic Compound Plumes, Lawrence Livermore Laboratory, University of California, Livermore, Ca, 1999. http://searchpdf.adobe.com/proxies/0/5/69/6.html Version 2.1 October 2004 A.8-5 Air Force Center for Environmental Excellence AFCEE MONITORING AND REMEDIATION OPTIMIZATION SYSTEM SOFTWARE APPENDIX A.3 SAMPLING FREQUENCY ANALYSIS: MODIFIED CES METHOD Authors: Ling, M. and Rifai, H. S., University of Houston. In MAROS, the Modified CES method is used to determine the sampling frequencies at all sampling locations for each COC. The Modified CES method is developed based on the Cost Effective Sampling (CES, Ridley et. al. 1995) from Lawrence Livermore National Laboratory (LLNL). The Modified CES method is designed to reduce the sampling frequency based on the analysis of time series sampling data in each sampling location, considering both recent trends and long-term trends of the concentration data. In contrast to the Delaunay Method that is based on the spatial analysis, the Modified CES method is an approach based on temporal analysis. Its combined use with the Delaunay Method leads to a complete process of sampling optimization. Cost Effective Sampling Cost Effective Sampling (CES) is a methodology for estimating the lowest-frequency sampling schedule for a given groundwater monitoring location while it can still provide the needed information for regulatory and remedial decision-making. Its initial development at LLNL was motivated by the preponderance of sampling results which fall below detection limits at two of its restoration sites. The fact that so many locations had never shown, or had ceased for some time to show, any detectable levels of contamination suggested that those groundwater monitoring wells were being sampled more often than necessary. The CES method recommends three steps for determining the sampling frequencies. Step 1. Set frequency based on recent trends. Based on the trends determined by rates of change from linear regression analysis, a location is routed along one of four paths. The lowest rate, 0-10 ppb per year, leads to an annual frequency schedule. The highest rate, 30+ ppb per year, leads to a quarterly schedule. Rates of change in between these two extremes are qualified by variability information, with higher variability leading to a higher sampling frequency. Variability is characterized by a distribution-free version of the coefficient of variation: the range divided by the median concentration with 1.0 as the cut-off. Step 2. Adjust frequency based on overall trends. If the long-term history of change is significantly greater than the recent trend, the frequency may be reduced by one level. If this is not so, no change could be made. Step 3. Reduce frequency based on risk. Since not all compounds in the target list are equally harmful, frequency is reduced by one level if recent maximum concentration for compound of high risk is less than one half of the MCL. It was stated that the evaluation by CES should be performed at the end of each year's monitoring. All the target chemicals should be evaluated to finally make the decision. Latest updates by LLNL include biennial sampling of the well if three successive annual recommendations are made, and the cut-off value of variability at high concentrations. Version 2.1 October 2004 A.9-1 Air Force Center for Environmental Excellence AFCEE MONITORING AND REMEDIATION OPTIMIZATION SYSTEM SOFTWARE The adoption of minimum frequency of "quarterly" sampling is referred to Barcelona et. al (1989). The use of sampling intervals at Quarterly, Semi-Annual, Annual and Biennial is very common in long-term groundwater monitoring (AFCEE 1997, NFESC 2000) and is adopted in MAROS. Version 2.1 October 2004 A.9-2 Air Force Center for Environmental Excellence AFCEE MONITORING AND REMEDIATION OPTIMIZATION SYSTEM SOFTWARE Details of the Modified CES Method Based on the CES method, we made some modifications to it and developed the so-called Modified CES method. The Modified CES method has three major steps that are similar to those of the CES method. The details of the decision procedures for the three major steps are given in the sub-sections starting from the next page. In the Modified CES method, Concentration Trend (CT) by GSI (Groundwater Services, Inc.) style Mann-Kendall analysis is used instead of the distribution-free version of the coefficient of variation for the characterization of the variability. The GSI style Mann-Kendall trend results fall into 6 categories: Decreasing (Decr), Probably Decreasing (ProbDecr), Stable, No Trend, Probably Increasing (ProbIncr), and Increasing (Incr). The result of nonparametric MannKendall analysis is judged with Coefficient of Variation (standard deviation divided by sample mean) and Confidence in Trend to determine the trend category. For the details of this statistic, refer to the corresponding part in Appendix A.1. The Rate of Change (ROC) parameters used for determining the linear trends of COC were generalized to include all possible ranges. The ROC parameters fall into five categories: Low (L), Low-Medium (LM), Medium (M), Medium-High (MH), and High (H). The ROC is simply the slope of the fitted line by linear regression. The user is required to define three ROC parameters, the Low rate, Medium rate, and High rate. The other two rates, Low-Medium and MediumHigh will be automatically determined. The term Cleanup Goal or PRG (Primary Remediation Goal) is used in MAROS to stand for MCL. By default, the Low rate is defined as 0.5PRG/year, the Medium rate is defined as 1.0PRG/year and the High rate is defined as 2.0PRG/year, for all COCs. The Low-Medium rate is defined as the half way between the Low rate and the Medium rate, as is the same for Medium-High rate. The user should provide more accurate values for these ROC values, if accurate classification is available from the hydrogeologic setting in the studied site. The unit of the ROC parameters is mg/L/year. For example, in the right screen, the Cleanup Goal for Benzene is 0.005 mg/L. Then the default Low rate is 0.5 × 0.005 = 0.0025 mg/L/year, unless the user provides a site-specific value. According to the definition, the default Medium rate is 0.005 mg/L/year, and the default Low-Medium rate is (L+M)/2 = (0.0025+0.005)/2 = 0.00375, etc. For details on how to set these parameters, refer to the corresponding parts in chapter MAROS Detailed Screen Descriptions. In MAROS, the determination of sampling frequencies by using the Modified CES method starts with screen Sampling Frequency Analysis, which is introduced in chapter MAROS Detailed Screen Descriptions. Version 2.1 October 2004 A.9-3 Air Force Center for Environmental Excellence AFCEE MONITORING AND REMEDIATION OPTIMIZATION SYSTEM SOFTWARE 1) DETERMINE FREQUENCY BY RECENT TRENDS Frequency can be determined by results from both recent trends and overall trends. In this step, we need to determine the frequency based on recent trends using the procedures shown below. Y ROC <= L ? Annual N Y ROC > H ? Quarterly N Y ROC <= M ? CT is Incr, ProbIncr with ROC>LM, or NoTrend with ROC>LM ? N SemiAnnual N ROC > M CT is Incr, ProbIncr, or NoTrend with ROC>MH ? Y Annual Y Quarterly N SemiAnnual Then similar procedures are used to determine the sampling frequency based on overall trends. In this step, the determined sampling frequency can be one of three possible results: Annual, Semi-Annual, or Quarterly. The adjustment based on recent/overall ratio will be performed in the next step. Figure A.3.1 gives a quick decision matrix that is similar in function to the above flowchart but is more illustrative of the results. Version 2.1 October 2004 A.9-4 Air Force Center for Environmental Excellence AFCEE MONITORING AND REMEDIATION OPTIMIZATION SYSTEM SOFTWARE 2) ADJUSTMENT BASED ON RECENT/OVERALL RATIO If the frequency determined from overall trend is greater than that from the recent trend, e.g., the overall frequency is Quarterly while the current frequency is Annual, we might need to adjust the recent frequency by one level. When the recent trend is significantly lower than the long-term trend, reducing the sampling frequency gradually will ensure safety. The steps to be followed are shown in the following flow chart. Recent frequency is less than Overall frequency ? N Use Frequency determined by Recent data Y Recent frequency is SemiAnnual ? Y N Quarterly SemiAnnual Y N Overall CT is Incr, ProbIncr, or NoTrend ? Y SemiAnnual N Overall frequency is Quarterly Overall CT is Incr, ProbIncr, or NoTrend ? Y N Recent frequency is Annual Overall frequency is SemiAnnual ? Overall CT is Incr, ProbIncr, or NoTrend ? Annual Y SemiAnnual N Quarterly Version 2.1 October 2004 A.9-5 Air Force Center for Environmental Excellence AFCEE MONITORING AND REMEDIATION OPTIMIZATION SYSTEM SOFTWARE 3) ADJUSTMENT BASED ON MCL If the maximum concentration in the sample is less than one half of the MCL, and if the trend of COC in this well is not increasing, we can reduce the sampling frequency by one level. Because at such a low concentration level and with confidence that it will not increase, the adjustment will not cause great risk. The steps to be followed are shown in the following flow chart. In addition, wells that have attained cleanup standards (their long-term concentrations were far less than MCL) can be eliminated from the monitoring network to further optimize the monitoring program. Some of the empirical rules are referred to NFESC (2000). Maximum value in recent data is less than one half of COC's MCL ? N Keep the frequency determined above Y The above determined frequency is Annual and Current CT is Stable, ProbDecr or Decr ? Y Biennial Wells that have attained cleanup standards and are not critical, sampling can be stopped. Y The above determined frequency is SemiAnnual and Current CT is not Incr ? Biennial is also made in three consecutive Annual recommendations. Y Annual N The above determined frequency is Quarter and Current CT is not Incr ? Y SemiAnnual N Keep the frequency determined above Version 2.1 October 2004 A.9-6 Air Force Center for Environmental Excellence AFCEE MONITORING AND REMEDIATION OPTIMIZATION SYSTEM SOFTWARE Figure A.3.1 Decision Matrix for Determining Frequency. As is shown in the above three major steps, the Modified CES method is concerned not only with the magnitude of ROC, but also with the direction of change. The GSI style Mann-Kendall analysis is adopted because it can perform distribution-free test and provides us the direction of change. Usually people are more concerned with increasing trend than decreasing trend, assuming they have the same ROC. Regulator tends to impose more stringent sampling plan if the trend is increasing. An increasing trend can cause the concentration exceeding MCL and make a well non-compliant. On the contrast, a decreasing trend may drop the concentration below MCL and turn the well into compliance. All these examples indicate that attention must be paid to the direction of trend as well as the magnitude of trend. As discussed above, the modified CES method incorporated these considerations into the whole process of decision. The final results include the recent result (based on the analysis of recent data), overall result (based on the analysis of overall data) and the final recommendation after two steps of adjustments. As is shown in the right screen, the Sampling Frequency for MW-15 is Biennial. Both the Current and Overall results for MW-15 are Annual. Its recommended frequency can be used in the future round of sampling. Both parts of the sampling optimization sampling location determination (based on the Delaunay Method) and sampling frequency determination (based on Modified CES method) should be performed periodically to ensure regular optimization of the groundwater monitoring program. Version 2.1 October 2004 A.9-7 Air Force Center for Environmental Excellence AFCEE MONITORING AND REMEDIATION OPTIMIZATION SYSTEM SOFTWARE References AFCEE, 1997, Long-Term Monitoring Optimization Guide - Version 1.1, HQ Air Force Center for Environmental Excellence, Consultant Operations Division, Brooks Air Force Base, TX. Barcelona, M. J. et al., 1989, Sampling Frequency for Ground-water Quality Monitoring, EPA/600/S4-89/032, Environmental Monitoring Systems Laboratory, U.S. EPA. NFESC, 2000, Guide to Optimal Groundwater Monitoring - Interim Final, Naval Facilities Engineering Service Center, Port Hueneme, California. Ridley, M. N. et al., 1995, Cost-Effective Sampling of Groundwater Monitoring Wells, the Regents of UC/LLNL, Lawrence Livermore National Laboratory. Version 2.1 October 2004 A.9-8 Air Force Center for Environmental Excellence AFCEE MONITORING AND REMEDIATION OPTIMIZATION SYSTEM SOFTWARE APPENDIX A.10 MAROS SAMPLE REPORTS 1. COC Assessment Summary 2. Linear Regression Statistics Graph 3. Linear Regression Statistics Summary 4. Mann-Kendall Statistics Graph 5. Mann-Kendall Statistics Summary 6. Spatial Moment Analysis Summary 7. Zeroth, First, and Second Moment Graphs 8. Plume Analysis Summary 9. Site Results Summary 10. Sampling Location Optimization Results 11. Sampling Location Optimization Results – Summary 12. Sampling Location Optimization Graph 13. Sampling Frequency Optimization Results 14. Power Analysis – Individual Well Cleanup Status 15. Power Analysis – Individual Well Cleanup Status Graph 16. Power Analysis – Individual Well Cleanup Status Optional 17. Risk-Based Power Analysis – Regression Results 18. Risk-Based Power Analysis – Projected Concentrations 19. Risk-Based Power Analysis – Site Cleanup Status Version 2.0 November 2003 A.11-1 Air Force Center for Environmental Excellence MAROS COC Assessment User Name: Project: Location: Service Station State: Texas Toxicity: Contaminant of Concern Representative Concentration (mg/L) PRG (mg/L) Percent Above PRG LEAD 1.0E+01 1.5E-02 67296.0% BENZENE 2.1E-01 5.0E-03 4073.5% 1,1,1,2-TETRACHLOROETHANE 3.8E-01 1.1E-01 241.2% 1,2-DICHLOROBENZENE 9.8E-01 6.0E-01 64.1% TOLUENE 1.5E+00 1.0E+00 50.4% BARIUM 3.2E+00 2.3E+00 37.4% COPPER 1.7E+00 1.3E+00 30.4% PERCHLORATE 1.2E-01 9.2E-02 27.6% Note: Top COCs by toxicity were determined by examining a representative concentration for each compound over the entire site. The compound representative concentrations are then compared with the chosen PRG for that compound, with the percentage excedence from the PRG determining the compound's toxicity. All compounds above exceed the PRG. Prevalence: Contaminant of Concern Total Wells Class Total Excedences Percent Excedences Total detects LEAD MET 12 10 83.3% 10 BENZENE ORG 12 8 66.7% 10 BARIUM MET 12 7 58.3% 12 TOLUENE ORG 12 5 41.7% 12 COPPER MET 12 4 33.3% 12 1,2-DICHLOROBENZENE ORG 12 4 33.3% 12 1,1,1,2-TETRACHLOROETHANE ORG 12 3 25.0% 9 PERCHLORATE INO 12 2 16.7% 10 Note: Top COCs by prevalence were determined by examining a representative concentration for each well location at the site. The total excedences (values above the chosen PRGs) are compared to the total number of wells to determine the prevalence of the compound. Mobility: Contaminant of Concern Kd PERCHLORATE BENZENE 0.0984 TOLUENE 0.347 1,1,1,2-TETRACHLOROETHANE 0.857 1,2-DICHLOROBENZENE 1.91 LEAD 10 BARIUM 11 COPPER 40 Note: Top COCs by mobility were determined by examining each detected compound in the dataset and comparing their mobilities (Koc's for organics, assume foc = 0.001, and Kd's for metals). MAROS Version 2, 2002, AFCEE Thursday, November 20, 2003 Page 1 of 2 User Name: Project: Location: Service Station State: Texas Contaminants of Concern (COC's) BENZENE MAROS Version 2, 2002, AFCEE Thursday, November 20, 2003 Page 2 of 2 MAROS Linear Regression Statistics Time Period: 10/4/1988 Well: MW-13 Well Type: T COC: BENZENE to 12/19/1998 Consolidation Period: No Time Consolidation Consolidation Type:Median Duplicate Consolidation: Average ND Values: Specified Detection Limit J Flag Values : Actual Value Date COV: Oc t-8 No 8 v-8 Ma 9 r-9 0 Ma y-9 Se 0 p9 Ap 0 r-9 1 Ju l-9 1 Oc t-9 Ma 1 y-9 Ja 2 n-9 4 Ma y-9 Ju 6 n-9 7 De c-9 7 Ju n9 De 8 c-9 8 1.01 Confidence in Trend: 1 Concentration (mg/L) 100.0% 0.1 Ln Slope: -1.3E-03 0.01 LR Concentration Trend: 0.001 D 0.0001 Consolidation Data Table: Well Well Type Consolidation Date Constituent Result (mg/L) Flag Number of Samples Number of Detects MW-13 T 10/4/1988 BENZENE 3.5E-02 1 1 MW-13 T 11/17/1989 BENZENE 2.6E-02 1 1 MW-13 T 3/1/1990 BENZENE 4.9E-02 1 1 MW-13 T 5/31/1990 BENZENE 5.2E-02 1 1 MW-13 T 9/13/1990 BENZENE 1.5E-02 1 1 MW-13 T 4/3/1991 BENZENE 1.9E-02 1 1 MW-13 T 7/10/1991 BENZENE 2.9E-02 1 1 MW-13 T 10/3/1991 BENZENE 3.5E-02 1 1 MW-13 T 5/2/1992 BENZENE 8.0E-03 1 1 MW-13 T 1/11/1994 BENZENE 1.0E-03 ND 1 0 MW-13 T 5/28/1996 BENZENE 1.0E-03 ND 1 0 MW-13 T 6/27/1997 BENZENE 1.0E-03 ND 1 0 MW-13 T 12/10/1997 BENZENE 5.2E-04 1 1 MW-13 T 6/19/1998 BENZENE 1.0E-03 ND 1 0 MW-13 T 12/19/1998 BENZENE 1.0E-03 ND 1 0 Note: Increasing (I); Probably Increasing (PI); Stable (S); Probably Decreasing (PD); Decreasing (D); No Trend (NT); Not Applicable (N/A) Due to insufficient Data (< 4 sampling events); ND = All Samples are Non-detect MAROS Version 2, 2002, AFCEE 12/1/2003 Page 1 of 1 MAROS Linear Regression Statistics Summary Project: User Name: Location: Service Station State: Texas Time Period: 10/4/1988 to 12/19/1998 Consolidation Period:No Time Consolidation Consolidation Type:Median Duplicate Consolidation:Average ND Values: 1/2 Detection Limit J Flag Values : Actual Value Well Source/ Tail Average Conc (mg/L) Median Conc (mg/L) Standard Deviation All Samples "ND" ? Ln Slope Coefficient Confidence of Variation in Trend Concentration Trend BENZENE MW-8 S 6.7E-04 5.0E-04 6.5E-04 No -9.6E-05 0.97 83.5% S MW-7 S 5.3E-04 5.0E-04 1.3E-04 No -3.2E-05 0.24 79.3% S MW-6 S 5.0E-04 5.0E-04 0.0E+00 Yes 0.0E+00 0.00 100.0% S MW-5 S 1.2E+00 1.2E+00 8.2E-01 No -8.6E-04 0.67 100.0% D MW-3 S 6.9E-02 6.0E-02 7.3E-02 No -1.3E-03 1.05 99.9% D MW-2 S 2.0E-02 5.0E-04 6.9E-02 No -5.2E-04 3.52 92.6% PD MW-1 S 1.0E+00 8.0E-01 9.7E-01 No -1.6E-03 0.92 100.0% D MW-4 T 5.8E-02 1.8E-02 8.6E-02 No -8.5E-04 1.47 99.7% D MW-15 T 5.0E-04 5.0E-04 0.0E+00 Yes 0.0E+00 0.00 100.0% S MW-14 T 1.1E-02 5.0E-04 1.6E-02 No -1.1E-03 1.50 99.9% D MW-13 T 1.8E-02 1.5E-02 1.9E-02 No -1.5E-03 1.03 100.0% D MW-12 T 4.7E-02 2.2E-02 7.0E-02 No -1.7E-03 1.48 100.0% D Note: Increasing (I); Probably Increasing (PI); Stable (S); Probably Decreasing (PD); Decreasing (D); No Trend (NT); Not Applicable (N/A) Due to insufficient Data (< 4 sampling events); COV = Coefficient of Variation MAROS Version 2, 2002, AFCEE Thursday, November 20, 2003 Page 1 of 1 MAROS Mann-Kendall Statistics Summary Time Period: 10/4/1988 Well: MW-13 Well Type: T COC: BENZENE to 12/19/1998 Consolidation Period: No Time Consolidation Consolidation Type:Median Duplicate Consolidation: Average ND Values: Specified Detection Limit J Flag Values : Actual Value Oc t-8 No 8 v-8 Ma 9 r-9 0 Ma y-9 Se 0 p9 Ap 0 r-9 1 Ju l-9 1 Oc t-9 Ma 1 y-9 Ja 2 n-9 4 Ma y-9 Ju 6 n-9 7 De c-9 7 Ju n9 De 8 c-9 8 Date Mann Kendall S Statistic: -64 Concentration (mg/L) 1 Confidence in Trend: 0.1 100.0% Coefficient of Variation: 0.01 1.01 0.001 Mann Kendall Concentration Trend: (See Note) 0.0001 D Data Table: Well Well Type Effective Date Constituent Result (mg/L) Flag Number of Samples Number of Detects MW-13 T 10/4/1988 BENZENE 3.5E-02 1 1 MW-13 T 11/17/1989 BENZENE 2.6E-02 1 1 MW-13 T 3/1/1990 BENZENE 4.9E-02 1 1 MW-13 T 5/31/1990 BENZENE 5.2E-02 1 1 MW-13 T 9/13/1990 BENZENE 1.5E-02 1 1 MW-13 T 4/3/1991 BENZENE 1.9E-02 1 1 MW-13 T 7/10/1991 BENZENE 2.9E-02 1 1 MW-13 T 10/3/1991 BENZENE 3.5E-02 1 1 MW-13 T 5/2/1992 BENZENE 8.0E-03 1 1 MW-13 T 1/11/1994 BENZENE 1.0E-03 ND 1 0 MW-13 T 5/28/1996 BENZENE 1.0E-03 ND 1 0 MW-13 T 6/27/1997 BENZENE 1.0E-03 ND 1 0 MW-13 T 12/10/1997 BENZENE 5.2E-04 1 1 MW-13 T 6/19/1998 BENZENE 1.0E-03 ND 1 0 MW-13 T 12/19/1998 BENZENE 1.0E-03 ND 1 0 Note: Increasing (I); Probably Increasing (PI); Stable (S); Probably Decreasing (PD); Decreasing (D); No Trend (NT); Not Applicable (N/A) Due to insufficient Data (< 4 sampling events); ND = Non-detect MAROS Version 2, 2002, AFCEE 12/1/2003 Page 1 of 1 MAROS Mann-Kendall Statistics Summary Project: User Name: Location: Service Station State: Time Period: 10/4/1988 Texas to 12/19/1998 Consolidation Period: No Time Consolidation Consolidation Type:Median Duplicate Consolidation: Average ND Values: 1/2 Detection Limit J Flag Values : Actual Value Well Source/ Tail Number of Samples Number of Detects Coefficient of Variation Mann-Kendall Statistic All Confidence Samples "ND" ? in Trend Concentration Trend BENZENE MW-8 S 15 1 0.97 -12 70.4% No S MW-7 S 15 1 0.24 -8 63.3% No S MW-6 S 15 0 0.00 0 48.0% Yes S MW-5 S 15 15 0.67 -55 99.7% No D MW-3 S 15 12 1.05 -69 100.0% No D MW-2 S 15 7 3.52 -27 89.9% No NT MW-1 S 15 15 0.92 -90 100.0% No D MW-4 T 15 14 1.47 -59 99.9% No D MW-15 T 15 0 0.00 0 48.0% Yes S MW-14 T 15 7 1.50 -68 100.0% No D MW-13 T 15 10 1.03 -62 99.9% No D MW-12 T 15 11 1.48 -82 100.0% No D Note: Increasing (I); Probably Increasing (PI); Stable (S); Probably Decreasing (PD); Decreasing (D); No Trend (NT); Not Applicable (N/A)Due to insufficient Data (< 4 sampling events); Source/Tail (S/T) The Number of Samples and Number of Detects shown above are post-consolidation values. MAROS Version 2, 2002, AFCEE Thursday, November 20, 2003 Page 1 of 1 MAROS Spatial Moment Analysis Summary Project: User Name: Location: Service Station State: 0th Moment Effective Date Estimated Mass (Kg) 1st Moment (Center of Mass) Xc (ft) Yc (ft) Source Distance (ft) Texas 2nd Moment (Spread) Sigma XX (sq ft) Sigma YY (sq ft) Number of Wells BENZENE 10/4/1988 1.7E-01 46 -49 67 980 2,591 12 11/17/1989 1.2E-01 38 -48 61 1,165 5,923 12 3/1/1990 1.0E-01 47 -61 77 1,234 2,769 12 5/31/1990 6.4E-02 48 -48 68 1,369 3,937 12 9/13/1990 6.2E-02 43 -59 73 987 3,106 12 4/3/1991 4.8E-02 41 -53 68 849 2,891 12 7/10/1991 5.5E-02 41 -59 72 860 3,080 12 10/3/1991 7.4E-02 43 -60 74 896 3,269 12 5/2/1992 2.6E-02 42 -70 82 1,254 5,210 12 1/11/1994 2.5E-02 44 -80 91 1,164 3,844 12 5/28/1996 2.8E-02 41 -75 85 909 3,386 12 6/27/1997 1.6E-02 49 -94 106 1,118 4,164 12 12/10/1997 6.8E-03 48 -103 113 1,486 5,578 12 6/19/1998 6.1E-03 57 -96 112 1,540 5,138 12 12/19/1998 1.4E-03 56 -109 122 2,534 9,481 12 MAROS Version 2, 2002, AFCEE Thursday, November 20, 2003 Page 1 of 2 Project: User Name: Location: Service Station State: Moment Type Consituent Texas Coefficient of Variation Mann-Kendall S Statistic Confidence in Trend Moment Trend 0.88 -91 100.0% D 0.23 83 100.0% I 0.35 35 95.4% I 0.42 53 99.6% I Zeroth Moment: Mass BENZENE 1st Moment: Distance to Source BENZENE 2nd Moment: Sigma XX BENZENE 2nd Moment: Sigma YY BENZENE Note: The following assumptions were applied for the calculation of the Zeroth Moment: Porosity: 0.30 Saturated Thickness: Uniform: 12 ft Mann-Kendall Trend test performed on all sample events for each constituent. Increasing (I); Probably Increasing (PI); Stable (S); Probably Decreasing (PD); Decreasing (D); No Trend (NT); Not Applicable (N/A)-Due to insufficient Data (< 4 sampling events). Note: The Sigma XX and Sigma YY components are estimated using the given field coordinate system and then rotated to align with the estimated groundwater flow direction. Moments are not calculated for sample events with less than 6 wells. MAROS Version 2, 2002, AFCEE Thursday, November 20, 2003 Page 2 of 2 MAROS Zeroth Moment Analysis Project: Tutorial User Name: Charles Newell Location: Service Station State: Texas COC: BENZENE Change in Dissolved Mass Over Time Date Oc t-8 No 8 v-8 Ma 9 r-9 Ma 0 y-9 Se 0 p9 Ap 0 r-9 Ju 1 l-9 1 Oc t-9 Ma 1 y-9 Ja 2 n-9 4 Ma y-9 Ju 6 n9 De 7 c-9 7 Ju n9 De 8 c-9 8 Porosity: 0.30 Saturated Thickness: 2.0E-01 Uniform: 12 ft 1.8E-01 Mann Kendall S Statistic: 1.6E-01 Mass (Kg) 1.4E-01 -91 1.2E-01 Confidence in Trend: 1.0E-01 8.0E-02 100.0% 6.0E-02 Coefficient of Variation: 4.0E-02 2.0E-02 0.85 0.0E+00 Zeroth Moment Trend: D Data Table: Effective Date Constituent Estimated Mass (Kg) Number of Wells 10/4/1988 BENZENE 1.7E-01 12 11/17/1989 BENZENE 1.3E-01 12 3/1/1990 BENZENE 1.1E-01 12 5/31/1990 BENZENE 6.8E-02 12 9/13/1990 BENZENE 6.6E-02 12 4/3/1991 BENZENE 5.1E-02 12 7/10/1991 BENZENE 5.9E-02 12 10/3/1991 BENZENE 8.0E-02 12 5/2/1992 BENZENE 2.9E-02 12 1/11/1994 BENZENE 2.8E-02 12 5/28/1996 BENZENE 3.2E-02 12 6/27/1997 BENZENE 1.9E-02 12 12/10/1997 BENZENE 8.5E-03 12 6/19/1998 BENZENE 7.5E-03 12 12/19/1998 BENZENE 2.4E-03 12 Note: Increasing (I); Probably Increasing (PI); Stable (S); Probably Decreasing (PD); Decreasing (D); No Trend (NT); Not Applicable (N/A) Due to insufficient Data (< 4 sampling events); ND = Non-detect. Moments are not calculated for sample events with less than 6 wells. MAROS Version 2, 2002, AFCEE 12/1/2003 Page 1 of 1 MAROS First Moment Analysis Project: Tutorial User Name: Charles Newell Location: Service Station State: Texas COC: BENZENE Distance from Source to Center of Mass Mann Kendall S Statistic: Date Oc t-8 No 8 vM 89 ar -9 M 0 ay -9 Se 0 p9 Ap 0 r-9 Ju 1 l-9 1 Oc t-9 M 1 ay Ja 92 n9 M 4 ay Ju 96 n9 De 7 c9 Ju 7 n9 De 8 c98 83 Confidence in Trend: Distance from Source (ft) 1.4E+02 100.0% 1.2E+02 Coefficient of Variation: 0.22 1.0E+02 First Moment Trend: 8.0E+01 6.0E+01 I 4.0E+01 2.0E+01 0.0E+00 Data Table: Effective Date Constituent Xc (ft) Yc (ft) Distance from Source (ft) Number of Wells 10/4/1988 BENZENE 48 -53 71 12 11/17/1989 BENZENE 39 -51 64 12 3/1/1990 BENZENE 49 -64 81 12 5/31/1990 BENZENE 50 -52 72 12 9/13/1990 BENZENE 44 -64 77 12 4/3/1991 BENZENE 42 -58 71 12 7/10/1991 BENZENE 42 -64 76 12 10/3/1991 BENZENE 45 -65 79 12 5/2/1992 BENZENE 43 -77 89 12 1/11/1994 BENZENE 46 -86 98 12 5/28/1996 BENZENE 44 -81 92 12 6/27/1997 BENZENE 52 -100 113 12 12/10/1997 BENZENE 49 -108 119 12 6/19/1998 BENZENE 58 -101 116 12 12/19/1998 BENZENE 59 -106 122 12 Note: Increasing (I); Probably Increasing (PI); Stable (S); Probably Decreasing (PD); Decreasing (D); No Trend (NT); Not Applicable (N/A) Due to insufficient Data (< 4 sampling events). Moments are not calculated for sample events with less than 6 wells. MAROS Version 2, 2002, AFCEE 12/1/2003 Page 1 of 1 MAROS First Moment Analysis Project: Tutorial User Name: Charles Newell Location: Service Station State: Texas COC: BENZENE Change in Location of Center of Mass Over Time 0 0 10 20 30 40 50 60 70 Groundwater Flow Direction: -20 Yc (ft) -40 11/ 8 9 10 /085/ 8 90 04/91 -60 0 7/09 91// 9 91 0 03/90 10 Source Coordinate: 0 5/ 9 2 0 5/ 9 6 0 1/ 9 4 -80 - 10 0 06/97 06/98 12 / 9 8 12 / 9 7 X: 0 Y: 0 - 12 0 Xc (ft) Effective Date Constituent Xc (ft) Yc (ft) Distance from Source (ft) Number of Wells 10/4/1988 BENZENE 48 -53 71 12 11/17/1989 BENZENE 39 -51 64 12 3/1/1990 BENZENE 49 -64 81 12 5/31/1990 BENZENE 50 -52 72 12 9/13/1990 BENZENE 44 -64 77 12 4/3/1991 BENZENE 42 -58 71 12 7/10/1991 BENZENE 42 -64 76 12 10/3/1991 BENZENE 45 -65 79 12 5/2/1992 BENZENE 43 -77 89 12 1/11/1994 BENZENE 46 -86 98 12 5/28/1996 BENZENE 44 -81 92 12 6/27/1997 BENZENE 52 -100 113 12 12/10/1997 BENZENE 49 -108 119 12 6/19/1998 BENZENE 58 -101 116 12 12/19/1998 BENZENE 59 -106 122 12 Note: Increasing (I); Probably Increasing (PI); Stable (S); Probably Decreasing (PD); Decreasing (D); No Trend (NT); Not Applicable (N/A) Due to insufficient Data (< 4 sampling events). Moments are not calculated for sample events with less than 6 wells. MAROS Version 2, 2002, AFCEE 12/1/2003 Page 1 of 1 MAROS Second Moment Analysis Project: Tutorial User Name: Charles Newell Location: Service Station State: Texas COC: BENZENE Change in Plume Spread Over Time Mann Kendall S Statistic: Date Oc t-8 No 8 v-8 Ma 9 r-9 M 0 ay -9 Se 0 p9 Ap 0 r-9 1 Ju l-9 Oc 1 t-9 M 1 ay -9 Ja 2 n9 M 4 ay -9 Ju 6 n9 De 7 c-9 Ju 7 n9 De 8 c-9 8 59 Confidence in Trend: 100000 99.9% 10000 Syy^2 (sq ft) Coefficient of Variation: 0.38 1000 Second Moment Trend: 100 I 10 1 Oc t-8 8 No v-8 Ma 9 r-9 Ma 0 y-9 Se 0 p9 Ap 0 r-9 Ju 1 l-9 Oc 1 t-9 Ma 1 y-9 Ja 2 n-9 Ma 4 y-9 Ju 6 n9 De 7 c-9 Ju 7 n9 De 8 c-9 8 Date Mann Kendall S Statistic: 33 1000 Confidence in Trend: Sxx^2 (sq ft) 10000 94.3% Coefficient of Variation: 100 0.31 10 Second Moment Trend: PI 1 Data Table: Effective Date Constituent Sigma XX (sq ft) Sigma YY (sq ft) Number of Wells 10/4/1988 BENZENE 1,104 2,893 12 11/17/1989 BENZENE 1,329 6,063 12 3/1/1990 BENZENE 1,366 3,215 12 5/31/1990 BENZENE 1,533 4,347 12 9/13/1990 BENZENE 1,142 3,694 12 4/3/1991 BENZENE 1,007 3,502 12 7/10/1991 BENZENE 1,008 3,718 12 10/3/1991 BENZENE 1,025 3,824 12 5/2/1992 BENZENE 1,436 6,019 12 1/11/1994 BENZENE 1,308 4,493 12 5/28/1996 BENZENE 1,076 3,962 12 6/27/1997 BENZENE 1,294 4,735 12 MAROS Version 2, 2002, AFCEE 12/1/2003 Page 1 of 2 MAROS Second Moment Analysis Effective Date Constituent Sigma XX (sq ft) Sigma YY (sq ft) Number of Wells 12/10/1997 BENZENE 1,749 6,327 12 6/19/1998 BENZENE 1,711 5,988 12 12/19/1998 BENZENE 2,676 10,095 12 Note: Increasing (I); Probably Increasing (PI); Stable (S); Probably Decreasing (PD); Decreasing (D); No Trend (NT); Not Applicable (N/A) Due to insufficient Data (< 4 sampling events) The Sigma XX and Sigma YY components are estimated using the given field coordinate system and then rotated to align with the estimated groundwater flow direction. Moments are not calculated for sample events with less than 6 wells. MAROS Version 2, 2002, AFCEE 12/1/2003 Page 2 of 2 MAROS Site Results User Name: Project: Location: Service Station State: Texas User Defined Site and Data Assumptions: Down-gradient Information: Hydrogeology and Plume Information: Groundwater Seepage Velocity: Distance from Edge of Tail to Nearest: 92 ft/yr Current Plume Length: 270 ft Current Plume Widt 150 ft Number of Tail Wells: 1000 ft Down-gradient property: 1000 ft Distance from Source to Nearest: 5 Number of Source Wells: Down-gradient receptor: 7 Source Information: Down-gradient receptor: 1000 ft Down-gradient property: 1000 ft Source Treatment: No Current Site Treatment NAPL is not observed at this site. Data Consolidation Assumptions: Time Period: 10/4/1988 Plume Information Weighting Assumptions: Consolidation Step 1. Weight Plume Information by Chemical to 12/19/1998 Summary Weighting: Weighting Applied to All Chemicals Equally Consolidation Period: No Time Consolidation Consolidation Type: Median Consolidation Step 2. Weight Well Information by Chemical Duplicate Consolidation: Average Well Weighting: No Weighting of Wells was Applied. ND Values: 1/2 Detection Limit J Flag Values : Chemical Weighting: No Weighting of Chemicals was Applied. Actual Value Note: These assumptions were made when consolidating the historical montoring data and lumping the Wells and COCs. 1. Compliance Monitoring/Remediation Optimization Results: Preliminary Monitoring System Optimization Results: Based on site classification, source treatment and Monitoring System Category the following suggestions are made for site Sampling Frequency, Duration of Sampling before reassessment, and Well Density. These criteria take into consideration: Plume Stability, Type of Plume, and Groundwater Velocity. Tail Source Stability Stability COC BENZENE D PD Level of Effort L Sampling Duration Sample 1 more year Sampling Frequency Sampling Density Biannually (6 months) 15 Note: Plume Status: (I) Increasing; (PI)Probably Increasing; (S) Stable; (NT) No Trend; (PD) Probably Decreasing; (D) Decreasing Design Categories: (E) Extensive; (M) Moderate; (L) Limited (N/A) Not Applicable, Insufficient Data Available Level of Monitoring Effort Indicated by Analysi Limited 2. Spatial Moment Analysis Results: MAROS Version 2, 2002, AFCEE Thursday, November 20, 2003 Page 1 of 2 Moment Type Consituent Coefficient of Variation Mann-Kendall S Statistic Confidence in Trend Moment Trend 0.88 -91 100.0% D 0.23 83 100.0% I 0.35 35 95.4% I 0.42 53 99.6% I Zeroth Moment: Mass BENZENE 1st Moment: Distance to Source BENZENE 2nd Moment: Sigma XX BENZENE 2nd Moment: Sigma YY BENZENE Note: The following assumptions were applied for the calculation of the Zeroth Moment Porosity: 0.30 Saturated Thickness: Uniform: 12 ft Mann-Kendall Trend test performed on all sample events for each constituent. Increasing (I); Probably Increasing (PI); Stable (S); Probably Decreasing (PD); Decreasing (D); No Trend (NT); Not Applicable (N/A)-Due to insufficient Data (< 4 sampling events). MAROS Version 2, 2002, AFCEE Thursday, November 20, 2003 Page 2 of 2 MAROS Plume Analysis Summary Project: Location: User Name: State: Service Station Time Period: 10/4/1988 Texas to 12/19/1998 Consolidation Period: No Time Consolidation Consolidation Type: Median Duplicate Consolidation: Average ND Values: 1/2 Detection Limit J Flag Values : Actual Value Constituent Well Source/ Tail Number of Samples Number of Detects Average (mg/L) Median (mg/L) All Samples "ND" ? MannKendall Linear Regression Modeling Empirical BENZENE MW-8 S 15 1 6.7E-04 5.0E-04 No S S N/A N/A MW-7 S 15 1 5.3E-04 5.0E-04 No S S N/A N/A MW-6 S 15 0 5.0E-04 5.0E-04 Yes S S N/A N/A MW-5 S 15 15 1.2E+00 1.2E+00 No D D N/A N/A MW-3 S 15 12 6.9E-02 6.0E-02 No D D N/A N/A MW-2 S 15 7 2.0E-02 5.0E-04 No NT PD N/A N/A MW-1 S 15 15 1.0E+00 8.0E-01 No D D N/A N/A MW-4 T 15 14 5.8E-02 1.8E-02 No D D N/A N/A MW-15 T 15 0 5.0E-04 5.0E-04 Yes S S N/A N/A MW-14 T 15 7 1.1E-02 5.0E-04 No D D N/A N/A MW-13 T 15 10 1.8E-02 1.5E-02 No D D N/A N/A MW-12 T 15 11 4.7E-02 2.2E-02 No D D N/A N/A Note: Increasing (I); Probably Increasing (PI); Stable (S); Probably Decreasing (PD); Decreasing (D); No Trend (NT); Not Applicable (N/A) - Due to insufficient Data (< 4 sampling events); Source/Tail (S/T) The Number of Samples and Number of Detects shown above are post-consolidation values. MAROS Version 2, 2002, AFCEE Thursday, November 20, 2003 Page 1 of 1 Trend Results for BENZENE 40 MW-2: (S) MW-13: (D) 20 MW-14: (D) MW-3: (D) MW-6: (S) 0 -150 -100 -50 0 Y Coordinate -20 50 100MW-12: (D) 150 200 250 MW-1: (D) MW-4: (D) -40 Tail Wells Source Wells -60 MW-5: (D) MW-7: (S) -80 MW-8: (S) -100 -120 MW-15: (S) Trend Result: Increasing (I) Probably Increasing (PI) No Trend (NT) Stable (S) Probably Decreasing (PD) Decreasing (D) -140 X Coordinate AFCEE Long Term Monitoring Software Page 1 of 1 MAROS Sampling Location Optimization Results Project: Example User Name Location: Service Station State: Texas Sampling Events Analyzed: From Sample Event 10 to Sample Event 15 1/11/1994 Parameters used: Constituent Meng 12/19/1998 Inside SF Hull SF BENZENE 0.2 Area Ratio Conc. Ratio 0.01 0.95 0.95 Average Slope Factor* Minimum Slope Factor* -20.00 0.259 0.039 0.386 100.00 -8.00 0.165 0.000 0.262 MW-13 65.00 23.00 0.254 0.000 0.395 MW-14 102.00 20.00 0.064 0.000 0.278 MW-15 190.00 -125.00 0.421 0.197 0.538 MW-2 -2.00 30.00 0.308 0.070 0.508 MW-3 35.00 10.00 0.117 0.008 0.297 MW-4 55.00 -37.00 0.165 0.035 0.266 MW-5 -4.00 -70.00 0.532 0.479 0.587 MW-6 -77.00 5.00 0.526 0.304 0.625 MW-7 -87.00 -75.00 0.417 0.269 0.490 MW-8 -55.00 -95.00 0.645 0.490 0.715 Well X (feet) Y (feet) MW-1 13.00 MW-12 Removable? Maximum Slope Factor* Eliminated? BENZENE Note: The Slope Factor indicates the relative importance of a well in the monitoring network at a given sampling event; the larger the SF value of a well, the more important the well is and vice versa; the Average Slope Factor measures the overall well importance in the selected time period; the state coordinates system (i.e., X and Y refer to Easting and Northing respectively) or local coordinates systems may be used; wells that are NOT selected for analysis are not shown above. * When the report is generated after running the Excel module, SF values will NOT be shown above. MAROS Version 2, 2002, AFCEE Thursday, November 20, 2003 Page 1 of 1 MAROS Sampling Location Optimization Results by Considering All COCs Project: Example User Name: Meng Location: Service Station State: Texas Sampling Events Analyzed: From Sample Event 10 to Sample Event 15 1/11/1994 12/19/1998 Number of COCs COC-Averaged Slope Factor* -20.00 1 0.259 100.00 -8.00 1 0.165 MW-13 65.00 23.00 1 0.254 MW-14 102.00 20.00 1 0.064 MW-15 190.00 -125.00 1 0.421 MW-2 -2.00 30.00 1 0.308 MW-3 35.00 10.00 1 0.117 MW-4 55.00 -37.00 1 0.165 MW-5 -4.00 -70.00 1 0.532 MW-6 -77.00 5.00 1 0.526 MW-7 -87.00 -75.00 1 0.417 MW-8 -55.00 -95.00 1 0.645 Well X (feet) Y (feet) MW-1 13.00 MW-12 Abandoned? Note: the COC-Averaged Slope Factor is the value calculated by averaging those "Average Slope Factor" obtained earlier across COCs; to be conservative, a location is "abandoned" only when it is eliminated from all COCs; "abandoned" doesn't necessarily mean the abandon of well, it can mean that NO samples need to be collected for any COCs. * When the report is generated after running the Excel module, SF values will NOT be shown above. MAROS Version 2, 2002, AFCEE Thursday, November 20, 2003 Page 1 of 1 MAROS Sampling Frequency Optimization Results Project: Example User Name: Meng Location: Service Station State: Texas The Overall Number of Sampling Events: 15 "Recent Period" defined by events: From Sample Event 10 To Sample Event 15 1/11/1994 12/19/1998 "Rate of Change" parameters used: Constituent Cleanup Goal Low Rate Medium Rate High Rate BENZENE 0.005 0.0025 0.005 0.01 Units: Cleanup Goal is in mg/L; all rate parameters are in mg/L/year. Well Recommended Sampling Frequency Frequency Based on Recent Data Frequency Based on Overall Data BENZENE MW-1 Annual Annual Annual MW-12 Annual Annual Annual MW-13 Biennial Annual Annual MW-14 Biennial Annual Annual MW-15 Biennial Annual Annual MW-2 Biennial Annual Annual MW-3 Annual Annual Annual MW-4 Annual Annual Annual MW-5 Annual Annual Annual MW-6 Biennial Annual Annual MW-7 Biennial Annual Annual MW-8 Biennial Annual Annual Note: Sampling frequency is determined considering both recent and overall concentration trends. Sampling Frequency is the final recommendation; Frequency Based on Recent Data is the frequency determined using recent (short) period of monitoring data; Frequency Based on Overall Data is the frequency determined using overall (long) period of monitoring data. If the "recent period" is defined using a different series of sampling events, the results could be different. MAROS Version 2, 2002, AFCEE Thursday, November 20, 2003 Page 1 of 1 Individual Well Cleanup Status - Optional Analysis Results Project: Example User Name: Meng Location: Service Station State: Texas From Period: 4/3/1991 to 12/19/1998 Normal Distribution Assumption Well Sample Sample Szie Mean BENZENE Sample Stdev. Significantly < Cleanup Goal? Cleanup Goal (mg/L) = 0.005 Power Expected Sample Size Lognormal Distribution Assumption Significantly < Cleanup Goal? Expected Power Sample Size Alpha Level = 0.05 Expected Power = 0.8 MW-1 6 3.90E-01 5.44E-01 NO S/E S/E NO S/E S/E MW-12 6 7.61E-03 1.01E-02 NO S/E S/E NO S/E S/E MW-13 6 6.57E-03 1.07E-02 NO S/E S/E NO S/E S/E MW-14 6 1.00E-03 1.50E-11 YES 1.000 <=3 YES 1.000 <=3 MW-15 6 1.00E-03 1.50E-11 YES 1.000 <=3 YES 1.000 <=3 MW-2 6 2.89E-03 3.53E-03 NO 0.391 19 NO 0.418 17 MW-3 6 3.53E-02 4.91E-02 NO S/E S/E NO S/E S/E MW-4 6 1.87E-02 1.20E-02 NO S/E S/E NO S/E S/E MW-5 6 1.11E+00 8.68E-01 NO S/E S/E NO S/E S/E MW-6 6 1.00E-03 1.50E-11 YES 1.000 <=3 YES 1.000 <=3 MW-7 6 1.00E-03 1.50E-11 YES 1.000 <=3 YES 1.000 <=3 MW-8 6 1.00E-03 1.50E-11 YES 1.000 <=3 YES 1.000 <=3 Note: N/C refers to "not conducted" because of insufficient data (N<4); S/E indicates the sample mean significantly exceeds the cleanup level and thus no analysis is conducted; Sample Size is the number of concentration data in a sampling location that are used in the power analysis; Expected Sample Size is the number of concentration data needed to reach the Expected Power under current sample variability; The Target Level is the expected mean concentration in wells after cleanup attainment, it is only used in individual well celanup status evaluation. The Student's t-test on mean difference is used in this analysis. Refer to Appendix A.6 of MAROS Manual for details. MAROS Version 2, 2002, AFCEE Thursday, November 20, 2003 Page 1 of 1 Regression of Plume Centerline Concentrations Project: Example User Name Location: Service Station State: Texas Groundwater Flow Direction: 0 degrees From Period: 10/4/1988 Selected Plume Centerline Wells: Meng Distance to Receptor: 1000 feet to 12/19/1998 Well Distance to Receptor (feet) MW-12 1090.0 MW-4 1135.0 MW-1 1177.0 The distance is measured in the Groundwater Flow Angle from the well to the compliance boundary. Sample Event Effective Date Number of Centerline Wells Regression Coefficient (1/ft) Confidence in Coefficient BENZENE Sample Event 1 10/4/1988 3 -2.88E-02 87.0% Sample Event 2 11/17/1989 3 -4.25E-02 90.7% Sample Event 3 3/1/1990 3 -3.14E-02 87.6% Sample Event 4 5/31/1990 3 -2.77E-02 66.1% Sample Event 5 9/13/1990 3 -4.45E-02 84.4% Sample Event 6 4/3/1991 3 -5.06E-02 80.8% Sample Event 7 7/10/1991 3 -4.57E-02 78.0% Sample Event 8 10/3/1991 3 -3.83E-02 88.8% Sample Event 9 5/2/1992 3 -3.53E-02 77.9% Sample Event 10 1/11/1994 3 -4.33E-02 93.5% Sample Event 11 5/28/1996 3 -6.76E-02 96.4% Sample Event 12 6/27/1997 3 -4.44E-02 87.8% Sample Event 13 12/10/1997 3 -4.10E-02 92.4% Sample Event 14 6/19/1998 3 -2.83E-02 81.7% Sample Event 15 12/19/1998 3 -7.29E-03 82.7% Note: when the number of plume centerline wells is less than 3, no analysis is performed and all related values are set to ZERO; Confidence in Coefficient is the statistical confidence that the estimated coefficient is different from ZERO (for details, please refer to "Conference in Trend" in Linear Regression Analysis). MAROS Version 2, 2002, AFCEE Thursday, November 20, 2003 Page 1 of 1 Risk-Based Power Analysis -- Projected Concentrations Project: Example User Name: Meng Location: Service Station State: Texas From Period: 10/4/1988 Sampling Event to 12/19/1998 Distance from the most downgradient well to receptor: 1000 feet Observed Concentration (mg/L) Distance Down Centerline (ft) Regression Coefficient (1/ft) Projected Below Concentration Detection Used in Analysis? (mg/L) Limit? Effective Date Well Sample Event 1 10/4/1988 MW-1 2.500E+00 1177.0 -2.88E-02 4.835E-15 Yes Yes Sample Event 1 10/4/1988 MW-12 2.000E-01 1090.0 -2.88E-02 4.732E-15 Yes Yes Sample Event 1 10/4/1988 MW-13 3.500E-02 1125.0 -2.88E-02 3.024E-16 Yes Yes Sample Event 1 10/4/1988 MW-14 4.000E-02 1088.0 -2.88E-02 1.002E-15 Yes Yes Sample Event 1 10/4/1988 MW-15 1.000E-03 1000.0 -2.88E-02 3.156E-16 Yes Yes Sample Event 1 10/4/1988 MW-2 2.000E-03 1192.0 -2.88E-02 2.511E-18 Yes Yes Sample Event 1 10/4/1988 MW-3 2.000E-01 1155.0 -2.88E-02 7.286E-16 Yes Yes Sample Event 1 10/4/1988 MW-4 2.900E-01 1135.0 -2.88E-02 1.879E-15 Yes Yes Sample Event 1 10/4/1988 MW-5 1.500E+00 1194.0 -2.88E-02 1.778E-15 Yes Yes Sample Event 1 10/4/1988 MW-6 1.000E-03 1267.0 -2.88E-02 1.450E-19 Yes Yes Sample Event 1 10/4/1988 MW-7 1.000E-03 1277.0 -2.88E-02 1.087E-19 Yes Yes Sample Event 1 10/4/1988 MW-8 1.000E-03 1245.0 -2.88E-02 2.731E-19 Yes Yes Sample Event 2 11/17/1989 MW-1 1.900E+00 1177.0 -4.25E-02 3.522E-22 Yes Yes Sample Event 2 11/17/1989 MW-12 4.600E-02 1090.0 -4.25E-02 3.445E-22 Yes Yes Sample Event 2 11/17/1989 MW-13 2.600E-02 1125.0 -4.25E-02 4.397E-23 Yes Yes Sample Event 2 11/17/1989 MW-14 2.600E-02 1088.0 -4.25E-02 2.120E-22 Yes Yes Sample Event 2 11/17/1989 MW-15 1.000E-03 1000.0 -4.25E-02 3.437E-22 Yes Yes Sample Event 2 11/17/1989 MW-2 2.700E-01 1192.0 -4.25E-02 2.645E-23 Yes Yes Sample Event 2 11/17/1989 MW-3 1.800E-01 1155.0 -4.25E-02 8.501E-23 Yes Yes Sample Event 2 11/17/1989 MW-4 1.200E-01 1135.0 -4.25E-02 1.326E-22 Yes Yes Sample Event 2 11/17/1989 MW-5 1.700E+00 1194.0 -4.25E-02 1.530E-22 Yes Yes Sample Event 2 11/17/1989 MW-6 1.000E-03 1267.0 -4.25E-02 4.039E-27 Yes Yes Sample Event 2 11/17/1989 MW-7 1.000E-03 1277.0 -4.25E-02 2.640E-27 Yes Yes Sample Event 2 11/17/1989 MW-8 3.000E-03 1245.0 -4.25E-02 3.087E-26 Yes Yes Sample Event 3 3/1/1990 MW-1 2.200E+00 1177.0 -3.14E-02 1.947E-16 Yes Yes Sample Event 3 3/1/1990 MW-12 1.400E-01 1090.0 -3.14E-02 1.904E-16 Yes Yes Sample Event 3 3/1/1990 MW-13 4.900E-02 1125.0 -3.14E-02 2.220E-17 Yes Yes Sample Event 3 3/1/1990 MW-14 3.400E-02 1088.0 -3.14E-02 4.924E-17 Yes Yes Sample Event 3 3/1/1990 MW-15 1.000E-03 1000.0 -3.14E-02 2.297E-17 Yes Yes Sample Event 3 3/1/1990 MW-2 1.000E-03 1192.0 -3.14E-02 5.526E-20 Yes Yes Sample Event 3 3/1/1990 MW-3 1.000E-03 1155.0 -3.14E-02 1.766E-19 Yes Yes Sample Event 3 3/1/1990 MW-4 2.200E-01 1135.0 -3.14E-02 7.282E-17 Yes Yes BENZENE MAROS Version 2, 2002, AFCEE Thursday, November 20, 2003 Page 1 of 6 Project: Example User Name: Meng Location: Service Station State: Texas Sampling Event Observed Concentration (mg/L) Distance Down Centerline (ft) Regression Coefficient (1/ft) Projected Below Concentration Detection Used in Analysis? (mg/L) Limit? Effective Date Well Sample Event 3 3/1/1990 MW-5 1.200E+00 1194.0 -3.14E-02 6.227E-17 Yes Yes Sample Event 3 3/1/1990 MW-6 1.000E-03 1267.0 -3.14E-02 5.242E-21 Yes Yes Sample Event 3 3/1/1990 MW-7 1.000E-03 1277.0 -3.14E-02 3.829E-21 Yes Yes Sample Event 3 3/1/1990 MW-8 1.000E-03 1245.0 -3.14E-02 1.046E-20 Yes Yes Sample Event 4 5/31/1990 MW-1 2.300E+00 1177.0 -2.77E-02 1.655E-14 Yes Yes Sample Event 4 5/31/1990 MW-12 1.900E-01 1090.0 -2.77E-02 1.517E-14 Yes Yes Sample Event 4 5/31/1990 MW-13 5.200E-02 1125.0 -2.77E-02 1.577E-15 Yes Yes Sample Event 4 5/31/1990 MW-14 4.400E-02 1088.0 -2.77E-02 3.714E-15 Yes Yes Sample Event 4 5/31/1990 MW-15 1.000E-03 1000.0 -2.77E-02 9.634E-16 Yes Yes Sample Event 4 5/31/1990 MW-2 1.000E-03 1192.0 -2.77E-02 4.750E-18 Yes Yes Sample Event 4 5/31/1990 MW-3 1.400E-01 1155.0 -2.77E-02 1.851E-15 Yes Yes Sample Event 4 5/31/1990 MW-4 1.600E-02 1135.0 -2.77E-02 3.679E-16 Yes Yes Sample Event 4 5/31/1990 MW-5 1.300E+00 1194.0 -2.77E-02 5.843E-15 Yes Yes Sample Event 4 5/31/1990 MW-6 1.000E-03 1267.0 -2.77E-02 5.963E-19 Yes Yes Sample Event 4 5/31/1990 MW-7 1.000E-03 1277.0 -2.77E-02 4.522E-19 Yes Yes Sample Event 4 5/31/1990 MW-8 1.000E-03 1245.0 -2.77E-02 1.096E-18 Yes Yes Sample Event 5 9/13/1990 MW-1 1.500E+00 1177.0 -4.45E-02 2.707E-23 Yes Yes Sample Event 5 9/13/1990 MW-12 3.000E-02 1090.0 -4.45E-02 2.598E-23 Yes Yes Sample Event 5 9/13/1990 MW-13 1.500E-02 1125.0 -4.45E-02 2.737E-24 Yes Yes Sample Event 5 9/13/1990 MW-14 1.400E-02 1088.0 -4.45E-02 1.325E-23 Yes Yes Sample Event 5 9/13/1990 MW-15 1.000E-03 1000.0 -4.45E-02 4.749E-23 Yes Yes Sample Event 5 9/13/1990 MW-2 1.000E-03 1192.0 -4.45E-02 9.258E-27 Yes Yes Sample Event 5 9/13/1990 MW-3 6.000E-02 1155.0 -4.45E-02 2.882E-24 Yes Yes Sample Event 5 9/13/1990 MW-4 3.800E-02 1135.0 -4.45E-02 4.444E-24 Yes Yes Sample Event 5 9/13/1990 MW-5 1.500E+00 1194.0 -4.45E-02 1.270E-23 Yes Yes Sample Event 5 9/13/1990 MW-6 1.000E-03 1267.0 -4.45E-02 3.290E-28 Yes Yes Sample Event 5 9/13/1990 MW-7 1.000E-03 1277.0 -4.45E-02 2.109E-28 Yes Yes Sample Event 5 9/13/1990 MW-8 1.000E-03 1245.0 -4.45E-02 8.757E-28 Yes Yes Sample Event 6 4/3/1991 MW-1 1.900E+00 1177.0 -5.06E-02 2.735E-26 Yes Yes Sample Event 6 4/3/1991 MW-12 2.200E-02 1090.0 -5.06E-02 2.575E-26 Yes Yes Sample Event 6 4/3/1991 MW-13 1.900E-02 1125.0 -5.06E-02 3.790E-27 Yes Yes Sample Event 6 4/3/1991 MW-14 1.000E-03 1088.0 -5.06E-02 1.295E-27 Yes Yes Sample Event 6 4/3/1991 MW-15 1.000E-03 1000.0 -5.06E-02 1.108E-25 Yes Yes Sample Event 6 4/3/1991 MW-2 1.000E-03 1192.0 -5.06E-02 6.744E-30 Yes Yes Sample Event 6 4/3/1991 MW-3 1.500E-01 1155.0 -5.06E-02 6.567E-27 Yes Yes Sample Event 6 4/3/1991 MW-4 1.600E-02 1135.0 -5.06E-02 1.925E-27 Yes Yes BENZENE MAROS Version 2, 2002, AFCEE Thursday, November 20, 2003 Page 2 of 6 Project: Example User Name: Meng Location: Service Station State: Texas Sampling Event Observed Concentration (mg/L) Distance Down Centerline (ft) Regression Coefficient (1/ft) Projected Below Concentration Detection Used in Analysis? (mg/L) Limit? Effective Date Well Sample Event 6 4/3/1991 MW-5 9.100E-01 1194.0 -5.06E-02 5.547E-27 Yes Yes Sample Event 6 4/3/1991 MW-6 1.000E-03 1267.0 -5.06E-02 1.521E-31 Yes Yes Sample Event 6 4/3/1991 MW-7 1.000E-03 1277.0 -5.06E-02 9.177E-32 Yes Yes Sample Event 6 4/3/1991 MW-8 1.000E-03 1245.0 -5.06E-02 4.627E-31 Yes Yes Sample Event 7 7/10/1991 MW-1 1.700E+00 1177.0 -4.57E-02 7.852E-24 Yes Yes Sample Event 7 7/10/1991 MW-12 3.000E-02 1090.0 -4.57E-02 7.354E-24 Yes Yes Sample Event 7 7/10/1991 MW-13 2.900E-02 1125.0 -4.57E-02 1.438E-24 Yes Yes Sample Event 7 7/10/1991 MW-14 1.000E-03 1088.0 -4.57E-02 2.686E-25 Yes Yes Sample Event 7 7/10/1991 MW-15 1.000E-03 1000.0 -4.57E-02 1.492E-23 Yes Yes Sample Event 7 7/10/1991 MW-2 1.000E-03 1192.0 -4.57E-02 2.329E-27 Yes Yes Sample Event 7 7/10/1991 MW-3 1.100E-01 1155.0 -4.57E-02 1.387E-24 Yes Yes Sample Event 7 7/10/1991 MW-4 1.400E-02 1135.0 -4.57E-02 4.399E-25 Yes Yes Sample Event 7 7/10/1991 MW-5 2.500E+00 1194.0 -4.57E-02 5.314E-24 Yes Yes Sample Event 7 7/10/1991 MW-6 1.000E-03 1267.0 -4.57E-02 7.589E-29 Yes Yes Sample Event 7 7/10/1991 MW-7 1.000E-03 1277.0 -4.57E-02 4.807E-29 Yes Yes Sample Event 7 7/10/1991 MW-8 1.000E-03 1245.0 -4.57E-02 2.072E-28 Yes Yes Sample Event 8 10/3/1991 MW-1 8.000E-01 1177.0 -3.83E-02 2.234E-20 Yes Yes Sample Event 8 10/3/1991 MW-12 2.800E-02 1090.0 -3.83E-02 2.181E-20 Yes Yes Sample Event 8 10/3/1991 MW-13 3.500E-02 1125.0 -3.83E-02 7.145E-21 Yes Yes Sample Event 8 10/3/1991 MW-14 1.000E-03 1088.0 -3.83E-02 8.407E-22 Yes Yes Sample Event 8 10/3/1991 MW-15 1.000E-03 1000.0 -3.83E-02 2.436E-20 Yes Yes Sample Event 8 10/3/1991 MW-2 5.000E-03 1192.0 -3.83E-02 7.867E-23 Yes Yes Sample Event 8 10/3/1991 MW-3 1.100E-01 1155.0 -3.83E-02 7.127E-21 Yes Yes Sample Event 8 10/3/1991 MW-4 5.500E-02 1135.0 -3.83E-02 7.659E-21 Yes Yes Sample Event 8 10/3/1991 MW-5 2.700E+00 1194.0 -3.83E-02 3.935E-20 Yes Yes Sample Event 8 10/3/1991 MW-6 1.000E-03 1267.0 -3.83E-02 8.930E-25 Yes Yes Sample Event 8 10/3/1991 MW-7 1.000E-03 1277.0 -3.83E-02 6.091E-25 Yes Yes Sample Event 8 10/3/1991 MW-8 1.000E-03 1245.0 -3.83E-02 2.072E-24 Yes Yes Sample Event 9 5/2/1992 MW-1 2.500E-01 1177.0 -3.53E-02 2.216E-19 Yes Yes Sample Event 9 5/2/1992 MW-12 1.100E-02 1090.0 -3.53E-02 2.106E-19 Yes Yes Sample Event 9 5/2/1992 MW-13 8.000E-03 1125.0 -3.53E-02 4.449E-20 Yes Yes Sample Event 9 5/2/1992 MW-14 1.000E-03 1088.0 -3.53E-02 2.054E-20 Yes Yes Sample Event 9 5/2/1992 MW-15 1.000E-03 1000.0 -3.53E-02 4.596E-19 Yes Yes Sample Event 9 5/2/1992 MW-2 1.000E-02 1192.0 -3.53E-02 5.218E-21 Yes Yes Sample Event 9 5/2/1992 MW-3 6.400E-02 1155.0 -3.53E-02 1.234E-19 Yes Yes Sample Event 9 5/2/1992 MW-4 6.000E-03 1135.0 -3.53E-02 2.344E-20 Yes Yes BENZENE MAROS Version 2, 2002, AFCEE Thursday, November 20, 2003 Page 3 of 6 Project: Example User Name: Meng Location: Service Station State: Texas Sampling Event Observed Concentration (mg/L) Distance Down Centerline (ft) Regression Coefficient (1/ft) Projected Below Concentration Detection Used in Analysis? (mg/L) Limit? Effective Date Well Sample Event 9 5/2/1992 MW-5 2.200E+00 1194.0 -3.53E-02 1.070E-18 Yes Yes Sample Event 9 5/2/1992 MW-6 1.000E-03 1267.0 -3.53E-02 3.692E-23 Yes Yes Sample Event 9 5/2/1992 MW-7 1.000E-03 1277.0 -3.53E-02 2.593E-23 Yes Yes Sample Event 9 5/2/1992 MW-8 1.000E-03 1245.0 -3.53E-02 8.029E-23 Yes Yes Sample Event 10 1/11/1994 MW-1 2.200E-01 1177.0 -4.33E-02 1.585E-23 Yes Yes Sample Event 10 1/11/1994 MW-12 5.000E-03 1090.0 -4.33E-02 1.560E-23 Yes Yes Sample Event 10 1/11/1994 MW-13 1.000E-03 1125.0 -4.33E-02 6.851E-25 Yes Yes Sample Event 10 1/11/1994 MW-14 1.000E-03 1088.0 -4.33E-02 3.403E-24 Yes Yes Sample Event 10 1/11/1994 MW-15 1.000E-03 1000.0 -4.33E-02 1.539E-22 Yes Yes Sample Event 10 1/11/1994 MW-2 2.000E-03 1192.0 -4.33E-02 7.522E-26 Yes Yes Sample Event 10 1/11/1994 MW-3 1.100E-02 1155.0 -4.33E-02 2.055E-24 Yes Yes Sample Event 10 1/11/1994 MW-4 1.800E-02 1135.0 -4.33E-02 7.996E-24 Yes Yes Sample Event 10 1/11/1994 MW-5 1.200E+00 1194.0 -4.33E-02 4.139E-23 Yes Yes Sample Event 10 1/11/1994 MW-6 1.000E-03 1267.0 -4.33E-02 1.460E-27 Yes Yes Sample Event 10 1/11/1994 MW-7 1.000E-03 1277.0 -4.33E-02 9.467E-28 Yes Yes Sample Event 10 1/11/1994 MW-8 1.000E-03 1245.0 -4.33E-02 3.786E-27 Yes Yes Sample Event 11 5/28/1996 MW-1 3.540E-01 1177.0 -6.76E-02 9.695E-36 Yes Yes Sample Event 11 5/28/1996 MW-12 1.000E-03 1090.0 -6.76E-02 9.824E-36 Yes Yes Sample Event 11 5/28/1996 MW-13 1.000E-03 1125.0 -6.76E-02 9.216E-37 Yes Yes Sample Event 11 5/28/1996 MW-14 1.000E-03 1088.0 -6.76E-02 1.125E-35 Yes Yes Sample Event 11 5/28/1996 MW-15 1.000E-03 1000.0 -6.76E-02 4.317E-33 Yes Yes Sample Event 11 5/28/1996 MW-2 1.000E-03 1192.0 -6.76E-02 9.933E-39 Yes Yes Sample Event 11 5/28/1996 MW-3 1.000E-02 1155.0 -6.76E-02 1.212E-36 Yes Yes Sample Event 11 5/28/1996 MW-4 3.700E-02 1135.0 -6.76E-02 1.734E-35 Yes Yes Sample Event 11 5/28/1996 MW-5 6.780E-01 1194.0 -6.76E-02 5.883E-36 Yes Yes Sample Event 11 5/28/1996 MW-6 1.000E-03 1267.0 -6.76E-02 6.233E-41 Yes Yes Sample Event 11 5/28/1996 MW-7 1.000E-03 1277.0 -6.76E-02 3.170E-41 Yes Yes Sample Event 11 5/28/1996 MW-8 1.000E-03 1245.0 -6.76E-02 2.759E-40 Yes Yes Sample Event 12 6/27/1997 MW-1 4.600E-02 1177.0 -4.44E-02 9.666E-25 Yes Yes Sample Event 12 6/27/1997 MW-12 1.000E-03 1090.0 -4.44E-02 9.970E-25 Yes Yes Sample Event 12 6/27/1997 MW-13 1.000E-03 1125.0 -4.44E-02 2.110E-25 Yes Yes Sample Event 12 6/27/1997 MW-14 1.000E-03 1088.0 -4.44E-02 1.090E-24 Yes Yes Sample Event 12 6/27/1997 MW-15 1.000E-03 1000.0 -4.44E-02 5.405E-23 Yes Yes Sample Event 12 6/27/1997 MW-2 1.000E-03 1192.0 -4.44E-02 1.080E-26 Yes Yes Sample Event 12 6/27/1997 MW-3 3.000E-03 1155.0 -4.44E-02 1.673E-25 Yes Yes Sample Event 12 6/27/1997 MW-4 2.800E-02 1135.0 -4.44E-02 3.792E-24 Yes Yes BENZENE MAROS Version 2, 2002, AFCEE Thursday, November 20, 2003 Page 4 of 6 Project: Example User Name: Meng Location: Service Station State: Texas Sampling Event Observed Concentration (mg/L) Distance Down Centerline (ft) Regression Coefficient (1/ft) Projected Below Concentration Detection Used in Analysis? (mg/L) Limit? Effective Date Well Sample Event 12 6/27/1997 MW-5 6.230E-01 1194.0 -4.44E-02 6.158E-24 Yes Yes Sample Event 12 6/27/1997 MW-6 1.000E-03 1267.0 -4.44E-02 3.876E-28 Yes Yes Sample Event 12 6/27/1997 MW-7 1.000E-03 1277.0 -4.44E-02 2.487E-28 Yes Yes Sample Event 12 6/27/1997 MW-8 1.000E-03 1245.0 -4.44E-02 1.029E-27 Yes Yes Sample Event 13 12/10/1997 MW-1 3.600E-02 1177.0 -4.10E-02 4.013E-23 Yes Yes Sample Event 13 12/10/1997 MW-12 1.000E-03 1090.0 -4.10E-02 3.944E-23 Yes Yes Sample Event 13 12/10/1997 MW-13 5.200E-04 1125.0 -4.10E-02 4.885E-24 Yes Yes Sample Event 13 12/10/1997 MW-14 1.000E-03 1088.0 -4.10E-02 4.280E-23 Yes Yes Sample Event 13 12/10/1997 MW-15 1.000E-03 1000.0 -4.10E-02 1.578E-21 Yes Yes Sample Event 13 12/10/1997 MW-2 1.000E-03 1192.0 -4.10E-02 6.027E-25 Yes Yes Sample Event 13 12/10/1997 MW-3 1.000E-03 1155.0 -4.10E-02 2.746E-24 Yes Yes Sample Event 13 12/10/1997 MW-4 3.000E-03 1135.0 -4.10E-02 1.870E-23 Yes Yes Sample Event 13 12/10/1997 MW-5 3.630E-01 1194.0 -4.10E-02 2.016E-22 Yes Yes Sample Event 13 12/10/1997 MW-6 1.000E-03 1267.0 -4.10E-02 2.786E-26 Yes Yes Sample Event 13 12/10/1997 MW-7 1.000E-03 1277.0 -4.10E-02 1.849E-26 Yes Yes Sample Event 13 12/10/1997 MW-8 1.000E-03 1245.0 -4.10E-02 6.864E-26 Yes Yes Sample Event 14 6/19/1998 MW-1 1.140E-02 1177.0 -2.83E-02 3.732E-17 Yes Yes Sample Event 14 6/19/1998 MW-12 1.000E-03 1090.0 -2.83E-02 3.852E-17 Yes Yes Sample Event 14 6/19/1998 MW-13 1.000E-03 1125.0 -2.83E-02 1.429E-17 Yes Yes Sample Event 14 6/19/1998 MW-14 1.000E-03 1088.0 -2.83E-02 4.077E-17 Yes Yes Sample Event 14 6/19/1998 MW-15 1.000E-03 1000.0 -2.83E-02 4.936E-16 Yes Yes Sample Event 14 6/19/1998 MW-2 1.000E-03 1192.0 -2.83E-02 2.140E-18 Yes Yes Sample Event 14 6/19/1998 MW-3 2.000E-03 1155.0 -2.83E-02 1.221E-17 Yes Yes Sample Event 14 6/19/1998 MW-4 1.400E-02 1135.0 -2.83E-02 1.507E-16 Yes Yes Sample Event 14 6/19/1998 MW-5 6.800E-02 1194.0 -2.83E-02 1.375E-16 Yes Yes Sample Event 14 6/19/1998 MW-6 1.000E-03 1267.0 -2.83E-02 2.555E-19 Yes Yes Sample Event 14 6/19/1998 MW-7 1.000E-03 1277.0 -2.83E-02 1.925E-19 Yes Yes Sample Event 14 6/19/1998 MW-8 1.000E-03 1245.0 -2.83E-02 4.767E-19 Yes Yes Sample Event 15 12/19/1998 MW-1 1.900E-03 1177.0 -7.29E-03 3.568E-07 Yes Yes Sample Event 15 12/19/1998 MW-12 1.000E-03 1090.0 -7.29E-03 3.541E-07 Yes Yes Sample Event 15 12/19/1998 MW-13 1.000E-03 1125.0 -7.29E-03 2.743E-07 Yes Yes Sample Event 15 12/19/1998 MW-14 1.000E-03 1088.0 -7.29E-03 3.593E-07 Yes Yes Sample Event 15 12/19/1998 MW-15 1.000E-03 1000.0 -7.29E-03 6.824E-07 Yes Yes Sample Event 15 12/19/1998 MW-2 1.000E-03 1192.0 -7.29E-03 1.683E-07 Yes Yes Sample Event 15 12/19/1998 MW-3 1.000E-03 1155.0 -7.29E-03 2.204E-07 Yes Yes Sample Event 15 12/19/1998 MW-4 1.000E-03 1135.0 -7.29E-03 2.550E-07 Yes Yes BENZENE MAROS Version 2, 2002, AFCEE Thursday, November 20, 2003 Page 5 of 6 Project: Example User Name: Meng Location: Service Station State: Texas Sampling Event Observed Concentration (mg/L) Distance Down Centerline (ft) Regression Coefficient (1/ft) Projected Below Concentration Detection Used in Analysis? (mg/L) Limit? Effective Date Well Sample Event 15 12/19/1998 MW-5 1.520E-02 1194.0 -7.29E-03 2.522E-06 Yes Yes Sample Event 15 12/19/1998 MW-6 1.000E-03 1267.0 -7.29E-03 9.743E-08 Yes Yes Sample Event 15 12/19/1998 MW-7 1.000E-03 1277.0 -7.29E-03 9.058E-08 Yes Yes Sample Event 15 12/19/1998 MW-8 1.000E-03 1245.0 -7.29E-03 1.144E-07 Yes Yes BENZENE Note: Projected Concentrations that are below the user-specified detection limit are indicated by a check mark to its right; for sampling events with less than 3 selected plume centerline wells, NO projected concentrations are calculated because no regression coefficient is available. MAROS Version 2, 2002, AFCEE Thursday, November 20, 2003 Page 6 of 6 MAROS Power Analysis for Individual Well Cleanup Status Project: Example User Name: Meng Location: Service Station State: Texas From Period: 4/3/1991 Well to 12/19/1998 Sample Sample Szie Mean BENZENE Sample Stdev. Normal Distribution Assumption Cleanup Status Lognormal Distribution Assumption Cleanup Status Alpha Level Cleanup Goal (mg/L) = 0.005 Target Level (mg/L) = 0.004 Expected Power MW-1 6 3.90E-01 5.44E-01 Cont Sampling Cont Sampling 0.05 0.8 MW-12 6 7.61E-03 1.01E-02 Cont Sampling Cont Sampling 0.05 0.8 MW-13 6 6.57E-03 1.07E-02 Cont Sampling Cont Sampling 0.05 0.8 MW-14 6 1.00E-03 1.50E-11 Attained Attained 0.05 0.8 MW-15 6 1.00E-03 1.50E-11 Attained Attained 0.05 0.8 MW-2 6 2.89E-03 3.53E-03 Cont Sampling Cont Sampling 0.05 0.8 MW-3 6 3.53E-02 4.91E-02 Cont Sampling Cont Sampling 0.05 0.8 MW-4 6 1.87E-02 1.20E-02 Cont Sampling Cont Sampling 0.05 0.8 MW-5 6 1.11E+00 8.68E-01 Cont Sampling Cont Sampling 0.05 0.8 MW-6 6 1.00E-03 1.50E-11 Attained Attained 0.05 0.8 MW-7 6 1.00E-03 1.50E-11 Attained Attained 0.05 0.8 MW-8 6 1.00E-03 1.50E-11 Attained Attained 0.05 0.8 Note: N/C refers to "not conducted" because of insufficient data (N<4); S/E indicates the sample mean significantly exceeds the cleanup level and thus no analysis is conducted; Sample Size is the number of concentration data in a sampling location that are used in the analysis; The Target Level is the expected mean concentration in wells after cleanup attainment, it is only used in individual well celanup status evaluation. The test for evaluating attainment status is from EPA (1992). Refer to Appendix A.6 of MAROS Manual for details. MAROS Version 2, 2002, AFCEE Thursday, November 20, 2003 Page 1 of 1 MAROS Risk-Based Power Analysis for Site Cleanup Project: Example User Name Location: Service Station State: Texas Groundwater Flow Direction: 0 degrees Parameters: From Period: Sample Event 1 Distance to Receptor: 1000 feet to Sample Event 15 10/4/1988 Selected Plume Centerline Wells: Meng 12/19/1998 Well Distance to Receptor (feet) MW-12 1090.0 MW-4 1135.0 MW-1 1177.0 The distance is measured in the Groundwater Flow Angle from the well to the compliance boundary. Sample Event Sample Sample Sample Szie Mean Stdev. BENZENE Normal Distribution Assumption Lognormal Distribution Assumption Cleanup Status Celanup Status Power Expected Sample Size Expected Power Sample Size Alpha Expected Level Power Cleanup Goal = 0.005 Sample Event 1 12 1.30E-15 1.76E-15 Attained 1.000 <=3 Attained 1.000 <=3 0.05 0.8 Sample Event 2 12 1.41E-22 1.41E-22 Attained 1.000 <=3 Attained 1.000 <=3 0.05 0.8 Sample Event 3 12 5.12E-17 7.09E-17 Attained 1.000 <=3 Attained 1.000 <=3 0.05 0.8 Sample Event 4 12 3.84E-15 5.90E-15 Attained 1.000 <=3 Attained 1.000 <=3 0.05 0.8 Sample Event 5 12 1.14E-23 1.50E-23 Attained 1.000 <=3 Attained 1.000 <=3 0.05 0.8 Sample Event 6 12 1.52E-26 3.16E-26 Attained 1.000 <=3 Attained 1.000 <=3 0.05 0.8 Sample Event 7 12 3.25E-24 4.71E-24 Attained 1.000 <=3 Attained 1.000 <=3 0.05 0.8 Sample Event 8 12 1.09E-20 1.30E-20 Attained 1.000 <=3 Attained 1.000 <=3 0.05 0.8 Sample Event 9 12 1.82E-19 3.12E-19 Attained 1.000 <=3 Attained 1.000 <=3 0.05 0.8 Sample Event 10 12 2.01E-23 4.38E-23 Attained 1.000 <=3 Attained 1.000 <=3 0.05 0.8 Sample Event 11 12 3.64E-34 1.24E-33 Attained 1.000 <=3 Attained 1.000 <=3 0.05 0.8 Sample Event 12 12 5.62E-24 1.54E-23 Attained 1.000 <=3 Attained 1.000 <=3 0.05 0.8 Sample Event 13 12 1.61E-22 4.50E-22 Attained 1.000 <=3 Attained 1.000 <=3 0.05 0.8 Sample Event 14 12 7.73E-17 1.41E-16 Attained 1.000 <=3 Attained 1.000 <=3 0.05 0.8 Sample Event 15 12 4.58E-07 6.70E-07 Attained 1.000 <=3 Attained 1.000 <=3 0.05 0.8 Note: #N/C means "not conducted" due to a small sample size (N<4) or that the mean concentration is much greater than the cleanup level; Sample Size is the number of sampling locations used in the power analysis; Expected Sample Size is the number of concentration data needed to reach the Expected Power under current sample variability. MAROS Version 2, 2002, AFCEE Thursday, November 20, 2003 Page 1 of 1 AFCEE MONITORING AND REMEDIATION OPTIMIZATION SYSTEM SOFTWARE APPENDIX A.11 MAROS TUTORIAL Authors: Aziz, J. J., Groundwater Services, Inc.; Ling, M., University of Houston Objective This tutorial has been set up to guide the user through the most commonly used features of the MAROS software. The MAROS 2.1 software used to optimize the long-term monitoring (LTM) network at the Service Station site is explained in general terms in this Appendix. The software will be used to optimize the monitoring network and sampling plan at a hypothetical service station site where the groundwater is affected by BTEX compounds (Figure A.11.1). The general objective of the tutorial is to optimize the Service Station long-term monitoring network and sampling plan applying the MAROS 2.1 statistical and decision support methodology. The key objectives of the tutorial include familiarizing the user with typical applications of the MAROS software to a hypothetical site: • • • • • To determine the overall plume stability through trend analysis and moment analysis; To evaluate individual well benzene concentration trends over time; To reduce, if possible, redundant wells without information loss and addition of new wells for future sampling; To provide future sampling frequency recommendations while maintaining sufficient plume stability information; To evaluate risk-based site cleanup status using data sufficiency analysis. MAROS is a collection of tools in one software package that is used in an explanatory, nonlinear fashion. The tool includes models, statistics, heuristic rules, and empirical relationships to assist the user in optimizing a groundwater monitoring network system while maintaining adequate delineation of the plume as well as knowledge of the plume state over time. Different users utilize the tool in different ways and interpret the results from a different viewpoint. Therefore, it is important to not only have a conceptual model (see Appendix A.1) for the site before beginning the MAROS analysis, but to also assess all of the MAROS results in conjunction with knowledge of site conditions, regulatory framework, community issues, and other site specific situations. Also, the MAROS methodology assumes that the current sampling network adequately delineates the plume (bounding wells have non-detect values) and that if a hydraulic containment system and/or remediation system is currently in operation, this will continue. For a more detailed description of the structure of the software and further utilities, refer to the Appendices 1 10. The goal of the tutorial is to show the user tips and pitfalls when applying MAROS at a typical site. The tutorial example has been used only to illustrate the utilities of the MAROS software, it is by no means a complete site analysis. Version 2.1 October 2004 A.11-1 Air Force Center for Environmental Excellence AFCEE MONITORING AND REMEDIATION OPTIMIZATION SYSTEM SOFTWARE Note: The MAROS software can be used to analyze sites more complex than this example, with many more wells, more sampling data and more complex geology. For instance, if a site has co-mingled plumes, typically the plume networks should be analyzed separately for the different constituents. If the site has more than one aquifer affected by contaminants, the well networks for each should be analyzed separately. In general, the MAROS method applies to 2-D aquifers that have relatively simple site hydrogeology. However, for a multi-layered (3-D) system, the user should apply the statistical analysis layer-by-layer. Version 2.1 October 2004 A.11-2 Air Force Center for Environmental Excellence AFCEE MONITORING AND REMEDIATION OPTIMIZATION SYSTEM SOFTWARE Site Details The primary constituent of concern at the Service Station site is benzene, which is analyzed at 12 monitoring wells in the Upper Aquifer well network (Figure A.11.1). The site has 10 years of approximately semi-annual sampling data. All monitoring wells have been sampled semi-annually in the Upper Aquifer for BTEX since the implementation of the original long-term monitoring plan. The historical benzene data for all or in some cases, a subset, of wells were analyzed using the MAROS 2.1 software in order to: 1) assess plume stability, and 2) recommend changes in sampling frequency and sampling locations without compromising the effectiveness of the long-term monitoring network. FIGURE A.11.1 EXAMPLE SITE: SERVICE STATION MONITORING WELL LOCATIONS Version 2.1 October 2004 A.11-3 Air Force Center for Environmental Excellence AFCEE MONITORING AND REMEDIATION OPTIMIZATION SYSTEM SOFTWARE Geology/Hydrogeology The shallow geologic unit under the Service Station (known as the Upper Aquifer) consists primarily of sand and gravel. The Upper Aquifer has an approximate saturated thickness of 12 feet. The groundwater flow direction is predominantly toward the East and the groundwater seepage velocity is approximately 92 ft/yr. Parameter Value Seepage Velocity Effective Porosity Approximate Zone A Source Location Approximate Saturated Thickness 92 ft/yr 30% Near Well MW-1 12 ft General Groundwater Flow Direction East TABLE A.11.1 EXAMPLE SITE: SERVICE STATION SITE PARAMETERS Remedial Action and Long-Term Monitoring A site investigation of the service station was performed in 1986 and the results showed that the groundwater plume in the shallow Upper Aquifer principally contains benzene and is 270 ft long, approximately 150 feet wide. The plume also contains ethylbenzene, toluene, and xylenes at concentrations above the MCL level. According to the results of the site investigation, a leaking underground storage tank is the source of benzene. Nonaqueous-phase liquid (NAPL) was found in the “source area” and the leaking tank was removed along with excavating the contaminated soil. The area that extends from the edge of the property across Sunnyville Street (MW-15) is designated as the “down-gradient area”. The land used for this area is retail businesses. Well Version 2.1 October 2004 MW-1 Well Type 3 MW Well Category 5 S MW-2 MW S MW-3 MW S MW-4 MW T MW-5 MW S MW-6 MW S MW-7 MW S MW-8 MW S MW-9 MW T MW-10 MW T MW-11 MW T MW-12 MW T MW-13 MW T MW-14 MW T MW-15 MW T A.11-4 Air Force Center for Environmental Excellence AFCEE MONITORING AND REMEDIATION OPTIMIZATION SYSTEM SOFTWARE Note: MW = Monitoring Well, S = Source Zone Well; T = Tail Zone Well TABLE A.11.2 EXAMPLE SITE: SERVICE STATION WELL CATEGORIES The regulatory agency involved with the site concluded that Monitored Natural Attenuation would be an adequate remediation remedy for the site due to the size of the plume and its distance from any receptors. The original groundwater long-term monitoring plan was completed in 1998. It consisted of compliance monitoring with the goal of plume reduction monitoring to verify progress toward achieving cleanup goals over a 30 year period. The number of monitoring wells that were sampled in the original Upper Aquifer monitoring network is 15 (Figure A.11.1). All monitoring wells have been sampled semi-annually in the Upper Aquifer for BTEX since the implementation of the original longterm monitoring plan. Between 1988 and 1998, 15 sampling events had been carried out at the site. Version 2.1 October 2004 A.11-5 Air Force Center for Environmental Excellence AFCEE MONITORING AND REMEDIATION OPTIMIZATION SYSTEM SOFTWARE Start Using MAROS STEP 1: INSTALLATION If the MAROS software is not already installed on your computer, follow the instructions on page 3 of the User Manual. STEP 2: START MAROS To start using the software, go to the subdirectory where MAROS is installed (e.g. C:\AFCEE_MAROS\) and double click on the "afcee_MAROS_v2.mdb" file. The Start Screen will be displayed. Double click here STEP 3: ENTER USER INFORMATION The Start Screen gives the user access to the software system. Enter the following information as User Name and Project Name in the boxes to the left of the Start Button: • • User Name: Enter your name Project Name: “Tutorial” Click the “Start” button when finished. Enter details here Click here Version 2.1 October 2004 A.11-6 Air Force Center for Environmental Excellence AFCEE MONITORING AND REMEDIATION OPTIMIZATION SYSTEM SOFTWARE Importing Data STEP 1: MAIN MENU The Main screen serves at the center of the user interface. The user progressively steps through the Compliance Monitoring Trend Analysis and Optimization Evaluation process by navigating through the options displayed. As individual steps of the process are completed, options to select become successively available. The Main Menu screen allows the user to choose between performing: • • • • • Click here to proceed Step 1: Data Management Step 2: Site Details Step 3: Plume Analysis Step 4: Sampling Optimization Step 5: MAROS Output Click on the “Data Management” button to continue. The Data Management Menu will appear. STEP 2: DATA MANAGEMENT MENU The Data Management Menu is used to perform database operations such as importing, manual data addition and archiving. These operations are used initially to import site data into the software in order to perform analysis. For this tutorial analytical data will be imported from an Excel spreadsheet “TutorialExampleData.xls”. Site details will be entered manually in later screens. Select “Import New Data” from the Data Management Menu. Click here to proceed Note: Typically the first time through the MAROS software the user will have to utilize the “Import New Data” option, where you can import raw electronic data from an Excel File or Access File. The first time the data is entered, the user can save the data as an archive file for future use. The archive file can store analytical data and site details. Refer to Appendix A.9 for import file formats. Also, see example import file MAROS_ExcelImportTemplate.xls. Version 2.1 October 2004 A.11-7 Air Force Center for Environmental Excellence AFCEE MONITORING AND REMEDIATION OPTIMIZATION SYSTEM SOFTWARE STEP 3: IMPORT NEW DATA The Import New Data screen is used to import electronic data files. To import archived data into the full database: 1) Enter the full file path and the filename of the archived file to import: Click here Folder: “C:\AFCEE_MAROS\” File Name: “TutorialExampleData.xls” Enter details here Select Note: The “Browse” button can also be used to locate the import file. 2) Click the “Import” button to proceed with importing the file to the existing database. A screen will be displayed showing the total number of wells and the dates range of sample events. Important: Check the number of wells and date range to make sure all data was recognized! Click “OK” to proceed. Click here The Import New Data screen will be displayed again. 3) From Import New Data screen, click “Back” to return to the Data Management Menu screen. Click here to proceed Version 2.1 October 2004 A.11-8 Air Force Center for Environmental Excellence AFCEE MONITORING AND REMEDIATION OPTIMIZATION SYSTEM SOFTWARE 4) From the Data Management Menu screen, click on “Main Menu” to return to the Main Menu screen. Click here to proceed The site data file will now have been imported from the Excel file. The next stage is to define the site details. Version 2.1 October 2004 A.11-9 Air Force Center for Environmental Excellence AFCEE MONITORING AND REMEDIATION OPTIMIZATION SYSTEM SOFTWARE Site Details Step 2, Site Details allows initial definition of site specific data including choosing the “Source” and “Tail” wells, sample events and providing site-specific Constituents of Concern (COC’s). STEP 1: MAIN MENU Select “Site Details” from the Main Menu. The Site Information screen will be displayed. Click here to proceed STEP 2: SITE INFORMATION Site Information is the first step in defining the site type as well as parameters unique to the site. Site details were outlined at the start of the tutorial. The following information will need to be entered on the Site Information screen: Under General enter: Enter details here Under Hydrogeology and Plume Information enter: • • • • • • Location: “Service Station” State: “Texas” Enter details here Seepage Velocity: “92” ft/yr Main Constituents: “BTEX” Current Plume Width: “150” ft Current Plume Length: “270” ft Version 2.1 October 2004 A.11-10 Air Force Center for Environmental Excellence AFCEE MONITORING AND REMEDIATION OPTIMIZATION SYSTEM SOFTWARE • • Maximum Plume Length: “270” ft GW Fluctuations: Select “Yes” Version 2.1 October 2004 A.11-11 Air Force Center for Environmental Excellence AFCEE MONITORING AND REMEDIATION OPTIMIZATION SYSTEM SOFTWARE Under Source Information select: Click here • Free Phase NAPL Present: “No” • Current Source Treatment: Click on down arrow to obtain list of choices. Scroll down to select “No Current Site Treatment”. Select Under Down-gradient Information enter: • “1000” ft for all 4 boxes Select “Next” to continue. The Sample Events screen will appear. Enter details here STEP 3: SAMPLE EVENTS Sample Events allows the user to define sample events and dates to be used for graphing and data consolidation. This grouping of individual sample days is important for the MAROS analysis to be performed. Typically a sample event will last 1-2 weeks, depending on how long it takes to sample all the wells at a site, and be performed on a quarterly, semi-annual, or annual basis. The Effective Date is selected by the user as representative of the sample event, e.g. sample event start date. The Auto Event option is used to automatically set up sample events as unique for each sample date. This is appropriate only for a small site where all sampling can be completed on one day, i.e. one date per sampling event. To define sample events, to the right of the heading Sample Events in Database click on “Auto Event”. A list of all the sample events in the dataset will appear in the green boxes. Click the “Next” button to proceed to the Source Tail Selection screen. Version 2.1 October 2004 A.11-12 Air Force Center for Environmental Excellence AFCEE MONITORING AND REMEDIATION OPTIMIZATION SYSTEM SOFTWARE Click here to proceed STEP 4: SOURCE/TAIL ZONE SELECTION Source/Tail Zone Selection allows the user to define the well type for the wells in the database. The MAROS software divides the wells for the site into two different zones (e.g. “Source” zone and “Tail” zone). The “Source” area includes zones with free-phase NAPLs, residual NAPL, contaminated vadose zone soils, and/or other source materials. The source area is generally the location with the highest groundwater concentrations of constituents of concern. The source zone wells for this site include MW-1, MW-2, MW-3, MW-5, MW-6, MW-7, and MW-5 (Figure A.11.1). The downgradient groundwater plume (“Tail”) zone is the area downgradient of the contaminant source zone. The Tail only contains contaminants in the dissolved phase and the sorbed phase, but contains no sources of contamination. The tail wells for this site include, MW-4, MW-12, MW-13, MW-14 and MW-15 (Figure A.11.1). Assign well categories as being in "Source" or "Tail" zones (Table A.11.2). To do this click on the appropriate “Source” or “Tail” box adjacent to each well. Use the scroll bar to the right of the box to view all wells. Select “Next” to continue. Coordinates screen will appear. The Well Click here to proceed Version 2.1 October 2004 A.11-13 Air Force Center for Environmental Excellence AFCEE MONITORING AND REMEDIATION OPTIMIZATION SYSTEM SOFTWARE STEP 5: WELL COORDINATES Well Coordinates allows the user to define and/or revise the well coordinates if they were not defined in the import file. Well coordinates are mandatory and should be in feet (e.g. State Plane coordinates or arbitrary site coordinates). Well coordinates will have already been specified. Select the button “Well Map” to view the well location map. Click here Well Locations allows the user to review the well coordinates in their relative locations. Select “Back” to continue. The Coordinates screen will re-appear. Well Click here From the Well Coordinates screen, select “Next” to continue. The Constituents of Concern Decision screen will appear. Version 2.1 October 2004 A.11-14 Air Force Center for Environmental Excellence AFCEE MONITORING AND REMEDIATION OPTIMIZATION SYSTEM SOFTWARE Click here to proceed Version 2.1 October 2004 A.11-15 Air Force Center for Environmental Excellence AFCEE MONITORING AND REMEDIATION OPTIMIZATION SYSTEM SOFTWARE STEP 6: CONSTITUENTS OF CONCERN Constituents of Concern Decision allows the user to define up to five constituents to be evaluated at the site. Typically the only constituent which needs to be defined is the indicator for the site. The site used for this tutorial has 4 COCs (benzene, ethylbenzene, toluene and xylenes), of which benzene will be used as the indicator compound for the plume. All boxes will initially be blank. Click here for choices Click on the arrow to the right of the top box to display a list of COCs. Select benzene by clicking on “benzene”. Select The top box should now have “benzene” displayed as shown. Click “Next” to proceed. Click here to proceed Note: The other drop down boxes can be used to change the COC or to select up to 4 additional COCs. To view a list of suggested COCs click on the button "Recommended COCs". This will result in a summarized list of COC recommendations from the available dataset as well as a detailed view of the process used to make the COC recommendation. For example, the user can choose a preliminary remediation goal (PRG) to screen representative concentrations from the dataset. The user can either select the appropriate clean-up standard (Region 3, Region 9 or TCEQ) or custom goals can be specified. There is also an option to have a detailed view of the process used to make the COC recommendation, according to toxicity, prevalence or mobility. Version 2.1 October 2004 A.11-16 Air Force Center for Environmental Excellence AFCEE MONITORING AND REMEDIATION OPTIMIZATION SYSTEM SOFTWARE STEP 7: VIEWING DATA The Initial Data Table allows the user to view the initial data table with the COCs chosen as well as the sample events defined and effective dates. This table is not available for editing. Select “Next” to continue. The Site Details Complete screen will appear. Click here to proceed At this point your data has been imported, the wells have been divided into source and tail zones, and the constituents of concern have been selected. Click on “Continue to Step 3” to proceed to Trend Analysis to analyze the plume behavior. The Main Menu screen will be displayed. Click here to proceed Note: There is also an option to create an archive file of the site details which have been entered, “Create MAROS Archive File”. The user can continue to the analysis stage at a later time by re-importing the archive created. Version 2.1 October 2004 A.11-17 Air Force Center for Environmental Excellence AFCEE MONITORING AND REMEDIATION OPTIMIZATION SYSTEM SOFTWARE Plume Analysis Step 3, Plume Analysis allows the user to perform data reduction as well as trend analysis through both Statistical Plume Analysis, Spatial Moment Analysis, and External Plume Information. It also allows the user to apply final Analysis Consolidation to the trend results. STEP 1: PLUME ANALYSIS Select “Plume Analysis” from the Main Menu. The Plume Analysis Menu will be displayed. Click here to proceed The Plume Analysis Menu screen serves at the center of the trend analysis user interface. The user progressively steps through the Long Term Monitoring Plume Analysis process by navigating through the options displayed. As individual steps of the process are completed, options to select become successively available. The Plume Analysis Menu screen allows the user to choose between performing: • • • • • Version 2.1 October 2004 Step 3a: Data Consolidation Step 3b: Statistical Plume Analysis Step 3c: Spatial Moment Analysis Step 3d: External Plume Information Step 3e: MAROS Analysis A.11-18 Air Force Center for Environmental Excellence AFCEE MONITORING AND REMEDIATION OPTIMIZATION SYSTEM SOFTWARE STEP 2: DATA CONSOLIDATION Data consolidation allows the reduction of data based on dates as well as consolidating duplicates based on statistical functions (i.e. average, median, etc.). This step also allows for assigning values to non-detects and J flag data. 1) From the Plume Analysis Menu, select the “Step 3a: Data Consolidation” option. The Data Reduction: Part 1 of 2 menu will appear. Click here to proceed 2) The Data Reduction: Part 1 of 2 menu allows the user to consolidate the data based on time intervals and parameters chosen. The “Period of Interest” option allows the user to specify which time period will be considered. The “Data Consolidation” option is used to define the time period to consider within the dataset and to define the representative statistical dataset within the consolidated time interval. For this tutorial, the full dataset will be used and no data consolidation will be performed. This is appropriate for the small size of the dataset. Under the heading “Period of Interest” the two empty text boxes should be left blank. This means that the full dataset will be used. Under the heading “Data Consolidation” the first option “Do Not Perform Time Consolidation” should remain selected. Select “Next” to proceed to the Data Reduction: Part 2 of 2 screen. Click here to proceed Note: If the user wishes to perform time consolidation, one of the options in the bottom right of the screen (median, average, etc) needs to be selected to define the representative statistical dataset within the consolidated time interval. If the user decides to consolidate the data yearly, for instance, the statistic chosen (e.g. average) will be the representative result for the year. Version 2.1 October 2004 A.11-19 Air Force Center for Environmental Excellence AFCEE MONITORING AND REMEDIATION OPTIMIZATION SYSTEM SOFTWARE 3) Data Reduction: Part 2 of 2 allows the user to consolidate the data based on concentration parameters chosen. The “Non-Detect (ND)” option allows the user to choose the number value to represent a non-detect result in the data. To apply a specific detection limit for each chemical choose “Uniform Detection Limit”. The suggested detection limit is the minimum detection limit. The “Duplicates” option is used to consolidate duplicates. Note that duplicates are samples that have the same constituent, date, and well name. Samples with the same “effective date” will be consolidated as duplicates. The “Trace (TR)” option is used to specify the number value which will be used to represent a Trace result in the data. (The “TR” flag is equivalent to the “J” flag used by most labs, to indicate a result that is reported but is below the method detection limit). This particular tutorial will use a uniform detection limit of 0.001 mg/L to represent non-detect results, duplicates will be consolidated using the average value and trace results will be analyzed based on the actual value. The following steps outline how this is implemented: Under the heading “Non-Detect (ND)”, click in the middle of the circle next to the option “Uniform Detection Limit”. Click here Click here Under the heading “Duplicates” click in the middle of the circle next to the option “Average”. Under the heading “Trace” click in the middle of the circle next to the option “Actual Value”. Select “Next” to proceed. The Reduced Data Table will be displayed. Click here to proceed Note: Typically when applying statistics, half the detection limit could be used. However where there the detection varies historically, then setting a uniform detection limit will reduce the possibility of false trends. Version 2.1 October 2004 A.11-20 Air Force Center for Environmental Excellence AFCEE MONITORING AND REMEDIATION OPTIMIZATION SYSTEM SOFTWARE 4) The Reduced Data Table allows the user to view the reduced data table with the COCs chosen as well as the data consolidation performed. This table is not available for editing. Select “Next” to proceed to the Reduced Data Plot screen. Click here to proceed 5) The Reduced Data Plot screen allows the user to view the reduced data in graphical form. Click here for choices To display data for MW-1: Click here Click the down arrow in the first text box (“Well”), to display the options, and select MW-1. Click the down arrow in the second text box (“Chemical”), to display the options, and select benzene. Under the heading “Graph Type” click on the circle next to “Linear”. Select the “Graph” button to display the graph for MW-1. To view data for a well “MW-4”, click the down arrow in the first text box (“Well”), where “MW-1” is displayed. A list of choices will appear. Click on “MW-4” to select well MW-4. Select the “Graph” button to display the graph for MW-4. A graph of benzene concentrations for well MW-4 is displayed. Version 2.1 October 2004 A.11-21 Air Force Center for Environmental Excellence AFCEE MONITORING AND REMEDIATION OPTIMIZATION SYSTEM SOFTWARE Note: If more than one COC was being used data for other chemicals can be displayed by clicking on the down arrow of the second text box (“Chemical”). The graph type can be changed from Linear to Logarithmic by selecting the “Log” option under “Graph Type”. After any change, click the “Graph” button to display the graph. 6) Use the View Report option to print the current graph and data. Click “View Report” to proceed. Click here to close Click here to view report Click here to proceed The report displays the data in graphical and tabular format. This report can also be printed. Close the report by clicking on the red button in the top right hand corner of the screen. The Reduced Data Plot screen will return. Select the “Next” button to proceed. The Data Reduction Complete screen will appear. 7) The Data Reduction Complete screen indicates that the data has been reduced according to the parameters entered. The user may now proceed to the Statistical Plume Analysis and analyze the trends in the groundwater data. Select the “Trends Analysis” button to return to the Main Menu. Click here to proceed Version 2.1 October 2004 A.11-22 Air Force Center for Environmental Excellence AFCEE MONITORING AND REMEDIATION OPTIMIZATION SYSTEM SOFTWARE Version 2.1 October 2004 A.11-23 Air Force Center for Environmental Excellence AFCEE MONITORING AND REMEDIATION OPTIMIZATION SYSTEM SOFTWARE STEP 3: STATISTICAL PLUME ANALYSIS The Statistical Plume Analysis option allows the user to perform Mann-Kendall Analysis and Linear Regression Analysis. 1) From the Plume Analysis Menu, select the “Step 3b: Statistical Plume Analysis” option. The Mann-Kendall Statistics menu will be displayed. Click here to proceed 2) The Mann-Kendall Statistics screen is used to view the Mann-Kendall Trend Analysis results by well and constituent. Statistical analysis results displayed include: • The Coefficient of Variation “COV” - a statistical measure of how the individual data points vary about the mean value. • The Mann-Kendall Statistic “MK (S)” measures the trend in the data. • The “Confidence in Trend” is the statistical confidence that the constituent concentration is increasing (S>0) or decreasing (S<0). • The “Concentration Trend” for each well - Increasing, Probably Increasing, No Trend, Stable, Probably Decreasing, Decreasing or Not Applicable (Insufficient Data). Further details on this methodology are provided on Page 28 of the User Manual. Statistical analysis for the benzene data is displayed. Benzene Tab Use the scroll-down arrow on the right of the screen to view results for wells not displayed. Click on “View Report” to print the “MannKendall Statistics Report”. Click here to view report Note: If more than one COC was being used, the user would navigate the results for individual constituents by clicking on the tabs at the top of the screen. Version 2.1 October 2004 A.11-24 Air Force Center for Environmental Excellence AFCEE MONITORING AND REMEDIATION OPTIMIZATION SYSTEM SOFTWARE Version 2.1 October 2004 A.11-25 Air Force Center for Environmental Excellence AFCEE MONITORING AND REMEDIATION OPTIMIZATION SYSTEM SOFTWARE The “Mann-Kendall Statistics Report” displays consolidated data and results of the Mann Kendall analysis. This report can also be printed. Click here to close Close the report by clicking on the red button in the top right hand corner of the screen. The Mann-Kendall Statistics screen will return. Select the “Next” button on the MannKendall Statistics to proceed. The Mann-Kendall Plot screen will appear. Click here to proceed 3) The Mann Kendall Plot screen allows the user to view the Mann-Kendall Trend Analysis results by well and constituent. Graph of benzene concentrations for well MW-4 is displayed. The Mann Kendall statistics are displayed for this well. For example, the Concentration Trend is shown to be decreasing “D” in the box in the left hand bottom corner. Select the “Next” button to continue to the Linear Regression Statistics screen. Trend Click here to proceed Note: As discussed above, plots of other wells and chemicals can be obtained using the Well or Chemical drop down boxes in the top of the screen, followed by selecting the “Graph” button. The graph type can be specified as Log or Linear. The graph can be printed by selecting the “View Report” button. Version 2.1 October 2004 A.11-26 Air Force Center for Environmental Excellence AFCEE MONITORING AND REMEDIATION OPTIMIZATION SYSTEM SOFTWARE 4) Linear Regression Statistics allows the user to view the Linear Regression Analysis results by well and constituent. The Linear Regression analysis is another statistical method with similar output as the Mann-Kendall method. Statistical analysis results displayed include: • The Coefficient of Variation “COV” - a statistical measure of how the individual data points vary about the mean value. • “Slope” - the slope of the least square fit through the given data indicates the trend in the data. • The “Confidence in Trend” is the statistical confidence that the constituent concentration is increasing (S>0) or decreasing (S<0). • The “Concentration Trend” for each well - Increasing, Probably Increasing, No Trend, Stable, Probably Decreasing, Decreasing or Not Applicable (Insufficient Data). Benzene Tab Statistical analysis for the benzene data is displayed. Select “Next” to proceed to the Linear Regression Plot screen. Click here to proceed Note: If more than one COC was being used, the user would navigate the results for individual constituents by clicking on the tabs at the top of the screen. The information displayed can also be viewed in report form, “Linear Regression Statistics Report” from the MAROS Output Screen. 5) Linear Regression Plot allows the user to view the linear regression data in graphical form. A graph of benzene concentrations for well MW-4 is displayed. The Linear Regression statistics are displayed for this well. For example, the Linear Regression Trend is shown to be decreasing “D” in the box in the left hand bottom corner. Select the “Next” button to continue to the Trend Analysis Statistics Summary screen. Trend Click here to proceed Version 2.1 October 2004 A.11-27 Air Force Center for Environmental Excellence AFCEE MONITORING AND REMEDIATION OPTIMIZATION SYSTEM SOFTWARE Note: As discussed previously, plots of other wells and chemicals can be obtained using the Well or Chemical drop down boxes in the top of the screen, followed by selecting the “Graph” button. The graph type can be specified as Log or Linear. The graph can be printed by selecting the “View Report” button. 6) Trend Analysis Statistics Summary by Well allows the user to view the Mann-Kendall Trend Analysis and Linear Regression Analysis results by well and constituent. Statistical analysis for the benzene data is displayed. Select “Next” to proceed to the Statistical Plume Analysis Complete screen. Click here to proceed Note: If more than one COC was being used, the user would navigate the results for individual constituents by clicking on the tabs at the top of the screen. The information displayed in this screen can also be viewed in report form, “Statistical Plume Analysis Summary Report” from the MAROS Output Screen or by clicking on “View Report”. In this particular example, the Mann-Kendall results are the same as the Linear Regression results for all wells. 7) The Statistical Plume Analysis Complete screen indicates that the Mann-Kendall Trend Analysis and Linear Regression Analysis have been performed. The next stage will be Spatial Moment Analysis. Select “Plume Analysis” to return to the Plume Analysis Menu. Click here to proceed Version 2.1 October 2004 A.11-28 Air Force Center for Environmental Excellence AFCEE MONITORING AND REMEDIATION OPTIMIZATION SYSTEM SOFTWARE STEP 4: SPATIAL MOMENT ANALYSIS The Spatial Moment Analysis option is used to perform Moment Analysis (Zero, First, and Second Moments calculated). 1) From the Plume Analysis Menu, select the “Step 3c: Spatial Moment Analysis” option. The Moment Analysis Site Details screen will be displayed. Click here to proceed 2) Moment Analysis Site Details allows the user to enter the additional site data required in the Moment Analysis. Data required includes porosity, groundwater flow direction, approximate contaminant source location, and aquifer saturated thickness. The following parameters are to be entered for this tutorial: • Groundwater flow direction: East (i.e. along the x-axis shown on Figure A.11.1, enter 0 degrees as groundwater flow direction is defined in degrees from the x-axis in a counter clockwise direction) • Porosity: 30% (enter as 0.3) • Source Location: X=0 and Y=0 (i.e. in middle of Tank Field, near MW-1– see Figure A.11.1) • Uniform Saturated Aquifer, 12 ft thick Click here for choices To enter the groundwater flow direction, click on the down arrow in the first text box under “Groundwater Flow Direction”. A list of choices will appear. Use the scroll bar to see all the choices. Click “0 - E” to select. Click to select Version 2.1 October 2004 The groundwater flow direction “0” is displayed, indicating the flow is toward the East. A.11-29 Air Force Center for Environmental Excellence AFCEE MONITORING AND REMEDIATION OPTIMIZATION SYSTEM SOFTWARE To enter the porosity value 30%, type “0.3” in the text box next to the heading “Porosity”. Enter porosity here Enter the x and y coordinates of the source in using the text boxes adjacent to “Single Source Location”. In the “X (ft)” box type “0” and in the “Y (ft)” box type “0”. Enter thickness here Enter the overall saturated thickness of the aquifer in the text box next to “Uniform Saturated Thickness”. Type in the value “12”. To continue, select “Next”. The Spatial Moment Analysis Results screen will be displayed. Enter coordinates here Click here to proceed Note: Where the thickness of the saturated aquifer varies according to well location, representative saturated thickness of the aquifer at each well can be entered by clicking on “Variable Saturated Thickness” and then entering the data for each well. Version 2.1 October 2004 A.11-30 Air Force Center for Environmental Excellence AFCEE MONITORING AND REMEDIATION OPTIMIZATION SYSTEM SOFTWARE 3) Moment Analysis Statistics allows the user to view the Spatial Moment Analysis results by well and constituent. The zeroth moment is a mass estimate for each sample event and COC. The mass estimated indicate the change in total mass of the plume over time. The first moment estimates the center of mass of the plume coordinates (Xc and Yc) for each sample event and COC. The center of mass locations indicate the movement of the center of mass over time. The second moment indicates the spread of the contaminant about the center of mass (Sxx and Syy), or the distance of contamination from the center of mass. The Second Moment represents the spread of the plume over time. Displayed are the spatial moment analysis results for each sample event, for the constituent benzene. Click “Next” to proceed to the Zeroth Moment Plot screen. The next screens will go through each moment analysis result in detail as well as looking at trends in the data over time. Click here to proceed Notes: If more than one COC was being used, the user would navigate the results for individual constituents by clicking on the tabs at the top of the screen. The results can be printed by selecting the “View Report” button. 4) Zeroth Moment Plot allows the user to view the Zeroth Moment Analysis results by constituent over time. The zero moment is a mass estimate for each sample event and COC. The mass estimated indicate the change in total mass of the plume over time. The Zero Moment trend over time is determined by using the Mann-Kendall Trend Methodology. The “Zeroth Moment” Trend for each COC is determined according to the rules outlined in Appendix A.1. Results for the trend include: Increasing, Probably Increasing, No Trend, Stable, Probably Decreasing, Decreasing or Not Applicable (Insufficient Data). Other statistics displayed include the Mann-Kendall Statistic (S), the Confidence in Trend and the Coefficient of Variation (COV). Refer to Appendix A.1 and A.5 for further details. Version 2.1 October 2004 A.11-31 Air Force Center for Environmental Excellence AFCEE MONITORING AND REMEDIATION OPTIMIZATION SYSTEM SOFTWARE To display results for benzene, click on the drop down arrow next to the “Chemical” text box. Click on “benzene” to select. Click on “graph” to plot the data. The Zero Moment Trend over time is shown to be stable “D”. This indicates the dissolved plume mass is decreasing over time Select “Next” to proceed to the First Moment Plot screen. Click here to plot Trend Result Click here to proceed Note: If more than one COC was being used plots of other chemicals can be obtained using the Chemical drop down box at the top of the screen, followed by selecting the “Graph” button. The graph type can be specified as Log or Linear. The graph can be printed by selecting the “View Report” button. 5) First Moment Plot: Distance from Source to Center of Mass is used to view the First Moment Analysis results by constituent over time. The first moment estimates the center of mass, coordinates (Xc and Yc) for each sample event and COC. The distance from the original source location to the center of mass locations indicate the movement of the center of mass over time relative to the original source. The First Moment trend of the distance to the center of mass over time is determined by using the Mann-Kendall Trend Methodology. The “First Moment” trend for each COC is determined according to the rules outlined in Appendix A.1. Results for the trend include: Increasing, Probably Increasing, No Trend, Stable, Probably Decreasing, Decreasing or Not Applicable (Insufficient Data). Other statistics displayed include the Mann-Kendall Statistic (S), the Confidence in Trend and the Coefficient of Variation (COV). Refer to Appendix A.1 and A.5 for further details. First Moment analysis, distance from source to center of mass results are displayed for benzene. The First Moment Trend of the distance to the center of mass over time is shown to be increasing “I”. This means the center of mass is getting farther away from the original source area. Select “Next” to proceed to the First Moment Plot: Change in Location of Mass Over Time screen. Trend Result Click here to proceed Note: If more than one COC was being used plots of other chemicals can be obtained using the Chemical drop down box at the top of the screen, followed by selecting the “Graph” button. The Version 2.1 October 2004 A.11-32 Air Force Center for Environmental Excellence AFCEE MONITORING AND REMEDIATION OPTIMIZATION SYSTEM SOFTWARE graph type can be specified as Log or Linear. The graph can be printed by selecting the “View Report” button. 6) First Moment Plot: Change in Location of Mass Over Time is used to view the First Moment Analysis results by constituent over time. The first moment estimates the center of mass of the plume coordinates (Xc and Yc) for each sample event and COC. The center of mass locations indicate the movement of the center of mass over time. First Moment analysis results showing the change in location of mass over time are displayed for benzene. Each point represents a sample event. The results can be compared to the groundwater flow direction displayed on the right of the screen. Select “Next” to proceed to the First Moment Plot: Change in Location of Mass Over Time screen. Click here to proceed Note: If more than one COC was being used plots of other chemicals can be obtained using the Chemical drop down box at the top of the screen, followed by selecting the “Graph” button. The graph type can be specified as Log or Linear. The graph can be printed by selecting the “View Report” button. Data values can be viewed by selecting “View Data”. This shows a table with the Xc, Yc, and Source Distance for all sample events. 7) Second Moment Plot: Change in Plume Spread Over Time allows the user to view the Second Moment Analysis results by constituent over time. The second moment indicates the spread of the contaminant about the center of mass (Sxx and Syy), or the distance of contamination from the center of mass. Analysis of the spread of the plume should be viewed as it relates to the direction of groundwater flow. The Second Moment represents the spread of the plume over time in both the x and y directions. The Second Moment trend of the Spread of the Plume in the X or Y direction over time is determined by using the Mann-Kendall Trend Methodology. The “Second Moment” trend for each COC is determined according to the rules outlined in Appendix A.1. Results for the trend include: Increasing, Probably Increasing, No Trend, Stable, Probably Decreasing, Decreasing or Not Applicable (Insufficient Data). Other statistics displayed include the Mann-Kendall Statistic (S), the Confidence in Trend and the Coefficient of Variation (COV). Refer to Appendix A.1 and A.5 for further details. Second Moment analysis results showing the spread of the plume over time are displayed for benzene. The scale shown is logarithmic (Log). Version 2.1 October 2004 A.11-33 Click here Air Force Center for Select Environmental Excellence AFCEE MONITORING AND REMEDIATION OPTIMIZATION SYSTEM SOFTWARE Change graph type to Linear by clicking on the open circle next to “Linear”. Click on “Graph” to display. The graph displays covariance type “Sxx”, representing spreading of the plume in the direction of groundwater flow. The Second Moment Trend of the spread of the plume over time is shown to be probably increasing “PI”. This indicates that although the concentrations are decreasing, the plume is spreading over time. Trend Result To view the results for covariance type “Syy” click on the circle labeled “Syy” under Covariance Type. Then click on the “Graph” button. The graph now displays covariance type “Syy”, representing spreading of the plume in the direction perpendicular to groundwater flow. Select The Second Moment Trend of the spread of the plume over time is shown to be increasing “I”. This indicates that although the concentrations are decreasing, the plume is spreading over time. Select “Next” to proceed to the Spatial Moment Analysis Summary screen. Click here to proceed Click here to plot Note: If more than one COC was being used plots of other chemicals can be obtained using the Chemical drop down box at the top of the screen, followed by selecting the “Graph” button. The graph type can be specified as Log or Linear. The graph can be printed by selecting the “View Report” button. 8) Spatial Moment Analysis Summary allows the user to view the Moment Analysis MannKendall results by constituent. Version 2.1 October 2004 A.11-34 Air Force Center for Environmental Excellence AFCEE MONITORING AND REMEDIATION OPTIMIZATION SYSTEM SOFTWARE Displayed are the spatial moment analysis results for benzene. Click “Next” to proceed to the Moment Analysis Complete screen. Note: If more than one COC was being used, the user would navigate the results for individual constituents by clicking on the tabs at the top of the screen. The results can be printed by selecting the “View Report” button. 9) Moment Analysis Complete screen indicates that the Spatial Moment Analysis has been performed. Click on “Plume Analysis” to return to proceed to the External Plume Information. The Plume Analysis Menu will appear. Click here to proceed Version 2.1 October 2004 A.11-35 Air Force Center for Environmental Excellence AFCEE MONITORING AND REMEDIATION OPTIMIZATION SYSTEM SOFTWARE STEP 5: EXTERNAL PLUME INFORMATION The external plume information is used when applicable modeling data and/or empirical data is entered. This portion of the software is an optional utility, which will not be used in this tutorial. 1) From the Plume Analysis Menu, select the “Step 3d: External Plume Information” option. The External Plume Information: Modeling Results screen will be displayed. Click here to proceed 2) External Plume Information: Modeling Results allows the user to enter modeling results by well and constituent or for all source or all tail wells (e.g. Increasing (I), Stable (S), etc.). Modeling results should be taken from fate and transport models that take site specific data and predict the ultimate extent of constituent migration (either for natural attenuation process or site undergoing remediation). For this tutorial there are no additional modeling results. The option “No separate modeling studies have been performed” should be already selected. Select “Next” to proceed to the External Plume Information: Empirical Results screen. Click here to proceed Version 2.1 October 2004 A.11-36 Air Force Center for Environmental Excellence AFCEE MONITORING AND REMEDIATION OPTIMIZATION SYSTEM SOFTWARE 3) External Plume Information: Empirical Results allows the user to enter empirical trend information by well and constituent or for all source or all tail wells. The rationale and limitations to this approach is outlined in Appendix A.4. This portion of the software is an optional utility, which will not be used in this tutorial. Empirical results should be developed on the basis of data from previous similar site studies (e.g. “plume-a-thon” studies such as the Lawrence Livermore study, the BEG studies and the AFCEE chlorinated database). For this tutorial there are no additional modeling results. The option “No separate empirical evidence to be applied” should be already selected. Select “Next” to proceed to the External Plume Information Complete screen. Click here to proceed 4) External Plume Information Complete Screen indicates that the Modeling and Empirical Trend results have been entered. This portion of the software is an optional utility, which will not be used in this tutorial. To proceed to the Long Term Monitoring (LTM) Analysis to weight the Plume Information and analyze the trends in the groundwater data, select “Trends Analysis”. The Plume Analysis Menu will appear. Click here to proceed Version 2.1 October 2004 A.11-37 Air Force Center for Environmental Excellence AFCEE MONITORING AND REMEDIATION OPTIMIZATION SYSTEM SOFTWARE STEP 6: MAROS ANALYSIS MAROS analysis allows user to weight the trend analysis data and weight well data. Final suggested monitoring system categories for each COC are displayed. 1) From the Plume Analysis Menu, select the “Step 3e: MAROS analysis” option. The Statistical and Plume Information Summary by Well screen will be displayed. Click here to proceed 2) Statistical and Plume Information Summary by Well allows the user to view the MannKendall Trend Analysis, Linear Regression Analysis, Modeling and Empirical results by well and constituent. Results for benzene are displayed. Select “Next” to proceed to the Statistical and Plume Information Summary Weighting screen. Click here to proceed Note: If more than one COC was being used, the user would navigate the results for individual constituents by clicking on the tabs at the top of the screen. The results can be printed by selecting the “View Report” button. 3) Statistical and Plume Information Summary Weighting allows the user to weight the individual lines of evidence (i.e. Mann-Kendall Trend Analysis, Linear Regression Analysis, Modeling and Empirical results). Choices for weighting trend methods are "High", “Medium”, "Low" and “Not Used”. If you choose not to weight trend methods, leave the default of "All Chemicals" and "Medium" weight. Version 2.1 October 2004 A.11-38 Air Force Center for Environmental Excellence AFCEE MONITORING AND REMEDIATION OPTIMIZATION SYSTEM SOFTWARE Since no modeling analysis or empirical evidence is being used, the weighting for these trends should be changed to “Not Used”. Click on the drop down arrow under the “Source Weight” text box to the right of “Modeling Analysis”. A list of choices will appear. Select “Not Used”. Click here for choices Repeat for the text box to the right (“Tail Weight”) and for the two text boxes adjacent to “Empirical Evidence”. The top two rows for Mann-Kendall Trend Analysis and Linear Regression Analysis should have “Medium” weighting. This means that weighting will not be applied. To proceed, click "Next" to see results of weighting. Click here to proceed Note: If more than one COC was being used, the user could choose to weight the trend methods applied to each COC individually (select "Individual Chemicals") or to weight all chemicals (select "All Chemicals"). 4) Results of Information Weighting allows the user to view the weighted statistical, modeling and empirical lines of evidence for each COC. Trend results for benzene are displayed for each well. Select “Next” to proceed. Click here to proceed Version 2.1 October 2004 A.11-39 Air Force Center for Environmental Excellence AFCEE MONITORING AND REMEDIATION OPTIMIZATION SYSTEM SOFTWARE Note: If more than one COC was being used, the user would navigate the results for individual constituents by clicking on the tabs at the top of the screen. 5) Plume Information by Well Weighting screen allows the user to weight individual wells by all chemicals or by constituent. To weigh individual wells, the option “Weight Wells” could be selected on the right of the screen. Choices for weighting methods range from "High" to "Low". The screen displays “Do Not Weight Wells” as default. This means that the weighting applied to the trend methods will be applied equally to all the wells. This is the option required for this tutorial. Select “Next” to see the results of the weighting. The Monitoring System Category screen will be displayed. Option to Weight Wells Note: If more than one COC was being used, the user could choose to weight the trend methods applied to each COC individually (select "Individual Chemicals") or to weight all chemicals (select "All Chemicals"). 6) Monitoring System Category screen allows the user to view the suggested design category for each COC. Trend results for both tail and source wells are given. From these results a monitoring system category that characterizes the site for an individual constituent is shown. Categories include Extensive (E), Moderate (M), and Limited (L) long term monitoring required for the site. The results for the site and COC benzene are displayed. Select “View Report” to obtain a summary of the results for the analysis. Select “Next” to proceed to the MAROS Analysis Complete screen. Click here to proceed Click here to View At this point, the data has been analyzed and design category suggestions are complete. Proceed to the Main Menu and Version 2.1 October 2004 Click here to proceed A.11-40 Air Force Center for Environmental Excellence AFCEE MONITORING AND REMEDIATION OPTIMIZATION SYSTEM SOFTWARE choose to either perform Sampling Optimization Analysis or choose MAROS Output. Select “Continue to Step 4 or Step 5” to proceed. Version 2.1 October 2004 A.11-41 Air Force Center for Environmental Excellence AFCEE MONITORING AND REMEDIATION OPTIMIZATION SYSTEM SOFTWARE Typical Overview Statistics: Plume Trend Analysis Results At this point in the software the user should assess the overall statistical trend results for the site where they can gain information on the plume stability as well as the distribution of individual well trends. Again, the goal of the tutorial is to show the user tips and pitfalls when applying MAROS at a typical site. The tutorial example has been used only to illustrate the utilities of the MAROS software and it is by no means a complete site analysis. MANN-KENDALL/LINEAR REGRESSION ANALYSIS All 12 monitoring wells had sufficient data within the time period of October, 1988 to December, 1998 (greater than three years of semi-annual data) to assess the trends in the wells. Trend results from the Mann-Kendall and Linear Regression temporal trend analysis for both Upper Aquifer monitoring wells are given in Table A.11.3. TABLE A.11.3 SERVICE STATION BENZENE WELL TREND RESULTS Well Well Well Mann- Linear Overall Type 2 Category 3 Kendall Regression Trend 5 Trend 4 Trend 4 Number Numbe r Comments of of of Samples Detects Detects MW-1 MW Source D D D 15 15 MW-2 MW Source NT PD S 15 7 MW-3 MW Source D D D 15 12 MW-4 MW Tail D D D 15 14 MW-5 MW Source D D D 15 15 Consistent detect, but decreasing trend Inconsistent pattern on detects and NDs Consistent detect, but decreasing trend Consistent detect, but decreasing trend. Most recent ND. Consistent detect, but decreasing trend since 1994 MW-6 MW Source S - ND S - ND S – ND 15 0 All samples ND MW-7 MW Source S - ND S - ND S – ND 15 1 Almost all samples ND MW-8 MW Source S – ND S - ND S - ND 15 1 Almost all samples ND MW-12 MW Tail D D D 15 11 Consistent detect until 1994 MW-13 MW Tail D D D 15 10 Consistent detect until 1992 MW-14 MW Tail D D D 15 7 Consistent detect until 1991 MW-15 MW Tail S - ND S - ND S – ND 15 0 All samples ND Notes: 1. Consolidation of data included non-detect (ND) values set to the detection limit (0.001 mg/L) and the maximum value of duplicate data was applied. 2. MW = Monitoring Well 3. Source = Source Zone Well; Tail = Tail Zone Well 4. Decreasing (D), Probably Decreasing (PD), Stable (S), No Trend (NT), Probably Increasing (PI), and Increasing (I) 5. Overall Trend is calculated from a weighted average of the Linear Regression and Mann-Kendall Trends. For further details on this methodology refer to Appendix A.8. Version 2.1 October 2004 A.11-42 Air Force Center for Environmental Excellence AFCEE MONITORING AND REMEDIATION OPTIMIZATION SYSTEM SOFTWARE The monitoring well trend results show that 5 out of 5 source wells and all 7 tail wells have a Probably Decreasing, Decreasing, or Stable trends. Both methods gave similar trend estimates for each well. Well Type MAROS Trend Analysis PD, D, S I, PI Source 5 of 5 (100%) 0 of 5 (0%) Tail 7 of 7 (100%) 0 of 7 (0%) Note: Decreasing (D), Probably Decreasing (PD), Stable (S), Probably Increasing (PI), and Increasing (I) When considering the spatial distribution of the trend results (Figure A.11.2– map created in ArcGIS from MAROS results), the majority of the decreasing or stable trend results are located near the Tanks (source area), indicating a decreasing source. FIGURE A.11.2 SERVICE STATION BENZENE TREND RESULTS Note: If extraction or recovery wells are present in a well network, these well trend results need to be treated differently for the purpose of individual trend analysis interpretation primarily due to the different course of action possible for the two types of wells. For monitoring wells, strongly decreasing concentration trends may lead the site manager to decrease their monitoring frequency, as well look at the well as possibly attaining its remediation goal. Conversely, strongly decreasing concentration trends in extraction wells may indicate ineffective or near-asymptotic contamination extraction, which may in turn lead to either the shutting down of the well or a drastic change in the Version 2.1 October 2004 A.11-43 Air Force Center for Environmental Excellence AFCEE MONITORING AND REMEDIATION OPTIMIZATION SYSTEM SOFTWARE extraction scheme. Other reasons favoring the separation of these two types of wells in the trend analysis interpretation is the fact that they produce very different types of samples. On average, the extraction wells possess screens that are twice as large and extraction wells pull water from a much wider area than the average monitoring well. Therefore, the potential for the dilution of extraction well samples is far greater than monitoring well samples. Version 2.1 October 2004 A.11-44 Air Force Center for Environmental Excellence AFCEE MONITORING AND REMEDIATION OPTIMIZATION SYSTEM SOFTWARE MOMENT ANALYSIS Moment Trend results from the Zeroth, First, and Second Moment analyses for the Upper Aquifer monitoring well network were varied. Moment Trend results from a selected Upper Aquifer monitoring well dataset are given in the Moment Analysis Report, Appendix 10. All 12 wells were used in the moment analysis. Moment Type Mann-Kendall Trend Analysis Trend Comment Zeroth Decreasing The decrease in dissolved mass maybe due to the extraction system moving high concentration groundwater from source zones to nearby monitoring wells or the change in monitoring wells sampled over the sampling period analyzed. First Increasing The center of mass is moving down-gradient relative to the approximate source location (MW-1) through time in a South-Westerly direction, perpendicular to groundwater flow. Second Probably Increasing/ Increasing The plume shows a probably increasing trend in the direction of groundwater flow and increasing perpendicular to groundwater flow. This indicates that wells representing areas on the tip and the sides of the plume are increasing. Note: The zeroth moment (or dissolved mass) estimate can show high variability over time, due to the fluctuating concentrations at the most contaminated wells as well as a varying monitoring well network. This may result in an unexpected increasing trend of mass over time. To investigate the influence of fluctuating factors over time, data can be consolidated to annual sampling and the zeroth moment trend re-evaluated. Another factor to consider when interpreting the mass increase over time is the change in the spatial distribution of the wells sampled historically. If the service station site network had changes in the well distribution over time, due to addition and subtraction of wells from the well network, this could cause moment trends to be incorrect. Also, an observed mass increase could also stem from more mass being dissolved from the NAPL while a remediation system is operating. The spatial and temporal trends in the center of mass distance from the source location (first moment results) can indicate transient movement based on season variation in rainfall or other hydraulic considerations. The Service Station results that the source area concentration is decreasing faster than the tail area of the plume, therefore the “increasing” trend in the first moment. Even though the center of mass is moving, the plume itself is still decreasing in concentration over time and the direction of movement is in the groundwater flow direction. The second moment provides a measure of the spread of the concentration distribution about the plume’s center of mass. The second moment, or spread of the plume over time in the x direction for each sample event, shows an increasing trend over time. Analysis of the spread of the plume indicates a shrinking to stable plume, where wells representing very large areas both on the tip and the sides of the plume show decreasing concentrations. This increasing trend in the spread of the plume shows that, although the concentrations are decreasing over time, the plume is moving down-gradient. Version 2.1 October 2004 A.11-45 Air Force Center for Environmental Excellence AFCEE MONITORING AND REMEDIATION OPTIMIZATION SYSTEM SOFTWARE OVERVIEW STATISTICS: PLUME ANALYSIS In evaluating overall plume stability, the trend analysis results and all monitoring wells were assigned “Medium” weights within the MAROS software, assuming equal importance for each well and each trend result in the overall analysis. Overview Statistics Results: • Overall trend for Source region: Decreasing, • Overall trend for Tail region: Probably decreasing, • Overall results from moment analysis indicate a decreasing dissolved mass of the plume, • Overall monitoring intensity needed: Limited. These results matched with the judgment based on the visual comparison of benzene plumes over time, as well as the Moment Analysis. The benzene concentrations observed in 1991 are plotted in Figure A.11.3. The benzene plume concentrations observed in 1991 was very similar to that of 1994 (Figure A.11.4), indicating that the benzene plume is relatively stable to decreasing over time. FIGURE A.11.3 SERVICE STATION BENZENE CONCENTRATIONS FOR SAMPLE EVENT 8 (1991) Version 2.1 October 2004 A.11-46 Air Force Center for Environmental Excellence AFCEE MONITORING AND REMEDIATION OPTIMIZATION SYSTEM SOFTWARE FIGURE A.11.4 SERVICE STATION BENZENE CONCENTRATIONS FOR SAMPLE EVENT 10 (1994) For a generic plume, the MAROS software indicates to: • • Continue semi-annual sampling frequency. May need up to 15 wells These MAROS results are for a generic site, and are based on knowledge gained from applying the MAROS Overview Statistics. The frequency recommendation is for the whole monitoring network and the number of wells seems high. Therefore, a more detailed analysis for both the well redundancy and sampling frequency utilizing the detailed statistics analysis in the MAROS 2.0 software is needed to allow for reductions and recommendations on a well-by-well basis. These overview statistics were also used when evaluating a final recommendation for each well after the detailed statistical analysis was applied. Version 2.1 October 2004 A.11-47 Air Force Center for Environmental Excellence AFCEE MONITORING AND REMEDIATION OPTIMIZATION SYSTEM SOFTWARE Sampling Optimization Step 4, Sampling Optimization allows the user to perform detailed sampling optimization with modules to optimize sampling location by the Delaunay method and sampling frequency by the Modified CES method or to evaluate data sufficiency by statistical power analysis. Select “Sampling Optimization” from the Main Menu and the Sampling Optimization Menu screen will appear. The Sampling Optimization Menu screen serves at the center of the sampling optimization user interface. The user can choose to perform either sampling location analysis or sampling frequency analysis first. Data sufficiency analysis will become available after sampling frequency analysis is completed. OPTION 1: SAMPLING LOCATION ANALYSIS Select “Sampling Location Analysis” from the Sampling Optimization Menu. The Well Redundancy Analysis: Delaunay Method screen will appear. Click here to proceed 1) Select the sampling events for analysis from the “From” and “To” dropdown lists. The “From” sampling event must not be later than the “To” sampling event. If multiple sampling events are selected, only the “Access Module” button will be activated. If only one sampling event is selected (i.e., select the same event from both the “From” and “To” dropdown lists), the “Excel Module” button will also be activated. The Excel Module illustrates graphically how the Delaunay method works and gives the user more control of the optimization process. Usually multiple sampling events are used to detect the sampling locations that are redundant throughout a period rather than at a point in time. In this case study, multiple sampling Version 2.1 October 2004 A.11-48 Air Force Center for Environmental Excellence AFCEE MONITORING AND REMEDIATION OPTIMIZATION SYSTEM SOFTWARE events and the Access Module will be used to illustrate the sampling location optimization. For optimization with the Excel Module, please refer to “Sampling Location Determination – Excel Module” in the MAROS Detailed Screen Descriptions section of the user’s guide. Now, select “Sampling Event 10” from the “From” dropdown list and “Sampling Event 15” from the “To” dropdown list. The latest five years of data will be used. Click “Confirm” to confirm the selection and the “Access Module” button will be activated. Click to confirm Select Sample Event 10 Click here to proceed Select Sample Event 15 Click “Access Module” and the Access Module – Potential Locations Setup screen will appear. 2) The Access Module – Potential Locations Setup screen allows the user to select the sampling locations for analysis and set the optimization parameters. “Selected” status In this case study, all wells will be used in the analysis and all wells are assumed removable (i.e., can be “Removable” eliminated). Therefore, the “Selected?” “Options” status button checkbox is checked for each well, so is the “Removable?” checkbox (by default). In practice, if not all wells are suitable for analysis (e.g., irrelevant wells or wells with susceptible data), the user can deselect them. Similarly, if not all wells are removable (e.g., sentry wells), deselect the checkboxes in the “Removable?” column. If the user deselects some of the wells and then wants to reselect them all, click the “Select All” button to facilitate this process. Click the “Options” button and the Well Redundancy Analysis – Options screen will appear. Here the user can set the Slope Factor (SF) thresholds for wells inside the benzene plume and wells on the peripheral of the plume. Wells that have SF values smaller than the thresholds will become potential candidates for elimination. The Area Ratio and Concentration Ratio are thresholds constraining the information loss after elimination of wells. For example, 0.95 for Concentration Ratio means the acceptable information loss in plume average concentration estimation is 5% at most. Set to 0.20 Version 2.1 October 2004 A.11-49 Set to 0.95 Air Force Center for Environmental Excellence AFCEE MONITORING AND REMEDIATION OPTIMIZATION SYSTEM SOFTWARE In this example, set the “Inside node Slope Factor” to 0.20, the “Hull node Slope Factor to 0.01”, and both the “Area Ratio” and “Concentration Ratio” to 0.95. Click the “<<Back” button to return to the Access Module – Potential Locations Setup screen. Click “Preliminary Analysis >>” to proceed and the Access Module – Slope Factor Values screen will appear. 3) The Access Module – Slope Factor Values screen shows a summary of the SF values for each well. The “Min. SF” column lists the smallest SF value and the “Max. SF” column lists the largest SF value for a well, respectively. The “Avg. SF” column lists the average SF value across selected sampling events. The average SF value is used to determine the overall redundancy of a well. The smaller it is, the more redundant the well is. Average SF values Click to proceed Note that there are several wells with average SF values less than 0.2. Click “Optimize by COC >>” to proceed. The Access Module – Results by COC screen will appear. 4) The Access Module – Results by COC screen shows the optimization results for each COC. Wells that are eliminated are identified with a check mark in the “Eliminated?” column. It is seen from the table that wells MW12, MW-3, and MW-4 can be eliminated for benzene. If other COCs are also analyzed, there will be other tabs available for selection. (Note: The benzene tab “Eliminated” status Occasionally the MAROS method will indicate with one COC to eliminate sampling that well, but another COC will indicate to retain the well in the monitoring network, therefore, keeping the well in the network is the best option.) The user can choose to view the report where results are categorized by COC by clicking the “View Report” button. Click the “Compare Across COCs >>” to proceed and the Access Module – All-in-one Results screen will appear. 5) The Access Module – All-in-one Results screen shows the optimization results for each Version 2.1 October 2004 A.11-50 Air Force Center for Environmental Excellence Click to view report AFCEE MONITORING AND REMEDIATION OPTIMIZATION SYSTEM SOFTWARE well after considering all COCs. In this step, a well is eliminated only if it is elimnated for all COCs. If a well can be eliminated for all COCs, then this well can either be abandoned or terminated for sampling. Since in this example only benzene is analyzed, the results at this step is the same as the results from the previous step. A summary report is available for review by clicking the “View Report” button. Click “Next >>” to proceed and the Well Sufficiency Analysis – New Locations screen will appear. Note: The decision to terminate sampling for one COC or all COCs at a well may require further considerations, more than just recommendations from the above-described optimization. The above recommendations are based solely on the statistical point of view. In practice, decisions are always made out of the scope of technical considerations. Regulatory considerations, for example, need to be incoprated into the decision process. Also, if some of the parameters were changed in the above analysis, the reults could be a little different. To better understand the influence of parameters on optimization results, the user can try several runs with different parameters each time. 6) The Well Sufficiency Analysis – New Locations screen allows the user to perform a sufficiency analysis to determine potential new sampling locations. This analysis utilizes the SF values obtained from the Well Redundancy analysis to predict the concentration estimation uncertainty at unsampled regions. The regions where uncertainty is high are the potentail locations for adding new sampling points. Select COC here Click to analyze Only one COC can be analyzed each time using this analysis. For example, if there are three COCs, this process has to be repeated three times. The “Selected?” column shows the status of whether a well is used in the analysis. The user can exclude wells from analysis by unchecking the checkbox following a well. In this example, all wells are used in the analysis. The “Reset” button can be used to reselect all wells. Select the COC from the “COC:” dropdown list. In this example, select benzene. Then click the “Analysis” button to proceed. An Excel chart called xlsNewLocation will pop up. 7) The xlsNewLocation Excel chart indicates the concentration estimation uncertainty at the center of each Delaunay triangle with a colored letter: “S” represents small, “M” represents moderate, “L” represents large, and “E” represents extremely large. The interpretations of the results are also provided on the chart. The areas with “L” or “E” code can be considered for new sampling locations. Version 2.1 October 2004 A.11-51 Air Force Center for Environmental Excellence AFCEE MONITORING AND REMEDIATION OPTIMIZATION SYSTEM SOFTWARE In this example, there are no triangles having “L” or “E” letters. Since the plume is decreasing over time (see results from Plume Analysis), therefore no new locations need to be recommended. After viewing the results, the user can print out this chart or save it with a different name for future use. Press “Back to Access” to return to the Well Sufficiency Analysis – New Locations screen or simply switch back by selecting the MAROS application. In the Well Sufficiency Analysis – New Locations screen, click “Next >>” to proceed. The Sampling Location Analysis Complete Access Module screen will appear. This screen indicates that the sampling location optimization is completed. The user may now choose to perform other sampling optimization analyses by selecting “Sampling Optimization” or go back to modify certain parameters and make more analysis runs by selecting “<< Back”. Existing wells Click to return Colored letter Delaunay triangle Click the “Sampling Optimization” button and the user will be brought back to the Sampling Optimization Menu screen. Version 2.1 October 2004 A.11-52 Air Force Center for Environmental Excellence AFCEE MONITORING AND REMEDIATION OPTIMIZATION SYSTEM SOFTWARE Note: The redundancy reduction results based on the Delaunay method are provided in Table A.11.1. The user may notice that both MAROS recommendation and qualitative evaluation were used in making the final recommendations. The reasoning in the table is only used to illustrate the importance of further considerations. In practice, the user may need to do this for each decision. Version 2.1 October 2004 A.11-53 Air Force Center for Environmental Excellence AFCEE MONITORING AND REMEDIATION OPTIMIZATION SYSTEM SOFTWARE OPTION 2: SAMPLING FREQUENCY ANALYSIS Select “Sampling Frequency Analysis” from the Sampling Optimization Menu. The Sampling Frequency Analysis screen will appear. 8) Define the “recent period” by selecting the beginning and ending sampling events. Select the starting sampling event from the “From” dropdown list and the ending sampling event from the “To” dropdown list. The “From” sampling event must not be later than the “To” sampling event. The “recent period” is defined in order to calculate the recent concentration trend. This period should be shorter than the overall sampling history. For example, the latest two or three years can be “recent period” as opposed to a total sampling time of six years. Note: The sampling frequency analysis requires that at least six monitoring records be used. If less than six records are used in the analysis, the accuracy of the results may be significantly affected. Correspondingly, at least six sampling events are to be selected. For example, a period of two years will contain eight samples for a quarterly sampling while a three-year period is needed to generate six samples with a semiannual sampling. The analysis will still proceed with less than six samples but the recommended results may be inaccurate. Also, six sampling events do not necessarily lead to six samples because sampling could be skipped at certain events for some wells. Click to confirm Select Sample Event 15 Select Sample Event 10 Set Options In this example, select “Sample Event 10” from the “From” dropdown list and “Sample Event 15” from the “To” dropdown list. Click the “Confirm” button to confirm the selection. Notice that the “Analysis >>” button is now activated. 9) View or modify the Rate of Change (ROC) parameters by selecting “Options…” The Sampling Frequency Analysis – Options screen will appear. The “Cleanup Goal” is generally the sitespecific (or risk-based) cleanup goal for a COC. If the user does not provide this value, the software will use the maximum contaminant level (MCL) for that COC instead. The “Low Rate”, “Medium Rate”, and “High Rate” are threshold values used to classify the rate of change (i.e., the linear slope from concentrations vs. time regression). By default, the “Low Rate” is defined as 50% change of the “Cleanup Goal” per year, the “Medium Rate” as 100% change of the “Cleanup Goal” per year, and “High Rate” as 200% change of the “Cleanup Goal” per year. In this example, the default values will be used. Click the “Back” button to return to the Sampling Frequency Analysis screen. Version 2.1 October 2004 A.11-54 Air Force Center for Environmental Excellence AFCEE MONITORING AND REMEDIATION OPTIMIZATION SYSTEM SOFTWARE Note: The ROC parameters should be modified according to site-specific conditions and needs. For example, higher ROC parameters can be applied to sites/wells where concentration levels are consistently high and the ratio of ROC to concentration level is very small. Conversely, for sites/wells where concentration levels are around the cleanup goal, small ROC parameters need to be used to provide high sensitivity. 10) Click the “Analysis >>” button to perform the analysis. The Sampling Frequency Recommendation screen will appear. The “Recent Result” and the “Overall Result” represent the frequency determined from the recent data and the overall data, respectively. The “Sampling Frequency” is the final recommendation after balancing the results obtained from both recent and overall data. Click the “View Report” button to view a result report where the recommended sampling frequency and other details are listed for each well and each COC. The user can print this report or export it in different formats. Note: The frequency recommendations given by the MAROS software should be reviewed in light of the number of samples considered, number of nondetects, etc (see Table A.11.2 for example). For example, if all measurements at a well are nondetects and the detection levels are consistently low, a uniform value should be used to quantify the nondetects to avoid a false concentration trend, which may leads to inappropriate sampling frequency. Regulatory framework, community issues, and other site-specific situations must also be considered in the final decision-making (see Table A.11.2 for example). For example, if a sentry well provides early warning for a downgradient receptor, its sampling frequency may need to be kept quarterly even if all the measurements are nondetects and the recommendation is biennial. Click the “Next >>” button to proceed. The Sampling Frequency Analysis Complete screen will appear, indicating that the sampling frequency analysis has been completed. The user may now choose to perform other sampling optimization analyses by selecting “Sampling Optimization” or go back to modify analysis parameters and make more analysis runs by selecting “<< Back”. Click the “Sampling Optimization” button and the user will be brought back to the Sampling Optimization Menu screen. Version 2.1 October 2004 A.11-55 Air Force Center for Environmental Excellence AFCEE MONITORING AND REMEDIATION OPTIMIZATION SYSTEM SOFTWARE OPTION 3: ANALYSIS DATA SUFFICIENCY Select “Data Sufficiency Analysis” from the Sampling Optimization Menu. The Data Sufficiency Analysis Menu screen will appear. Click to perform Analysis 1 The Data Sufficiency Analysis Menu screen serves at the center of the data sufficiency analysis user interface. The user can choose to perform the power analysis at individual wells and/or risk-based power analysis. 11) View or modify analysis parameters by clicking the “Options…” button. The Data Sufficiency Analysis – Options screen will appear. The “Cleanup Goal” is the site-specific (or risk-based) cleanup goal for a COC, as described earlier. The “Target Level” is the concentration level the remediation is aimed to achieve, which should be smaller than the “Cleanup Goal”, indicating that the concentration level after remediation is below the cleanup level. The “Target Level” is by default set as 80% of the “Cleanup Goal”. The “Alpha Level” is the type I error (or significance level) used in a statistical test. The “Target Power” is the probability to detect a true change in the concentration level before and after the remediation. It equals to 1 minus type II error. The default values for the “Alpha Use default values Level” and “Target Power” are 0.05 and 0.80, respectively. The “Detection Limit” is used in the risk-based power analysis to indicate that a projected concentration is below the detection limit. In this example, all default parameters will be used. Click the “<< Back” button to return to the Data Sufficiency Analysis Menu screen. 12) Select “Analysis 1” from the Data Sufficiency Analysis Menu screen to perform the individual well power analysis. The Individual Well Cleanup Status screen will appear. First, select the type of data for analysis by clicking on one of the options buttons. One choice is to use yearly averages and the other is to use original data. Using yearly averages can avoid potential seasonal effects in the monitoring data Version 2.1 October 2004 A.11-56 Use yearly averages Select 1991 Select 1998 Air Force Center for Environmental Excellence AFCEE MONITORING AND REMEDIATION OPTIMIZATION SYSTEM SOFTWARE and may also remove autocorrelation. If there are many years of data available, using yearly averages is recommended. In this example, select “Use yearly averages”. Select the beginning and ending sampling events from the “From” and “To” dropdown lists to define the period to be used in the analysis. Select 1991 from the “From” dropdown list and 1998 from the “To” dropdown list. Click the “Analysis >>” button to proceed. The Individual Well Cleanup Status Results screen will appear. Click to visualize 13) The Individual Well Cleanup Status Results screen shows the analysis results in a table format and allows the user to visualize the results spatially. The “Sample Size” column contains the number of yearly averages used in the analysis. The “Cleanup Achieved?” column shows the cleanup status at each well. There are four types of results: Attained, Not Attained, Cont Sampling (continue sampling), and N/C (not conducted). The detailed results of the analysis are given in a report that can be accessed by clicking the “View Report” button. The “View Normal” and “View Lognormal” buttons allow the user to view results calculated assuming that the data are normally distributed and lognormally distributed, respectively. The “Optional Power Analysis” button allows the user to enter another screen where detailed power analysis results are provided (refer to the corresponding part in the user’s guide for details). To visualize the cleanup status spatially, click the “Visualize” button and the Individual Well Cleanup Status Visualization screen will appear. Cleanup status The cleanup status of each well is indicated with colored symbols on a scatter plot. This plot allows the user to have a better understanding of the spatial distribution of individual well cleanup status over the site. Click the “<< Back” button to return and then click “Next >>” on the Individual Well Cleanup Status Results screen to proceed. The Individual Well Power Analysis Complete screen will appear. Version 2.1 October 2004 A.11-57 Air Force Center for Environmental Excellence AFCEE MONITORING AND REMEDIATION OPTIMIZATION SYSTEM SOFTWARE Click the “Data Sufficiency Analysis Menu” button to return to the Data Sufficiency Analysis Menu screen. 14) Select “Analysis 2” from the Data Sufficiency Analysis Menu screen to perform the riskbased (site-scale) power analysis. The Parameters for Risk-Based Power Analysis screen will appear. Proceed through steps 1 to 4 to input the required information. In step 1, input the groundwater flow angle. Since the flow direction is towards East (i.e., 0 degree counter-clockwise from the X-axis), input 0 to confirm. For the “Distance to Receptor”, input 1000 to confirm the distance. This distance is then used to locate the hypothetical statistical compliance boundary (HSCB). In this example, the HSCB is 1000 ft downgradient from the tail of the monitoring network. Then select “Sample Event 1” from the “From” dropdown list and “Sample Event 15” from the “To” dropdown list. The software will calculate the risk-based cleanup status for all sample events. To select plume centerline wells (at least three wells are required for the analysis), consult the plume contour map and use the best judgment to pick wells that are located on or close to the plume centerline. In this example, MW-1, MW-4, and MW-12 can be used for an approximate analysis. Use the “>>” button to add the three wells into “Plume centerline wells” group. Use the “”<<” button to delete a well from the “Plume centerline wells” group. Negative coefficient After inputting the above information, click the “>> Analysis” button to proceed. The Plume Centerline Regression Results screen will appear. The regression coefficient (from the exponential regression of centerline concentrations vs. distance down centerline) and the confidence associated with the coefficient are displayed for each sample event. The regression analysis is performed only for events in which at least three centerline wells were sampled. Note Click to the regression coefficients are all select wells negative, indicating the concentration Version 2.1 October 2004 A.11-58 Air Force Center for Environmental Excellence AFCEE MONITORING AND REMEDIATION OPTIMIZATION SYSTEM SOFTWARE is decaying along the plume centerline. Click the “Next >>” button to proceed. The Centerline Regression – Projected Concentrations screen will appear. The “Projected Concentration” is the concentration projected to the HSCB. If this value is less than the previously defined detection limit, a check mark will appear in the box besides it. In this example, since all projected concentrations are below the detection limit, intuitively the risk-based cleanup status should be “Attained”. If some wells need to be excluded from the analysis, click the “Select Wells” button and finish the selection in the Well Selection Form screen. In this screen, deselect a well by unchecking the checkbox in the “Used in Analysis?” column. The deselected well will be excluded from analysis for all sample events. In this example, all wells will be used in the analysis. Click the “<< Back” button to return. Click the “Analysis >>” button on the Centerline Regression – Projected Concentrations screen to proceed. The Risk-Based Power Analysis Results screen will appear. In this screen, the risk-based cleanup status, power and expected sample size for each sample event are listed in order of time. The cleanup status as a function of time may reflect the progress in remediation (e.g., from Not Attained à Attained). In this example, the cleanup status is “Attained” for all sample events at an HSCB that is 1000 ft downgradient of the network. The “View Normal” and “View Lognormal” buttons allow the user to view results calculated assuming that the data are normally distributed and lognormally distributed, respectively. A detailed result report can be generated by clicking the “View Report” button. Click the “Next >>” button to proceed. The Risk-Based Power Analysis Complete screen will appear. To modify analysis parameters and make more analysis runs, click the “<< Back” button. Click the “Data Sufficiency Analysis Menu” button to return to the Data Sufficiency Analysis Menu screen. Note: The above-described data sufficiency analyses have some implicit assumptions. For the correct use and a better understanding of the power analysis method, refer to Appendix 6 of the user’s guide. To print report/graphs after all analyses are finished, click “<< Back” on the Data Sufficiency Analysis Menu screen and then click the “Main Menu” button on the Sampling Optimization Menu screen. Version 2.1 October 2004 A.11-59 Air Force Center for Environmental Excellence AFCEE MONITORING AND REMEDIATION OPTIMIZATION SYSTEM SOFTWARE From the Main Menu screen, select “MAROS output Reports/Graphs” to view or print reports and graphs. Version 2.1 October 2004 A.11-60 Air Force Center for Environmental Excellence AFCEE MONITORING AND REMEDIATION OPTIMIZATION SYSTEM SOFTWARE TABLE A.11.1 SAMPLING LOCATION OPTIMIZATION RESULTS BASED ON THE DELAUNAY METHOD Well Used in analysis? MAROS Results Final Recommendation MW-1 Yes Keep Keep MW-12 Yes Eliminate Keep MW-13 Yes Keep Keep MW-14 Yes Keep Keep MW-15 Yes Keep Keep MW-2 Yes Keep Keep MW-3 Yes Eliminate Eliminate MW-4 Yes Eliminate Keep MW-5 Yes Keep Keep MW-6 Yes Keep Keep MW-7 Yes Keep Keep MW-8 Yes Keep Keep Reasoning A downgradient well on the plume centerline, providing important information for plume delineation and stability calculation. It needs to be kept. In the source area of the plume where well density is high. It can be eliminated without significantly affect the plume characterization. A down/cross gradient well close to the plume centerline, used to monitor the lateral migration plume. If the plume is proved to be shrinking and falls to below detection level at this area, this well can be eliminated. Sample events 10 to 15 were used in the above analysis. The analysis parameters are 0.20, 0.01, 0.95, and 0.95 for Inside Node Slope Factor, Hull Node Slope Factor, Area Ratio and the Concentration Ratio, respectively. Version 2.1 October 2004 A.11-61 Air Force Center for Environmental Excellence AFCEE MONITORING AND REMEDIATION OPTIMIZATION SYSTEM SOFTWARE TABLE A.11.2 SAMPLING FREQUENCY OPTIMIZATION RESULTS BASED ON THE MCES METHOD Well Original Frequency MAROS Recommende d Frequency Final Recommendation Reasoning MW-1 Semiannual since 96 Annual Annual MW-12 Semiannual since 96 Annual Semiannual Most downgradient along the plume centerline and serve as a sentry well MW-13 Semiannual since 96 Biennial Biennial Non-detects or below MCL since 94 & in the central part of the plume MW-14 Semiannual since 96 Biennial Annual Non-detects since 91 but monitors the downgradient part of plume MW-15 Semiannual since 96 Biennial Biennial All historical concentrations are Non-detects and far from plume MW-2 Semiannual since 96 Biennial Annual Non-detects or below MCL since 94 but it monitors the lateral migration of plume near the source MW-3 Semiannual since 96 Annual Annual Recommended for elimination MW-4 Semiannual since 96 Annual Annual MW-5 Semiannual since 96 Annual Annual MW-6 Semiannual since 96 Biennial Biennial All historical concentrations are nondetects & an upgradient well MW-7 Semiannual since 96 Biennial Biennial All historical concentrations are nondetects or below MCL & an upgradient well MW-8 Semiannual since 96 Biennial Biennial All historical concentrations are nondetects or below MCL & a cross-gradient well in the upgradient section of the plume The default ROC parameters were used in the above analysis, i.e., 0.5MCL/year, 1.0MCL/year, and 2.0MCL/year for the Low, Medium, and High thresholds, respectively. Version 2.1 October 2004 A.11-62 Air Force Center for Environmental Excellence AFCEE MONITORING AND REMEDIATION OPTIMIZATION SYSTEM SOFTWARE MAROS Output At this point in the software the user has gone through all of the optimization utilities and can begin to consolidate the knowledge of the site with the MAROS analysis results to make a final determination of the site optimization. The goal of the tutorial is to show the user tips and pitfalls when applying MAROS at a typical site. The tutorial example has been used only to illustrate the utilities of the MAROS software and it is by no means a complete site analysis. Step 5, MAROS Output Reports/Graphs allows the user to view/print reports and graphs from the site trend analyses as well as a preliminary Site Recommendation Report. This allows production of standard Reports, including the one-page heuristic approach to sampling optimization based on plume stability and site parameters with results for sampling frequency, duration and density. Sample Reports are located in Appendix A.10. The reports can be used to assess the project objectives defined at the start of the tutorial. The MAROS output results should also be reviewed before proceeding to optimization of the monitoring network to ensure that the trends in the data are fully understood. Spend time reviewing the data and trend results, both spatially and temporally. Try to identify any spurious data or “outliers”. Here are some examples of questions to be asked: • Which wells have trends for benzene concentration and which do not (see Graph Trend Summary Results: Graphing and Report MAROS Plume Analysis summary). • From the trend analysis results, is the plume increasing or decreasing? (see Report MAROS Spatial Moment Analysis Summary, Zero Moment) • Is the plume moving? (see Report MAROS Spatial Moment Analysis Summary, First Moment) • What are the trends in benzene concentrations over time? (see Graphs Linear Regression Graphs and Mann Kendall Graphs) • Review the Mann-Kendall and Linear Regression Trends. Are there any differences for different wells? (See Report MAROS Plume Analysis summary and Mann-Kendall and Linear Regression plots for individual wells) • Are there wells on the outside of the monitoring network with concentrations increasing? (see Graph Trend Summary Results: Graphing and Report MAROS Plume Analysis summary) • Review data based on qualitative knowledge of the site, for example, is there a reason for one well to be showing a sudden increase in concentrations having been persistently non-detect? • Review the parameters selected for the data consolidation and the analysis (see Report MAROS Site Results). Version 2.1 October 2004 A.11-63 Air Force Center for Environmental Excellence AFCEE MONITORING AND REMEDIATION OPTIMIZATION SYSTEM SOFTWARE STEP 1: MAIN MENU Select “MAROS Output” from the Main Menu. The MAROS Output Reports/Graphs screen will be displayed. Click here to proceed STEP 2: MAROS OUTPUT REPORTS/GRAPHS MAROS Output Reports/Graphs allows the user to view/print reports and graphs from the site trend analyses as well as a preliminary Site Recommendation Report. To select a report of graph, click on the title, then select “View/Print Report” or “View/Print Graph”. 1) To view the MAROS trend summary results in tabular and graphical format: Under “Graph”, click on the arrow at the bottom right hand corner of the text box. The option “Trend Summary Graphs” should be visible. Select “Trend Summary Graphs”. Click on “View/Print Graph” to display a table of data. Click here Trend Summary Results: Graphing allows the user to view/print graphical summary results in Excel. Select “Excel Graph(s)” to spatially display the data. This will open Excel on your computer to provide the trend result graphs. Trend Summary Result: allows the user to view/print graphical Trend Summary Results in Excel. Version 2.1 October 2004 A.11-64 Click here Air Force Center for Environmental Excellence AFCEE MONITORING AND REMEDIATION OPTIMIZATION SYSTEM SOFTWARE Trend results should be reviewed for all wells to check they make sense. Version 2.1 October 2004 A.11-65 Air Force Center for Environmental Excellence AFCEE MONITORING AND REMEDIATION OPTIMIZATION SYSTEM SOFTWARE Click here to close Select “Print Chart” to print the current summary graph. Click on the “X” at the top right hand corner of the screen to close or select “Back to Access” to return to the Trend Summary Results. Select “Back to Access” to return to the MAROS Output Reports/Graphs screen. Click here Note: Do not change the name or content of the worksheet xlsLOETrendResults or move it to other folders. The xlsLOETrendResults worksheet will remain open until the user closes it. All the results and graph output are kept if the user chooses to save the file before closing it. The user should save the file under a different name by choosing “Save as…” under the Excel menu option “File.” 2) To view the Site Report, select “Site Report” from the first list of options under the heading “Report”. Select “View/Print Report” to display the MAROS Site Results report. Select Click here Page 1 of the report is displayed. To select Page 2, click on the arrow next to “1” at the bottom of the screen. Plume characteristics Click here The plume characteristics are displayed on this report. The source is classified as “PD”, probably decreasing and the plume tail as “PD”, decreasing. Version 2.1 October 2004 A.11-66 Air Force Center for Environmental Excellence AFCEE MONITORING AND REMEDIATION OPTIMIZATION SYSTEM SOFTWARE The plume mass is decreasing (zeroth moment result “D”) and the plume is moving from away from the source (first moment result “I”). The plume is spreading (second moment result “PI” and “I”). 3) To view the trend results for individual wells, select the report Plume Analysis Summary Report. Select “Plume Analysis Summary Report” from the first list of options under the heading “Report”. Select “View/Print Report” to display the report. Select Click here Click here to close The Mann Kendall and Linear Regression trend results for each well are consistent except for well MW-2. For this spatially. well review the Trend results data Select “Mann Kendall Graphs” from the main menu. Click on “View/Print Graph” to display a plot of data. Select Click here Version 2.1 October 2004 A.11-67 A plot of data for MW-1 will be displayed. Select MW-2 from the drop down box in the top right hand corner of the screen, then click on “Graph” to plot. Air Force Center for Environmental Excellence AFCEE MONITORING AND REMEDIATION OPTIMIZATION SYSTEM SOFTWARE The plot for MW-2 shows that one data point that may be an error. The source of this data should be reviewed. Check data If this point was not included in the data set, a trend may be identified by the Mann Kendall analysis. Select “Back” to return to the MAROS Output Reports/Graphs screen. 4) Results can be exported to a database format. The user can then use the result to plot data in GIS or other software. Select “Export Results”. MAROS Analysis The Export MAROS Analysis Results to Access File screen is displayed. Click here Enter the folder name and the name of the file to create: • • Enter details here Folder: “C:\AFCEE_MAROS\” Filename: “TutorialResults.mdb” Select “Create”. Click here Click “Back” to return to the MAROS Output Reports/Graphs screen. Click here to proceed Version 2.1 October 2004 A.11-68 Air Force Center for Environmental Excellence AFCEE MONITORING AND REMEDIATION OPTIMIZATION SYSTEM SOFTWARE Tutorial Site Conclusions At this point in the software the user has gone through all of the optimization utilities and can consolidate the knowledge of the site with the MAROS analysis results to make a final determination of the site optimization. The goal of the tutorial is to show the user tips and pitfalls when applying MAROS at a typical site. The tutorial example has been used only to illustrate the utilities of the MAROS software and it is by no means a complete site analysis. Results from the temporal trend analysis, moment analysis, sampling location determination, sampling frequency determination, and data frequency analysis indicate that: • The 7 site monitoring source wells are located near the Tank Field. These have historically elevated benzene concentrations. There are 5 tail wells. • 3 out of 7 source wells and 4 out of 5 tail wells have a “Decreasing” trend. 4 out of 7 source wells and 1 out of 5 tail wells have a “Stable” trend. Both the statistical methods used to evaluate trends (Mann-Kendall and Linear Regression) gave similar trend estimates for each well. • 1 source well appears to have a suspect data point which should be investigated further (MW-2). • The dissolved mass is decreasing over time, whereas the center of mass shows an increase in distance over time in relation to the source location. The plume is spreading in the direction of groundwater flow and probably increasing in the direction perpendicular to groundwater flow. However, the trend results do show overall decreasing concentrations in individual wells. • Overall plume stability results indicate that a monitoring system of “Limited” intensity is appropriate for this monitoring network due to a stable Upper Aquifer plume. • The well redundancy optimization tool, using the Delaunay method, indicates that 1 existing monitoring wells may not be needed for plume monitoring and can be eliminated from the original monitoring network of 12 wells without compromising the accuracy of the monitoring network. • The well sufficiency optimization tool, using the Delaunay method, indicates that no new monitoring wells are needed for the existing monitoring network. • The well sampling frequency tool, the Modified CES method, indicates the number of samples collected over time can potentially be reduced by 56% by sampling at a lessthan-quarterly frequency for most of the monitoring wells, considering the sampling frequency reduction only. • The MAROS Data Sufficiency (Power Analysis) application indicates that the monitoring record has sufficient statistical power at this time to say that the plume will not cross a “hypothetical statistical compliance boundary” located 1000 feet downgradient of the most downgradient well at the site. With the progress of Version 2.1 October 2004 A.11-69 Air Force Center for Environmental Excellence AFCEE MONITORING AND REMEDIATION OPTIMIZATION SYSTEM SOFTWARE remediation, this hypothetical statistical compliance boundary will get closer and closer to the downgradient wells of the monitoring system. The MAROS optimized plan consists of 11 wells: 1 sampled semiannually, 5 sampled annually, and 5 sampled biennially. The MAROS optimized plan would result in 9.5 samples per year, compared to 24 samples per year in the original monitoring program. Implementing these recommendations could lead to a 60% reduction in samples from the original plan in terms of the samples to be collected per year. The recommended long-term monitoring strategy, based on the analysis of the original monitoring plan, results in a moderate reduction in sampling costs and allows site personnel to develop a better understanding of plume behavior over time. A reduction in the number of redundant wells, an increase in the number of wells in areas with inadequate information, as well as reduction in sampling frequency is expected to results in a moderate cost savings over the long-term at this BTEX site. An approximate cost savings of 60% per year is projected for the tutorial site, while still maintaining adequate delineation of the plume as well as knowledge of the plume state over time. At more complex sites with many more wells and more sampling data, cost savings would be greatly increased. Version 2.1 October 2004 A.11-70 Air Force Center for Environmental Excellence