1
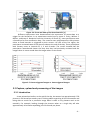
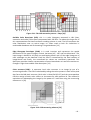
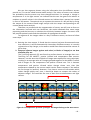
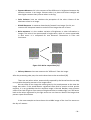
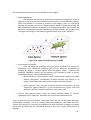
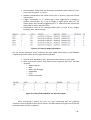
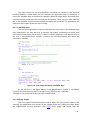
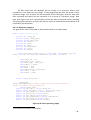
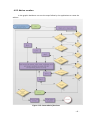
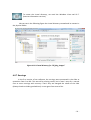
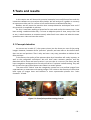
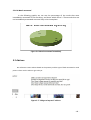
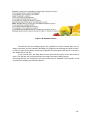
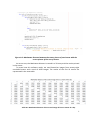
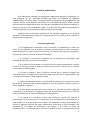
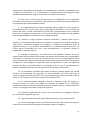
Talking about SenseCams, if we compare adjacent images, we can find two very
different images inside the same event. This is because the images are taken in a low
frequency, compared, for example with the rate of images taken for a video camera, and
a photo could be taken when the user turn himself for a moment, while sitting in front of
the computer. This is the most common reason to trigger false events: slightly change of
position of the user.
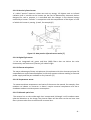
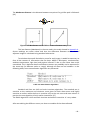
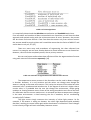
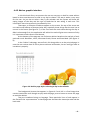
Figure 2-9: Examples of false positive boundary [11]
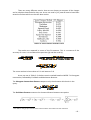
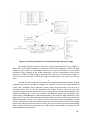
To segment a group of images into events using content-based image analysis, an
adaptation of Heart´s Text Tiling approach is used. [9] With this technique, we take a
reference image, and then compare the block of images previous to it with the block of
images that come afterwards. Each block is represented with the average value of the low
level MPEG-7 visual features of all images present in that block. This way we can solve the
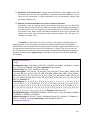
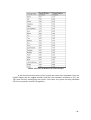
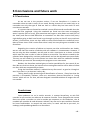
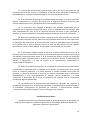
problem of “intruder” images inside a certain event.
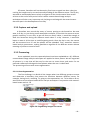
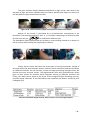
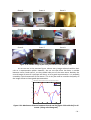
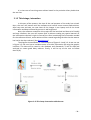
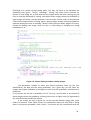
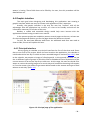
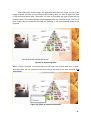
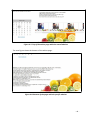
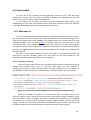
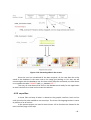
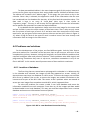
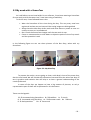
New event?
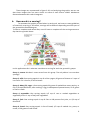
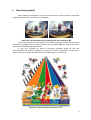
Figure 2-10: The only flower image cannot be considered an event
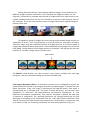
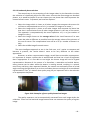
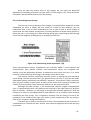
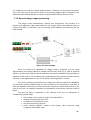
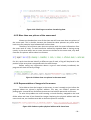
The MPEG-7 visual features are color structure, color layout, scalable color and edge
histogram. They are calculated making use of the aceToolbox [18].
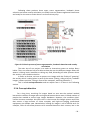
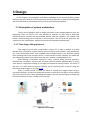
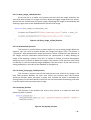
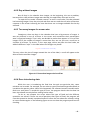
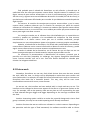
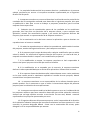
Color Layout Descriptor (CLD): it is resolution-invariant and it is designed to capture the
spatial distribution of color in an image or an arbitrary-shaped region. To extract the color
layout descriptor, firstly the image is partitioned into 8x8=64 blocks. Each block is
representated by its average color. This result in three 8x8 arrays, one for each color
component (Y: luminance. Cb: Blue-difference chrominance components. Cr: reddifference chrominance components). Then, the DCT transform is applied. We now have
3 matrices of coefficients. The resulting coefficients are zig-zag-scanned and the CLD
descriptor is formed by only 6 coefficients from the Y-DCT-matrix and 3 coefficients from
each DCT matrix of the two chrominance components. The Descriptor is saved as an array
of 12 values. Finally, the remaining coefficients are nonlinearly quantized. [10], [11]
- 11 -