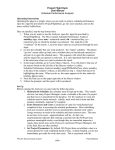
1
Printed in May 2010 WARRANTY In compliance with Decree Law no. 24 of 2-2-2002, this warranty will last 24 months in case of sale to private persons. Whereas, in case of sale to companies, professionals or taxable persons for VAT purposes, this warranty will last 12 months. For further information and assistance, please visit our product section at www.sequoia.it or e-mail us to [email protected] Disclaimer The present manual has been drawn up by Sequoia IT. You are recommended to read carefully this disclaimer and the legal notes as the use of FastTracer requires the user’s automatic acceptance of the terms therein. Sequoia IT reserves the right to make any changes to the disclaimer and the legal notes published on this page at any time. Sequoia IT shall make reasonable efforts to ensure that any information provided in this manual is without errors, inaccuracies and omissions. Notwithstanding this, all information is provided here “as is”. Sequoia IT cannot guarantee the reliability and exactness of the results obtained with its own software, therefore under no circumstances shall it be held responsible for direct, indirect, incidental and consequential damages connected to the use, appropriate or inappropriate, profit loss, interruption of the company or professional activity, loss of data or other types of data located in the user’s IT system or other systems. The purpose of the present disclaimer is not to avoid compliance with the existing law or refuse responsibility for all the cases where it cannot be excluded by law. The resolution of any disputes arising out with the use of FastTracer and the related software or any other reason between the user and Sequoia IT will be submitted to the exclusive jurisdiction of the Court of Turin. Fast FastTracer Tracer User Manual I DECLARATION OF CONFORMITY According to ISO/IEC guide 22 and EN45014, Sequoia IT manufacturer declares the conformity of FastTracer with EMC 89/336/EEC – CE marking 93/68/EEC directives and subsequent harmonized standards: emissions: EN 61000-6-4 (2001); immunity: EN 61000-6-2 (2001). The symbol of the crossed waste container means that, in accordance with 2002/96/EC Waste Electrical and Electronic Equipment Directive (WEEE), once the product reaches the end of its lifecycle, in the European Union it is subject to special waste disposal. In addition to the present device, this rule is also applied to all items carrying such a symbol. Do not dispose of these products as undifferentiated urban waste but put away for material differentiated recycling. Copyright All the contents (text, graphics and images) in this manual are protected by copyright. The partial use of this document is admitted, provided that: the copyright notice below and the present authorization terms appear on every copy; • the use of these documents is only for information, for personal and non-commercial purposes and such use does not imply the copy and/or disclosure on computer networks or other media; • the used documents are not modified. • Any other use is expressly forbidden by the law. All the products or companies mentioned in this manual are trademarks held by their respective proprietors or owners and can be protected by patents and/or copyright or registered by competent authorities. II TABLE OF CONTENTS 1.2 Foreword............................................................................................1 1.2.1 Prerequisites................................................................................1 1.2.2 Structure of the manual...............................................................1 1.3 Definitions........................................................................................2 1.3.1 Technical specifications..............................................................2 Introduction 1.3.2 Measurement with FastTracer....................................................3 1.3.3 Diagnostics and machine or structure characterization..............3 1.4 Philosophy of use .............................................................................4 1 2.1 Preparation for use.............................................................................5 2.2 System requirements..........................................................................5 2.3 FTAnalyzer installation.....................................................................5 2.4 Esplora 3D installation .....................................................................6 Installation 2.4.1 Sensor positioning and fastening................................................6 2.5 Frequently Asked Questions (FAQ)...................................................7 2 3.1 Introduction.......................................................................................8 3.2 Philosophy of use...............................................................................8 3.3 Start..................................................................................................10 3.4 Interface...........................................................................................10 3.4.1 Graphics area............................................................................11 3.4.2 Devices list...............................................................................12 3.4.3 Menu.........................................................................................13 3.4.4 Global Settings ........................................................................13 3.4.5 Toolbar .....................................................................................14 3.5 New view.........................................................................................16 3.5.1 Time: time domain measurement.............................................17 3.5.1.1 Time: display options....................................................18 3.5.1.1.1 Time: Selection of displayed values...........................19 3.5.1.1.2 Time: Filters...............................................................19 3.5.2 Frequency: frequency domain measurement............................19 FTAnalyzer 3.5.2.1 Frequency: display options............................................20 3.5.2.1.1 Frequency: selection of displayed values...................21 3.5.2.1.2 Frequency - scale changes: dB, linear........................21 3.5.2.1.3 Overall measurement..................................................22 3.5.3 Triggered: event synchronized measures..................................23 3.6 File device........................................................................................24 3.6.1 Measure recording....................................................................24 3.6.2 File device creation (virtual device).........................................25 3.7 Export to text file: measure export..................................................27 3.8 Export to spreadsheet: measure export to MS - Excel files.............29 3.8.1 Note on Microsoft Excel configuration....................................30 3.9 Perspective save and load................................................................32 3 Fast FastTracer Tracer User Manual III 4 FTEditor 4.1 Philosophy of use.............................................................................33 4.2 Start..................................................................................................34 4.3 Create new model............................................................................35 4.4 Add test............................................................................................35 4.5 Add measure....................................................................................36 4.6 Export database to file.....................................................................38 5.1 Philosophy of use.............................................................................39 Model Instance................................................................................40 Model DB........................................................................................40 5.2 Start..................................................................................................40 5.2.1 Import Model DB....................................................................41 5.3 Test model instance: model - machine selection.............................41 5.3.1 Create model instance: instance creation.................................42 Esplora 3D 5.3.2 Test selected instance: diagnostics...........................................43 5.4 Browse model instance: see reports.................................................44 5.5 Menu................................................................................................45 5 6 Wireless FastWI IV 6.1 Package description.........................................................................46 6.2 Installation......................................................................................47 WiFi Interface - Technical Specification........................................49 Introduction Definitions and concepts Introduction 1.2 Foreword Thank you for choosing FastTracer. FastTracer is a simple and reliable system which transforms a normal PC into a tool for vibration-based diagnostics of machines or structures. FastTracer is an innovative and highly flexible instrument that can also be used for experimental research on vibrations or for training purposes. FastTracer is manufactured by SEQUOIA IT, a leading company in the development of expert vibration monitoring solutions. This manual provides an introduction to the use of the FastTracer system and the related software in the various conditions of employment. It describes the different types of measurements which can be carried out and the various software characteristics, to help you use this flexible system to its full potential. 1.2.1 Prerequisites The information in this manual is intended for readers with a basic IT knowledge and good knowledge of vibration analysis. Therefore, these aspects are not dealt with in detail, except in certain cases and when necessary in order to make the description more clear. 1.2.2 Structure of the manual The manual consists of five chapters and covers all aspects of the use of the FastTracer system. The first chapter sets out the technical specifications of the FastTracer and its philosophy of use. The second chapter explains how to install the software and the minimum requirements for effective use of the solution. The third chapter provides an introduction to the FTAnalyzer and describes its philosophy of use and advanced features. The fourth chapter presents the FTEditor module of the FTAnalyzer software. The last chapter describes the features of the Esplora 3D software. Fast FastTracer Tracer User Manual 1 Introduction Definitions and concepts 1.3 Definitions Before explaining how to use the FastTracer, some aspects should be dealt with, such as the FastTracer technical specifications, the type of measurements which can be carried out and what information can be obtained from these data. 1.3.1 Technical specifications The FastTracer solution consists of an acquisition device (also called sensor or measurement device) and a software for data display and processing. The measurement device is fitted inside with an innovative MEMS triaxial capacitive accelerometer interfaced with a microprocessor processing and transmitting the digital signal to the PC through the USB 2.0 or via WiFi (opt.). The digital transmission of measurements ensures the data resistance to electro-magnetic disturbances while the MEMS technology provides the sensor with a self-diagnosis capacity thus minimizing the need for routine calibration. The software developed by Sequoia IT and provided with FastTracer are FTAnalyzer and Esplora 3D. These two types of software and their application for diagnostics and measurement are fully described in the pages below. The system is equipped with a complete solution which does not require any other software or hardware, offering an excellent acquisition device shock resistance up to 10,000g, the possibility of updating the firmware via software, reduced costs and IP67 protection level. T E C H N I C A L S P E C I F I C A T I ON S Maximum acceleration: +/- 5g (Optional: 2g,18g) Frequency band: 0 – 2500 Hz Resolution: 0,0025 m/s2 Noise: 0,075 m/s2 Dimensions: 30 x 55 x 15 mm Weight: 55 g Cable length: 3- 30 m Communication: USB 2.0 – WiFi (Optional) Protection rating: IP67 Shock resistance: 10.000g Temperature range: 0° C .. +70°C Conformity: CEI UNI -EN 61000-6-2 /4 Software: FastTracer suite Software 2 Introduction Definitions and concepts 1.3.2 Measurement with FastTracer The FastTracer measurement device carries out a time-trend analysis of x-y-z acceleration components detected in the sensor application point of the sensor. The x-y-z reference tern is the one indicated on the sensor casing and shall be used to determine the direction of the measured accelerations. The device can acquire accelerations with maximum module corresponding to the full scale of your FastTracer (± 18g, ± 5g, ± 2g) and frequency between 0 Hz and 2500 Hz. The Acquisition device or sensor FastTracer acquisition sample rate is 81922 sample/s, i.e. 81922 acceleration measurements are performed in the sensor positioning point in one second. The signals acquired are digitally converted by a dedicated processor and digitally transmitted to the Sequoia IT software installed on your computer (FTAnalyzer, Esplora 3D). Through mathematical calculations, the software will provide all direct and indirect measurements needed for diagnostics or experimental research. 1.3.3 Diagnostics and machine or structure characterization With FastTracer you can analyse the machine vibrational signature to characterize structures or monitoring of conditions. Machine monitoring With FastTracer you can carry out diagnostics for predictive maintenance according to two levels: 1. 1st level diagnosis: condition monitoring The repeated measurement of the machine vibration acceleration RMS level in the measurement point will identify the machine current operating condition and its progress in time. 2. 2nd level diagnosis: cause inquiry This level of inquiry is based on the FFT analysis of the acquired data and makes it possible to identify the problem according to the spectrum shape. This type of diagnosis is useful to identify faults such as rotor unbalancing, joint misalignment, damaged gears, etc. Fast FastTracer Tracer User Manual 3 Introduction Definitions and concepts Diagnosis levels 1.4 Philosophy of use As above mentioned, the software provided with FastTracer are FTAnalyzer and Esplora 3D. With the first, used to display and process measurement data, the user can analyse kinematic values such as displacement, speed and acceleration in order to identify possible faults and establish their effects. For example, to plan maintenance strategies for certain machine families, it is possible to monitor a testing machine showing signs of a forthcoming fault and determine its effect on the machine vibrational signature. After detecting the cause-effect relation, you can use the FTEditor module of the FTAnalyzer to develop a test model dedicated to the concerned machine family. As explained in chapter 5, this model can be used by less skilled users who, following the instructions provided by the Esplora 3D software, will be led in the fault diagnosis function. The use of the FastTracer for predictive maintenance reduces the number of inspections on the idle machine and the number of stops due to unexpected faults, thus maximizing the maintenance efficiency and effectiveness. Maintenance is simplified if you know in advance that a breakage or downtime is approaching, as you can plan several aspects, such as personnel, spare parts and tools to be used, thus saving costs and time. How to use the software provided with FastTracer 4 Installation FastTracer software installation Installation 2 .1 Preparation for use To use the FastTracer simply position the sensor correctly and start up FTAnalyzer or Esplora 3D. This chapter describes the various aspects concerning the software installation and the correct sensor positioning and fastening. 2.2 System requirements FastTracer works on normal desktop or laptop computers with Windows 2000, XP, Vista and Windows 7 and requires the following hardware: Minimum Standard Suggested Processor X86 – 500 MHz X86 – 900 MHz X86 – 1,6 MHz RAM 128 MB 512 MB 1 GB Hard Disk available space 20 MB 1 GB 5 GB Video SVGA SVGA SVGA Ports USB 2.0 USB 2.0 USB 2.0 Other Mouse – Cd Rom Mouse – Cd Rom Mouse – Cd Rom Microsoft Office Compatibility Office 2000 or sub. Office 2000 or sub. Office 2000 or sub. System requirements 2.3 FTAnalyzer installation Before installation, all programs in execution on the computer should be shut down. It is recommended not to connect the measurement device until the software installation procedure is complete. Setup FTAnalyzer Fast FastTracer Tracer User Manual 5 Installation FastTracer software installation Proceed as follows for installation: 1. insert the CD-Rom provided with FastTracer into the CD player 2. find on the desktop the “computer resources” icon and double-click it or click start and then “computer resources” 3. find the CD-Rom player and double-click the icon 4. click the FTAnalyzer_setup icon 5. follow the instructions on the screen and proceed with the software installation. After installing FTAnalyzer, at least one of the FastTracer measurement devices must be connected to the computer to operate drivers and license. Please notice that if the device is not connected it is not possible to start the software for the first time and to perform off-line operations. 2.4 Esplora 3D installation Before installation, all programs in execution on the computer should be shut down. It is recommended not to connect the measurement device until the software installation procedure is complete. Proceed as follows for installation: 1. insert the CD-Rom provided FastTracer into the CD player with 2. find on the desktop the “computer resources” icon and double-click it or click start and then “computer resources” 2. find the CD-Rom player and double-click the icon 3. click the Esplora 3D_setup.exe icon 4. follow the instructions on the screen and proceed with the software installation. Setup Esplora 3D After installing Esplora 3D, at least one of the FastTracer measurement devices must be connected to the computer to operate drivers and license. Please notice that if the device is not connected it is not possible to start the software for the first time and to perform off-line operations. 2.4.1 Sensor positioning and fastening For the FastTracer correct use, the user shall position and fasten the acquisition sensor in the right way. The wrong positioning and loose fastening can lead to incorrect or misleading measurements. 6 Installation FastTracer software installation Correct positioning requires the sensor to be set very close to the vibration sources to enable detection and the measurement point shall be chosen according to the type of analysed vibration. Sections [1] and [2] provide indications on the sensor positioning for machine monitoring. Before measurement the user shall make sure the sensor is well secured, otherwise measures might be altered by vibrations. The acquisition device is equipped with magnetic adapters, an excellent solution for the sensor fastening; you can also consider using cyanoacrylate glues (e.g. Loctite). Tight fastening is extremely important, therefore the best solution is to fix the sensor by means of coach screws. 2.5 Frequently Asked Questions (FAQ) Q: The software does not see the connected device.. A: Open the Device List and click the Refresh Device List key. Q. The software does not start correctly. A. Try to connect a FastTracer acquisition device; if the problem persists, reinstall the software following the procedure explained in paragraph 2.3. Q. How many FastTracer devices can be used at the same time? A. The maximum number of FastTracer devices which can be used at the same time is not limited and depends exclusively on the computer hardware. Q. How can I receive technical assistance? A. For Sequoia IT technical assistance e-mail to [email protected] Q. Can I copy or use different copies of Sequoia IT software and documentation on my company’s computers? A. The software and the documentation can be used and copied freely on every computer held by the FastTracer system purchaser. Fast FastTracer Tracer User Manual 7 FTAnalyzer Data Acquisition FTAnalyzer 3 .1 Introduction FTAnalyzer is a software which transforms a normal computer into an instrument for the display, storage and processing of the measures obtained through FastTracer devices. Be aware of the following conventions before the software presentation: • FastTracer acquisition devices measure acceleration in the device application point according to the x,y,z tern indicated on the sensor casing; this tern will be used as reference for directions and points of measurement; • The fixed sensor acquisition sample rate is 8192 sample/s; • The device can acquire accelerations with maximum module corresponding to the full scale of your FastTracer (± 18g, ± 5g, ± 2g) and frequency between 0 Hz and 2500 Hz. For the best use of FastTracer devices, carefully read the pages below as they provide a description of FTAnalyzer functions. 3.2 Philosophy of use FTAnalyzer processes and displays the values acquired in real time or off-line by one or more measurement devices. The maximum number of FastTracer devices which can be used at the same time is not limited and depends exclusively on the computer hardware. FTAnalyzer can: 8 • process or display values measured at different times (off-line) and save them to file; • save measures to file during acquisition; • export measures to other numerical software; • export data to a Microsoft Excel or text document; • filter measures through high/low pass filters; • compare measures taken at different times. FTAnalyzer Data Acquisition The last function is particularly useful for condition monitoring: comparing measures taken on the same machine at different times can help define the machine operating condition. Of course, the analysed event must be the same and measurements shall be taken by positioning the sensor in the same point at all times. This way it is possible to provide a time-trend analysis of the machine general conditions and determine its operating state. Sections [1] and [2] provide indications on the events to be analysed and the sensor positioning for the machine condition monitoring. As already said, FTAnalyzer can also process filed measures recorded before processing. The data files are viewed by FTAnalyzer as virtual devices called File Devices. FTAnalyzer: measurements and diagnostics FTAnalyzer enables to analyse the acquisition device measures in time domain, frequency domain or both. In time domain you can view the acceleration components in the measurement point or indirect measures resulting from processing, such as Velocity Rms values or xy, xz, yz and xyz modules. In the frequency domain you can view the acceleration, speed or displacement component spectrum in the sensor application point through the FTT analysis. The Triggered display mode is particularly useful in this respect as it makes it possible to synchronize data acquisition with vibrational events whose characteristics have been specified by the user for an established time. FTAnalyzer: x-y-z acceleration components; flat projections FTAnalyzer functions enable skilled users to study vibrational phenomena, to understand cause-fault relations (forthcoming fault, part slackening, etc.) and the resulting effect on the machine vibrational signature or other parameters (e.g. high Rms values, abnormal widths, etc.). Fast FastTracer Tracer User Manual 9 FTAnalyzer Data Acquisition After detecting the cause-effect relation, the FTEditor of FTAnalyzer can be used to work out a test model dedicated to the analysed machine. Less skilled users can apply this model through the Esplora 3D software and follow the instructions (set out by the skilled user in the FTEditor model) to carry out the fault diagnosis operation. See chapters 4 and 5 for the use of FTEditor and Esplora 3D. 3.3 Start To start FTAnalyzer, find the Windows start button and click as follows: Start ► Programs► SequoiaIT FTAnalyzer ► FTAnalyzer 1.2.z.t Should the program not start or any error messages be displayed, follow the suggestions provided in paragraphs 2.3 and 2.5 of the present manual. 3.4 Interface The FTAnalyzer interface is similar to that of many modern programs and consists (see figure below) of an action toolbar, a device toolbar and different tool toolbars (highlighted), a Devices List (highlighted) and various Graphics areas (highlighted). This paragraph will present the above mentioned FTAnalyzer interface components. FTAnalyzer: Interface 10 FTAnalyzer Data Acquisition 3.4.1 Graphics area FTAnalyzer uses special graphic view called Graphics area to display measures. These views are mainly of two types and have different functions. Graphics area for time domain analysis (oscilloscope) This view can be used as an oscilloscope screen which displays the time trend of the analysed measures. Graphics area for frequency domain analysis (spectrum analyzer) This view can be used as a spectrum analyzer screen which displays the Fast Fourier Transform (FFT) of acquired measures. In these views, the FTAnalyzer applies the Fast Fourier Transform to the acquisition signal and displays its frequency spectrum. FTAnalyzer: different Graphics areas displayed in the active view The FTAnalyzer can display different Graphics areas in the same screen view at the same time. Proceed as follows to drag a Graphics area into the screen view: • click the title label with the left mouse button and keep it pressed; • drag the pointer to the external border centre of the area where you wish to position the Graphics area. Please notice that the colour of the view part including the Graphics area is blue; Fast FastTracer Tracer User Manual 11 FTAnalyzer Data Acquisition • release the left mouse button. 3.4.2 Devices list The Devices view provides information on connected devices or open File Devices. The File Devices are virtual devices reproducing the data stored in a file, while the Devices are the FastTracer measurement devices connected to the computer. Obviously, the File Devices reproduce the measures which have already been taken (Off-line), but actually work as connected devices. FTAnalyzer: Devices List In the Devices List all the FastTracer connected acquisition devices are displayed with the following acronym: FastTracer -SQ-S-xxxxxx while device files are indicated with the acronym: File FastTracer –SQ-S-xxxxxx. The Refresh Device List key, located at the bottom of the Devices List, is used to refresh the list of connected devices and to check their state. If you right click on the Devices List, a pop-up menu will be displayed to create File 12 FTAnalyzer Data Acquisition Devices or refresh the connected device list. 3.4.3 Menu The menu toolbar (FTAnalyzer) consists of four pop-up menus which allow the user to carry out different actions. The table below shows the different menus with a general description. File Exit To exit the program View New View... To carry out measurements (see paragraph 3.5) New File Device... To load a file as file device Show Device To display the device list Show global settings To display FTAnalyzer settings Device Toolbar Action Toolbar Tool Toolbar To display the toolbar Trigger Toolbar Fullscreen Full-screen application FTEditor To start FTEditor Default Toolbar To restore toolbar default conditions File device xxx To display the Graphics area for the data overview Perspective Load Perspective To recall the stored view configuration Save Perspective To save the view configuration Help About Information about FTAnalyzer 3.4.4 Global Settings To display settings (FTAnalyzer), proceed through the menu as follows: View ►Global Settings in this view you can change different FTAnalyzer parameters. FTAnalyzer: Default Settings Fast FastTracer Tracer User Manual 13 FTAnalyzer Data Acquisition G ra p hic s a rea D e fa ul t( o p z) 100 Oscilloscope X Scale To set diagram X axis scale in current units Oscilloscope Y Offset To move displayed signals in Y direction of the set quantity 0 Oscilloscope Y Scale To set diagram Y axis scale in current units 5 Spectrum Y Scale Type To set the type of diagram Y axis scale in the frequency domain Linear (dB) Spectrum Minimum Hz To set the minimum value of the diagram X axis scale in the frequency domain 0 Spectrum Maximum Hz To set the maximum value of the diagram X axis scale in the frequency domain 2500 Spectrum Minimum Magnitude To set the minimum value of the diagram Y axis scale in the frequency domain 0 Spectrum Maximum Magnitude To set the maximum value of the diagram Y axis scale in the frequency domain 5 Spectrum Horizontal Axis Unit To set the unit of measurement of the diagram X axis in the frequency domain Hz (rpm) Decibel Reference Level Reference value for calculation of decibels in m/s2 case of type dB scale display on Y axis 0 Last Spectrum Weight Displayed spectrum weighted average 1 FFT Spectrum Sample To set the unit of measurement of the diagram X axis in the frequency domain FFT Peak Mode Display of analysed event parameter Number of lines set to zero starting from 0 Hz. FFT Low Frequencies This parameter is applied only to velocity or Row Zeroed displacement spectra 16384 Peak (pk-pk ; rms) 25 (foreground) and the diagram background colour (background) by pressing the two choose.. keys. 3.4.5 Toolbar The FTAnalyzer has different toolbars to quickly recall functions by means of icon keys. For the correct use of FTAnalyzer, users are recommended to know the meaning of the different icons and their functions. The table below provides a list of the different toolbars, icons and related functions. 14 FTAnalyzer Data Acquisition Trig g er To o lba r SINGLE to enable the trigger function. NONE to disable the trigger function To set the trigger value POSITIVE the acquisition starts when the signal goes up through the trigger value. NEGATIVE the acquisition starts when the signal goes down through the trigger value Stop time after trigger in ms Axis where the trigger function shall be enabled. Conditions are based on the OR logic Dev ic e To o lb a r To display the device sending data to the viewed Graphics area When active, the data acquisition is blocked To start/turn off the data recording on file. For further information on the icon functions, see the section on File Devices To display files and the related information storage path To set the file name where the data will be stored if recording has started To o l To o lba r To move display in the active graphics area. To identify a diagram area to export to spreadsheet, save to file image or print Fast FastTracer Tracer User Manual 15 FTAnalyzer Data Acquisition Act io n To o lba r To create a new graphics area to display the data acquired from a connected device or a file with stored data To create a virtual acquisition device starting from a file on disk To start FTEditor for compiling the models to be used with Esplora 3D FTAnalyzer: Start of a new acquisition 3.5 New view To carry out measurement the New View function needs to be recalled. This function can be recalled through the New View key of the Action Toolbar. You can access the New View function also through the Menu Toolbar as follows: View ►New View … After accessing the New View function, FTAnalyzer will ask the user to select the 16 FTAnalyzer Data Acquisition measurement domain, the value to be acquired and the acquisition device to be used. FTAnalyzer: selection of measurement domain and acquisition values Measures can be displayed in the time domain, frequency domain or both with or without starting the vibrational event synchronized acquisition. 3.5.1 Time: time domain measurement To carry out measurements in the time domain, select TIME in the View Type combo box. Measurements will be displayed in the oscilloscope Graphics area. The diagram will show time on the abscissa axis and the selected event on the ordinate axis. To select the event to be measured, find the corresponding option in the second box. The terms used in the “signal type” combo box are explained below: Axes: to measure and display the acceleration x, y, z components measured by the acquisition device. Axes & Modules: to measure and display the acceleration x, y, z components measured by the acquisition device, as well as the acceleration vector projection modules on xy, xz, yz and xyz planes. Rms: to display the root mean square (RMS) value of each vibration velocity component at the measurement point; these values (shown as RMS Velocity X, RMS Velocity Y and RMS Velocity Z) are then plotted as a function of time in a graphics area. The RMS value is calculated in accordance with ISO 10816/1 using the following formula: (ISO 10816-1) and is reckoned on a buffer of 1024 measurements acquired every 125 ms. ISO 10816/1 describes different methods for assessing machine conditions using the root mean Fast FastTracer Tracer User Manual 17 FTAnalyzer Data Acquisition square (RMS) value of vibration velocity measured at certain measurement points. Of the various criteria specified by the standard, “vibration magnitude” is most commonly used. According to this criterion, the level of vibration for each machine (i.e. in a given class) is divided into 4 ranges rated in the figure shown below from green (good) to red (unacceptable) in increasing order of importance. VRms Vibration Severity ISO 10816 in/s mm/s 0,01 0,28 0,02 0,45 0,03 0,71 0,04 1,12 0,07 1,80 0,11 2,80 0,18 4,50 0,28 7,10 0,44 11,20 0,71 18,00 1,10 28,00 1,77 45,00 Classe I Classe II Classe III Classe IV vibration level ISO 10816 This method is used to monitor overall machine behaviour over time and determine its operating status. For further details on this subject and on the use of the VRMS measurement, please refer to the standard [4]. 3.5.1.1 Time: display options The text boxes and buttons below the scroll bar of each Graphics area showing time domain measurements can be used to change display parameters. The table below provides the different options and related explanation. Ti me do ma in G ra p h ic s a rea di s pl a y pa ra met er s To highlight the colour of the analysed event To set up the diagram Y axis scale To offset the displayed signals by the set up quantity To set up the diagram X axis scale 18 FTAnalyzer Data Acquisition Advanced settings Through the Settings button, you can access the advanced settings to select the events to be displayed or to apply filters to the acquisition measures. 3.5.1.1.1 Time: Selection of displayed values To select the track to be displayed, proceed as follows: FTAnalyzer: track selection – Time Settings ► Track the different options allow to include/exclude the analysed event through check boxes, colour and type of line used for display. 3.5.1.1.2 Time: Filters To filter acquisition measures, proceed as follows: Settings ► Filters FTAnalyzer:filter activation. the different options allow the filter selection and its cut-off frequency setting through check boxes. As shown in the figure, you can enable Low Pass and High Pass filters. Both are 4th-order filters with 80dB/decade gradient. 3.5.2 Frequency: frequency domain measurement To display measures in the frequency domain, select FREQUENCY in the View Type combo box, and then select the event whose frequency spectrum is to be examined in the second combo box. The program makes it possible to analyse the spectrum of one of the following events: Fast FastTracer Tracer User Manual 19 FTAnalyzer Data Acquisition FTAnalyzer: Frequency domain analysis • FFT Acceleration: to display the frequency spectrum of acceleration x, y, z components measured by the acquisition device; • FFT Velocity: to display the frequency spectrum of velocity x, y, z components measured by the acquisition device; • FFT Displacement: to display the frequency spectrum of displacement x, y, z components measured by the acquisition device. 3.5.2.1 Frequency: display options The text boxes and buttons below the scroll bar of each Graphics area showing frequency domain measurements can be used to change display parameters. The table below provides the different options and related explanation. F re que n cy d o ma i n G ra phi cs Area di s pl a y pa ra met er s To highlight the colour of the analysed event. To set up the minimum value of the diagram X axis scale To set up the maximum value of the diagram X axis scale To set up the minimum value of the diagram Y axis scale To set up the maximum value of the diagram Y axis scale Number of points used to display the FFT diagram Y axis value (peak, peak-to-peak, rms) 20 FTAnalyzer Data Acquisition Advanced settings The FFT points parameter also provides the frequency resolution, i.e. the number of points (called samplings) allocated to the frequency field from 0 Hz to 2500 Hz, as follows: Resolution= F sampling FFT points If the user requires a high frequency resolution, a high number of points shall be used, i.e. a high value of the FFT points parameter. However, the data buffer used for the spectrum calculation shall include a sampling number twice the FFT points number. As a result, for a high resolution the time needed to acquire this points number (2 * FFT points) can last a dozen of seconds. For the correct assessment of the time needed to acquire 2 * FFT points, use the following relation: Time Acquisition= 2 FFT point Sample Rate The table below shows the acquisition time needed for a given number of FFT points considering a sampling speed of 81922 samples/s. FFT points Time Request [s] 256 0.03 512 0.06 1024 0.11 2048 0.23 4096 0.45 8192 0.9 16384 1.81 32768 3.62 65536 7.24 131072 14.47 262144 28.95 524288 57.89 3.5.2.1.1 Frequency: selection of displayed values To select the track to be displayed, proceed as follows: Fast FastTracer Tracer User Manual 21 FTAnalyzer Data Acquisition Settings ► Track FTAnalyzer: Selection of tracks and display parameters frequency You can select the analysed event, the colour and type of line for display by using the check boxes. 3.5.2.1.2 Frequency - scale changes: dB, linear The software makes it possible to change scales and frequency spectrum diagram values, in particular: Y Scale Type: to set the type of scale (linear; dB); Y Measure Unit: unit of measurement used on y axis (m/s2; g); X Measure Unit: unit of measurement used on x axis (Hz; rpm); dB Ref Value: reference value setting to calculate decibels for the display with scale type dB on Y axis. 3.5.2.1.3 Overall measurement Opening a new FFT view the three axes Overall indication appears on the upper right side of the window. The Overall is an algorithm able to evaluate, inside a well-defined bandwidth, the vibration total value; this computation shows an idea of the total vibration effect but doesn't offer an evaluation of the magnitude distribution at the single frequency component. 22 FTAnalyzer Data Acquisition Once the bandwidth is defined (between MinX(Hz) and MaxX(Hz)) the Overall is computed according to the following formula ∑ n Overall= A2i i=0 Where n is the total rows number in the defined bandwidth and Ai is the amplitude of each row of all the rows in the vibration spectra in the same bandwidth. 3.5.3 Triggered: event synchronized measures The TRIGGERED mode enables the synchronization of data acquisition with vibrational events whose characteristics have been set by the user (called trigger levels or thresholds) for an established time. Trigger thresholds can be set only for acceleration components and the trigger function can be enabled on more axes at the same time according to the OR logic. When the acceleration component size exceeds an established trigger level, the FTAnalyzer will detect the related event. In particular, if the trigger function is set up as positive, the FTAnalyzer will detect the event when the signal exceeds the threshold up the slope; if the trigger function is set up as negative, the FTAnalyzer will detect the event when the signal exceeds the threshold down the slope. After the trigger event, the FTAnalyzer will be waiting for the time established by the user to elapse and then stop the measure acquisition. To select the trigger function, click on TRIGGERED in the view type combo box. Measurements taken this way will be reported both in the time and frequency domain. To select the value to be measured, select one of the following terms in the Signal Type combo box: Fast FastTracer Tracer User Manual 23 FTAnalyzer Data Acquisition FTAnalyzer: trigger function Axes & FFT Acceleration: the Graphics area is subdivided into two parts displaying the time progress and the frequency spectrum of acceleration x, y, z components measured by the acquisition device; Axes & FFT Velocity: the Graphics area is subdivided into two parts displaying the time progress and the frequency spectrum of velocity x, y, z components measured by the acquisition device; Axes & FFT Displacement: the Graphics area is subdivided into two parts displaying the time progress and the frequency spectrum of displacement x, y, z components measured by the acquisition device. FTAnalyzer: trigger parameters To enable the trigger function, set the threshold values in the trigger toolbar as shown below. Tri g g er To o l ba r SINGLE to enable the trigger function. NONE to disable to trigger function To set the trigger value POSITIVE acquisition starts when the signal exceeds the trigger value up the slope. NEGATIVE acquisition starts when the signal exceeds the trigger value down the slope Stop time after trigger event in ms Axis for trigger detection according to OR 24 FTAnalyzer Data Acquisition 3.6 File device The files including acquired measures can be processed by FTAnalyzer. The software will process these files as virtual devices called File Devices which provide the time records of the stored acceleration components. 3.6.1 Measure recording To save measures to a file, click the toolbar Select File icon The file save view will be displayed with the directory where measures can be stored and the archive named. Note The file name will include some information set by default as follows: Filename_Year_Month_Day_hourminutesseconds e.g. if the file name assigned by the user is motor, the following will be created: motor_2009_Dec_03_111732 FTAnalyzer files do not have any default extension, therefore the user is free to choose any. After creating the file, the Device Toolbar text box will display the file path and name. Use the following keys to record measures. Recording state Possible Action OFF single click to start recording ON single click to stop recording Please note that if you press the Hold key during recording, you will stop scrolling the measure diagram; anyway measures will be saved in the file. Fast FastTracer Tracer User Manual 25 FTAnalyzer Data Acquisition 3.6.2 File device creation (virtual device) As stated above, FTAnalyzer processes stored measures as virtual devices. To create a File Device and load stored measures, proceed as follows: • Click on the New File Device icon; • Use the combination of Ctrl + F; • Click with the right button on the Device List and select new device from file.. then find the file to be loaded and click open. If the file is valid (see figure on the next page) and the data are valid, the following information will be displayed: 26 • the Device List shows a new device named [1] (see figure); • The lower part displays a sort of graphics area [2] providing an overview of the performed measurement and some information on sensor used, measure recording path, measurement time duration and occupied space; FTAnalyzer Data Acquisition FTAnalyzer: opening and reproduction of data stored in a File Device • The combo box [3] displays a floppy icon showing the virtual device. To reproduce or analyze the measure, open a new view by clicking New View and select the type of diagram to be displayed [time, frequency, trigger], making sure you choose the correct device in the third combo box. FTAnalyzer: Measure display in the File Device After opening the Graphics area, click twice on the view [2] to display measures: two vertical lines will indicate the measurement starting point (start cursor - yellow line), while the green line will scroll along the diagram to indicate the measurement point currently being read. Fast FastTracer Tracer User Manual 27 FTAnalyzer Data Acquisition You can also extract to another file some of the measures stored in the File Device and displayed in the Graphics area [2]. For this purpose, click on the Graphics area [2] by positioning the start cursor (yellow line) on the starting point of the interval to be extracted, open the pop-up menu by clicking with the mouse right button on the Graphics area [2] and select Extract to file from cursor start. The displayed view will indicate the interval minute length of the measure to be extracted. FTAnalyzer: extract data from File Device Please note that if a device has been created and a view has been closed by mistake, it can be opened again as follows: View►File Device 'File Device name' 3.7 Export to text file: measure export To export measures being acquired or saved to file, click the Hold key to stop scrolling information in the Graphics area. Click on the diagram and find the starting point so that a vertical bar will be displayed, then drag the latter up to the point where data shall be exported. Now open the pop-up menu with the mouse right button and select Export to text file…Please note that data will be exported consistently with the domain where measures are extracted from. From the pop-up menu you can also print out the Graphics area or save a file.jpg with the graphics area image. To remove selection, click Remove Selection… 28 FTAnalyzer Data Acquisition FTAnalyzer: data selection for export to text file In case of time domain measurements, the FTAnalyzer will display the following view where you can set up start time, end time and the respective associated samples. FTAnalyzer: export parameters After confirming, add the output file name. The whole selected part will be exported at a sampling speed of 81922 samples/s for time domain. If the frequency spectrum of one or more events is exported, the file points will correspond to the points used to display the selected part of the FFT diagram. The output file has a text structure, all data are organized in a column and separated by a comma. The first two lines provide information on sensor and measure, the third line is usually empty, while the fourth line provides the event label for each column. Fast FastTracer Tracer User Manual 29 FTAnalyzer Data Acquisition FTAnalyzer: acquisition of data exported to text file 3.8 Export to spreadsheet: measure export to MS - Excel files As mentioned above, FTAnalyzer can export measures in the native way to Microsoft Excel files: with this function the user can draw up office documents with the analysed measures, carry out additional calculations or take indirect measurements. To export measures being acquired or saved to file, select the Graphics area where the measures will be extracted from. Click on the diagram and find the starting point so that a vertical bar will be displayed, then drag the latter up to the point where data shall be exported. Now open the pop-up menu with the mouse right button and select Export to Spreadsheet. When the "Export to worksheet" view is displayed, set the number of points to be exported and click Export... The next view will ask the user to enter the text file name, proceed and click save as. 30 FTAnalyzer Data Acquisition FTAnalyzer: selection of number of samples to be exported to Microsoft Excel After saving the file, Microsoft Excel is started automatically; if you click Reload Data and select the previously acquired file, the data will be loaded and displayed on the screen. Microsoft Excel: document with analysed measures The Microsoft Excel document consists of a spreadsheet with measures and diagrams examined in the time and frequency domain. The spreadsheet provides the following columns of measures: • Sample (independent axis for time domain measures) • Acceleration (XA, YA, ZA); • Velocity (XV, YV, ZV); • Displacement (XD, YD, ZD); • Velocity RMS (RMS XV, RMS YV, RMS ZV); • Frequency (independent axis for frequency domain measures) • Acceleration spectrum (Spectrum XA, Spectrum YA, Spectrum ZA); • Velocity spectrum (Spectrum XV, Spectrum YV, Spectrum ZV); • Displacement spectrum (Spectrum XD, Spectrum YD, Spectrum ZD). 3.8.1 Note on Microsoft Excel configuration To import data to Microsoft Excel, enable external data macros and connections following the recommendations below: Click on the Microsoft Office key and then Excel options; Click on Protection Centre and then Protection Centre Settings; Fast FastTracer Tracer User Manual 31 FTAnalyzer Data Acquisition Find Macro Settings and select "Enable all macros"; Find the external Content in the "Data connection protection settings" and select "Enable all connections"; Microsoft Excel configuration In case of Microsoft Excel protection notice, click on the Option... key in the protection notice and select "Enable content". Microsoft Excel configuration - protection notice 32 FTAnalyzer Data Acquisition 3.9 Perspective save and load To save the view configuration, find the Perspective menu and proceed as follows: Perspective►Save perspective... or Ctrl + S To restore the previously saved view configuration, proceed as follows: Perspective►Load perspective....or Ctrl + O Fast FastTracer Tracer User Manual 33 FTEditor Test model FTEditor 4 .1 Philosophy of use As stated in the previous chapter, the analysis of vibrational problems with FTAnalyzer allows to define the cause-fault relation affecting the machine vibrational signature. For the best use of your software and to provide instruments improving your service, Sequoia IT has developed the FTEditor module of FTAnalyzer. FTEditor has been designed for diagnostics applications and its purpose is to help vibration experts to define diagnostics "paths" based on pre-established tests which can also be used by less skilled users. Before explaining how to use FTEditor, it is necessary to outline the involved professional figures and the way they can directly or indirectly interact with Sequoia IT software. Architecture for use of Sequoia IT software First, it is necessary to make a distinction between the vibration expert user (master) who will define the diagnostics paths for the different machines (according to a documented experience) and the maintenance operator who will implement the established models with FTEditor through the Esplora 3D software. In other words, the expert user will set up an archive with the different tests and related guidelines through FTEditor, while the maintenance operator will implement these tests for the machine state monitoring through the Esplora 3D software. And now we can analyse how FTEditor works at a first conceptual level. To understand 34 FTEditor Test model FTEditor operation, see the figure below which presents the reference conceptual model of an archive (Model Database) used to monitor a given machine. FTEditor: Model DB structure FTEditor: module start As shown in the first figure, the archive includes several tests (three in the figure) each based on a set of measurements. This archive, drawn up by an expert user, is a virtual maintenance tool consisting (in this case) of three tests and related measurements. For the machine diagnosis, the maintenance operator shall implement the three tests and carry out the required measurements. Of course, for each test it is advisable to work out a consistent set of measurements to be repeated an appropriate number of times. Each test will provide information on the machine state. Therefore, the established number of tests making up the archive shall cover all the machine aspects which need to be checked. The next chapter will deal with the creation of a specific machine-dedicated archive. 4.2 Start To access FTEditor, start up FTAnalyzer. To start up FTAnalyzer, find the start key and proceed as follows: Start►Programs►Sequoia IT FTAnalyzer►FTAnalyzer x.y.z.t Should the program not start or any error messages be displayed, follow the suggestions provided in paragraphs 2.3 and 2.5 of the present manual. To start FTEditor, proceed as follows: Fast FastTracer Tracer User Manual 35 FTEditor Test model • click FTEditor on the action toolbar; • click View►FTEditor in the text menu 4.3 Create new model By clicking on Create New Model, you can create a new set of tests for the machine condition monitoring. These models are useful mainly because they gather all the tests dedicated to a machine in one single file, thus becoming virtual diagnostics tools. To create a new archive, click on Create New Model to display a mask called Editing Model inside the main view; to set the archive, fill in the mask with machine description, machine family, manufacturer, reference model and machine images, and finally click Save to save the model. FTEditor: creation of a new model Please note that after saving the archive, on the mask left-hand side a model will be created with the same ID entered in the model field. 4.4 Add test After describing the machine to be examined, you must define the condition monitoring tests. To create a test, select the reference archive (which has the machine name) and click Add Test. 36 FTEditor Test model A mask will be displayed (as shown in the figure) called Editing Test Model 'ArchiveName'. FTEditor: creation of a new model - add images On the mask right-hand side, under the Image label, one of the analysed machine images defined during the model setting up will be displayed. It is possible to draw a red rectangle on the figure to highlight the area under examination. To draw the rectangle, click on the figure and drag the mouse until reaching the desired size. The rectangle will help the operator find the area to be measured. In the figure on the left, an additional image can be loaded (e.g. on the sensor positioning) to further help the operator. The text box shall give instructions to the operators taking measures, therefore it is recommended to compile it accurately. 4.5 Add measure After setting up the machine test, you must define the measures to be carried out on the machine. To add a measure, click on Add Measure.... Fast FastTracer Tracer User Manual 37 FTEditor Test model The displayed mask shall be used by the compiler user to set up the measures to be carried out by the maintenance operator, as well as the alarm reference values (thresholds) and related messages. FTEditor: creation of a new model - test simulation The table below shows the measure setting fields. Measure settings Name Measure name Signal Domain and event to be measured (e.g. time – frequency – Rms) Time Duration Measure time duration Axis Reference axis The Thresholds field defines thresholds in the frequency or time domain. When these thresholds are exceeded, the program will display messages informing the operator. As the aim of these messages is to help the operator perform diagnostics, they must be clear and easy to understand. Measure simulate Refresh Device List To refresh the device list Device Device used during simulation Simulate Measure To simulate measures on the field 38 FTEditor Test model Thresholds Name Threshold name Type Type of threshold constraint: maximum, minimum or warning Freq. Min Lower end of threshold field in frequency domain Freq. Max Upper end of threshold field in frequency domain Value Threshold value Message Message to be communicated to the operator Action Action to be taken by the maintenance operator The Graphics area below can be used to simulate measures to check the efficiency of the set parameter. Measure simulate Refresh Device List To refresh the device list Device Device used during simulation Simulate Measure To simulate measures on the field 4.6 Export database to file To export the database set up with FTEditor and use it on Esplora 3D, click on Export Database to file. Fast FastTracer Tracer User Manual 39 Esplora 3D Diagnosis Esplora 3D 5 .1 Philosophy of use Esplora 3D is Sequoia IT software solution designed for maintenance operators in charge of machine or installation diagnostics. Esplora 3D makes it possible for the maintenance operator to carry out predictive diagnosis by following the program instructions based on the comparison of threshold values. As outlined in the previous chapter, the expert user sets up an archive of the different tests and related guidelines with FTEditor, while the maintenance operator will perform these tests through the Esplora 3D software for the machine state detection. Architecture for use of Sequoia IT software Through the Esplora 3D specific module, it is possible to save these tests for the creation of automatic reports and maintenance sheets regarding the examined machine. Esplora 3D is based on the Model Instance and Model DB concepts explained below. 40 Esplora3D Diagnosis Model Instance The diagnosis made by a maintenance operator on a machine is based on data such as, manufacturer, serial number, location and main features (e.g. colour, processed substance, etc.); basically, every machine represents a specific case, therefore each machine is considered by Esplora 3D as a Model Instance. As a result, for the machine identification it is necessary to create a Model Instance by setting at least two of the parameters shown in the table. Parameter Meaning Serial Number Machine serial number Machine Identification Machine identification Location Machine location also in relation to a plant Machine Model Model Model DB Model DB is the archive regarding a specific machine family. It includes tests and related guidelines, as well as any actions to be taken in case of faults. Esplora 3D: start 5.2 Start To start up Esplora 3D, click start and then proceed as follows: Fast FastTracer Tracer User Manual 41 Esplora 3D Diagnosis Start►Programs►Sequoia IT Esplora 3D►Esplora 3D 1.2.z.t Should the program not start or any error messages be displayed, follow the suggestions provided in paragraphs 2.3 and 2.5 of the present manual. When Esplora 3D is started, the program main view will display two options: Test Model Instance and Browse Model Instance Tests Reports. The Test Model Instance key will start the machine diagnostics procedures, while the Browse Model Instance Tests Reports key will browse stored reports. Before diagnostics, always make sure that the software has loaded the suitable archive (Model DB). 5.2.1 Import Model DB As stated above, make sure that Esplora 3D has loaded the Model DB concerning the analysed machine. Proceed as follows: File►Import Model DB or press Ctrl + 1 An open file… view will be displayed, select the reference database and click open. 5.3 Test model instance: model - machine selection To carry out the machine diagnosis, click on Test Model Instance. Esplora 3D: model selection 42 Esplora3D Diagnosis A view will be displayed with two sections: the top one is called Models and the bottom one Instances. The Models section shows the models available in the database, while the Instances section shows the Model Instances concerning the selected model. Should the Models section not show the class of the examined machine, make sure the database is correct (see previous point). The view also displays three buttons with the following functions: • Create Model Instance to create an instance of the loaded model; • Back to cancel operation and return to the previous view; • Test Selected Instance to carry out tests. Select the model in the Models section and the created instance in the Instances section, then click on Test Selected Instance and carry out diagnosis. It is necessary to select the machine model (Model) and the instance (Model Instance) which must be created as explained below. 5.3.1 Create model instance: instance creation To create a new instance, click on Create Model Instance and fill in the displayed mask with at least two information on the examined machine. Esplora 3D: Model Instance creation Indicate as many data as possible for future quick report identification. Fast FastTracer Tracer User Manual 43 Esplora 3D Diagnosis 5.3.2 Test selected instance: diagnostics To start testing, click on Test Selected Instance. A new view is displayed with the image of a machine like the one being tested. Moreover, the concerned area of the machine is highlighted by a red rectangle drawn on the image. Next and Prev keys can be used to display other images, if loaded. Esplora 3D: Operator instructions After identifying the sensor positioning area, you can perform tests by clicking Execute All Tests. Another view will be displayed with the operator instructions and an image providing further information to the user. The view top part also shows the machine identification and the name of the test being prepared. After clicking Next, the program will ask to find the acquisition device to be used, if more devices are connected. Esplora 3D: Test 44 Esplora3D Diagnosis The test time duration was established by the expert user who set up the test model, therefore the operator does not have any control over the acquisition time length. Esplora 3D: test result. When the test is complete, the program will show the result in the section below the Graphics area. In case of failure, the database message will be displayed again with the related suggested action to be taken. When the test is concluded, the operator can decide to draw up a report and save it on disk. The program will execute all the tests in the machine archive. 5.4 Browse model instance: see reports By clicking Browse Model Instance Tests Report the user can see the stored test results, as in a virtual test archive. Esplora 3D: browse reports Fast FastTracer Tracer User Manual 45 Esplora 3D Diagnosis 5.5 Menu The pop-up menu toolbar of Esplora 3D consists of three pop-up menus offering different actions. The table below provides the list of menus and their general description. File Import Model DB To import a test archive Exit To exit the program View Show Device To view the device list Fullscreen Full screen application Help About 46 Information on FastTracer Wi-Fi communication Communication device FastWI Wireless Communication Device FastWI FastWI is the WI-FI (Wireless Fidelity) communication interface adapted for the triaxial vibration analysis instrument FastTracer. In the following manual section you can find the main technical device feature and the correct FastWI installation procedure. This configuration has to be made just once on every computer you want to use to communicate with FastTracer by FastWI. In case you loose the net settings and/or it's needed to restore the FastWI default status, the device has a RESET button on its back side, that if pushed for more than 7 seconds, configure FastWI at its original status (and you have to repeat the configuration procedure here showed). 6 .1 Package description The FastWI box includes: – 1 FastWI device – 1 M5 power supply cable with length of 2 m – 1 Universal AC Adapter – 1 Screw Adapter to connect power supply cable and the AC adapter – 1 FastWI Antenna – 1 CD with configuration software LANTRONIX WiPORT – Installation and Technical Description Sheet Fast FastTracer Tracer User Manual 47 Wi-Fi communication Communication device FastWI 6.2 Installation At the first installation follow the next steps 1. Plug the FastTracer device to the FastWI. Please take care of a proper locking connection 2. Connect the Antenna to the SMA connector on the FastWI. 3. Connect the power supply cable to to the monitored machine with a DC voltage in the range between 12 and 30 Volt. In case of no permanent installation, please use the AC Adapter (by the specific Screw Adapter in the box). Take into account to respect the right terminals color in order to properly supply the device. The Voltage positive is identified by red terminal (the negative by the black one) 4. Insert the CD and install the software Lantronix Device Installer (also available on the FTAnalyzer CD and on the Lantronix website www.lantronix.com). 5. When the installation ends, search on the wireless nets, available on Windows, the FastWI one and connect to it (clicking on the “connect” button). 6. Run the program Lantronix Device Installer. Click on Search (upper left side of the widnow) and wait until the device is recognized. 7. Fig. : Search for devices on the net 8. When FastWI has been recognized a short device description apperas on the window right side . Among these data you can read the IP Address 9. Open your internet browser and copy this IP address. A login Window appear. Leave everything blank and click “Login”. 10. A web interface to configure the device appears. Choose the same parameter of the net where you're going to insert the FastWI on the “Network” menu on the left side. Then click on the “Server menu” (on the same menu) 48 Wi-Fi communication Communication device FastWI 11. The “CPU performance mode” must be set on “high”. On the same menu click on menu voice “channel 2”->”Serial Settings” and copy the following configuration: • • • • • • Protocol: RS422/RS485 – 4 WIRE Baudrate: 921600 Data Bits: 8 Flow Control: NONE Parity: NONE Stop Bits: 1 Don't modify all the other parameters. Please take into account that, if the FastWI configuration parameters should be different from your typical working net you could have to connect again to this new net to identify the FastWI. Apply the net modification. Now the device is ready to be used by the FT anlayzer software and to be recognized by it in the devices list. Fast FastTracer Tracer User Manual 49 Wi-Fi communication Communication device FastWI WiFi Interface - Technical Specification The WiFi interface connects a FastTracer device to a PC through a WLAN, either point to point or in infrastructure configuration. Features • Remote devices access enabling • Industry standard 802.11b/g interface • No need dedicated software • FastTracer ready connection • Wireless security in according to IEEE 802.11-PSK, WPA-PSK, TKIP • Small size and low power consumption Mechanical dimensions (approx) • L=100 mm • W=50 mm • H=20 mm • Weight= 150 g • Easy to fix with magnetic feet Network Interface • 802.11b/g WLAN • Connector: Antenna (RP-SMA) • Standards: WPA, WEP, ARP, UDP/IP, TCP/IP, ICMP, SNMP,AutoIP, DHCP,TFTP, Telnet and HTTP Serial Interface Security • Connector: Waterproof LF07 • IEEE 802.11b/g – PSK Encryption • RS422 Serial Protocol • WPA – PSK • Data Rate: 921600 bit/s • TKIP Encryption • Characters: 8 data bits • 64/128 bit WEP • No parity • 1 Stop Bits Environmental (stima) • Operating temperature range: -40 to 70 ° C • Operating Humidity: 0 to 95%, non condensing • Storage temperature range: -40 to 85 ° C Power • Wide input range: 12 - 30 VDC Certifications 50 • Industrial environment: CEI UNI EN 61000-6-2, CEI UNI EN 61000-6-4 • Protection IP40 Index Action Toolbar (FTAnalyzer)..........................................................................................16 Add measure (FTEditor)..................................................................................................36 Add test (FTEditor).........................................................................................................35 Axes.................................................................................................................................17 Axes & FFT Acceleration................................................................................................23 Axes & FFT Displacement..............................................................................................23 Axes & FFT Velocity.......................................................................................................23 Axes & Modules..............................................................................................................17 Bandwidth........................................................................................................................22 Browse model instance:...................................................................................................44 Calibration.........................................................................................................................2 Conventions.......................................................................................................................8 Create Model Instance.....................................................................................................42 Create New Model (FTEditor)........................................................................................35 Cut-off frequency.............................................................................................................19 Data export to spreadsheet...............................................................................................30 Devices List.....................................................................................................................12 Diagnostics "paths" .........................................................................................................33 Diagnostics levels..............................................................................................................3 Drivers...............................................................................................................................6 Esplora 3D installation .....................................................................................................6 Execute All Tests.............................................................................................................43 Export database to file (FTEditor)...................................................................................38 Export to text file.............................................................................................................27 Extract to file from cursor...............................................................................................27 Fastening............................................................................................................................7 FFT Acceleration (FTAnalyzer).......................................................................................19 FFT Displacement (FTAnalyzer).....................................................................................20 FFT Velocity (FTAnalyzer)..............................................................................................20 File device creation .........................................................................................................25 File Devices................................................................................................9, 12,13, 24, 26 Filters (FTAnalyzer)........................................................................................................19 Frequency......................................................................................................3, 8 e seg., 17 Frequency band..................................................................................................................2 Frequency: frequency domain measurement...................................................................19 FTAnalyzer installation.....................................................................................................5 FTAnalyzer interface ......................................................................................................10 Full scale............................................................................................................................3 FastWI.............................................................................................................................46 Graphics area.........................................................................................................11,18,26 Import Model DB (Esplora 3D).......................................................................................41 License...............................................................................................................................6 Maximum number of FastTRACER......................................................................7 e seg. Measure settings (FTEditor)............................................................................................37 Measure simulate (FTEditor).................................................................................37 e seg. Measurement device..........................................................................................................2 Menu toolbar (Esplora 3D)..............................................................................................45 Menu toolbar (FTAnalyzer)...................................................................................13 e seg. Model DB .......................................................................................................................34 Fast FastTracer Tracer User Manual 51 Model Instance (Esplora 3D)...........................................................................................40 New view....................................................................................................................13,16 Oscilloscope mode...........................................................................................................17 Overall.............................................................................................................................22 Philosophy of use (FTAnalyzer) .......................................................................................4 Philosophy of use (Esplora 3D).......................................................................................39 Philosophy of use (FTEditor)..........................................................................................33 Protection level..................................................................................................................2 Reference tern....................................................................................................................3 Refresh Device List key..................................................................................................12 Remove Selection…........................................................................................................27 Resolution........................................................................................................................20 Rms....................................................................................................................9, 17 e seg. Sample rate........................................................................................................................3 Self-diagnosis ...................................................................................................................2 Sensor positioning and fastening.......................................................................................6 Settings (FTAnalyzer)......................................................................................................13 Start (Esplora 3D)............................................................................................................40 Start (FTEditor)...............................................................................................................34 Start (FTAnalyzer)...........................................................................................................10 System requirements..........................................................................................................5 Technical specifications.....................................................................................................2 Technical specifications (Wi-Fi)......................................................................................49 Test Model Instance (Esplora 3D)...................................................................................41 Test Selected Instance......................................................................................................43 Thresholds (FTEditor)...........................................................................................37 e seg. Track (frequency domain)...............................................................................................21 Track (time domain)........................................................................................................19 Triggered............................................................................................................................9 Triggered mode................................................................................................................23 Triggered: event synchronized measures.........................................................................23 View Type........................................................................................................................17 Virtual device...................................................................................................................25 Wi-Fi interface ................................................................................................................46 52 Bibliography: 1. Analysis I - "How to implement an effective condition monitoring program using vibration analysis " - Technical Associates of Charlotte, P.C. 2. Analysis II - "Concentrated vibration signature analysis and related condition monitoring techniques" - Technical Associates of Charlotte, P.C. 3. "An introduction to random vibration, spectral & wavelet analysis" Shock and Vibration Handbook - Cyril M. Harris Fast FastTracer Tracer User Manual 53 Notes 54 Sequoia IT s.r.l via Einaudi, 25 10024 Moncalieri - TO - Italy [email protected] www.sequoia.it