1
PicoScope
Virtual Instrument
User Manual
Version 2.0 rev 3
by
M K Green
Pico Technology Limited
149-151 St Neots Road
Hardwick
Cambs CB3 7QJ
GB
Tel: 44-954-211716
Fax: 44-954-211880
Copyright 1994 Pico Technology Limited
PicoScope
user manual
PicoScope
user manual
Y axis . . . . . . . . . . . . . . . . . . . . . . . . . . . . . . . . . . . . . . . . . . 31
Notes . . . . . . . . . . . . . . . . . . . . . . . . . . . . . . . . . . . . . . . . . . 32
Ruler . . . . . . . . . . . . . . . . . . . . . . . . . . . . . . . . . . . . . . . . . . . 33
Contents
1 Introduction . . . . . . . . . . . . . . . . . . . . . . . . . . . . . . . . . . . . . . . . . . 1
2 Getting started . . . . . . . . . . . . . . . . . . . . . . . . . . . . . . . . . . . . . . . . 1
9 Meter panels . . . . . . . . . . . . . . . . . . . . . . . . . . . . . . . . . . . . . . . . . 34
Meter / Meter 1 / Meter 2... . . . . . . . . . . . . . . . . . . . . . . . . . . 34
Label 1 . . . . . . . . . . . . . . . . . . . . . . . . . . . . . . . . . . . . . . . . . 35
3 Command line parameters . . . . . . . . . . . . . . . . . . . . . . . . . . . . . . . 4
4 Modes of Operation . . . . . . . . . . . . . . . . . . . . . . . . . . . . . . . . . . . . 5
Using PicoScope as an oscilloscope . . . . . . . . . . . . . . . . . . . 5
Using PicoScope as an XY scope . . . . . . . . . . . . . . . . . . . . . 8
Using PicoScope as a spectrum analyser . . . . . . . . . . . . . . . . 9
Using PicoScope as a digital meter . . . . . . . . . . . . . . . . . . . . 11
5 Common Panels . . . . . . . . . . . . . . . . . . . . . . . . . . . . . . . . . . . . . . . 14
Setup . . . . . . . . . . . . . . . . . . . . . . . . . . . . . . . . . . . . . . . . . . . 14
Printing . . . . . . . . . . . . . . . . . . . . . . . . . . . . . . . . . . . . . . . . . 15
Files . . . . . . . . . . . . . . . . . . . . . . . . . . . . . . . . . . . . . . . . . . . . 16
Mode . . . . . . . . . . . . . . . . . . . . . . . . . . . . . . . . . . . . . . . . . . . 17
6 Oscilloscope panels . . . . . . . . . . . . . . . . . . . . . . . . . . . . . . . . . . . . 18
Timebase . . . . . . . . . . . . . . . . . . . . . . . . . . . . . . . . . . . . . . . . 18
Trigger . . . . . . . . . . . . . . . . . . . . . . . . . . . . . . . . . . . . . . . . . . 19
Trace / Trace A / Trace B . . . . . . . . . . . . . . . . . . . . . . . . . . . . 21
Left/Right Y axis . . . . . . . . . . . . . . . . . . . . . . . . . . . . . . . . . . . 22
Notes . . . . . . . . . . . . . . . . . . . . . . . . . . . . . . . . . . . . . . . . . . . 23
Ruler . . . . . . . . . . . . . . . . . . . . . . . . . . . . . . . . . . . . . . . . . . . 24
7 XY scope panels . . . . . . . . . . . . . . . . . . . . . . . . . . . . . . . . . . . . . . . 25
Timebase . . . . . . . . . . . . . . . . . . . . . . . . . . . . . . . . . . . . . . . . 25
Trigger . . . . . . . . . . . . . . . . . . . . . . . . . . . . . . . . . . . . . . . . . . 26
X Axis / Y Axis . . . . . . . . . . . . . . . . . . . . . . . . . . . . . . . . . . . . 27
X Label/Y Label . . . . . . . . . . . . . . . . . . . . . . . . . . . . . . . . . . . 28
Notes . . . . . . . . . . . . . . . . . . . . . . . . . . . . . . . . . . . . . . . . . . . 29
8 Spectrum Analyser Panels . . . . . . . . . . . . . . . . . . . . . . . . . . . . . . . 30
Sampling . . . . . . . . . . . . . . . . . . . . . . . . . . . . . . . . . . . . . . . . 30
Version 2.0 rev 2
Page i
Page ii
Version 2.0 rev 2
PicoScope
user manual
PicoScope
user manual
1 Introduction
This is the user manual for PicoScope for DOS. For information about
PicoScope for Windows, please consult the help file which can be
accessed directly from the program.
PicoScope for DOS is a powerful but easy to use program which enables
you to use the Pico Technology range of analog to digital converters
(ADCs) to provide the functions of a storage oscilloscope, a spectrum
analyser and a digital meter.
The first section of this manual gives a quick guide to using each of the
main functions: the remainder of the manual describes in detail each of the
control panels.
Please read the file README.DOC on the floppy disk for any updates to
this manual since printing.
2 Getting started
PicoScope may be run from either floppy or hard disk, but you must install
it before use. To install the program from drive A:, type A:INSTALL. The
computer will ask you for the name of the directory to copy the files into.
To run the program, go to the directory you specified and type PS. For
monochrome displays, type PS -b. The logo and copyright notice should
appear on the computer screen: press any key to clear the copyright
notice.
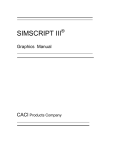
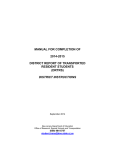
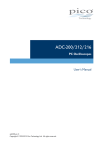
The screen should now look like this. The first time you run the program,
it will start up in oscilloscope mode. The majority of the screen is an
oscilloscope trace. At the left there is the Mode panel - the title (mode),
four buttons - marked Meter, Scope, XY scope and Spectrum - and
pointers to the next and previous panels. At the bottom of the screen is a
help window: once you become more familiar with PicoScope, you can use
the F1 key to turn off the help window and have a larger oscilloscope
display. Pressing the F1 key again brings back the help window when you
need it.
The Scope button is highlighted - you can use the cursor up and down keys
to move the highlight up and down. As you do so, the mode will change to
whichever button is highlighted.
Version 2.0 rev 2
Page 1
Page 2
Version 2.0 rev 2
PicoScope
user manual
PicoScope
user manual
1 Introduction
This is the user manual for PicoScope for DOS. For information about
PicoScope for Windows, please consult the help file which can be
accessed directly from the program.
PicoScope for DOS is a powerful but easy to use program which enables
you to use the Pico Technology range of analog to digital converters
(ADCs) to provide the functions of a storage oscilloscope, a spectrum
analyser and a digital meter.
The first section of this manual gives a quick guide to using each of the
main functions: the remainder of the manual describes in detail each of the
control panels.
Please read the file README.DOC on the floppy disk for any updates to
this manual since printing.
2 Getting started
PicoScope may be run from either floppy or hard disk, but you must install
it before use. To install the program from drive A:, type A:INSTALL. The
computer will ask you for the name of the directory to copy the files into.
To run the program, go to the directory you specified and type PS. For
monochrome displays, type PS -b. The logo and copyright notice should
appear on the computer screen: press any key to clear the copyright
notice.
The screen should now look like this. The first time you run the program,
it will start up in oscilloscope mode. The majority of the screen is an
oscilloscope trace. At the left there is the Mode panel - the title (mode),
four buttons - marked Meter, Scope, XY scope and Spectrum - and
pointers to the next and previous panels. At the bottom of the screen is a
help window: once you become more familiar with PicoScope, you can use
the F1 key to turn off the help window and have a larger oscilloscope
display. Pressing the F1 key again brings back the help window when you
need it.
The Scope button is highlighted - you can use the cursor up and down keys
to move the highlight up and down. As you do so, the mode will change to
whichever button is highlighted.
Version 2.0 rev 2
Page 1
Page 2
Version 2.0 rev 2
PicoScope
user manual
The mode panel is only one of several panels: different functions are
available for each mode, so each mode has a different set of panels. To
move to other panels, press PgUp to go back the previous panel and
PgDn to go to the next panel. Once you become more familiar with the
panels, you can go directly to a particular panel by holding down the Alt
key and typing the first letter of the panel name. All the meters begin with
M, so you would have to enter Alt-M five times to get to meter 5. To
prevent this problem, you can type Alt and the meter number, for example
- eg Alt-3 for Meter 3.
PicoScope
user manual
Each panel has a number of buttons. There are three main sorts of
buttons:
C
selection
C
number
C
text.
For a selection button, pressing the space bar advances to the next option.
'+' and cursor right also move to the next option: '-' and cursor left move
back an option.
For a number button, you can either increase the number value by typing
in '+' for large increments or cursor right for small increments. '-' and cursor
left have the same effect for decreasing the value. For some number
buttons, you can also type in the value that you require.
For a text button, type in the text that you require and press Enter. For
more than one line of text, press Tab after the end of each line.
3 Command line parameters
When you start up PicoScope, there are a number of controls that you can
specify on the command line. For most applications, the program will run
normally without any command line options. The following line shows a
command line which uses all of the options.
ps -b -p1 -a278 -sFRED
C
C
C
C
-b specify that the screen is black and white
-p1 use printer port 1 for the ADC
-a278 use the printer port at address 278 for the ADC
-sFRED use the setup file FRED (see SETUP panel)
Note that the -a and -p options would not normally be used at the same
time.
Version 2.0 rev 2
Page 3
Page 4
Version 2.0 rev 2
PicoScope
user manual
4 Modes of Operation
This section gives a brief introduction to using PicoScope in each operating
mode, and the facilities available.
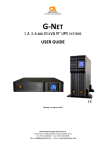
4.1 Using PicoScope as an oscilloscope
When the Scope button is highlighted on the Mode panel, PicoScope
works like a storage oscilloscope.
PicoScope
user manual
division than you expect to use, to make sure that you do not miss
anything. Once you have found what you wish to observe, you can then
reduce the time per division until the event you wish to observe is big
enough to see clearly.
If the trace is jumping back and forth in each successive display, you can
either stop the update or use the trigger facility. To stop the update, press
the Run button- it changes to Stopped when you press it,
The trigger facility tells the computer to display the trace at the same place
on the screen each time. Press PgDn to go to the Trigger panel. To
specify a trigger event - for example, when channel 4 rises past 50%. To
do this, go to the trigger panel and set Channel to 4, Threshold to 50%
and Direction to Rising. Picoscope will now only refresh the display when
this trigger event occurs. The trigger channel need not be one of the traces
you are displaying.
You can specify that the display will start a certain fixed time before or after
the trigger event, by adjusting the trigger delay. A Delay of minus 50% is
very useful, as the trigger event will appear in the middle of the screen.
If you have an event which only occurs occasionally, you can set the trigger
Mode to single: the computer will collect only one trace after the trigger
occurs, then it will stop, leaving the event on the display.
You can zoom in on just a small part of the display using the Multiplier and
Offset buttons. The buttons on the Timebase panel control the size and
position of the display in the X direction. The same buttons on the Trace
panel affect the Y direction. These can be used both whilst collecting the
data and once you have collected a trace.
You can add labels to the Y axis, and add a heading and notes to the
trace.
Press PgDn to go to the Timebase panel, then use the Timebase button
to specify the time per division. This can be from 100µs to 5 seconds
(100µs is not available for all ADCs). The computer will display data
continuously as it is collected. It is best to start off with a longer time per
If you wish to measure the time interval between two points, go to the
Rulers panel. There are two rulers - X and O - which can be moved
independently. As you move the rulers, the computer calculates and
displays the time interval between them.
Version 2.0 rev 2
Page 6
Page 5
Version 2.0 rev 2
PicoScope
user manual
4 Modes of Operation
This section gives a brief introduction to using PicoScope in each operating
mode, and the facilities available.
4.1 Using PicoScope as an oscilloscope
When the Scope button is highlighted on the Mode panel, PicoScope
works like a storage oscilloscope.
PicoScope
user manual
division than you expect to use, to make sure that you do not miss
anything. Once you have found what you wish to observe, you can then
reduce the time per division until the event you wish to observe is big
enough to see clearly.
If the trace is jumping back and forth in each successive display, you can
either stop the update or use the trigger facility. To stop the update, press
the Run button- it changes to Stopped when you press it,
The trigger facility tells the computer to display the trace at the same place
on the screen each time. Press PgDn to go to the Trigger panel. To
specify a trigger event - for example, when channel 4 rises past 50%. To
do this, go to the trigger panel and set Channel to 4, Threshold to 50%
and Direction to Rising. Picoscope will now only refresh the display when
this trigger event occurs. The trigger channel need not be one of the traces
you are displaying.
You can specify that the display will start a certain fixed time before or after
the trigger event, by adjusting the trigger delay. A Delay of minus 50% is
very useful, as the trigger event will appear in the middle of the screen.
If you have an event which only occurs occasionally, you can set the trigger
Mode to single: the computer will collect only one trace after the trigger
occurs, then it will stop, leaving the event on the display.
You can zoom in on just a small part of the display using the Multiplier and
Offset buttons. The buttons on the Timebase panel control the size and
position of the display in the X direction. The same buttons on the Trace
panel affect the Y direction. These can be used both whilst collecting the
data and once you have collected a trace.
You can add labels to the Y axis, and add a heading and notes to the
trace.
Press PgDn to go to the Timebase panel, then use the Timebase button
to specify the time per division. This can be from 100µs to 5 seconds
(100µs is not available for all ADCs). The computer will display data
continuously as it is collected. It is best to start off with a longer time per
If you wish to measure the time interval between two points, go to the
Rulers panel. There are two rulers - X and O - which can be moved
independently. As you move the rulers, the computer calculates and
displays the time interval between them.
Version 2.0 rev 2
Page 6
Page 5
Version 2.0 rev 2
PicoScope
user manual
Once you have a trace which displays exactly what you are interested in,
you can save the trace to disk or print it out. Note that, to print out a trace,
you must have the PICO.DRV file available in the current directory.
If you have saved a number of traces, you can look through them by
selecting the directory, then moving to the Load button. Each time you
press the space bar, the computer displays the next trace in this directory.
PicoScope
user manual
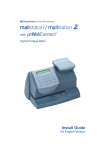
4.2 Using PicoScope as an XY scope
When the Scope button is highlighted on the Mode panel, PicoScope
displays a graph of one input channel against another. This is useful for
comparing the input and output signals of a circuit when looking for phase
differences, non-linearity or clipping. This function is available only on
multi-channel ADCs.
You can use the Save text file option to save data in a format suitable for
entry into a spreadsheet or database.
If you use the same settings every time, you can save them to a setup file
using the Save setup button on the Setup panel.
Initially, the computer displays channel 1 along the X axis and channel 2
on the Y axis.
If you press PgDn, the computer displays the Timebase panel: you can set
the total time for each scan, and specify whether successive points are to
be joined. This is useful if both parameters vary continuously over the
Version 2.0 rev 2
Page 7
Page 8
Version 2.0 rev 2
PicoScope
user manual
Once you have a trace which displays exactly what you are interested in,
you can save the trace to disk or print it out. Note that, to print out a trace,
you must have the PICO.DRV file available in the current directory.
If you have saved a number of traces, you can look through them by
selecting the directory, then moving to the Load button. Each time you
press the space bar, the computer displays the next trace in this directory.
PicoScope
user manual
4.2 Using PicoScope as an XY scope
When the Scope button is highlighted on the Mode panel, PicoScope
displays a graph of one input channel against another. This is useful for
comparing the input and output signals of a circuit when looking for phase
differences, non-linearity or clipping. This function is available only on
multi-channel ADCs.
You can use the Save text file option to save data in a format suitable for
entry into a spreadsheet or database.
If you use the same settings every time, you can save them to a setup file
using the Save setup button on the Setup panel.
Initially, the computer displays channel 1 along the X axis and channel 2
on the Y axis.
If you press PgDn, the computer displays the Timebase panel: you can set
the total time for each scan, and specify whether successive points are to
be joined. This is useful if both parameters vary continuously over the
Version 2.0 rev 2
Page 7
Page 8
Version 2.0 rev 2
PicoScope
user manual
whole scan, but gives a spider's web if both channels dot about all over the
place.
Press PgDn again for triggering. This is the same as for the Oscilloscope
function: it enables you to control when the scan will start.
The next four panels enable you to label the X and Y axes, either with
voltages or with user-defined parameters. This might be useful if, for
example, you wanted a plot of stress against strain.
4.3 Using PicoScope as a spectrum analyser
When the spectrum button is highlighted on the mode panel, PicoScope
operates as a spectrum analyser.
PicoScope
user manual
Press PgDn for the Sampling panel. You can now specify the minimum
and maximum frequency that you wish to monitor. PicoScope will now
display the selected frequency range, updating the display continuously.
The X scale is the frequency: the Y scale is the amplitude at that
frequency. Note that, if you specify a higher maximum frequency than can
be measured, the X scale will show the specified range but the spectrum
will not reach all the way to the maximum frequency.
The y scaling involves a number of approximations to speed up the display,
and should be used only for comparison rather than absolute
measurement. 0dB is approximately the signal level generated by a 1V
peak to peak sine wave.
If you press PgDn again, you can define the labels and scaling for the Y
axis. You can select Log or Volts scaling: If you change the label mode to
User-defined, you can calibrate the scale to match the parameters that
you are measuring.
Note that, as with other digital sampling systems, a frequency above half
the sampling rate will look like a lower frequency- this effect is called
aliasing. If PicoScope is not displaying the results that you would expect,
try increasing or decreasing the maximum frequency slightly. If the peak
appears to change frequency, it is probably caused by aliasing.
If the display is changing too rapidly to see clearly, you can freeze the
display using the Run/Stop button. Alternatively, you can turn Average on:
PicoScope will then display the average of 16 cycles. This will improve the
display for continuous signals, but will give a blurred result for rapidly
changing inputs.
If you wish to measure a frequency or amplitude exactly, you can move a
ruler to the required frequency: the computer will display the frequency and
amplitude at the current ruler position.
When you have a picture which you wish to record, you can add a title and
notes to the graph: you can also save it to a file or print it out. You can also
Version 2.0 rev 2
Page 9
Page 10
Version 2.0 rev 2
PicoScope
user manual
PicoScope
user manual
use the Save text file option to save data in a format suitable for entry into
a spreadsheet or database.
4.4 Using PicoScope as a digital meter
If you use the same settings every time, you can save them to a setup file
using the Save setup button on the Setup panel.
When the meter button is highlighted on the mode panel, PicoScope
operates as a digital meter.
Initially, the computer displays a single meter with the title "Meter 1"
("Meter" for single channel ADCs) and units "Volts". The digital display
shows the DC voltage for channel 1. The bar below the display shows the
minimum and maximum voltage measured during a period: There will be
thin line for a DC signal, and a wide bar representing the peak-to-peak
voltage for an AC signal.
Version 2.0 rev 2
Page 11
Page 12
Version 2.0 rev 2
PicoScope
user manual
PicoScope
user manual
use the Save text file option to save data in a format suitable for entry into
a spreadsheet or database.
4.4 Using PicoScope as a digital meter
If you use the same settings every time, you can save them to a setup file
using the Save setup button on the Setup panel.
When the meter button is highlighted on the mode panel, PicoScope
operates as a digital meter.
Initially, the computer displays a single meter with the title "Meter 1"
("Meter" for single channel ADCs) and units "Volts". The digital display
shows the DC voltage for channel 1. The bar below the display shows the
minimum and maximum voltage measured during a period: There will be
thin line for a DC signal, and a wide bar representing the peak-to-peak
voltage for an AC signal.
Version 2.0 rev 2
Page 11
Page 12
Version 2.0 rev 2
PicoScope
user manual
Press PgDn to move to the panel for Meter 1. The meter is currently set
to DC Volts: you can now change the measurement to AC volts or
Frequency.
Press PgDn again to move to the panel for Meter 2. This is initially off
(Channel is Off). If you press the Channel button, this changes to channel
1 for meter 2: the screen splits into two, each half showing a separate
meter. PgDn again goes to Meter 3: you can have up to 16 meters. You
can have more than one meter showing the same channel, for example to
display both the AC voltage and frequency of a channel.
PicoScope
user manual
5 Common Panels
This section describes the panels that are available in all modes of
operation.
5.1 Setup
The setup panel affects all modes of PicoScope.
You can select the printer port for the ADC,
specify whether help text is to be displayed at the
bottom of the screen and save the current setup
(ports, mode, timebase, scaling etc) so that it
can be reloaded later.
After all of the Meter panels are the Label panels: you can use these to add
a title or to define your own scaling for a meter, for example to show a
reading in degrees Celsius.
Run stops and restarts the current display. The
button changes to Stopped when you press it.
There are a up to 12 meter and 12 label panels: pressing PgDn to go
through these panels would take a long time. To go directly to the panel for
a particular meter, hold down the Alt key and press the number key for the
first digit of the meter you require.
Port specifies which printer port to use for the
ADC. The program will automatically detect
which ports are available: press the space bar till
the port that you wish to use is highlighted.
If you use the same settings every time, you can save them to a setup file
using the Save setup button on the Setup panel.
Help specifies whether help text is to be
displayed at the bottom of the screen. Once you
become more familiar with the program, you may
wish to turn it off in order to have a larger
display. The F1 key can also be used to turn help on or off in any panel.
Save Setup enables you to save most of the details about the way you are
using the program. To save the setup, type in a filename and press Enter.
If you use the filename SETUP, the program will automatically load the file
at start-up. If you use a different name (eg MYMETER) you can run
PicoScope using your setup by typing in PS -sMYMETER.
Version 2.0 rev 2
Page 13
Page 14
Version 2.0 rev 2
PicoScope
user manual
5.2 Printing
PicoScope
user manual
5.3 Files
The printing panel enables you to produce
printed copies of scope, XY and spectrum
analyser output. If you have the additional
graphics drivers, you can also generate graphics
files suitable for import into word processors.
The file PICO.DRV must be in the current
directory.
The files panel enables you to save a scope or
spectrum analyser trace and re-load it at a later
date.
The Drive button enables you to select which of
the drives on your system to use. press the
space bar to move between drives. Note that this
will not have any effect until you move to the
Directory button: this is in case you select a disk
drive that is not currently occupied.
For the standard printer drivers, the Printer can
be Epson FX, Epson LQ, HP Laserjet or HP
Deskjet. If your printer is not one of these, it is
probably compatible with one of them: consult
your printer manual. If in doubt, try Epson FX for
dot matrix printers and HP Laserjet for laser
printers.
The Directory button enables you to select a
directory. Pressing the space bar moves to the
next directory at the same level: cursor left goes
up a level and cursor right goes down a level.
Orientation can be Landscape or Portrait.
Load File selects a file in the current directory. If
you are in scope mode, pressing the space bar
loads and displays the next scope file in the
current directory.
Resolution can be Low, Medium or High. High
resolution gives the best quality output, but takes
longer to print.
Port specifies where to send the printed output.
It can be either LPT1, LPT2 or File. If you
specify File, you must enter a filename before
starting to print (see next button).
Save File is used to save the current trace. Type
in the filename, then press Enter. The file will be
saved in the current directory.
Save Text File is the same as Save File, but saves the data as a text file,
suitable for loading into spreadsheets and databases.
Filename is used when you select File output. Type in the filename and
press Enter.
Go starts printing the current graph, using the specified print options. The
computer will display a small window saying '0% complete - <Esc> to
cancel'. As the graph is generated and printed, the percent complete will
increase. Press Esc to cancel printing..
Version 2.0 rev 2
Page 15
Page 16
Version 2.0 rev 2
PicoScope
user manual
5.4 Mode
PicoScope
user manual
6 Oscilloscope panels
This panel enables you to specify which type of
instrument you require.
This section describes in detail the panels associated with the oscilloscope
function.
The meter provides voltage and frequency
measurement. The scope displays one or two
channels against time: the XY scope displays
one channel against another. The spectrum
analyser displays a graph of signal strength
against frequency.
6.1 Timebase
This panel enables you to specify the timebase
and related functions for the oscilloscope mode.
The Run/Stop option must be on RUN to collect
data. If you wish to freeze the display, press the
space bar to select STOP. Note that, for
timebases greater than 50ms/div, the computer
stops collecting immediately you press the
button, leaving the trace half-finished. If you want
to collect a whole trace, change the Trigger
mode to Single (see next panel).
Move the highlight to the operating mode that
you wish to use: the highlighted mode will
become active.
The Timebase enables you to specify the time
per division - from 100µs/div to 5s/div. Press the
space bar or +/- to select the timebase that you
require. Note that not all ADCs support
100µs/div. If you require a shorter time per
division than is available, you can use the
Multiplier to magnify a portion of the displayed
trace.
The Grid button is used to turn the grid ON or
OFF.
The Multiplier enables you to zoom in on a small part of the display. The
options are x1, x2, x5 and x10. If you select x2, the first half of the trace
is magnified to fill the whole width of the screen: you can then use the
offset to pan across the trace to look at the second half.
Version 2.0 rev 2
Page 17
Page 18
Version 2.0 rev 2
PicoScope
user manual
The Offset may be used only if the multiplier is greater than 1. It enables
you to select which part of the display is to be magnified.
The Sample rate button is for information only: it shows the sampling rate
currently being used.
6.2 Trigger
The trigger panel is used to specify when the
computer should start collecting the next trace.
You first specify a trigger event (threshold and
direction) then specify whether you wish to
collect data at, before or after the event.
Run/Stop must be set to RUN. If you set the
trigger mode to Single, this will be set to
Stopped after each cycle. Press Space to
restart.
PicoScope
user manual
The remaining buttons are only valid for Auto, Repeat or Single.
The Direction is either Rising, Falling, Above or Below. For Rising
trigger, the trigger occurs when the input signal passes from below the
threshold to above the threshold. For falling trigger, the trigger occurs
when the input signal passes from above the threshold to below it.
The Threshold is the ADC value at which the trigger will occur. A marker
appears on the screen to show the current level. Press +/- for large
increments or cursor left/right for small increments.
The Delay enables you to specify what part of the trace to display in
relation to the trigger. It can go from -100% to 1000%. If the delay is zero,
the trigger will appear at the left hand side of the screen. -50% puts the
trigger in the centre of the display: +200% enables you to see what
happened two display periods after the trigger. The timebase at the bottom
of the display shows the time with respect to the trigger.
The Trigger Mode can be None, Auto, Repeat
or Single. For None the computer starts
collecting the new cycle as soon as it has
finished displaying the previous cycle. For Auto,
the computer waits for up to 10 times the trace
period for a trigger. If no trigger has been found
within this time, a trace is displayed anyway. For
Repeat, the computer waits for a trigger,
displays the trace, then waits for the next trigger,
et cetera. For Single, the computer waits for a
trigger, displays the trace and stops: press
Run/Stop to restart.
The Channel specifies which channel to use to the trigger input. It can be
one of the channels you are displaying, or a different channel.
Version 2.0 rev 2
Page 19
Page 20
Version 2.0 rev 2
PicoScope
user manual
6.3 Trace / Trace A / Trace B
PicoScope
user manual
6.4 Left/Right Y axis
When using a single channel ADC, PicoScope
can display one trace. With multi-channel ADCs,
PicoScope can display two traces, called A and
B. These panels enable you to select the
channel, range, multiplier and offset for each of
the traces.
This panel contains buttons to customise the
scaling of the scope Y axes. There are axes at
the left and right of the display: normally, the Left
axis is used for trace A and the right axis for
trace B.
The Label Mode specifies the type of axis
scaling: the options are None, Volts or User
defined. Normally, the left axis is Volts and the
right axis is None.
The Run/Stop button enables you to stop and
restart the display update.
The Channel is used to specify which input
channel is to be used for this trace.
If you select None, the axis scale is omitted.
When the axis is omitted, the scope trace
expands to fill the space that was occupied by
the axis.
Range is used to set the input voltage range (not
available on ADCs which have a fixed input
voltage).
Y Multiplier can be x1, x2, x5 or x10: x20 and
x50 are also available for the higher resolution
ADCs. This can be used to magnify the y scale
for the trace. If x2 is selected, the middle of the
trace is expanded to fill the screen: the Y offset
can then be used to move upwards to display the upper part of the trace.
The Y Offset can be used only when the multiplier is greater than 1. It is
used to select which horizontal strip of the trace to magnify.
If you select Volts, the program automatically
adjusts the scale according to the settings of the
range, multiplier and offset for the corresponding
trace (Left is A, Right is B).
If you select User-defined, the program uses the
remaining buttons on this panel to set the
scaling: note that the scale will not change if you
alter the input voltage range.
The Label is intended to be the units (eg Celsius) of the scaled parameter
that you are measuring.
The Min Value and Max Value are the numbers at the bottom and top
respectively of the Y axis when the multiplier is x1 and the offset is 0.
Decimal Places specifies how many decimal places to use for the
numbers on the Y axis.
Version 2.0 rev 2
Page 21
Page 22
Version 2.0 rev 2
PicoScope
user manual
6.5 Notes
PicoScope
user manual
6.6 Ruler
This panel contains buttons which can be used
to annotate the current scope trace. The title and
footnote will appear both on the display and on
printed output.
There are two rulers, called 0 and X. They can
be used to mark events and to measure the time
between two events. If the rulers are at any
position other than 0 ms, they will appear on the
screen and on printed graphs as vertical lines.
The Title appears at the top of the display.
The O position is used to control the O ruler.
Move it using +/- for large increments or cursor
left/right for small increments. The number on
the button is the time from the O ruler to the
trigger event.
The Footnote appears at the bottom of the
trace, outside the grid.
Both title and footnote can be more than one
line: press Tab to start the next line.
The X position is used to control the X ruler.
Move it using +/- for large increments or cursor
left/right for small increments. The number on
the button is the time from the X ruler to the
trigger event.
The O-X button cannot be modified: it shows the
distance between the O and X rulers.
The Cancel button removes both rulers from the display.
Version 2.0 rev 2
Page 23
Page 24
Version 2.0 rev 2
PicoScope
user manual
7 XY scope panels
PicoScope
user manual
7.2 Trigger
This section describes in detail the panels associated with the XY
oscilloscope function. Note that the XY scope mode is available only for
multi-channel ADCs.
The trigger panel is used to specify when the
computer should start collecting the next trace.
First, specify a trigger event (threshold and
direction), then specify whether data is to be
collected starting at the trigger event, or before
or after the event.
7.1 Timebase
This panel enables you to specify the timebase
and related functions for the oscilloscope mode.
The Run/Stopped button must be set to Run. If
you set the trigger mode to Single, this will be
set to Stopped after each cycle. Press Space to
restart.
The Run/Stop option must be on RUN to collect
data. If you wish to freeze the display, press the
space bar to select STOP.
The Mode can be None, Auto, Repeat or
Single. For None the computer starts collecting
the new cycle as soon as it has finished
displaying the previous cycle. For Auto, the
computer waits for up to 10 times the trace
period for a trigger. If no trigger has been found
within this time, a trace is displayed anyway. For
Repeat, the computer waits for a trigger,
displays the trace, then waits for the next trigger,
et cetera. For Single, the computer waits for a
trigger, displays the trace and stops: press
Run/Stop to restart.
The Timebase enables you to specify the total
time for a scan of 1000 points. It can be from
1ms to 1s. Press the space bar or +/- to select
the timebase that you require. Note that not all
ADCs support the higher speeds: the program
will collect fewer points if the ADC cannot keep
up.
Join specifies whether successive points should
be joined. This is useful if the measured
parameters cycle only a few times during each
scan, but gives a 'spiders web' if the parameters
The Channel specifies which channel to use to the trigger input. It can be
one of the channels you are displaying, or a different channel.
do not change smoothly.
The Direction is either Rising, Falling, Above or Below. For Rising
trigger, the trigger occurs when the input signal passes from below the
threshold to above the threshold. For Falling trigger, the trigger occurs
when the input signal passes from above the threshold to below it.
The Threshold is the ADC value at which the trigger will occur. Press +/for large increments or cursor left/right for small increments.
Version 2.0 rev 2
Page 25
Page 26
Version 2.0 rev 2
PicoScope
user manual
The Delay enables you to specify what part of the trace to display in
relation to the trigger, as a percentage of the scan time. It can go from
-100% to 1000%.
PicoScope
7.4 X Label/Y Label
This panel contains buttons to customise the
scaling of the X and Y axes.
7.3 X Axis / Y Axis
The Label Mode specifies the type of axis
scaling: the options are None, Volts or User
defined. Normally, the left axis is Volts and the
right axis is None.
The X axis and Y axis panels enable you to
select the channel, range, multiplier and offset
for each of the axis. The channel and range take
effect only whilst the XY scope is running: the
multiplier and offset can be changed while the
scope is stopped, so that you can examine in
more detail the trace you have collected.
If you select None, the axis scale is omitted. The
space is used to draw the scope trace is wider.
If you select Volts, the program automatically
adjusts the scale according to the settings of the
range, multiplier and offset.
The Run/Stop button enables you to stop and
restart the display update.
The Channel is used to specify which input
channel is to be used for this axis.
If you select User-defined, the program uses the
remaining buttons on this panel to set the
scaling. Note that the scaling will not change if
you alter the input voltage range.
Range is used to set the input voltage range (not
available on ADCs which have a fixed input
voltage).
Multiplier can be x1, x2, x5, x10, x20 or x50:the
last two are available only on high-resolution
ADCs. This can be used to magnify the y scale
for the trace. If x2 is selected, the middle of the
axis is expanded to fill the screen: the Y offset can then be used to display
other parts of the axis.
user manual
The Label is intended to be the units (eg
Celsius) of the scaled parameter that you are
measuring.
The Min Value and Max Value are the numbers at the bottom and top
respectively of the axis when the multiplier is x1 and the offset is zero.
Decimal Places specifies how many decimal places to use for the
numbers on the Y axis.
The Y Offset can be used only when the multiplier is greater than 1. It is
used to select which horizontal or vertical strip of the axis to magnify.
Version 2.0 rev 2
Page 27
Page 28
Version 2.0 rev 2
PicoScope
user manual
7.5 Notes
PicoScope
user manual
8 Spectrum Analyser Panels
This panel contains buttons which can be used
to annotate the current XY scope trace. The title
and footnote will appear both on the display and
on printed output.
This section describes in detail the panels associated with the spectrum
analyser function.
8.1 Sampling
The Title appears at the top of the display.
The spectrum analyser sampling panel is used to
control the sampling parameters when running in
spectrum analyser mode.
The Footnote appears at the bottom of the
trace, outside the grid.
The Run/Stop button is used to freeze the
display temporarily and to restart it again.
Both title and footnote can be more than one
line: press Tab to start the next line.
The Channel button is present only for multichannel ADCs. It enables you to specify which
channel you wish to monitor.
The Range button enables you to select the
input voltage range (not available on fixed
voltage ADCs).
Min frequency and Max frequency are the
frequency values on the left and right sides of the
display respectively.
With Average OFF, the display is updated each
cycle. With it ON, the display is a moving
average of 16 cycles. This reduces the effect of
noise, but it means that the display responds
very slowly to changes in input signal.
Version 2.0 rev 2
Page 29
Page 30
Version 2.0 rev 2
PicoScope
user manual
8.2 Y axis
PicoScope
user manual
8.3 Notes
The Y axis panel enables you to select log or
linear scaling for the Y axis, and to replace the
Volts/dB calibrations with your own.
This panel enables you to control the grid and to
attach notes to the display. The title and footnote
will appear both on the display and on printed
output.
The Y scale can be Log (dB) or Volts. The log
display is useful when you require a large
dynamic range: the Volts option is useful if you
need to make linear comparisons between signal
strengths.
The Grid button enables you to turn the grid Off
or On.
The Title appears at the top of the display.
The Label Mode specifies the type of axis
scaling: the options are None, Volts/dB or User
defined.
The Footnote appears at the bottom of the trace,
outside the grid.
Both title and footnote can be more than one line:
press Tab to start the next line.
If you select None, the axis scale is omitted. The
space is used to draw the scope trace is wider.
If you select Volts/dB, the program automatically
adjusts the scale according to the settings of the
range on the sampling panel.
If you select User defined, the program uses the
remaining buttons on this panel to set the
scaling.
The Label is intended to be the units of the
scaled parameter that you are measuring.
The Min Value and Max Value are the numbers at the bottom and top
respectively of the Y axis. Decimal Places specifies how many decimal
places to use for the numbers on the Y axis.
Version 2.0 rev 2
Page 31
Page 32
Version 2.0 rev 2
PicoScope
user manual
8.4 Ruler
PicoScope
user manual
9 Meter panels
The spectrum analyser ruler can be used to
highlight points of interest on a spectrum and to
give a precise reading of frequency and
amplitude.
This section describes in detail the panels associated with the meter
function.
The Frequency button is used to control the
position of the ruler. Move it using +/- for large
increments or cursor left/right for small
increments. The number on the button is the
frequency at the current ruler position.
The meter panel is used to control the settings
for a meter display. You can display between one
and 12 meters: the more meters you turn on, the
smaller they get. To turn off a meter, set the
channel to Off.
The Amplitude button cannot be modified: it
shows the amplitude at the current ruler position.
The Run/Stop button enables you to pause or
restart the display. Press the space bar to stop or
restart.
9.1 Meter / Meter 1 / Meter 2...
The Cancel button removes the ruler from the
display.
The Channel button selects which channel is to
be used for this meter. Set the channel to Off if
you wish to turn the meter off.
The Measurement can be DC volts, AC Volts or
Frequency. If you select AC volts, the program
displays the RMS voltage, excluding any DC
component.
The Frequency Range can be either 1 to 200Hz
or 100 to max. If you select the wrong range, the
program may give misleading results.
The Range specifies the input voltage range (not
applicable for fixed input ADCs). You can select a particular range, eg 20V,
or Auto. If you select Auto, the computer automatically adjusts the input
voltage range for maximum resolution.
Version 2.0 rev 2
Page 33
Page 34
Version 2.0 rev 2
PicoScope
user manual
9.2 Label 1
This panel enables you to specify the title and
scaling for the meter.
The Scaling can be Volts/Hz or User Defined.
If you select Volts/Hz, the meter will display the
voltage or frequency as selected by the meter
panel. if you select User defined, it uses the
buttons on this panel to set the scaling.
Maximum Value specifies the value to appear
on the meter when the ADC value or frequency
is maximum.The maximum frequency is 200Hz
in low range and depends on the ADC in high
range- check the value that is displayed on the
meter bar when scaling is Hz.
Minimum Value specifies the value to appear on
the meter when the ADC value is minimum or the
frequency is zero.
If you are just displaying voltages, this will
normally be the maximum and minimum voltage
for the ADC. If you are measuring, say,
temperature using a device which outputs 10mV
per degree Celsius, you should enter the
temperature corresponding to maximum voltage.
Decimal Places enables you to select the number of decimal places
displayed.
Units can be used to specify the text displayed next to the meter value.
Normally, it will be V for Volts. Title specifies the title for this meter.
Version 2.0 rev 2
Page 35
PicoScope
user manual
Index
AC volts . . . . . . . . . . . . . . . . 13
Scaling
Amplitude
linear . . . . . . . . . . . . . 31
spectrum analyser . . . 33
log . . . . . . . . . . . . . . 31
buttons . . . . . . . . . . . . . . . . . . 4
User defined . . . 22, 28,
Channel
31, 35
Scope . . . . . . . . . . . . 21
setup . . . . . . . . . . . . . . . . . . 14
spectrum analyser . . . 30
load . . . . . . . . . . . . . . 14
trigger . . . . . . . . . 19, 26
save . . . . . . . . . . . . . . 7
files
spectrum analyser . . . . . . . 9-11
load . . . . . . . . . . . . . . 16
stop . . . . . . . . . . . . . . . . 18, 25
save . . . . . . . . . . . . . 16
time measurement . . . . . . . . 24
Save Text . . . . . . . . . 16
Timebase . . . . . . . . . . . . . . . . 5
Footnote
scope . . . . . . . . . . . . 18
scope . . . . . . . . . . . . 23
XY . . . . . . . . . . . . . . . . 8
spectrum analyser . . . 32
Title
XY scope . . . . . . . . . 29
Scope . . . . . . . . . . . . 23
frequency . . . . . . . 13, 30, 33, 34
spectrum analyser . . . 32
graphics drivers . . . . . . . . . . 15
XY scope . . . . . . . . . 29
help text . . . . . . . . . . . . . . . . 14
trace
install . . . . . . . . . . . . . . . . . . . 1
Load . . . . . . . . . . . . . . 7
meter . . . . . . . . . . . . . . . . . . 34
save . . . . . . . . . . . . . . 7
mode . . . . . . . . . . . . . . . . 2, 17
Save text . . . . . . . . . . . 7
monochrome displays . . . . . . . 1
trigger . . . . . . . . . . . . . . . . . . . 6
multiplier . . . . . . . . . . . 6, 18, 21
Auto . . . . . . . . . . 19, 26
PICO.DRV . . . . . . . . . . . . . . 15
scope . . . . . . . . . . . . 19
printer drivers . . . . . . . . . . . . 15
Single . . . . . . . . . 19, 26
printer port
XY . . . . . . . . . . . . . . . . 9
ADC . . . . . . . . . . . . . 14
trigger delay . . . . . . . . . . . . . . 6
graph printing . . . . . . 15
XY scope . . . . . . . . . . . . . . . . 8
printing . . . . . . . . . . . . . . . 7, 15
Channel . . . . . . . . . . 27
range
Join points . . . . . . . . 25
auto . . . . . . . . . . . . . 34
trigger . . . . . . . . . . . . 26
input voltage . . . . 21, 27
meter . . . . . . . . . . . . 34
ruler
scope . . . . . . . . . . . . 24
spectrum analyser . . . 33
sampling rate . . . . . . . . . . . . 19
Page 36
Version 2.0 rev 2
PicoScope
user manual
9.2 Label 1
This panel enables you to specify the title and
scaling for the meter.
The Scaling can be Volts/Hz or User Defined.
If you select Volts/Hz, the meter will display the
voltage or frequency as selected by the meter
panel. if you select User defined, it uses the
buttons on this panel to set the scaling.
Maximum Value specifies the value to appear
on the meter when the ADC value or frequency
is maximum.The maximum frequency is 200Hz
in low range and depends on the ADC in high
range- check the value that is displayed on the
meter bar when scaling is Hz.
Minimum Value specifies the value to appear on
the meter when the ADC value is minimum or the
frequency is zero.
If you are just displaying voltages, this will
normally be the maximum and minimum voltage
for the ADC. If you are measuring, say,
temperature using a device which outputs 10mV
per degree Celsius, you should enter the
temperature corresponding to maximum voltage.
Decimal Places enables you to select the number of decimal places
displayed.
Units can be used to specify the text displayed next to the meter value.
Normally, it will be V for Volts. Title specifies the title for this meter.
Version 2.0 rev 2
Page 35
PicoScope
user manual
Index
AC volts . . . . . . . . . . . . . . . . 13
Scaling
Amplitude
linear . . . . . . . . . . . . . 31
spectrum analyser . . . 33
log . . . . . . . . . . . . . . 31
buttons . . . . . . . . . . . . . . . . . . 4
User defined . . . 22, 28,
Channel
31, 35
Scope . . . . . . . . . . . . 21
setup . . . . . . . . . . . . . . . . . . 14
spectrum analyser . . . 30
load . . . . . . . . . . . . . . 14
trigger . . . . . . . . . 19, 26
save . . . . . . . . . . . . . . 7
files
spectrum analyser . . . . . . . 9-11
load . . . . . . . . . . . . . . 16
stop . . . . . . . . . . . . . . . . 18, 25
save . . . . . . . . . . . . . 16
time measurement . . . . . . . . 24
Save Text . . . . . . . . . 16
Timebase . . . . . . . . . . . . . . . . 5
Footnote
scope . . . . . . . . . . . . 18
scope . . . . . . . . . . . . 23
XY . . . . . . . . . . . . . . . . 8
spectrum analyser . . . 32
Title
XY scope . . . . . . . . . 29
Scope . . . . . . . . . . . . 23
frequency . . . . . . . 13, 30, 33, 34
spectrum analyser . . . 32
graphics drivers . . . . . . . . . . 15
XY scope . . . . . . . . . 29
help text . . . . . . . . . . . . . . . . 14
trace
install . . . . . . . . . . . . . . . . . . . 1
Load . . . . . . . . . . . . . . 7
meter . . . . . . . . . . . . . . . . . . 34
save . . . . . . . . . . . . . . 7
mode . . . . . . . . . . . . . . . . 2, 17
Save text . . . . . . . . . . . 7
monochrome displays . . . . . . . 1
trigger . . . . . . . . . . . . . . . . . . . 6
multiplier . . . . . . . . . . . 6, 18, 21
Auto . . . . . . . . . . 19, 26
PICO.DRV . . . . . . . . . . . . . . 15
scope . . . . . . . . . . . . 19
printer drivers . . . . . . . . . . . . 15
Single . . . . . . . . . 19, 26
printer port
XY . . . . . . . . . . . . . . . . 9
ADC . . . . . . . . . . . . . 14
trigger delay . . . . . . . . . . . . . . 6
graph printing . . . . . . 15
XY scope . . . . . . . . . . . . . . . . 8
printing . . . . . . . . . . . . . . . 7, 15
Channel . . . . . . . . . . 27
range
Join points . . . . . . . . 25
auto . . . . . . . . . . . . . 34
trigger . . . . . . . . . . . . 26
input voltage . . . . 21, 27
meter . . . . . . . . . . . . 34
ruler
scope . . . . . . . . . . . . 24
spectrum analyser . . . 33
sampling rate . . . . . . . . . . . . 19
Page 36
Version 2.0 rev 2
PicoScope
Version 2.0 rev 2
user manual
Page 37