1
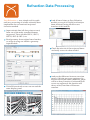
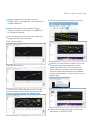
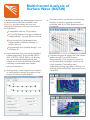
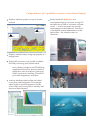
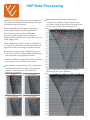
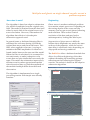
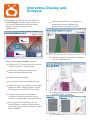
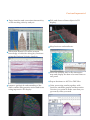
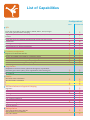
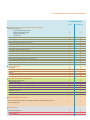
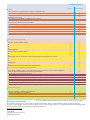
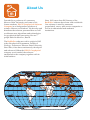
RadExPro
seismic software
QC
comprehensive processing of
near-surface seismic data
RadExPro
VSP data processing
seismic software
field processing and QC of 2D/3D
seismic data on Windows
The RadExPro is a friendly and easy-to-use
software on Windows for comprehensive and
efficient processing of seismic data. The
installation process is easy and straightforward.
The software does not have any specific
requirements to the hardware. It runs smoothly
on just ordinary laptop or desktop computers.
imaging ensure more reliable and accurate
result.
Algorithms of spectral whitening, F-X
deconvolution, frequency dependant noise
attenuation and others give you more
options for efficient reflection data
processing.
All standard algorithms of seismic processing
are included. Moreover, some innovative
highly efficient routines available in the
RadExPro are not always present even in
“big” processing systems.
The software is designed in a way that you
will readily understand the logic behind it.
In the year 2012 we have implemented a
number of updates and improvements aimed
to help you working more efficiently and
delivering faster.
Get aquatinted with the free trial version of
the software, read the detailed user manual
and study free tutorials downloadable from
our web-site: www.radexpro.com.
These include completely renewed Screen
Display module that is turned now into a
powerful interactive tool for fast data display
and analysis.
When you buy the software we will offer you
free training at our office in Moscow
(training at your location can also be
arranged). The training can be based on your
data.
New interactive modules for assigning
geometry to near-surface onshore and offshore
data make this process really fast and intuitive.
Joint inversion of the fundamental and higher
modes of Rayleigh wave in the MASW module
together with different methods of dispersion
You will learn RadExPro easily
Moreover, the price of the software license
includes one year of free maintenance. We
will be happy to answer your questions and
provide you with free updates as soon as we
release them.
Reflection Data Processing and Interpretation........................
Flexible and efficient for both impulsive and vibroseis data
Refraction Data Processing.................................................
Make it quick and easy
Multichannel Analysis of Surface Wave (MASW).........................
Competent reconstruction of S-wave velocities
QC and Field Processing of 2D/3D Seismic Data....................
Comprehensive QC capabilities on just a conventional laptop
VSP Data Processing.................................................................
High quality result — the easy way!
Demultiple and Deghosting of Hi-Res Offshore Data..............
Multiples and ghosts on single-channel records are not a problem anymore
Interactive Display and Analysis..............................................
Fast and impressive!
List of Capabilities...........................................................................
Everything you need and even more
About Us..........................................................................
DECO Geophysical Software Company — an independent vendor of seismic
software
QC
Reflection Data Processing
and Interpretation
The RadExPro provides effective tools for
processing of high-resolution reflection seismic
data, both off-shore and on-shore, with either
impulsive or swept (vibroseis) source.
Input data from one of the many standard
formats supported. Those inculde SEG-Y,
SEG-2, SEG-D, SEG-B, SEG-1, etc. Besides,
any non-standard demultiplexed data format
can be easily defined and handled, including
customizable trace header structure
definition.
Most of the standard number representations
with any byte order are supported. A
"nearly-SEG-Y-but..." file is not a problem
anymore.
Read geometry from original trace headers,
import it from ASCII or SPS files, or easily
define using one of the intuitive geometry
input modules provided for typical
acquisition scenarios:
In case of more sophisticated/experimental
acquisition schemes, you can always
precisely define data geometry using
mathematical formulas in the built-in
equation calculator. You can also edit and
manipulate with the values directly through
the built-in Geometry Spreadsheet editor. It is
handy and really flexible.
Flexible and efficient for both impulsive and vibroseis data
Sort your data right on the input to a
processing flow. There is no need to re-sort it
beforehand, you just get the data sorted
properly exactly when you need.
For deep seismic data, one can also
eliminate ground-roll using one of the
frequency dependant noise attenuations
algorithms available.
Exploit the power of more than 100 highperformance routines readily available for a
sophisticated processing expert, including
various filters, amplitude recovery
algorithms, static corrections,
deconvolutions of several types, spectral
transforms, migrations, etc.
Enjoy intuitive and convenient interactivity
of the stacking velocity analysis (both
conventional and horizon-based). Observe
how the hyperbolas are flattening by NMOcorrection in the real time while you are
picking a velocity function.
For really big data volumes there is a
dedicated quick resort utility that utilize all
RAM available in the most optimal way to
ensure the fastest possible resorting.
Efficiently suppress ground-roll with F-K
filtering. Once created interactively, the filter
polygon can then be applied to all of the data
in a processing flow. Additional options
include polygon mirroring and fan filtering
with optional wrapping.
The resulting stack can be further improved
with migrations, F-X predictive filtering and
spectral shaping routines.
Now you are ready for interpretation. Pick
horizons easily, smooth them and export to
ASCII and DXF files or make grids and plot
them on the map within the software.
Refraction Data Processing
Easy Refraction — new simple tool for quick
and easy processing of seismic refraction data
implements the conventional reciprocal
inversion method.
Load all travel times to Easy Refration
module as one pick. Display and analyze
them efficiently using intuitive user
interface of the module.
Input seismic data (all shot points at once)
from one of the many standard formats
supported. Those inculde SEG-Y, SEG-2,
SEG-D, SEG-B, SEG-1, etc.
Read geometry from original trace headers,
or assign it using our intuitive geometry
input module.
Check the miss-tie of the reciprocal times
and easily correct it when needed.
Pick all first arrivals at once on one and the
same display panel.
Analyze the difference between two time
curves: if diving waves are registered in
the first arrival, the entire difference graph
will be a decay function; if refracted head
waves are registered, the function will
decay at first, but then will become
constant.
Make it quick and easy
Assign segments of the time curves to
different layers using handy visual marker of
variable diameter.
Click just one button to run the inversion.
Adjust the marker size to make it bigger
when you need to work faster or smaller for
resolving fine details.
Preview apparent velocities at the segments
being selected at the real time.
Draw the first layer:
Then the second one:
Feel like you need more control? Carry out
all processing stages manually. Create
composite time-curves, level reciprocal
times, analyze velocities and time-depth
functions and build refraction boundaries,
enjoying full control over the result at every
single stage.
You can work with individual curves for the
most accurate result or draw the layers at all
of them together to make the things faster:
Export the resulting layered model of the
subsurface to ASCII or DXF.
Multichannel Analysis of
Surface Wave (MASW)
A dedicated module for Multichannel Analysis
of Surface Wave (MASW) available in the
RadExPro provides means for easy and
competent evaluation of S-wave velocities of
the subsurface.
You may want to see the data in the Screen
Display, to analyze apparent velocities,
spectrum, and, if you like, define horizons
for muting.
Compatible with any 2D geometry.
FV and FK dispersion images calculated
independently – you get the best of both.
Joint inversion of fundamental and
higher modes, unlimited number of
modes allowed.
Exceptionally user-friendly design – you
will enjoy it!
Input data from one of the many standard
formats supported. Those inculde SEG-Y,
SEG-2, SEG-D, SEG-B, SEG-1, etc. Besides,
any non-standard demultiplexed data
format can be easily defined and handled,
including customizable trace header
structure definition.
Read geometry from original trace headers,
or easily define it using our intuitive NearSurface Geometry Input module:
Calculate dispersion images for each seismic
gather in both FV and FK domains
independently. Pick dispersion curves of
the fundamental and higher modes in any
of the domains. Convenient semiauthomatic picking algorithm will help you
making quick and accurate dispersion curve
extraction:
Competent reconstruction of S-wave velocities
You don’t need to save each curve
individually – when you are ready with all
picks just click Add all curves button to send
all of them to the inversion. Then you can
always switch any of them off through the
MASW Manager dialog:
You have been playing with model
parameters for one seismic gather for quite a
while trying all combinations and finally
secured a result you are happy with... but
for this single gather only. Why not to use
this result now as the initial model for all
other gathers, and then invert all of them at
once automatically?
Yes, you can do this with the RadExPro!
Next stage is inversion: you need to find a
model of S-wave velocity distribution with the
depth that gives you dispersion curves most
similar to those you have extracted.
With the RadExPro you can jointly invert
dispersion curves extracted for all modes, or
specify any combination of the modes for the
inversion. You may wish to invert, first, the
fundamental mode only, and then use the
result as the initial model for joint inversion.
Feel free to experiment and see what works
better in your case.
Just one click to run the inversions of all
dispersion curves extracted from different
gathers. A 2D profile of share-wave
velocities is a result of interpolation between
the individual vertical velocity profiles.
Now the resulting Vs profile can be
corrected for the topography and printed or
exported to ASCII or GRD files.
QC
QC and Field Processing
of 2D/3D Seismic Data
The RadExPro software provides everything
needed for efficient seismic QC and field
processing on Windows:
Rapidly input the data of any size.
Assign geometry using the handy and flexible
tools provided, including import from SPS
and UKOOA p1-90 files.
Interactively define different QC polygons of
arbitrary shapes for different parts of seismic
record. Evaluate all important QC attributes
within the polygons: signal to noise ratio,
amplitude and frequency content, and more.
Easily calculate combined attributes, attribute
ratios etc.
Plot geometry on cross-plots and coverage
maps. Make geometry QC based on analysis
of first arrivals.
Rapidly resort huge data volumes using a
dedicated module with optimized random
access operations.
Inspect the data using our really fast display
tool, analyze spectrums and check trace
header fields of any trace when needed.
Interactively estimate velocities for all types
of waves.
t0 = 2504.0 ms v = 2.580 m/ms fi = 0.0
Additionally, you can calculate a number of
attributes poststack – in time-windows along
arbitrary horizons.
Comprehensive QC capabilities on just a conventional laptop
Display attribute graphs on top of seismic
sections.
Display attribute maps using topography as a
background.
Exploit all necessary tools readily available
for field processing until a brute stack:
trace editing, bandpass and 2D filtering,
amplitude corrections, deconvolutions,
interactive velocity analysis, static and
NMO-corrections, stacking, 2D and 3D
post-stack migrations, and more.
Analyze attribute relationships on linked
cross-plots and histograms. For example,
make signal to noise histogram to be the
color-code for all cross-plots to identify bad
shots and bad channels.
Easily install the RadExPro on a
conventional laptop or just an average PC
and take into a field or on board a seismic
vessel — it does not make any specific
requirements to the hardware. And leave
your skillful system administrator at the
main office – the software runs on
Windows.
VSP Data Processing
With the RadExPro software, you can process
zero-offset, far-offset and walk-away VSP data
of different types of sources.
Make individual bandpass filtering in
windows of arbitrary shape. Below is the
raw data with strong noise in the upper part
of the section that is to be filtered out:
Be experimenting all the time! Change the
order of procedures and their parameters,
switch between the results of different
processing and compare them, until you
finally end up with the processing flow you are
really happy with.
Then simply drag-and-drop the resulting flow
to copy all its procedures and parameters and
apply the same processing to another dataset.
Assign geometry using a dedicated easy-touse tool, properly incorporating inclinometry
data and removing duplicated traces.
Separate different components. Select the one
you want to use now just in few clicks.
Use all three components for 3C polarization
analysis and rotation to make sure that full
seismic vector response is available for
efficient processing.
Here is the result of high-pass frequency
filtering in the upper window:
High quality result — the easy way!
Separate the upgoing and downgoing P- and
S-wavefields using the exhaustive set of
processing algorithms available.
Tie VSP and seismic data and interactively
determine static shifts required.
Interpret the data interactively to produce
reliable velocity model and immediately
compare it with the logging data.
Calculate migrated VSP-CMP sections and
compare them in 2D or in 3D.
Save your model and easily re-open it for
interactive edit.
Never get lost in your old projects. Any
dataset is stored together with its history,
readily showing you all processing
procedures applied and all their parameters.
Export velocities and travel times to an
ASCII file.
Demultiple and Deghosting
of Hi-Res Offshore Data
Challenge — demultiple of single channel
marine data
Several techniques of multiple suppression are
well known to work with 'big' full-offset
marine seismic data, including Radon
demultiple, SRME, Tau-P deconvolution, etc.
However, efficient suppression of multiple
reflections on high-resolution offshore seismic
data acquired with one or just a few channels
at zero or small offsets have been a deep
problem until now.
Predictive deconvolution, the mainstay of
single-channel marine demultiple processing,
in most cases is nearly useless. It either does
not affect the strongest multiples or erases a
blank gap around the unwanted event killing
all adjacent reflections.
Solution — new efficient algorithm
The RadExPro software now provides a new
efficient demultiple algorithm for near-offset
single-channel or stacked offshore seismic data.
The algorithm is implemented in a brand-new
processing module called Zero-Offset
DeMultiple. It brings really amazing results
being capable in many cases to significantly
suppress multiples without disturbing crisscrossing useful reflections.
Examples are shown on the right. Principal
multiple reflections are indicated with arrows.
Note the primary reflections interfering with
the multiples. When the multiples are
significantly suppressed, the interfering
primaries are still there and not disturbed.
Multiples and ghosts on single-channel records are not a
problem any more
How does it work?
Deghosting
The algorithm is based on adaptive subtraction
of a model of multiples from the original wave
field. The model is obtained from the data itself
either by static shift of the original traces or by
auto-convolution. However, what makes the
algorithm that effective is the adaptive
subtraction approach used.
Ghost waves is another traditional problem
for a marine seismic processor. Depending on
the towing depths of the source and the
streamer you can get several ghosts following
each reflection. These reduce vertical
resolution of the data and may lead to
misinterpretaion, looking like fake layers.
In general terms, a dedicated shaping filter is
calculated for each trace basing on both the
original data traces and the model traces. This
filter, when applied to the trace, is trying to
minimize the RMS amplitudes of whatever is
found similar between the trace and the model.
When the filter is calculated it is accounted for
non-stationarity to make it adaptive to the
events that are quite similar but not exactly the
same. This makes the subtraction impressively
efficient even for rather approximate models
when the arrival time or/and the amplitude of
the modeled multiple differ from the actual
observation.
Suppression of ghost waves is difficult
because their amplitudes are nearly the same
as those of the primaries, while the arrival
time delay is small and varies depending on
ship speed and towing conditions.
The RadExPro offers a dedicated module that
allows for efficient deghosting of the data
without disturbing the interfering primary
reflections and not affecting the original
wavelet. The technic is based on the adaptive
subtraction algorithm.
BEFORE
The algorithm is implemented as a single
processing routine with simple user-friendly
interface:
AFTER
Interactive Display and
Analysis
Completely renewed in the year 2012, the
Screen Display module is a powerful tool
a powerful interactive tool for fast data
display, interactive analysis and
interpretation.
Interactively define QC polygons for
calculating various attributes for
different parts of seismic records.
spectrum of signal
Estimate apparent velocities of all types
of waves interactively.
With the new Screen Display you can:
Display WT/VA data on top of the colorcoded velocities or seismic traces.
Pick faster and more accurate with
improved autopicking facility.
Undo/redo pick editing.
Smooth picks with smoothing average.
Pick horizon for top muting on one single
gather and then simply project it to all
other gathers with only 2 mouse clicks.
Analyze spectrums from arbitrary
windows and always observe where
exactly your spectrums were taken from.
Analyze FK spectrums and interactively
define FK filter polygons.
Never get lost in between of several
Screen Display windows while testing
processing parameters with the new Flow
History facility.
...and much much more.
Fast and impressive!
Enjoy intuitive and convenient interactivity
of the stacking velocity analysis.
Pick and observe linear objects in 3D
display.
Map horizons and attributes.
Need more details? Get more accurate
knowledge of velocities along key horizons
using the Horizon Velocity Analysis.
Select an arbitrary line on the interactive
map and display the data of several lines on
one panel.
Export horizons to ASCII or DXF-files.
Improve geological understanding of the
data to make interpretation easier and faster
using impressive 3D display.
Print processing results together with
horizons, attribute graphs and decoration.
Preview you prints to make sure that you
get exactly what you need.
List of Capabilities
Configurations
Start
Professional
I/O
Input data from SEG-Y, SEG-D, SEG-2, SEG-B, SEG-1, SCS-3, Diogen
files, with optional header remaping
Input GPR data from LOGIS, Zond, RAMAC/GPR, GSSI, Pulse EKKO
formats
Input trace from ASCII file
Input data from user-defined demultiplexed format with trace header
information
Reading data from tapes
Data output to SEG-Y files
Export horizons to ASCII and DXF files
Output data to ASCII file
Geometry assignment
Import from ASCII and SPS files
Calculation using built-in equation calculator
Display and editing using built-in spreadsheet editor
Dedicated module for near-surface geometry assignement
Dedicated module for marine geometry assignement
Dedicated module for VSP geometry assignment
3D binning
+
+
+
+
+
+
+
+
+
+
+
+
+
+
+
+
+
+
+
+
+
+
+
+
+
+
+
+
+
+
+
+
+
+
+
+
+
+
+
+
+
+
+
+
+
+
+
+
+
+
Amplitudes
Amplitude corrections: linear (spherical divergence), exponential,
automatic gain control (AGC), trace equalization, time-variant gain
Ensemble equalization
DC removal
Statics
Elevation statics calculation
Residual statics calculation
Correlation statics calculation
Apply statics
Deconvolutions and spectral shaping
Signature
Zero-phase
Predictive
Spiking
Surface-consistent
Nonstationary predictive
F-X (predictive filtering)
Phase
Optimal filtering
Spectral whitening
Spectral shaping
+
+
+
+
+
+
+
+
Interpolation
Trace interpolation along the line
Interpolation of set of 2D lines
into a 3D volume
+
+
+
Everything you need and even more
Configurations
Start
Professional
Filtering, trace transforms and trace math
Frequency filtering:
trapezium bandpass filter
Ormsby bandpass filter
Butterworth filter
notch filter
2D filtering
F-K filtering
F-X predictive filtering (F-X deconvolution)
Radon transform (direct and inverse)
Amplitude spectrum calculation
Phase spectrum calculation
Autocorrelation and crosscorrelation functions
Logarithm and exponent of trace
Adaptive wavefield subtraction
Convolution
Trace/trace and trace/scalar arithmetic
Power of trace
Radial trace transform (direct and inverse)
Burst noise removal
Frequency dependant noise attenuation
Time frequency domain noise rejection
Trace editing
Resample
Kill trace
Zero-padding
Inverse
Muting
Trace length change
Header fields manipulations
Mathematical operations
Spreadsheet editor
Import from ASCII and SPS files, export to ASCII
Smoothing average
Shift of header values to specified number of traces
Surface-consistent calibration (e.g. for static shifts or
amplitude values)
Graphs
Cross-plots and histograms
+
+
+
+
+
+
+
+
+
+
+
+
+
+
+
+
+
+
+
+
+
+
+
+
+
+
+
+
+
+
+
+
+
+
+
+
+
+
+
+
+
+
+
+
+
+
+
+
+
+
+
+
+
+
Time-depth conversion
Conversion between time and depth domain using different types of
velocity functions
+
+
+
+
+
+
+
+
Migrations
F-K Stolt migration
3D F-K Stolt migration
T-K migration
Configurations
Velocities and CDP stacking
3D CDP binning
CDP gathers
Super gathers
Interactive analysis of stacking velocities
Horizon-based velocity analysis
NMO-correction
Stacking
Start
Professional
+
+
+
+
+
+
+
+
+
+
+
+
Offshore data processing
Marine geometry assignment
Dropped/missed shots correction
Import tide statics
Suppression of multiples on high-resolution near-offset marine data
Deghosting
+
+
+
+
+
+
+
+
QC and attribute analysis
Analysis of attribute dependancy on linked cross-plots and
histograms
Mapping attributes on top of topography background
Estimate of average, RMS, minimum, maximum, absolute maximum amplitude
post-stack within a window along a horizon
Determination of time of maximum, minimum, and absolute maximum amplitude
post-stack within a window along a horizon
Estimate of peak frequency, apparent frequency,
visible frequency, centroid frequency, and frequency
bandwidth post-stack within a window along a horizon
Estimation of signal-to-noise ratio post-stack within a window along a horizon
Ensemble QC: estimation of mean, 2D RMS and mean 1D RMS amplitude, signal-tonoise ratio, resolution and apparent frequency pre-stack within an arbitrary polygon
Computation of auto-correlation and
cross-corelation functions
Interactive estimate of velocities of all types of waves
Calculation of effective fold
Reflection strength, instantaneous frequency,
instantaneous phase
+
+
+
+
+
+
+
+
+
+
+
+
+
Refraction
Processing time-curves of refracted waves (CRM)
Processing time-curves of diving waves
+
+
+
+
+
+
+
+
Vibroseis
Correlation
Surface Wave Analysis
Multichannel Analysis of Surface Wave (MASW)
Standard configurations:
—Start - basic processing of 2D near-surface seismic reflection data, refraction seismic data processing, analysis
of surface wave (MASW) ;
—Professional - advanced processing of 2D/3D near-surface reflection data, field processing and QC of deep
2D/3D seismic data, processing of refraction seismic data, analysis of surface waves (MASW), processing of
VSP data.
Configurations
Start
VSP
Professional
+
+
+
+
+
+
+
+
+
+
+
+
VSP geometry assignment for vertical or inclined wells
Polarization analysis, 2C and 3C rotation
Generation of synthetic seismograms for
different wave types
Separation of wavefields of different wave types
Calculation of arrival time of direct wave or reflected wave from a specified
reflector for horizontal layered model
Layer velocity modeling
Estimation of Q
Far-offset VSP NMO-correction
Import of well-log data, import and export of velocity models
Joint interpretation of VSP, logging, and seismic data
VSP Kirchhoff migration
VSP-CDP transformation
Display and printing
Various modes of data display
Display of WT/VA traces on top of color-coded velocity or seismic data
Support of several data displays at a time, several datasets in one display
Interactive calculation of frequency spectrum and F-K spectrum of arbitrary
data fragment
Display of trace header fields
Display of lines, attributes, horizons, on the interactive map
Interactive display of data along an arbitrary line selected on the Map
3D display of a set of 2D lines, with optional semi-transparent map on top
Picking linear objects in 3D
Display of attributes on linked cross-plots and
histograms
Printing and export of cross-plots and hystorgams to a bitmap
Printing of processing results with print preview
Data and processing management
Processing within projects. A project can be easily moved to a new location together
with all associated data and processing parameters
Work with several projects at a time
Processing flows can be combined into several queues and run in parallel
Processing flows can be copied with all procedures and parameters
Processing history
Data run-time resorting on input into the flow
Fast resorting of big data volumes
Combining several flows into processing queue, parallel execution of several queues
+
+
+
+
+
+
+
+
+
+
+
+
+
+
+
+
+
+
+
+
+
+
+
+
+
+
+
+
+
+
+
+
+
+
+
+
+
+
+
+
Interpretation
Horizon picking, manual and automatic
Griding of horizons and attributes
Attribute calculation along horizons
Simultaneous display of different types of data on the map and in 3D display
System requirenments
*The list of capabilities is for information only and is subject to change without prior notice.
The software works at any CPU of x86 or x86-64 architecture, however the software code is optimized for Intel
Pentium™ 4 and higher set of commands. Most resource-consuming routines are parallelized to take advantage of the
modern multi-processor workstations under MS WindowsTM
Recommended minimum:
Intel Core 2 Duo CPU
2 GB RAM
MS Windows XP/Vista/7
1280x1024 monitor
About Us
Founded by a professor of Lomonosov
Moscow State University and some of his
former students, DECO Geophysical Software
Company in an independent producer of
seismic software on Windows. We develop and
distribute the software presented here as well
as elaborate new algorithms and technologies
for geophysical data processing. We are 7
people based in Moscow, Russia.
The RadExPro software took its origin in 1992
at the Geophysical Department, Faculty of
Geology, Lomonosov Moscow State University.
Since then, it has been continuously developed
and advanced. When the DECO Geophysical
company was founded, the software
transferred to the company together with its
initial authors.
Since 1992, more than 500 licenses of the
RadExPro software have been sold worldwide.
Our software is used by numerous
geotechnical, survey and service companies as
well as in educational and academic
institutions.
Our partners
You can buy the RadExPro software from
our representatives world-wide:
Contacts
In case of any questions, please contact us:
DECO Geophysical SC
Postal address:
Moscow State University Science Park,
Leninskie Gory, 1-77,
119992 Moscow, Russia
In Americas
Paulsson, Inc. (PI)
www.paulsson.com
In Asia
China
Beijing Orangelamp Navigation Technology
Development Co., Ltd
www.orangelamp.com.cn
Visiting address:
57A, Vavilova st.
Moscow, Russia
India
Essem High Tech Pvt.Ltd
www.essemhightech.com
Tel. (+7 495) 987 22 47 / (+7 495) 930 83 59
Fax (+7 495) 930 80 58
Japan
Terra corporation
www.terrajp.co.jp
Sales: [email protected]
Support: [email protected]
Korea
C & H, Inc.
www.candh.co.kr
Middle East
Geomorph Instruments
www.geomorph.gr
Singapore and ASEAN countries
Sea and Land Technologies Pte. Ltd. (SALT)
www.sea-landtech.com.sg
In Europe
Germany
DMT GmbH & Co. KG
www.summit-system.de
(dedicated customized configuration only)
GeoHiRes International Ltd.
www.geohires.com
Greece and Southern Europe
Geomorph Instruments
www.geomorph.gr
Italy
Codevintec
www.codevintec.it
Norway
P-Cable 3D Seismic AS
www.pcable.com
(dedicated customized configuration only)
Russia
Geotech
www.geotech.ru
LogSys
www.logsys.ru
Geosignal
www.geosignal.ru
Softline
www.softline.ru
Get Free Trial Here:
www.radexpro.com