1
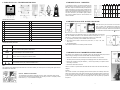
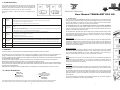
4. DISPLAY SCREENS There are two types of information displayed on the Tankalert Eco Oil Monitor: CURRENT information screens - used in normal mode to show the current status of the oil level in your tank. Change between the ‘Ltr.’, ‘%’, ‘Days to empty’, and Clock screens using the and keys. 1.Used for SETUP and displays SETUP number, and in normal use displays room temperature. 2.Tank information including a visual bar-graph of the oil level in the tank. 3.Information about the remaining usable oil in litres or as a %, the ‘Days to Empty’, and the average and cumulative use of oil in litres, cost and KgCO2. Time is also displayed here. Tankalert Eco Oil Monitor and Transmitter Display Symbol reference 1 For approximately 1 week after the Tankalert Eco Oil is installed, it collects data so that the ‘Average per day’ value may be calculated. During this period the screen will flash ‘—-’ when showing ‘Days to empty’. (In the picture ‘flashing’ is indicated by the red circle). After the 1 weel period has passed, the display may continue to show ‘—-’ (but not flashing). This indicates that a meaningful value could not be calculated. This may occur in periods when there is no (or extremely low) usage. The ‘—-’ may be displayed in any of the HISTORICAL information screens under these conditions. 2 The screen may also show ‘—-’ if the Tankalert Eco Oil Monitor had been unplugged for some time. In this case ‘—-’ means that it has no recent reading from the transmitter with which to display a value on the screen. Depending on how long it has been unplugged the screen will revert to normal after a period from a few hours up to a maximum of 1 week. Tank Type Indicates the Tank Type being selected A, B, C A, B, C are types of tank shapes (see diagrams in section 5) Room Temperature The value displayed is the Room Temperature Numeric display—Shows the Room Temperature in normal mode e.g 20. Shows the Setup mode number when in setup mode, e.g. SETUP mode 3 ºC The value displayed is temperature in negrees Celcius cm The value displayed is in centimetres Setup Setup mode is active H The value displayed is the tank height W The value displayed is the tank width Tankalert Eco Oil Monitor Display: Bargraph indicador of liquid level—each bar represents 10% of tank height Tankalert Eco Oil Transmitter Display: Tanks 1 m in height or greater—each bar represents 1/10th of the top meter of the tank. Full Liquid Level Empty Bund Alarm Tank Low Battery HISTORICAL information screens showing ‘Fuel usage - Litres’, ‘Fuel usage - Cost’ and ‘Fuel Usage - Carbon’. Pressing MODE and / accesses these screens. £ The value displayed is in Sterling pounds € The value displayed is in Euro % The value displayed is the % of usable oil remaining in the tank Numeric display—used to show numeric values and the time CURRENT—fuel remaining HISTORICAL—Fuel: Avg./day HISTORICAL—Cost: Avg./day HISTORICAL—Carbon: Avg./day KgCO2 CURRENT—fuel remaining 3 Tanks less than 1 m in height—each bar represents 1/10th of a metre Indicates the “Full” level of the bargraph indicator Indicates the bargraph is showing the liquid level Indicates the “Empty” level of the bargraph indicator When flashing there has been a leak into the “Bund” (double skinned tanks). The 10 bars and the RED LED will also be flashing at the same time. The Tankalert Eco Oil Transmitter battery needs to be changad. Flashing—The remaining liquid level in the tank is at 10% or below of tank height. (Appears on both the Tankalert Eco Oil Monitor and Transmitter) Flashing—There is a problem with the RF signal from the Tankalert Eco Oil Transmitter. (Appears on both the Tankalert Eco Oil Monitor and Transmitter) The temperature is close to or below the limit of operation of the Tankalert Eco Oil Transmitter—the information accuracy may be affected. A numeric value is not available to be displayed when ‘—-’ is shown. The value displayed is of Kg of CO2 (carbon emissions) cm The value displayed is in centimetres Ltr. The value displayed is in Litres / (Ltr.) The value displayed is per (litres) USB data activity Average per Day Average per Week Last 30 Days The value displayed is the average per week based on the last 14 days usage The value displayed is the estimated number of days of oil remaining in the tank. It is computed by dividing the volume of usable oil left in the tank by the current daily average use. The value displayed is the estimated usage over the last 30 days Last 365 Days The value displayed is the estimated usage over the last 365 days Days to Empty Fuel cost: Avg./day Fuel cost: Avg./week Fuel cost: Last 30 days Fuel cost: Last 365 days The Tankalert Eco Oil Monitor will automatically return to the CURRENT information screen after 30s with no key presses within the HISTORICAL information screens. 6 The value displayed is the average per day based on the last 7 days usage 3