1
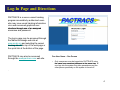
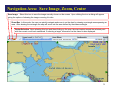
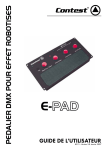
Marine Exchange of Alaska
PACTRACS
Vessel Tracking System
User’ss Manual
User
Vessel Tracking System that employs AIS
(Automatic Identification System) and Satellite communications
to aid safe, secure, efficient and environmentally
sound maritime operations.
www.mxak.org
Table of Contents
1.
2.
3.
4
4.
5.
5
6.
Introduction……………………………… page 3
Log-In Page and Directions……………. page 4
Navigation Area
a. Save Image………………………. page 5
b. Zoom mode………………………. page 5
c. Change
g Center…………………... p
page
g 5
d. Information Mode………………... page 6
e. Information Window……………... page 7
f. Measure Distance……………….. page 8
g. Zoom Levels………………...…… page 9
h. Filters…………………………...… page 10,11
i. Bookmarks……………………….. page 12
j. Position………………………………page 13
k. Vessels’ Names – Display of………..
page 14
l. Data Replay……..……………...... page 15
Options
a. Options Window………………….. page 17
b. Searching by Vessel Name……... page 18
c. Chart Overview…………………... page 19
d. Preferences & Vessel Legend…... page 20
e Full Screen Display……………….
e.
Display
page 21
f. Ship List…………………………… page 22
g. Chart / Map Displays …………. page 23
h. Vessel Tracks and Properties..….. page 24
i. Automated Watchdog Alerts......… page 25,26,27
O Line
On
Li H
Help………………………..……
l
page 28
Logout…………………………………..... page 28
2
Introduction
PACTRACS
Welcome to the Marine Exchange of Alaska’s Vessel Tracking System - PACTRACS. This system is
designed to track vessels in the Pacific to aid safe, secure, efficient and environmentally responsible
maritime operations.
operations Using PacTracs,
PacTracs you can find information on a vessel’s
vessel s present and past
locations, speed, route, destination and more.
PACTRACS is capable of receiving, processing and displaying the positions of vessels received by
both AIS ((Automated Identification System)
y
) and satellite tracking
g systems.
y
The Marine Exchange
g
established and operates over 60 AIS receiving stations in Alaska from Prudhoe Bay west to Adak and
south to Ketchikan that provide the positions of AIS equipped vessels operating near these sites. The
Marine Exchange also has access to AIS information from an additional 100+ AIS sites in the lower 48
operated by affiliated Marine Exchanges.
The reach of AIS coverage, depending on location, elevation, terrain masking, ranges from 20-150
miles from AIS sites. Vessel position reports are received several times a minute, Near worldwide
tracking coverage is provided by satellites tracking systems which transmit positions at less frequent
intervals normally every 1-4 hours
intervals,
hours.
3
Log-In Page and Directions
PACTRACS is a secure vessel tracking
program accessible by authorized users
who may view vessel tracking information
via a web accessed graphical user
interface through use of an assigned
username and password.
The log in page may be accessed through
th M
the
Marine
i E
Exchange
h
web
b site
it att
www.mxak.org and selecting the vessel
tracking tab at the top of the web page or
the quick link at the bottom of the page.
PACTRACS may also be accessed
through the www.pactracs.com web site.
One User Name – One Person
•
Only one person may be logged into PACTRACS using
the same user name and password at the same time.
time If
one logs into the system they take precedence and the
other person previously on the system is forced off.
.
4
Navigation Area: Save Image, Zoom, Center
Save Image Select this icon to save the image currently shown on the screen. Upon clicking the icon a dialog will appear
giving the options of showing the image or saving it to disc
disc.
Zoom Box In this mode, the user can quickly navigate and zoom in on the chart by drawing a rectangle encompassing an
area. After drawing the rectangle the map will zoom into the area defined by the drawn rectangle.
Center Selection Upon selecting this icon and then clicking on the map, the map centers around the selected point
with the current zoom level maintained. If selecting a target, information on the vessel is also displayed.
5
Navigation Area: Target Information Tool
Target Information: Clicking the info symbol highlights the i
In this mode the user obtains additional information on the selected vesssel.
Information on the selected vessel is displayed in the Window at right.
6
Navigation Area: Target Information Window
Information Window When the user clicks a target (e
(e.g.
g an AIS equipped
vessel, an AIS base station, virtual area, etc.) on the chart, information about
the selected target is displayed in the information window. As illustrated below,
this window will display the available AIS properties for the selected target.
This is the information reported
by the vessel. AIS will report
Speed over ground (SOG) and
Course over Ground (COG) but
Long range (satellite) tracking only
di l
displays
location.
l
ti
7
Navigation Area: Measure Distances
Measuring Distances
the starting point of the measurement is set upon clicking on the chart
• Upon selecting the measurement (dividers) icon,
at the desired starting point. While moving the cursor a measurement tool appears.
• When left clicking a new point is set, and the fixed line will be updated with distance and bearing between the two points
displayed.
• Upon double clicking the tool is fixed as is the text box. Double clicking once more on the map will make the measure tool
and text box disappear.
• A measurement can be cancelled by pressing the Escape key.
8
Navigation Area: Zoom Bar
Zoom bar. The zoom bar shows the detail level the chart is currently displaying. When the bar is placed to the left most
extreme, the chart is zoomed in to show maximum detail levels where the physical size of the AIS tracked vessels is displayed.
At the right most extreme, the least details are shown (at this zoom level countries can be seen). The current scale is displayed
above the zoom bar.
Zoom in. When the user clicks this button, the map zooms in one detail level (more detail can be seen).
Zoom out. When the user clicks this button, the map zooms out one detail level (less detail can be seen).
9
Navigation Area: Filters
1. The filter drop down menu allows the user to apply existing user defined filters:
A filter modifies the vessels displayed, i.e. in the example below only Ferries and Passenger vessels are displayed.
To disable the filter, the option "no filter" should be selected from the drop down menu and all vessels will be shown.
2. To define/edit filters, select the filter administration button. This will open the Filter Administration window. (See next
page for more info on this feature)
1
2
Add
Filter
10
Navigation Area: Vessel Filters (cont’d)
The filter administration tool allows the user to create filters that can be applied
pp
on the AIS data.
The user can set the entity that is filtered (e.g. name, ship type, cargo, etc) by clicking the dropdown menu.
The user can further define the filter by length, destination, and other data captured by AIS.
The user activates the filter by clicking the filter dropdown in the main window and
selecting
l ti th
the d
desired
i d filt
filter.
Click icon to
the left and
window to the
right appears
Enter the
name for the
filter then click
“Add Filter”
the screen to the
right
g appears.
pp
Select desired
filters and/or filter
combinations.
Then select “Save
Filter”
11
Navigation Area: Bookmarks
Bookmarks allows the user to save and readily return to designated areas:
Th user can create
The
t a bookmark
b k
k by
b navigating
i ti tto a chart
h t di
display
l area using
i th
the various
i
navigational
i ti
l ffunctions.
ti
N
Nextt th
the user
clicks the “add” bookmark button, and a bookmark prompt is displayed:
After entering a name, and clicking the OK button
- a bookmark is created for the user. The user can now select this
bookmark button in the dropdown button. When the location is selected the chart will change its center and zoom level, to the
one registered in the bookmark.
The user can also delete bookmarks using the “delete” shown below.
Alaska
Add
button
Delete
button
12
Navigation Area: Position
Position At any time when moving the cursor over the map
map, and
holding it there for a short period of time, the position of the cursor
on the chart is shown in the upper tool bar area.
13
Vessel Names: Displaying Multiple Vessel Names
Step 1:
Select the
clipboard icon
shown
Step 2:
Under “labels
“select “multiple”
Step 3:
Select the mailbox
icon shown
To display all vessels’ names on the system one must follow
the four steps shown at right.
Vessels’ names will only be displayed when the image is
zoomed in.
Step 4:
Under “labels”
select “name”
14
Navigation Area: Replay
If the user has access rights to perform replay an icon will be available in the top of
the navigation area, allowing the user to switch to replay mode.
When replay mode is entered the icon will be different (no clock face) and
allowing the user to switch to online mode.
15
Navigation Area: Replay
If the user has access rights to perform replay an icon will be available in the top of
the navigation area, allowing the user to switch to replay mode.
When replay mode is entered the icon will be different (no clock face) and
allowing the user to switch to online mode.
16
Navigation Area: Replay (cont’d)
Date - Presents the date from which replay will be performed. The calendar is used
to select the date. When clicked a small calendar will pop up in a new window.
Time Field - The time field is used to set the time from which to start replay. The
UTC (Universal Time Coordination or GMT – Greenwich Mean Time) value will
present the time zone for the client PC. During replay, the input field is updated with
the current time. The current time and date is also shown on the map.
This button is used to start replay. When replay is started the date and time can not be changed.
This button is used to stop replay.
These two buttons are used to change the replay speed
speed. The current value is shown between the buttons
buttons. The speed
can both be positive (forward) and negative (backwards). By default the refresh rate of the map will be 5 seconds. The refresh
rate can be changed in Preferences. If resolution is changed in replay mode the replay will stop. It stops at the nearest replay
minute. The replay can be started again by pressing the
button.
17
Options Window
Options Window - The Options Window provides the user with a range of options for
configuring the display, provides an overview map of the navigation area to allow for more
rapid navigation and provides a listing of watchdog events.
18
Options: Find “Ship”
The "Find Ship" function accessed by selecting the
icon shown above, allows the user to search
for a specific vessel’s location on the chart. One can search for a vessel by entering the vessel’s Call
Sign Ship Name,
Sign,
Name IMO number or MMSI (Marine Mobile Station Identification) number.
number The display
will highlight the location of the vessel in a white broken box as shown on the chart as shown in the
circled area above left.
19
Options: Chart Overview
The overview map function accessed be by selecting the
icon above, provides an
overview of where the chart view is positioned in reference to larger scale charts represented
by a red square on the overview map. The user can move the displayed area to another
20
location by clicking at a desired location outside the box
Options: Preferences and Vessel Legend
Triangle icons on the chart are AIS reports and circle icons are satellite position reports.
Triangle
g icons are AIS
position reports
Selection of
Vessel Legend
Color legend indicating
type of vessels
Circular icons are satellite
position reports
The vessel color legend may be shown or hidden by selecting this box
box.
The vessel’s position replay rate in minutes may be changed by selecting this feature
21
Options: Screen Resolution – Full Screen
A “full screen” display is
available, without the control
boxes at right, by selecting the
“change resolution” option and
“Fullscreen mode” option.
The full screen display at
right may be changed to
the split screen by
selecting the icon
at the top right of the
screen.
screen
22
Options: Ship List
5
3
4
2
1
By selecting the Shiplist option (1) , the user is presented with a new window (2) presenting all the AIS ship targets currently in
the system. If the user has an active filter, this filter is applied to the Shiplist. The user can select the vessel properties to be
displayed by clicking the appropriate property buttons then implement the changes by selecting the “update” (3) button.
The shiplist can be exported as a either a PDF or CSV
CS ffile by clicking the Export to PDF / Export to CSV
CS buttons (4).
( )
By checking the "Only display ships currently in map" option and clicking the update button, the ship list will be filtered
so that only ships present on the current chart display will be shown in the Shiplist. (5)
23
Options: Vessel Tracks and Properties
1
2
3
This part of the "General Settings" dialog allows the user to
enable and disable (1) the tracks of vessels, the setting of
p intervals ((2)) and configuring
g
g the number of hours
timestamp
This "General Settings" dialog allows the user to
choose properties that will be displayed for
vessels. To activate,, the user needs to select the
historical tracks will be displayed for a selected ship
(lookback) (3) After selecting the features the update button
should be activated.
preference tab
then set the “labels” option,
to "multiple". After selecting, the update button
should be activated.
24
Options: Watchdog Alerts
The binocular icon is selected to show Watch Dogs that are in effect. Administrators can configure
watchdogs (Alert Areas) that are available on a per user basis. Contact the Marine Exchange for
establishing or modifying watch dogs. (907) 463-2607
463 2607
If the Watchdog module has been enabled for your user account, a watchdog window will appear in the
bottom right corner as illustrated above.
25
Options: Watchdog Alerts (cont’d)
The watchdog window in the bottom right corner shows the watchdog event that has occurred within the past 12 hours.
Whenever a new event occurs, a popup window appears in the bottom right corner stating that an event has occurred.
By clicking on the name of the watchdog event
event, the map will zoom to the location where the watchdog event occurred
occurred.
The cross hatched area is a watch dog delineated zone that sends alerts to designated users when specified vessels
enter or exit this area.
26
Options: Watchdog Alerts (cont’d)
2
1
1. By clicking the "View Historical Watchdog Events" link in the live watchdog events window, the historical watchdog
event window is presented. This allows the user to show all the watchdog events that occurred on a specific day.
2. A date is selected by using the drop down menus and clicking the "Show button". A list of all events that occurred the
specific day is then presented. The user can click the name of the watchdog to zoom the map to the location where the
watchdog event occurred.
27
On Line Help and Log Out
O li Help:
Online
H l This
Thi utility
tilit d
describes
ib h
how tto use PACTRACS
PACTRACS. B
By
describing the various features. Select the ? icon to access help.
Log Out: Select button on
the top right
28