1
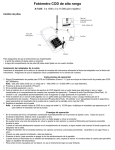
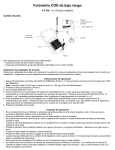
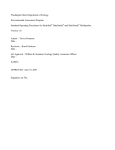
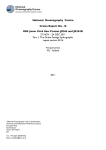
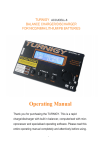
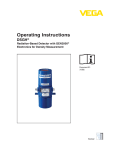
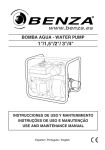
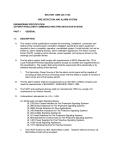
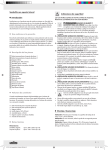
CHAPTER 7
MAINTENANCE
CONSIDERATIONS TO
ENSURE DATA QUALITY
7.1 INTRODUCTION
To ensure good quality data during a water quality monitoring project a maintenance
program must be in place for the monitoring sondes, platforms and equipment
employed. There are three basic types of maintenance procedures (U.S. Department
of Energy):
•
Reactive or corrective maintenance is an unscheduled action performed on a
system, equipment or one of its components in the attempt to restore it to a
specified performance condition. Basically, the system or product is fixed once it
brakes down or fails to perform as desired.
•
Preventive maintenance is a scheduled action performed on a system,
equipment or one of its components to detect or mitigate performance problems,
degradations, functional or potential failures, etc. with the goal of maintaining the
systems’ or product’s performance and it’s level of reliability.
•
Predictive maintenance is the action performed on a system, equipment or one
of its components to determine their performance and act in accordance of the
results. For example, instead of changing the oil in the car every X miles
(preventive), the oil is analyzed to determine its performance and depending on
the results, the oil will be kept or changed. Thus the oil can be changed before the
X miles or kept for extra miles. The need for maintenance is determined by the
condition of the system, equipment or component analyzed.
Even though, it is most probable that in a water quality monitoring endeavor all three
of these types of maintenance procedures are going to be applied, the maintenance
program must be focused on preventive and predictive maintenance.
To implement a successful maintenance program, the following three areas must be
covered:
a) Training: the personnel that perform maintenance activities (e.g. calibration and
post calibration of monitoring sensors, equipment and station inspections, cleaning
and replacement of instruments or parts) must have the adequate training to
ensure that they possess the necessary competence to do an effective and efficient
job.
b) Procedures and record management: procedures and record management
must be in place to ensure that (among other things):
→ The maintenance activities are well documented.
→ All instruments calibrated will conform to required specifications.
→ The operation and control of the processes are effective.
→ Methodologies to assess the root cause of problem are known.
→ Maintenance schedules are established.
→ Maintenance records are well kept and easily accessed and traceable.
→ Evidence of conformity of calibration is provided.
148
c
) Procurement and spare parts management: to ensure the reliability of the
c)
monitoring endeavor, each monitoring equipment or system must have an
adequate spare parts procedure to guarantee the availability of resources.
There are three main hardware systems that need to be addressed in a water quality
monitoring maintenance program:
→ Monitoring sondes
→ Monitoring stations
→ Verification equipment
When addressing the maintenance program of these systems, it is important to
consider that:
→
Not all equipment or components have equal importance and equal impact on
data quality.
→
The probability of failure or mal-function is different between equipment,
parts, and structures.
→
Service or maintenance cycles differ between equipment.
→
There is limited financial and personnel resources.
NOTE: To assure data quality, a quality assurance/control & maintenance program for the
monitoring data must be in place. To obtain guidelines on how to approach this issue, the
reader should consult EPA QA/G-5, EPA QA/G-8 and Helsel and Hirsch (2002).
7.2 SONDE MAINTENANCE
Data quality is directly related to the monitoring sonde performance. Therefore, it is
crucial to have a sonde maintenance program.
In general, the maintenance program would be based on “maintenance cycles”
correlated to the time frame the sondes can stay deployed without affecting data
quality. The cycle will depend on the probes’ characteristics, environmental conditions
(i.e. high fouling environments), battery life, and any other factors that affect the
sonde’s performance. In most monitoring situations the maintenance cycles follow a
seasonal pattern. For example, in high fouling environments, the length of time the
sonde can remain deployed will decrease as water temperature increases; monitoring
sondes that can be deployed for three weeks to one month in winter may need to be
changed on a weekly basis in summer.
149
The sonde maintenance program must address at least the following procedures:
Î Prepare the sonde for deployment
Î Calibration for deployment
Î Post-deployment performance verification
7.2.1 PREPARE THE SONDE FOR DEPLOYMENT
The sonde must be adequately prepared to handle the environmental factors that
could influence data quality. These physical, biological, and chemical factors are
characteristic of the monitoring site location. Therefore, no unique solution exists to
address these factors and the best approach to control them will have to take into
account, not only the site characteristics, but also, the deployment cycle and the
design of the monitoring station.
Among the environmental factors, special attention must be given to biofouling given
that is one of the main factors affecting the operation, maintenance and data quality of
the sondes (some examples of common and extreme biofouling are displayed in Figure
7.1). Among the many methods employed to reduce or prevent biofouling, the most
common ones are:
•
•
•
•
•
•
Painting the housing of the sensors with antifouling coatings.
Covering the housing of the sensors with antifouling copper tape.
Using the adequate anti-fouling probes’
wiper/wipers.
Painting the entire wiper body, including the
undersides with anti-fouling paint.
Using sensors with copper alloy housings.
Using copper-alloy sonde guard or painting the
sensor guard with anti-fouling coatings (do not
Figure 7.1 Copper tape on guard
paint the threads).
and probes
NOTE:
→ Black anti-fouling paint is strongly recommended. The black color will eliminate any
chance of stray reflection from the infrared light source when the probe is making
measurements (YSI, 2009).
→ Painting
the body of the instrument is not recommended. Instead of using paint,
the body can be wrapped with plastic wrap and secure with duck tape or with
plastic electrical tape.
→ In
addition to the use of anti-fouling paint or copper product, during long-term
deployments in extreme fouling environments, the deployment cycle must be
adjusted to the appropriate length to ensure data integrity.
150
Figure 7.2 Biofouling examples (Source: CBNERRVA, NIW - NERR, CICORE)
151
7.2.2 CALIBRATION FOR DEPLOYMENT
It is crucial that all sensors are calibrated following strictly the manufacturer’s
calibration procedures. Therefore, management must assure that:
•
Laboratory personnel have the necessary competence for the effective and
efficient application of the calibration procedures.
•
Systems are in place to assure sensor’s performance verification.
•
Records are kept to provide evidence that the requirements have being met.
Two examples of calibration logs are presented in Figure 7.3 and 7.4.
•
Critical parts, components and chemicals are in stock to ensure proper
maintenance activities.
NOTE:
→
Many multiparameter sondes are equipped with depth sensors that measure water
depth using a differential strain gauge transducer with one side of the transducer
exposed to water and the other to a vacuum. The transducer measures the
pressure of the water column plus the atmospheric pressure (YSI, 2008). During
calibration, the depth is calibrated in air and a depth offset must be used if the
pressure is different than 760 mm Hg.
To determine the correct depth offset, record the barometric pressure at the time
of calibration from a meteorological station at the calibration site or a reliable local
station. Tables 7.1 to 7.3 show offset correction as a function of atmospheric
pressure. These tables can be use to determine the offset to use during calibration
(CDMO, 2207).
→
When using a plastic or copper screen (or copper tape) at the bottom of the sensor
guard there is a possibility that interference with
turbidity readings could result from the screen. To
cancel any affects it might have, it is necessary to
calibrate the turbidity probe (1 point) in the zero
standard with the deployment sensor guard installed.
The amount of offset is generally determined by the
reflectivity of the guard and screen. In case of using
plastic screens, it is a good practice to use black screens
or paint the screen with black antifouling paint. For
copper screens, once the copper has taken on the
patina color the amount of offset decreases. Another
option would be to soak the parts in salt water to patina
them before your calibration
(Source: NIW Bay NERR)
If copper tape is used and replaced every deployment, then new offset must be
determined every time the guard is re-taped.
152
Table 7.1 Depth Offset (mm Hg) (Source: CDMO, 2207)
153
Table 7.2 Depth Offset (mb) (Source: CDMO, 2207)
154
Table 7.3 Depth Offset (in Hg) (Source: CDMO, 2207)
155
Figure 7.3 NERRS 6-series calibration log
156
HYDROLAB MULTIPROBE CALIBRATION/MAINTENANCE LOG
Calibration ____ Post Calibration ____ Initials:
Date:
Time: Instrument: Battery Voltage:
If this is a post calibration, give date of original calibration ______
Temp. of
Standard
Function
Value of
Standard
Initial
Reading
Calibrated
to
Comments
Specific conductance
pH calibrated (~7)
pH slope (~ 4/10)
Dissolved oxygen
DATA NEEDED FOR DISSOLVED OXYGEN CALIBRATION
Altitude (A )=______________feet above msl
Barometric pressure _________ inches
Barometric Pressure (BP) Options
Barometric Pressure Formulas
Barometer
Barometric pressure (inches) ________ x 25.4 = BP ________mm
From local source after correction (CBP)
BP _________ mm = CBP _______mm - 2.5 (altitude ____/100)
Estimated from altitude only
BP _________ mm= 760 mm - 2.5 (altitude _____/100)
For older Hydrolabs: Table DO value______ x ALTCORR______ x BAROCORR ______= DO standard _______
Calibration ____ Post Calibration ____ Initials:
Date:
Time: Instrument: Battery Voltage:
If this is a post calibration, give date of original calibration ______
Temp. of
Standard
Function
Value of
Standard
Initial
Reading
Calibrated
to
Comments
Specific conductance
pH calibrated (~7)
pH slope (~ 4/10)
Dissolved oxygen
DATA NEEDED FOR DISSOLVED OXYGEN POST CALIBRATION
Barometric Pressure (BP) Options
Barometric Pressure Formulas
Barometer
Barometric pressure (inches) ________ x 25.4 = BP ________mm
From local source after correction (CBP)
BP _________ mm = CBP _______mm - 2.5 (altitude ____/100)
Estimated from altitude only
BP _________ mm= 760 mm - 2.5 (altitude _____/100)
For older Hydrolabs: Table DO value______ x ALTCORR______ x BAROCORR ______= DO standard _______
Check previous maintenance and use; do the following before calibration:
Polish conductivity electrodes. Must be polished within the last
two months or once every 15 field trips
Date:
Name/comments:
Change pH reference probe solution. Must be renewed within last
two months or once every 15 field trips.
Date:
Name/comments:
Inspect DO membrane for nicks or bubbles. Must be changed
within last six months or once every 15 field trips.
Date:
Name/comments:
Change battery in 400 series sonde. Change once a year. Change
internal batteries for newer generation products according to
guidelines in product manual.
Date:
Name/comments:
Figure 7.4 Multiprobe calibration log
(Source: Texas Commission on Environmental Quality, 2003)
157
7.2.3 POST-DEPLOYMENT PERFORMANCE
VERIFICATION
Sonde post-deployment performance verification should include: post-calibration or
field performance assessment and field verification activities.
Post-calibration: activity done in a controlled laboratory environment after
retrieval of the monitoring sensor. The sensor readings are compared to standard
solutions to determine its performance. On-site post-calibration can be performed
following the same procedures as laboratory calibrations.
Field performance assessment: activity conducted in the field. As soon as the
sensor is retrieved it is placed in a standard solution and readings are recorded.
Field verification: indirect measurements of sonde performance. Using fieldmeasuring equipment, water quality measurements are taken and compared to
sonde readings.
Probe performance records are used for continual improvement, data analysis and
nonconformity management. As an example, a post-calibration log is presented in
Figure 7.5.
158
Figure 7.5 YSI 6-series post-calibration log
159
During field verification, it is a good practice to take an independent measurement for
each sensor parameter. Generally, field verification is performed during the monitoring
sonde exchange phase. A possible sonde switch-out process could be:
160
For on stream & river bank platforms, a different method to obtain simultaneous
readings between the replacement sonde and deployed sonde must be used if the
station has only one guard-pipe. Possible reasons for using only one guard-pipe are:
→
→
The guard-pipe is placed where there is a small pooling of water or the
sampling area is not big enough to accommodate two sondes.
Due to high flow conditions, cost or maintenance issues it was decided to put
only one guard-pipe.
If only one guard-pipe is used, a possible switch-out process could be:
161
For monitoring stations with telemetry capabilities, the following procedure is
recommended to interchange the field cable connector between the deployed and the
replacement sonde.
162
WATER QUALITY MONITORING DEPLOYMENT AND RETRIEVAL LOG
Identification Number
Revision
Effective Date
Pages
Page 1 of 1
Field Location
Crew
DATALOGGER INFORMATION
YSI ID Number
Time (EST)
Deployment (in)
Retrieval (out)
WEATHER INFORMATION
Weather Conditions
measured with Kestrel
Wind Speed
0
1
2
3
4
5
Current Wind Speed (m/s)
Air Temp (C)
Relative Humidity (%)
10
11
12
13
14
15
16
Precipitation Type
None
Drizzle
Light Rain
Heavy Rain
Squally
Frozen Precipitation
Mixed Rain&Snow
E
ENE
ESE
N
NE
NNE
NNW
NW
0-1 (knots)
>1 - 10
>10 - 20
>20 - 30
>30 - 40
> 40
Cloud Cover
0-1 (m/s)
1-5
5-10
10-15
15-21
21-26
fr East (90 deg)
fr East NE (67.5 deg)
fr East SE (112.5 deg)
fr North (0 deg)
fr NE (45 deg)
fr North NE (22.5 deg)
fr North NW (337.5 deg)
fr NW (315 deg)
0
1
2
3
4
5
6
Wind Direction
S
SE
SSE
SSW
SW
W
WNW
WSW
Clear (0-10%)
Scatter/partly Cloudy (10-50%)
Partly to Broken (50-90%)
Overcast (>90%)
Foggy
Hazy
Cloud (no percentages)
fr South (180 deg)
fr SE (135 deg)
fr South SE (157.5 deg)
fr South SW (202.5 deg)
fr SW (225 deg)
fr West (270 deg)
fr West NW (292.5 deg)
fr West SW (247.5 deg)
WATER INFORMATION
Water and Secchi Depths
Water Depth (m)
Secchi Depth (m)
If Secchi can be
seen at the bottom
Depth m
0.10
0.25
0.50
0.75
1.00
1.25
1.50
1.75
2.00
2.25
2.50
SD > WD
Temperature
Wave Heights
0
0 <0.1m
1
0.1 <0.3m
2
0.3 <0.6m
3
0.6 <1.0m
4
1.0 <1.3m
>1.3m
5
Tidal Stage
E
Ebb Tide
F
Flood Tide
H
High Tide
L
Low Tide
WATER COLUMN DEPTH PROFILE
SpCond
Salinity
DO(%Sat)
Comments:
Figure 7.6 Field verification log
163
VERIFICATION SAMPLES
Chla Filter Volume
DO(mg/l)
pH
Note:
Two conditions that must be met when transporting multiparameter sondes to and
from the monitoring sites are:
•
•
The sondes must be transported in a saturated environment.
The sondes must be transported in a container that minimizes shocks and
vibrations.
Two commonly employed methods are:
→ The sonde is transported wrapped up within a wet towel (CDMO, 2007).
-
Soak a towel (large enough to wrap around the entire sonde) in tap water and
wring out most of the water (check that it is wet; humid, not damp).
Wrap the sonde in the towel, leaving some excess towel at the bottom of the
sensor guard so it can be folded to ensure the guard is completely covered.
Place the towel-wrapped sonde in a bucket, a cooler or other container for
transportation to the monitoring site.
It is good practice to transport the sondes in a container of sufficient size to
allow the sondes to lie horizontally across the bottom.
→ The sonde is transported in a 5-gallon bucket filled with tap water.
-
Drill one or two holes on the lid about 3½ - 4
inches in diameter.
Place some type of cushion on the bottom of
the bucket to minimize shocks and vibrations.
If necessary, place some kind of weight on the
bottom to prevent the bucket to tip over
during transit due to the sonde’s weight.
Fill the bucket with tap water so that the
probes stay submerged.
Some kind of structure can be built to
accommodate several buckets in a stable
position during transit (in this case there is no
need to place a weight inside the bucket).
164
7.3 STATION MAINTENANCE
The following activities must be included in the station maintenance program:
•
Verification of station conditions during deploymentretrieval of monitoring sensors.
•
Schedule on-site verification and cleaning of guard-pipes.
•
Schedule retrieval of guard-pipes for cleaning and painting
(once a year minimum).
•
Schedule cleaning and rebuilding of monitoring platforms.
•
Maintenance procedures and spare parts management.
IT IS A GOOD PRACTICE TO CLEAN THE INSIDE AND
OUTSIDE OF THE GUARD-PIPE AFTER THE DEPLOYED
SONDE IS RETRIEVED AND BEFORE THE NEWLY
CALIBRATED SONDE IS DEPLOYED.
The guard pipe must be cleaned on a frequent basis to
minimize the influence of biological fouling and to eliminate
any physical fouling that could be interfering with the
measurements.
Figure 7.7 Cleaning inside
the guard-pipe
The best way to clean the inside of the guard-pipe is by using
some kind of brush or mop. The brush can be purchased in any retail store or easily
assembled. For example, a cleaning brush can be constructed using a 16 foot
extension pole (Figure 7.7 and
7.8). To add extra cleaning
power two scrub brushes can be
bolted to the extension pole.
Care must be taken when
brushing the guard-pipe to
minimize brushing off the antifouling paint. If cleaning is
performed on a regular basis,
minimum fouling will occur on
the guard-pipe, therefore, a
medium-soft brush will be
enough to maintain the guardpipe in good condition.
To clean the outside of the
guard-pipe, also a particular
brush can be purchased in any
Figure 7.8 Guard-pipe cleaning brushes
retail store or easily assembled.
For example, Figure 7.8 displays a brush to clean the outside of the guard-pipe
constructed by bolting two scrub brushes to a 8 inch long – half 6 inch PVC pipe.
165
In some situation a chimney sweep brush is a good option. Even though the brush is
tough on the anti-fouling paint, many pipes stay in year after year and in these cases
the anti-fouling paint is not an issue and a chimney brush works well to clear the pipe
of hard and soft biological fouling.
In certain types of guard-pipe installations (e.g. on river or stream bank) it is a good
practice after brushing the pipe to rinse it by pouring a bucket of surface water down
the pipe.
NOTE: Any evidence of physical and biological fouling that could have affected the
monitoring data must be recorded for further analysis.
7.4 TELEMETRY EQUIPMENT MAINTENANCE
Proper maintenance of the Telemetry equipment is essential to obtain accurate data.
Equipment must be in good operating conditions, routine and schedule maintenance
and inspection must be peformed..
must include at least the following activities
to ensure that your telemetry equipment is mounted far enough above sea level to be
clear of wave action and storm surges due to hurricanes. Take out equipment
(EPA 2002)
Battery: Campbell Scientific
Cyclic service life of rechargeable batteries
The industry definition of the “cyclic service life” of a battery is the period until it dorps
to 60% of its rated capacity. For a 7 Ahr battery, this is when after repeated
recharging, the battery can only deliver 4.2 Ahrs. When choosing a battery, you should
also consider the number of recharge cycles you can expect from the battery until it
reaches the end of tis cyclic life.
Several factors affect the cyclic service life, including ambient temp during charging
and storage, number of discharge cycles, depth of discharge cycles and charging
voltage. Clearly these are complex relationships.
The following may help you assess your batteries’ service life:
1) temperature: warmer temperatures decrease life because heat hastens chemicals
reaction that cause corrosion of the internal electroedes. The temperature effects are
graphed and described on the following page.
166
Depth of discharge
Determine minimum and maximum battery voltages in your daily data. Analyze the
data using tool to count the number of times the voltage dropped below certain
values.
Check for more info http://www.mpoweruk.com/life.htm
167
7.5 MEASURE THE DISTANCE FROM THE
SONDE’s HOLDING BOLTS TO THE BOTTOM
SEDIMENTS
Water depth is one of the parameters measured by a monitoring sonde. A differential
strain gauge transducer is generally employed to measure the pressure of the water
column plus the atmospheric pressure above the water. To have an accurate water
depth measurement, a program must be utilized to eliminate the errors produced by
atmospheric pressure variations.
Water depth is the distance from the water surface to bottom sediments. The sonde
measures water depth as the distance from the transducer to water surface; therefore
to have an accurate water depth, the distance from the transducer to the bottom
sediments must be added.
In a fixed structure monitoring platforms, the distance from the transducer to bottom
sediments can be divided into two segments: the distance between the transducer and
the bolts (where the monitoring sonde sits inside the guard-pipe) and the distance
between the bolts and the bottoms sediments. The distance from the transducer to the
bolts is fixed and known. The distance between the bolts and the bottom may vary;
given the bottom can change over time.
There are some environments
that are more conducive to
In addition, verification measurements must be taken
have bottom movements (i.e.
around the guard-pipe to check if physical fouling or
deposition of sediments) than
different bottoms movements occurred under the guardpipe that would cause an inaccurate water depth others; therefore the distance
between the transducer to the
measurement.
bottom must be measured
frequently.
To determine the distance between the bolts and the
bottom, a special tool is utilized (made with an aluminum
telescoping extension pole and a disk with two opposite openings). Three
measurements are taken, one inside the pipe and two outside the pipe. These three
measurements are utilized to calculate the distance between the bolts and the bottom.
The procedure to determine the distance between the bolts and the bottom is shown in
the following page.
168
169
170
171
7.6 CORRECTION FACTOR FOR WATER
LEVEL/DEPTH DATA REPORTING
Austin et al. (2004) state that multiparameter sondes equipped with non-vented
pressure sensors are most commonly used for continuous water quality monitoring.
Standard calibration protocols for the non-vented sensor use ambient atmospheric
pressure at the time of calibration. Changes in atmospheric pressure between
calibrations appear as changes in water depth. A 1.0 millibar change in atmosphere
pressure corresponds to an approximate 1.0 centimeter change in water depth.
Therefore, use of a non-vented pressure sensor can result in significant water depth
errors for large-scale weather and storm events. This error is eliminated for level
sensors because they are vented to the atmosphere throughout the data sonde
deployment time interval. If proper atmospheric pressure data is available, nonvented sensor depth measurements can be post-corrected for deployments between
calibrations. This correction combined with a common reference point from a survey
station, results in more accurate water depth data.
Austin et. al. demonstrate the relative ease of adjusting non-vented depth sensor data
for atmospheric pressure changes to reflect more accurate measurements.
Ambient laboratory atmospheric pressure was measured using a Varila pressure
sensor with data being stored at 15 minute intervals on a Campbell 10X datalogger.
Following retrieval of the instrument from the field, data can be downloaded and saved
as an Excel file. Atmospheric pressure data collected at the appropriate time interval
and the atmospheric pressure at the time of calibration can be added to the Excel file.
The raw depth data is adjusted by the following simplistic equation:
Depthadjusted = DepthYSIraw +
(atm. pressurecalibration − atm. pressureambient )
100
172
In many cases, adjustment of the raw data can correct depth levels to positive values,
which can result in more accurate and less confusing information (Figure 7.8, Table
7.4).
0.4
YSI Corrected
W ater D epth m
0.3
YSI Raw
0.2
± Sensor Precision
0.1
0
-0.1
0
1
2
3
4
5
6
7
-0.2
Hours
Figure 7.9 Raw vs. corrected YSI depth data from the York River over time
(accuracy +/- 0.018 m)
Time
Raw Depth
Adjusted Depth
Ambient Pressure
05:00
05:15
05:30
05:45
06:00
06:15
06:30
006:45
07:00
1.66
1.64
1.62
1.61
1.61
1.59
1.59
1.60
1.60
1.72
1.69
1.68
1.67
1.67
1.66
1.66
1.67
1.68
1014.8
1014.8
1014.9
1014.4
1013.9
1014.0
1013.4
1013.1
1013.0
Calibration
Pressure
1020.30
1020.30
1020.30
1020.30
1020.30
1020.30
1020.30
1020.30
1020.30
Table 7.4 Example of raw depth data using atmospheric pressure at time of calibration
vs. adjusted data using ambient atmospheric pressure from weather station.
Additionally, extreme storm events, such as hurricanes, are marked by large
depression in atmospheric pressure during the storm’s passage. For example, in the
case of Hurricane Isabel, a 30 millibar drop was observed resulting in a 0.30 m error in
water depth level.
173
3.6
3.4
3.2
3
2.8
2.6
2.4
2.2
2
1.8
1.6
1.4
1.2
1
Calibration Pressure
Atmospheric Pressure
YSI Corrected
1025
1020
1015
1010
1005
1000
995
990
985
980
975
Atm ospheric Pressure
m bar
W ater Depth m
Given atmospheric pressure data at the time of instrument calibration and during
instrument deployment, water depths are easily corrected (Figure 7.9).
YSI Raw
Hours
Figure 7.10 Raw vs. corrected YSI depth data using atmospheric pressure at
time of Hurricane Isabel.
To further enhance the value of water level data, traditional optic or advanced GPS
surveying systems can be used to reference water quality monitoring platforms in
instruments to a standard vertical datum. Common local datums include mean sea
level (MSL), mean lower low water (MLLW), and mean higher high water (MMHW).
Increase accuracy and value of water depth data can be realized by correcting for
atmospheric pressure changes during the deployment period and reporting the data to
a common vertical reference datum. Benefits of more accurate and vertically
referenced water level data can facilitate AQ/QC efforts by removing erroneous
negative values while providing water level information in a more user acceptable
format, thereby increasing the use of water level data by a broader audience.
174
7.7 EQUIPMENT MAINTENANCE
As stated in ISO 9001:2600
The organization shall determine the monitoring and measurement to be
undertaken and the monitoring and measuring devices needed to provide
evidence of conformity of product to determined requirements.
The organization shall establish processes to ensure that monitoring and
measurement can be carried out and are carried out in a manner that is
consistent with the monitoring and measurement requirements.
Where necessary to ensure valid results, measuring equipment shall:
a. be calibrated or verified at specified intervals or prior to use, against
measurement standards traceable to international or national
measurement standards; where no such standards exist, the basis
used for calibration or verification shall be recorded;
b. be adjusted or re-adjusted as necessary;
c. be identified to enable calibration status to be determined;
d. be safeguarded from adjustments that would invalidate the
measurement result;
e. be protected from damage and deterioration during handling,
maintenance and storage.
All the equipment used to calibrate and post-calibrate the sensors and field
verifications must be maintained, calibrated or pass some quality assurance check to
ensure their accuracy and that they perform to accepted standards.
Equipment histories, records and logs must be maintained.
175
7.8 REFERENCE
ANSI/ISO/ASQ Q9001-2000. Quality management systems - Requirements.
American Society for Quality
Austin Joy, Terri Keffert, Jim Goings and William Reay. 2004. Enhancing the Value
of SWMP Depth Data. Poster presented at the inauguration of the Catlett-Burress
Research and Education Teaching Lab.
CDMO. 2007. YSI 6-Series Multi-Parameter Water Quality Monitoring Standard
Operating Procedure. Version 4.1 National Estuarine Research Reserve SystemWide Monitoring Program (SWMP).
Helsel D.R. and R.M. Hirsch. 2002. Statistical Methods in Water Resources. U.S.
GEOLOGICAL SURVEY
Resources Inventory Committee. 1999. Automated water quality monitoring:
Field manual. Ministry of environmental lands and parks. The Pro. of British
Columbia.
Sullivan, G.P., R. Pugh, A.P. Melendez and W.D. Hunt. 2004. Operations &
Maintenance Best Practices: A Guide to Achieving Operation Efficiency. US
Department of Energy.
Texas Commission on Environmental Quality. 2003. Surface Water Quality
Monitoring Procedures, Volume 1: Physical and Chemical Monitoring Methods
for Water, Sediment and Tissue. Monitoring Operations Division.
U.S. Department of Energy. Operations and Maintenance. Energy Efficiency and
Renewable Energy. Federal Energy Management Program.
http://www1.eere.energy.gov/femp/operations_maintenance/om_strategies.html
U.S. Environmental Protection Agency.2002. Guidance on Environmental Data
Verification and Data Validation. EPA QA/G-8.
U.S. Environmental Protection Agency.2002. Guidance for Quality Assurance
Project Plans. EPA QA/G-5
YSI Incorporated. 2008. 6-Series - Multiparameter - Water Quality Sondes User Manual.
YSI Incorporated. 2009. Calibration Tips for YSI 6-Series Sondes & Sensors.
176