1
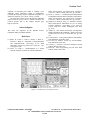
Session 11a4
Low Cost Test Platform for a Basic Electrical Measurements Laboratory
Ricardo Mediavilla
Engineering Department
Inter American University of Puerto Rico, Bayamón Campus
Bayamón, PR 00957
Abstract - In introductory circuit analysis and electronics
laboratories students face multiple challenges. They must be
able to measure, discover, analyze, or explain electrical
phenomena or principles using test sets that in general are
not user friendly, do not talk to each other, and are limited
in their data collection, processing, printing, and plotting
capabilities. Sometimes the effort required to collect the
data may even shadow the main objective of the laboratory,
experiment, or design project being conducted. Hispanic
minorities typically also face the additional problem of
having to deal with instrument manuals and instructions
written in English, a second language for them. Moreover,
to educational institutions, basic electrical measurements
test sets represent a major acquisition investment. As a
proposed solution, a low cost, user friendly test platform has
been developed. It consists of a personal computer with a
multifunction PCI data acquisition card controlled by a
graphical programming language.
Introduction
Modern test sets are seldom easy to use. Typically they have
many options and features that although powerful and useful
to the experienced user, can be quite confusing to the novice
electrical engineering or electronics student. Hispanic
minorities typically also face the additional problem of
having to deal with instrument manuals and instructions
written in English, a second language for them. Sometimes
the effort required collecting electrical measurements data
might even shadow the main objective of the laboratory,
experiment, or design project being conducted.
Laboratories play an essential role in an electrical
engineering or in an electronics curriculum. Computer
simulations help, but are not a substitute for hands on testing
in a laboratory [1]. Without the laboratories, students would
not acquire the basic skills demanded by their profession.
However, in addition to the complexity of the test sets,
educational institutions also face a staggering cost issue.
Test sets are expensive to acquire. Since typically each test
set has its own power supply, its own set of knobs and
control switches, its own digital or analog readout displays
or screens, and its own casing or chassis, educational
institutions end up paying for redundant components.
To eliminate redundant components in a laboratory test
station, and to facilitate instrument operation by non-skilled
users, multiple authors, [2], [3], and [4], have in the past
proposed the use of virtual instruments. Virtual instruments
become even more relevant as language options are offered
to the user and as a PCI data acquisition and control card
(DAC) readily integrates into a user friendly graphical
programming language thus facilitating instrument
development.
Right from the beginning, user friendliness was a key
design requirement the developed station had to comply
with. User interface screens played a key role achieving
compliance with this requirement. A welcome screen
prompts the user for the language of choice, English or
Spanish. From that point on, all the commands, instructions,
hints, and options will appear, not in dual language, which
would be quite confusing, but in the language chosen by the
user. In addition to the language options, colors have been
used to guide the user. All the knobs and controls related to a
common function share the same color. The main objective
was to have simple instruments with all the basic capabilities
operating in the language of choice of the student and in a
user friendly and non-threatening environment.
Although in principle almost any high level language
could have been used to develop the test platform,
conventional high level languages would have required a
major investment in time and effort. In addition, control of
the DAC card and the development of user interface screens
would have been much harder to achieve than with a
graphical programming language.
A graphical programming language facilitates the
implementation of virtual instruments and user interface
panels. Virtual test sets covering the basic functions found in
power supplies, oscilloscopes, multi meters, frequency
counters, function generators and spectrum analyzers have
been implemented using a graphical programming language.
User selectable hint and help icons provide assistance, if
needed.
System Components
The main components of the system are an IBM compatible
personal computer (PC), one DAC card with its
corresponding shielded cable, patch panel, interconnection
box, and associated cables, connectors, and test leads, plus
the HP VEE graphical programming language. Data
Translation’s visual programming interface (VPI) DT3010
was chosen. The DT VPI DAC card integrates into the HP
VEE as a regular icon thus allowing easy access to the
collected data and facilitating instrument control. In the
DT3010, special built-in icons allow control of 32 single
0-7803-5643-8/99/$10.00 © 1999 IEEE
November 10 - 13, 1999 San Juan, Puerto Rico
29th ASEE/IEEE Frontiers in Education Conference
11a4-18
Session 11a4
mode analog inputs (or 16 analog inputs in differential
mode), 2 analog outputs, 4 user counter/timers, and 16
input/output lines.
A patch panel, also manufactured by the DAC card
supplier, allows easy access to each one of the input and
output channels, plus timers and clocks. Twisted pair wires
connect the patch panel ports with either banana plug or
BNC connectors in a metal box. The oscilloscope has two
dedicated BNC connectors, one per channel. A third BNC
connector serves as the input port to the spectrum analyzer.
All the other instruments have dedicated banana plug type
output ports. Users just have to plug in the test leads into
either banana plug or BNC type of connectors. All current
sources are protected with fuses, either 100 mA, or 5 mA
micro fuses.
Test equipment is expensive. A single fully equipped
station for a basic electrical measurements laboratory with
frequency domain analysis capabilities can easily exceed
$10 K. In addition to the capital investment, additional
expenses include maintenance, equipment calibration,
workbenches, and floor space. Even if several test sets are
stacked on top of each other, a table or workbench large
enough to accommodate all the equipment and allow
reasonable user working space is required. The total cost of
the developed system, including a high performance PC and
all the additional components, is less than $ 6 K per station.
However, if several stations are assembled and only one, the
development station, runs the full software while the
remaining ones are loaded with run time versions, then
software costs can be spread over a larger base thus reducing
even more the per unit cost.
Educational institutions may find the proposed
configuration easier to economically justify since the PC’s
can also be used by a larger pool of students, and may serve
multiple purposes, including word processing and spread
sheet analysis, even for non electrical engineering or
electronics majors.
Software Architecture
The following instruments have been developed:
oscilloscope, digital multi meter with voltmeter, current
meter, and ohmmeter options, frequency counter, power
supply, function generator, and spectrum analyzer. To
simplify programming, each instrument is contained within a
User Object in the HP VEE graphical programming
language. Future developments and options can be easily
added to any particular instrument without affecting the
overall architecture or any of the previously developed
instruments. New instruments can easily be incorporated
into the existing architecture.
Oscilloscope
As in [5], the virtual oscilloscope was designed with the
intention of allowing students to make basic electrical
measurements without having to deal with the intricacies of
multiple knobs. Colors have been used to make the use of
the oscilloscope virtual instrument even more intuitive. For
example, it has two input channels and can display two
waveforms. The channel 1 waveform is plotted in red while
the channel 2 waveform is plotted in blue. All the knobs and
settings controlling channel 1 are in red while all the knobs
and settings controlling channel 2 are in blue. All the timing
and trigger options are in yellow. Figure 1 shows the
oscilloscope user interface screen.
The built-in mathematical functions of the graphical
programming language simplified the development of the
application. For example, key controls in an oscilloscope are
the DC/AC coupling for every channel. In a real
oscilloscope, AC coupled signals pass through a capacitor to
block the DC component. In a software implementation, the
mean or DC value of the signal is mathematically calculated
and then subtracted from the original array of data points.
The same effect achieved by the blocking capacitor is
achieved using software instructions, but with the advantage
that the original signal is not distorted. In a real
implementation students will observe the rise and fall time
of the waveform due to the charging and discharging
capacitor. The software implementation achieves a true DC
removal without distorting the original waveform.
Scales and conversion factors typically confuse students
learning basic test and measurement techniques. To simplify
their task, for each channel all the main signal statistics,
maximum, minimum, root mean square, mean or DC value,
and peak to peak are displayed. Markers facilitate relative
time and relative amplitude measurements. Students can
concentrate on the basic observations and waveforms. The
computer will do the calculations for them.
Like in a storage scope, waveforms can be stored in a
data file for later retrieval, analysis by any other software
application, or for plotting.
All input analog channels, including the two
oscilloscope channels, have been programmed to measure
bipolar signals with a range of +/- 10 V, and a resolution of
12 bits.
Multi Meter
The multi meter may operate in any of the following three
options: voltmeter, current meter, and ohmmeter. Each one
of these three functions has a pair of input leads or wires and
a separate channel assigned to it. Figure 2 shows the multi
meter user interface screen.
Figure 3 shows the voltmeter user interface screen. The
user just selects the desired statistics (root mean square,
average or DC, maximum, minimum, and peak to peak) and
the measurement scale. The user interface screen clearly
0-7803-5643-8/99/$10.00 © 1999 IEEE
November 10 - 13, 1999 San Juan, Puerto Rico
29th ASEE/IEEE Frontiers in Education Conference
11a4-19
Session 11a4
indicates the chosen option and includes both an analog and
a digital display. To increase realism, the analog display has
been programmed to change slowly, just like in a real analog
voltmeter exhibiting a mechanical time constant in its analog
display.
The current meter is just a slight variation of the
voltmeter implementation. A small resistor is used as a
current sensing device. When the current to be measured
passes through a small resistor, a voltage drop is recorded.
Based on the recorded voltage drop and the known
numerical value of the resistor, the software then uses
Ohm’s law to calculate the actual current. Similarly, a
known voltage source with a known series resistor and the
unknown resistor in shunt is the basic arrangement for
implementing the ohmmeter.
Power Supply
Figure 4 shows the power supply user interface screen. The
user only has to turn on the instrument, use a software knob
to select the desired output voltage, and watch the analog
and digital output voltage displays. Like in the voltmeter, to
increase realism, a time constant has been programmed to
simulate the response time of a real analog display. In
addition, students will observe that instruments, like all
electrical systems, undergo transients and take time to react
to changes in their input parameters. Since the DAC card
must supply the output power and since it must derive it
from the PC internal power supply, the maximum voltage
range is limited to +/- 10 V. The maximum current is limited
to +/- 5 mA. Users requiring a higher current output must
instead rely on a fixed +5 V output port rated at a maximum
current of 100 mA.
Frequency Counter
Figure 6 shows the frequency counter user interface screen.
The frequency counter is implemented by counting the
number of events or pulses in a specified time interval. The
user has the options of either selecting fast single frequency
measurements, or slower but more accurate average
frequency measurements.
Spectrum Analyzer
Figure 7 shows the spectrum analyzer user interface screen.
For simplicity only three controls knobs have been included:
1. Center frequency. 2. Resolution bandwidth which defines
the maximum frequency span with respect to the center
frequency. 3. Video bandwidth which filters noise
components. The user also has the option of windowing the
time series data using Bartlet, Hamming, Blackman, or
Hanning windows.
Like in the oscilloscope, the frequency range of
operation is limited by the sampling rate of the DAC card.
To avoid aliasing, the sampling frequency must exceed twice
the highest frequency component of the sampled signal.
Since the DAC card being used has a maximum sampling
rate of 1.25 MHz, a wide frequency response is available for
introductory electronics or circuit analysis courses. More
advanced courses may require test sets to operate at even
higher frequency ranges.
Conclusion
A low cost and user friendly test platform for a basic
electrical measurements laboratory capable of servicing
introductory level electronics and circuit analysis courses in
Function Generator
electrical engineering and electronics programs has been
developed. Language options, color coding of knobs and
The user selects the desired function: sine, cosine, controls, plus help and hint icons all contribute to create a
square, triangular, positive ramp, negative ramp, or DC user friendly environment.
waveform. Once the function has been selected, using
Even though when compared with professional level
software knobs, the DC offset or bias voltage, the phase instruments the test platform may be outperformed in terms
offset, the amplitude, and the frequency are specified. Figure of accuracy, noise levels, speed, frequency range, voltage
5 shows the function generator user interface screen. To range, and power output, it is a reasonable economic
generate the waveform, a virtual function generator in the alternative and a useful educational tool for basic electrical
graphical programming language first numerically calculates measurements laboratories. Moreover, frequency domain
the corresponding data points for the user selected analysis capabilities, typically found only in expensive test
waveform. Then, a digital to analog conversion unit sets, are incorporated at no extra cost. Information
synthesizes the analog voltage waveform based on the technology and electrical measurement technology have
numerical data points and 12 bits of resolution. To generate been merged into the educational process.
a periodic analog waveform, the same operation is
Future developments include the following additional
continuously repeated. A simple RC filter [6] is connected to options: 1. Adding to the function generator virtual
the output leads to remove high frequency noise. Like in the instrument the capability of generating modulated signals
power supply, the maximum output load is +/- 5 mA. So that and user defined arbitrary functions. 2. Adding to the
the user will have a clear picture of the waveform that is oscilloscope the capability of automatically calculating the
being generated, a numerical plot of the data from which the frequency and period of the recorded waveform. 3. Adding
software synthesizes the actual waveform is portrayed in the to the frequency counter the capability of measuring relative
user interface screen.
phase differences or delay between two signals, and the
0-7803-5643-8/99/$10.00 © 1999 IEEE
November 10 - 13, 1999 San Juan, Puerto Rico
29th ASEE/IEEE Frontiers in Education Conference
11a4-20
Session 11a4
capability of measuring pulse width. 4. Creating a new
additional virtual instrument capable of automatically
recording the frequency response, magnitude and phase as a
function of frequency, for a device, circuit, or system.
The project has a home page in the Internet. Additional
details about the project can be obtained activating the
research projects link at the Campus Internet page
http://bc.inter.edu.
[3]
[4]
Acknowledgment
This work was supported by the National Science
Foundation under grant DUE-9850603.
References
[5]
[6]
[1] Baker, R., Yunus, J., Taha, F., Hassan, I., Basir, S.,
Husain, F., Muda, Z., “Integration of Experimentation
and Computerization”, Proceedings of the IEEE
Multimedia Engineering Education Conference, July
1994, pp. 213-218.
[2] Bucci, G., Landi, C., “Implementation of a Virtual
Network Analyzer by Means of VXI-Based Modules”,
[7]
[8]
[9]
IEEE Instrumentation and Measurement Technology
Conference, Ottawa, Canada, May 1997, pp. 246-250.
Bucci, G., Landi, C., “VXI-Based Virtual Instrument in
Undergraduate Measurement Laboratory Experiments”,
IEEE Instrumentation and Measurement Technology
Conference, Ottawa, Canada, May 1997, pp. 241-245.
Maguire, D., Meckl, P., King, G., “Personal ComputerBased Task-Specific Instruments for Use in Analog
Controls Education”, Proceedings of the American
Control Conference, Seattle, Washington, June 1995,
pp. 54-58.
Adams, R., “The Virtual Oscilloscope: An Impedance
Match to Beginning ECE Students”, IEEE Transactions
on Education, Vol. 34, No. 4, November 1991, pp. 350356.
DT 3010 Series – Getting Started Manual, First Edition,
Data Translation, September 1998.
DT VPI User Manual, Version 5.0, Second Edition,
Data Translation, June 1998.
Coombs, C., Electronic Instrument Handbook, Second
Edition, McGraw Hill, 1995.
Helsel, R., Visual Programming with HP VEE, Third
Edition, Prentice Hall, 1998.
Figure 1. Oscilloscope User Interface Screen
0-7803-5643-8/99/$10.00 © 1999 IEEE
November 10 - 13, 1999 San Juan, Puerto Rico
29th ASEE/IEEE Frontiers in Education Conference
11a4-21
Session 11a4
Figure 2: Multi Meter User Interface Screen
Figure 3: Voltmeter User Interface Screen
Figure 4: Power Supply User Interface Screen
0-7803-5643-8/99/$10.00 © 1999 IEEE
November 10 - 13, 1999 San Juan, Puerto Rico
29th ASEE/IEEE Frontiers in Education Conference
11a4-22
Session 11a4
Figure 5: Function Generator User Interface Screen
Figure 6: Frequency Counter User Interface Screen
Figure 7: Spectrum Analyzer User Interface Screen
0-7803-5643-8/99/$10.00 © 1999 IEEE
November 10 - 13, 1999 San Juan, Puerto Rico
29th ASEE/IEEE Frontiers in Education Conference
11a4-23