1
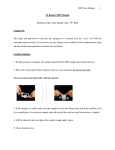
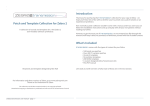
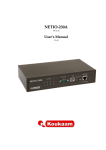
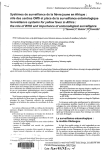
XRF User Manual
1
X-Ray Fluorescence - Data Collection and Analysis
Matthias Zeller, Jerry Hunter, Sept. 19th 2008
A) Data Collection
Logging In:
The login and password to log into the program as a normal user are “ysu1” for both the
username and password. If you need to use any feature only available with an administrator
login ask one of the instrumentation scientists for assistance.
Loading Samples:
1. If using powders or liquids, the sample should fill the XRF sample cups about half way.
2. Place the 3.6 µm mylar film in between the two cups and press down fast and hard. Try not
to touch the mylar film with bare hands!
3. If the sample is a solid, make sure the sample fits into the 40mm rings inside the machine. If
it is too small place it in a plastic sample cup with mylar film such as used for powders or
liquids.
4. Lift the chamber door and place the sample in any empty space.
5. Close chamber door.
6. For manual loading of samples, see Appendix 3.
XRF User Manual
2
Calibration:
1. It is important to calibrate the machine at the beginning of each day.
2. The screen on the XRF machine should be highlighted on Loader. If not highlight Loader.
3. To calibrate the machine select the space in which the copper disc is located (delete any
experiment defined for this position).
4. Under choose your application press recal.
5. Highlight copper disk calibration. Press Next
6. On the loader screen, highlight the copper disk space.
7. Press measure.
8. The hourglass shows calibration in progress in the bottom right-hand corner. It will take
about 8min for the calibration to complete.
9. While the calibration is running you can start setting up your sample(s). They will be queued
and once the calibration disk is returned to its original spot the next samples will be
measured.
Sample Analysis:
1. Highlight the spot on the touch screen that corresponds to where you will put your sample.
2. Under Choose Application select which application you want to run. (the application you
choose will depend on your sample and what results you are looking for)
Description of Methods;
•
Elements Powder and Solid- used to find out what elements are present in the sample.
XRF User Manual
•
3
Fluoride Pellet/Powder- used to find what ratios of fluorides are contained in the sample.
Use ‘pellet” method if sample is in a pressed pellet, and powder if the sample is in powder
form.
•
Oxides Powders/Solid- used to find what ratios of oxides are contained in the sample. Use
“powder” if sample is in powder form and “solid” if sample is in solid form.
•
Water- used to find what elements are contained in a liquid sample.
•
More methods that are less often used are listed under Other
•
You are not limited to just these methods. Methods can be created and adjusted to
accommodate different types of analysis.
3. Enter the sample ID and press next.
4. Under Select the Preparation choose Mylar 3.6µ
µm for powders or, for solid samples, Solid,
SpectroBlend, or X-ray mix (this will depend on the type of solid. As a standard choose
“Solid.”)
5. Press complete and/or next.
6. If asked, enter the estimated weight of the sample. Press Complete. A picture of your sample
will appear on the screen
7. Highlight your sample on screen by touching it. Press measure. An hourglass appears to
show your sample is being analyzed.
•
Starting and finishing time are displayed in the bottom right hand corner of the loader
screen. A standard sample will take about 8-9min to run.
•
If more than one sample needs to be run, you can repeat the above procedure for any
number of samples to analyze (up to 28).
8. You can abort the procedure at any time by highlighting your sample on the loader screen
and pressing abort on the screen.
9. The spectrum of your sample can be viewed as it is running by pressing graph.
XRF User Manual
4
10. Once the sample it returned to its original spot and “ok” is displayed, the results can be
viewed at the bottom of the screen. It takes about one and half to two minutes for results to
appear.
11. Press results and press last hour to refresh the screen. Touch the screen to highlight your
sample. The results appear at the bottom of the screen.
At this point you will have to “clean-up” your results because the default software has a
tendency to miss-assign lines to wrong elements or to assign escape peak or sum peaks as
real signals. The spectrum needs to be visually inspected and every line needs to be assigned
to a certain element. Only these lines should then be used in the re-evaluation. Leaving out
elements that exhibit X-ray lines that overlap with lines of actually present elements allows
these to be calculated with higher accuracy. You can do a quick re-evaluation via the Touch
Screen Interface (see chapter B) Re-evaluation of Data using the Touch Screen Interface). A
thorough and reliable re-evaluation should be done via the program Spectra EDX on the flat
screen computer to the left of the instrument (see section C) Re-evaluation of Data using
SpectraEDX).
XRF User Manual
5
B) Re-evaluation of Data using the Touch Screen Interface
1. For a quick and non-quantitative analysis you can make a re-evaluation of the data using the
touch screen interface. The X-ray facility staff HIGHLY recommends to use Spectra
EDX as described in section C) for sample evaluation! If you decide to use the touch
screen interface click results to make sure your sample is still highlighted or highlight it.
2. Click graph. You may need to refresh the screen by pressing
3. You can identify the peaks on the graph by touching the center of the peak on the screen (you
may have to zoom in on the peak first) and pressing
4. Select and/or unselect X-ray lines by pressing
, this will bring you to the periodic table
to select or deselect X-ray lines of elements.
5. Change or add elements:
The periodic table is composed of buttons. A red or orange button indicates that the X-ray
lines for this element are selected and a grey button indicates that they are deselected. The
spectra series K, L and M can be switched on or off for all elements. The Energy Information
area lists available lines and reports their energy in eV. Select the elements you are interested
in.
6. By highlighting the elements in the table, you can choose which elements you want to keep
or eliminate. This might be important as you might have additional information such as those
certain elements are for sure absent. By leaving these out all elements that exhibit X-ray lines
XRF User Manual
6
that are close to the ones unselected will be calculated with higher accuracy. After changing
elements, press the re-eval button to updated the spectrum. This may take a few minutes.
Press ok. An updated graph appears with only the elements you specified.
7. To print your results press print in the bottom-right hand corner of the screen.
.
WAIT UNTIL YOU HEAR THE CUTTING NOISE TO REMOVE THE PAPER! IF YOU
TEAR TOO EARLY THE MACHINE WILL JAM!!!!!!!
Summary of Graph Controls:
XRF User Manual
7
C) Re-evaluation of Data using SpectraEDX
1. Measure your sample using the touch screen interface
2. Switch over to the computer on the left (small flat screen). Open the program SpectraEDX.
(If the path is lost, e.g. after a restart, you can define it again by highlighting the instrument
and clicking connect)
3. Open the Evaluation option in SpectraEDX. Highlight the sample you want to analyze (you
can get older/expired data via the "advanced search" option)
4. If there are more than one entry for your file (e.g. after a reevaluation via the touch screen)
use the top entry (original data). (If you want to copy data to another drive use the windows
explorer. Go to X:\SPECPlus\Data Files\TempSSD. Use copy and paste, do not drag or
delete files)
5. Highlight the entry you want to analyze. Click "evaluation options" (right upper corner).
Select a calibration (e.g. elements.evm for a chunk of metal) and a preparation (e.g. solid or
mylar 3.6). Click "Apply & Close" to close the "evaluation options" window
6. Click the "Interactive Qualitative Mode" button (bottom of page). A new window opens.
Select the "Elements Toolbar" option
. A periodic system will pop up. Click on
individual elements to see their XRF lines. Decide if an element is present or not by
comparison of the spectrum with the XRF lines. Take into account that some lines might be
"escape" or "sum peaks", and that all lines of an element (K, L and M) have to be found in
the correct ratios for the element to be present. Continue until all lines are accounted for as
either an element peak or an escape or sum peak. Make a note for elements that might be
potentially hidden by e.g. an escape peak (For the later evaluation leave out palladium. The
machine has a palladium source and Pd lines will always be present whether Pd is in the
sample or not).
XRF User Manual
8
7. Write down all elements you wish to use for the analysis. When done you may want to print
out the spectrum including the XRF lines for your records (hard copy and/or pdf) and label
individual lines by element on the hard copy.
8. Click on the "alternative mode window" button
, then "Show All Elements"
. In the new window click on "initialize"
. Highlight elements you do not want to have included
in the analysis. Via a right mouse click select "set not present". After every change click
"initialize" again. When only the elements of interest are left over click on "compute
concentrations"
.
9. You may want to write down the RWP and the R/R0 value (bottom bar of window) after the
refinement is finished. Values for R/R0 should be below a value of 20 to be regarded as
"reliable".
10. Print the results for your records to pdf.
XRF User Manual
9
D) Data analysis pitfalls
Artifacts - escape peaks and sum peaks, peak overlaps, and excessive dead time are all
phenomena that an EDS user must be aware of. Modern analytical software used in processing
energy dispersive X-ray spectra can generally take them into account -- but such software is not
perfect. Also, many users will look at the raw spectra, where the software may or may not have
labeled the artifacts.
Escape peaks - there is a statistical probability that some of the X-rays, generated in the sample
and impacting the solid state detector (e.g., a SiLi device), will 'inadvertently' knock out Si Kshell electrons in the detector, reducing that X-ray's energy measured in the detector by the Si
absorption edge energy (1.84 KeV). Say you're looking at something will lots of Fe (Ka of 6.40
KeV); the Si-escape peak of Fe Ka will appear at 4.56 KeV. You see this escape peak only for
the major elements present.
Sum peaks - this phenomenon occurs where the count rates are moderate to high, when two Xrays impact the detector virtually instantaneously; the pulse created and measured is the sum of
the two X-ray energies. Say you have a sample with lots of Si (Ka of 1.74 KeV) and Al (Ka of
1.487); a peak at 3.23 KeV is the sum peak, not to be assumed to be a K peak (Ka of 3.31 KeV).