1
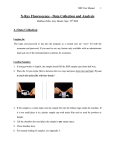
XRF User Manual
1
S2 Ranger XRF Manual
Matthias Zeller, Jerry Hunter, Sept. 19th 2008
Logging In:
The login and password to log into the program as a normal user are “ysu1” for both the
username and password. If you need to use any feature only available with an administrator login
ask one of the instrumentation scientists for assistance.
Loading Samples:
1. If using powders or liquids, the sample should fill the XRF sample cups about half way.
2. Place the 3.6 µm mylar film in between the two cups and press down fast and hard.
Try not to touch the mylar film with bare hands!
3. If the sample is a solid, make sure the sample fits into the 40mm rings inside the machine. If it
is too small place it in a plastic sample cup with mylar film such as used for powders or liquids.
4. Lift the chamber door and place the sample in any empty space.
5. Close chamber door.
XRF User Manual
2
6. For manual loading of samples, see Appendix 3.
Calibration:
1. It is important to calibrate the machine at the beginning of each day.
2. The screen on the XRF machine should be highlighted on Loader. If not highlight Loader.
3. To calibrate the machine select the space in which the copper disc is located (delete any
experiment defined for this position).
4. Under choose your application press recal.
5. Highlight copper disk calibration. Press Next
6. On the loader screen, highlight the copper disk space.
7. Press measure.
8. The hourglass shows calibration in progress in the bottom right-hand corner. It will take
about 8min for the calibration to complete.
9. While the calibration is running you can start setting up your sample(s). They will be queued
and once the calibration disk is returned to its original spot the next samples will be measured.
Sample Analysis:
1. Highlight the spot on the touch screen that corresponds to where you will put your sample.
XRF User Manual
3
2. Under Choose Application select which application you want to run. (the application you
choose will depend on your sample and what results you are looking for)
Description of Methods;
•
Elements Powder and Solid- used to find out what elements are present in the sample.
•
Fluoride Pellet/Powder- used to find what ratios of fluorides are contained in the sample.
Use ‘pellet” method if sample is in a pressed pellet, and powder if the sample is in
powder form.
•
Oxides Powders/Solid- used to find what ratios of oxides are contained in the sample.
Use “powder” if sample is in powder form and “solid” if sample is in solid form.
•
Water- used to find what elements are contained in a liquid sample.
•
More methods that are less often used are listed under Other
•
You are not limited to just these methods. Methods can be created and adjusted to
accommodate different types of analysis.
3. Enter the sample ID and press next.
4. Under Select the Preparation choose Mylar 3.6µ
µm for powders or, for solid samples, Solid,
SpectroBlend, or X-ray mix (this will depend on the type of solid. As a standard choose
“Solid.”)
5. Press complete and/or next.
6. If asked, enter the estimated weight of the sample. Press Complete. A picture of your sample
will appear on the screen
7. Highlight your sample on screen by touching it. Press measure. An hourglass appears to show
your sample is being analyzed.
•
Starting and finishing time are displayed in the bottom right hand corner of the loader
screen. A standard sample will take about 8-9min to run.
XRF User Manual
•
4
If more than one sample needs to be run, you can repeat the above procedure for any
number of samples to analyze (up to 28).
8. You can abort the procedure at any time by highlighting your sample on the loader screen and
pressing abort on the screen.
9. The spectrum of your sample can be viewed as it is running by pressing graph.
10. Once the sample it returned to its original spot and “ok” is displayed, the results can be
viewed at the bottom of the screen. It takes about one and half to two minutes for results to
appear.
11. Press results and press last hour to refresh the screen. Touch the screen to highlight your
sample. The results appear at the bottom of the screen.
•
At this point if you are satisfied with the results obtained you can proceed to print out
the results. The majority of the time, you may have to “clean-up” your results because
too many elements are present. If this is the case, proceed to appendix 1.
12. To print your results press print in the bottom-right hand corner of the screen.
WAIT UNTIL YOU HEAR THE CUTTING NOISE TO REMOVE THE PAPER! IF
YOU TEAR TOO EARLY THE PRINTER WILL JAM!!!!!!!
13. Press graph to see the x-ray lines of your sample.
•
To manipulate the graph see appendix 1.
14. The time your data is stored on the machine is limited. Write down your data in time or it
might be lost after a few weeks.
XRF User Manual
5
Appendix 1: Re-evaluation of Data using the Touch Screen Interface
1. The graph is easier to manipulate by using the computer located to the left of the instrument,
but the same procedure can be used if you wish to do so using the touch screen located on the
instrument itself.
2. If the screen of the S2 ranger is not already displayed on the computer to the left,
double click on the S2 Ranger Icon located on the desktop.
3. The S2 Ranger touch screen should appear on the screen.
4. Click results to make sure your sample is still highlighted. If not highlight it by clicking on it.
5. Click graph. You may need to refresh the screen by pressing
Graph Controls:
1. Clear and/or change X-ray lines by pressing
table to select or deselect X-ray lines of elements.
2. To change or add x-ray lines:
this will bring you to the periodic
XRF User Manual
6
The periodic table display is used to switch element markers on or off. An orange or red button
indicates that the X-ray lines for this element are switched on.
The periodic table is composed of buttons. A red or orange button indicates that the X-ray lines
for this element are switched on and a grey button indicates that they are switched off. Simply
select the elements you are interested in. The spectra series K, L and M can be switched on or off
for all elements. The Energy Information area lists available lines and reports their energy in eV.
3. By highlighting the elements in the table, you can choose which elements you want to keep or
eliminate. This might be important as you might have additional information such as those
certain elements are for sure absent. By leaving these out all elements that exhibit X-ray lines
that are close to the ones unselected will be calculated with higher accuracy. After changing
elements, press the re-eval button to updated the spectrum. This may take a few minutes. Press
ok. An updated graph appears with only the elements you specified.
4. To zoom in on a peak start by clicking and holding down at the top left corner of the peak and
drag down to the bottom left. The gray area will display the region to be zoomed.
XRF User Manual
7
5. Release and the graph will rescale.
6. This process can be repeated for any other peaks.
7. The graph can be rescaled at any time by pressing
8. You can identify the peaks on the graph by touching the center of the peak
on the screen (you may have to zoom in on the peak first) and pressing
9. To print your results press print in the bottom-right hand corner of the screen.
WAIT UNTIL YOU HEAR THE CUTTING NOISE TO REMOVE THE PAPER! IF
YOU TEAR TOO EARLY THE MACHINE WILL JAM!!!!!!!
XRF User Manual
Summary of Graph Controls:
8
XRF User Manual
9
Appendix 2: Re-evaluation of Data using SpectraEDX
Measure your sample using the touch screen interface
Switch over to the computer on the left (small flatscreen). Open the program SpectraEDX
(If the path is lost, e.g. after a restart, you can define it again by highlighting the instrument and
clicking connect)
Open the Evaluation option in SpectraEDX. Highlight the sample you want to analyze (you can
get older/expired data via the "advanced search" option)
If there are more than one entry for your file (e.g. after a reevaluation via the touch screen) use
the top entry (original data).
(If you want to copy data to another drive use the windows explorer. Go to X:\SPECPlus\Data
Files\TempSSD. Use copy and paste, do not drag or delete files)
Highlight the entry you want to analyze. Click "evaluation options" (right upper corner)
Select a calibration (e.g. elements.evm for a chunk of metal) and a preparation (e.g. solid or
mylar 3.6). Click "Apply & Close" to close the "evaluation options" window
Click the "Interactive Qualitative Mode" button (bottom of page). A new window opens. Select
the "Elements Toolbar" option
. A periodic system will pop up. Click on individual elements
to see their XRF lines. Decide if an element is present or not by comparison of the spectrum with
the XRF lines. Take into account that some lines might be "escape" or "sum peaks". Continue
until all lines are accounted for as much as possible. (For the later evaluation leave out
XRF User Manual
10
palladium. The machine has a palladium source and Pd lines will always be present whether Pd
is in the sample or not).
Write down all elements you wish to use for the analysis.
When done print out the spectrum with the XRF lines for your report (hard copy and pdf). On the
hard copy label the lines by element.
Click on the "alternative mode window" button
, then "Show All Elements"
. In the new window click on "initialize"
. Highlight elements you do not want to have included in
the analysis. Via a right mouse click select "set not present". After every change click "initialize"
again. When only the elements of interest are left over click on "compute concentrations"
.
Write down the RWP and the R/R0 value (bottom bar of window) after the refinement is
finished. Values for R/R0 should be below a value of 20 to be regarded as "reliable".
Print
the
results
for
your
report
to
pdf.
XRF User Manual
11
Appendix 3: Manual Loading of a Sample
1. To log off as current user and log in as administrator for manual loading. Contact Dr. Zeller.
2. Press tools
3. Press system tools.
4. In the far left spot to the right of execute type s-e-r-v-e-r.
5. Press execute and then config.
6. Uncheck the box that says this system has a sample handler. Press ok.
7. Wait for the computer to finish all its activities.
7.
When the machine is idle, highlight the loader on the screen on the XRF machine. The
loader should have changed from the sample changer mode to single sample mode.
8.
Log off as administrator and log on as a normal user. (login and password “ysu1”)
9. Highlight loader on the screen on the XRF machine, touch the large sample chamber icon to
open or close the sample changer.
10. After opening the sample chamber, lift the right-hand cover of the machine and carefully
insert by hand the sample. Touch the large sample chamber icon on the screen to close the
sample changer again.
11. Proceed as described in sample analysis.
XRF User Manual
12
12. To return to sample handler log on as administrator again. (the logoff button is located on the
loader page) Press tools, system tools in the far left spot to the right of execute type s-e-r-ve-r. Press execute and then config and recheck the box that you originally unchecked.
13. At this point you may need to restart the computer system for the machine. You can do this
by opening up the lower portion of the machine and pressing the white button to restart.
Make sure that the machine is idle before any restart and not measuring a sample, evaluating
data or reinitializing the instrument after switching back to sample changer mode. If
necessary wait for the machine to finish all its activities. After restarting, the machine may
need some time to warm back up (15-20min) is normal.