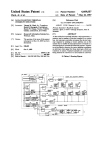
1
Signal-to-Noise Ratio Effects on the Quality of GPS Observations Sophie HETET Supervisor: Richard B. Langley August 30, 2000 Department of Geodesy and Geomatics PO BOX 4400 Fredericton, NB Canada E3B 5A3 Ecole Superieure des Geometres et Topographes 1, Boulevard Pythagore 72000 Le Mans France Table of Contents 1. Introduction 1. 2. 3. 4. 5. What is GPS? How does it work? GPS antenna GPS receiver performance Topic of my project work p2 p2 p2 p3 p3 2. Purpose of my study 1. SNR and its relationships to the uncertainty of GPS observations 2. The different effects on SNR 3. My study p4 p5 p6 3. Observations 1. NovAtel receiver 2. Antennas 3. NovAtel WINSAT software and NMEA interface p8 4. How to sort the data? p7 p7 p10 4. Analysis 1. 2. 3. 4. 5. SNR = 0 C/N0 = f (Time) Average (C/N0) = f (Azimuth) Average (C/N0) = f (Elevation angle) Study of different satellites in view p11 p11 p13 p14 p15 5. Conclusion p23 6. References p24 7. Appendix p25 1 1. Introduction 1. What is Global Positioning System? The Global Positioning system (GPS) is a space-based radio positioning and navigation system that provides 24 hour, all weather, world-wide coverage with position, velocity and timing information. It is composed of a space segment, a control segment and a user segment. The space segment is a constellation of 25 satellites divided in different blocks, specifically II-IIA and IIR (SV11, SV13 and SV20), whose identification is composed of numbers, Pseudo Random Noise (PRN) code and orbital position number. The control segment consists of a system of tracking stations located around the world and a master control station. Then, the user segment is composed of equipment that receives and tracks the satellite signals, such as the NovAtel receiver used in my work. 2. How does it work? The satellites in view broadcast 2 microwave signals at the L1 frequency (1575.42 MHz) and L2 frequency (1227.60 MHz). L1 provides the Standard Positioning Service. The L2 is used to measure the ionospheric delay by Precise Positioning Service equipped receiver (US Military). L1 and L2 carrier phases are modulated by 3 binary codes: The C/A (Coarse Acquisition) Code and the Navigation Message modulate the L1 carrier phase. The former code gives the civil SPS, whose accuracy used limited through the application of a process called Selective Availability and is no longer in effect now. The later describes the GPS satellite orbits, clock corrections and other system parameters. The P (Precise) Code modulates both L1 and L2 carrier phases and gives the PPS. It is encrypted to prevent use by unauthorised users. The encryption process is known as Anti-Spoofing. There are different sources of errors in GPS: noise and bias. Noise errors include receiver noises. Bias errors result from satellite clock errors, ephemeris data errors, tropospheric and ionospheric delays and multipath. 3. GPS antenna The GPS antenna receives the energy of the electromagnetic waves arriving from the satellites and has to convert it into an electric current that can be processed by the electronics of the receiver. The size and shape of the antenna are very significant characteristics as they control the antenna’s ability to pick up and pass on to the receiver the very weak signal provided by the satellites. 2 The gain pattern is also an important property of a GPS antenna. It describes its sensitivity over some range of elevation and azimuth angles and its ability to discriminate against some multipath signals. The GPS antennas are typically omnidirectional with a nondirectional pattern in azimuth and a directional pattern in elevation angle. NovAtel 501 antenna elevation gain pattern Generally, an antenna is combined with a low-noise preamplifier (LNA) that boosts the level of the signal before it is sent to the receiver. 4. GPS receiver performance The performance of a receiver is assessed by its ability to precisely measure the pseudorange and carrier phase, which depend on noise linked to the signals in the receiver’s tracking loops. The quality of the signal in the presence of noise is measured by the signal-tonoise ratio, SNR. The larger the ratio is, the stronger the signal is. 5. Topic of my project work My project was to study the variation of the signal-to-noise ratio of the GPS signals with satellite elevation angle and azimuth, and from satellite to satellite, for different antennas. 3 2. Purpose of my study 1. SNR and its relationships to the uncertainty of GPS observations. The level of GPS receiving equipment system noise determines in part how precisely pseudorange and carrier phases can be measured. It is measured by the signal-to-noise ratio, SNR, where S is the power of the received signal and N the noise power, at baseband, which means at the band occupied by the signal after demodulation. We also describe the signal level against the noise level the carrier-to-noise-density ratio, C/N0, which represents the SNR in a 1Hz-bandwidth. The effect of the noise is assessed by: • The code-tracking loop or delay loop DLL is given by: σDLL = λc α 2 BL + 1 c T × c n0 n0 where α is the dimensionless DLL discriminator correlator factor BL is the equivalent code loop noise bandwidth (Hz) c/n0 is the carrier-to-noise density C / N0 = 10 10 and is given by: c / n0 with C/N0 in dB/Hz T is the inverse of the predetection bandwidth λc is the wavelength of the PRN code (293.05m for C/A-code, 29.305m for P-code) • The carrier-tracking loop similarly to the code-tracking loop is given by: σPLL = λ 2π 1 BP + 1 c c 2T × n 0 n0 where BP is the carrier-loop bandwidth (Hz) λ is the wavelength of the carrier • These factors linked to the signal-to-noise ratio or carrier-to-noise density have effects on the weigh matrix [P] in the least squares method of data analysis and then on the uncertainty of the observations. 4 2. The different effects on SNR In radio-based communication and navigation systems, noise comes from various sources: the equipment and natural terrestrial and extraterrestrial sources. • Natural effects A GPS receiver’s antenna picks up a certain amount of noise in the form of naturally produced electromagnetic radiation. This radiation comes in part from the sky. The sky noise is composed of the effect of the random electromagnetic radiation emitted by the sun, the Milky Way and other discrete cosmic objects. It depends too on the earth’s atmospheric conditions: absorption and re-radiation of the GPS signals. The electromagnetic radiation is also due to the ground and objects in the environment of the receiver. The phenomenon of multipath explains losses and gains in the strength of the satellites’ signals. It is caused by reflecting surfaces near the receiver. Moreover, the antenna’s location can bring about a reduction in signal intensity, particularly if signals pass through structures like wooden-frame houses, automobile dashboard or window recesses of aircraft. It is worth pointing out others environmental factors such as temperature, moisture, salt, vibration and mechanical shock, which can effect the performance of a GPS antenna. These space losses change also with a varying distance between satellites and receiver. • Receiving system’s impacts Antenna’s effects The amount of noise power from a particular source intercepted by an antenna depends on the directions from which the electromagnetic waves arrive and the gain of the antenna in that direction. The sensitivity of an antenna is linked to its size, shape and location. So these characteristics have impact on noise power and also signal power. Receiver’s noise The receiver noise consists of cable losses and noise generated internally in the receiver. The signal travelling through a coaxial cable between the antenna and the receiver or the preamplifier is attenuated. That attenuation depends on the type and the length of the cable. Moreover, improper matching antenna and receiver connectors can generate more loss and delay. Furthermore, as the power to extract a GPS signal is concentrated in the receiver, noise is partly produced by the receiver. And, most of the time, a low-noise preamplifier 5 (LNA) is combined to the receiver or the antenna (active antennas) to increase the signal’s level. Its performance is given by its noise figure, typically about 1.2 to 2.5 dB. • Satellites’ effects The variation of C/N0 values depends on the satellite transmitter’s power output and differences in satellite and receiver antenna gain with elevation and azimuth angles. It is also due to losses engendered by the other satellites in view and the various blocks of satellites. 3. My study Therefore, the purpose of my project is to study SNR by comparing satellites’ evolutions, elevation and azimuth angles, and the different satellites. 6 3. Observations I collected NMEA data from the GPS NovAtel RT120 receiver using 4 different antennas, NovAtel 501, Tri-M Mighty Mouse, Tri-M Big Brother and Tri-M Mighty Mouse II, for periods of 24 hours using an observation interval of 30 seconds. I fixed the antennas, one at a time, on a tripod on the roof of Gillin Hall building at UNB-Fredericton near the cable tube, which enables connecting the antenna to the receiver in E110-GPS laboratory. I saved the observations by using WINSAT software and its converter and sorted the data by using EXCEL and macros developed in Visual Basic language. Remark: Previously, I planned to also test the Tri-M Skymaster antenna. Unfortunately, I didn’t manage to track any satellite with it. It is maybe a problem of connection in so far as, in comparison with the other Tri-M antennas, the cable is separate. It would be interesting to fix that problem but I couldn’t due to lack of time. 1. Receiver Novatel RT20, Model GPS-A035, CGS95110014, UNB 00844 The NovAtel GPSCard OEM series receiver is a multi-channel parallel tracking (12 channels), C/A code GPS receiver operating on the L1 (1575.42 MHz) frequency. Each dedicated channel independently tracks the code and carrier phase of a GPS satellite in view and can provide pseudorange accuracy within 10 cm. The NovAtel product is able to measure and output satellite code and carrier phase data at a rate of up to 20 times per second and can compute up to 10 position solutions per second. 2. Antennas Novatel • Active GPS Antenna, Model 501, CGA95060099 • • • Mighty Mouse, Model: SM25, S/N: 2503276 Big Brother, Model SM66, S/N: 6994330 Mighty Mouse II, D010370 Tri-M 7 Table of specifications (Sources: antennas user manual) Manufacturer NovAtel Tri-M Tri-M Tri-M Type 501 Mighty Mouse Big brother Mighty Mouse II Dimensions (mm) 114diameter x 58.6height 58x48x15 58x48x15 58x48x15 Mount 5/8" coarse thread magnetic magnetic magnetic Connecting TNC Universal FME to TNC Universal FME to TNC Universal FME to TNC Cable Independent RG174/U, Integrated RG174/U, Integrated RG174/U, Integrated Cable length (m) RG223/U Intercomp P/N 2-2232A 5 5 5 5 Operating temperature -45 C to +85 C -30C to +85 C -30C to +85 C -40C to +85 C Frequency (MHz) 1575.42 1575.42 1575.42 1575.42 5 5 5 -1 -1 >-1 >-1 Loss = 7dB Gain pattern(dB) el@90 el@15 >0 el@10 el@5 > -3 el@-30 <-10 Axial ratio <1 3 dB max 3 dB max 3 dB @ 90 Preamplifier Gain (dB) 23 26 30 28 Power 4.5V+/-0.5@22mA max 5V@12mA 5V@12mA 2.5~5.5V@5mA Noise figure (dB) 3.0, 3.6 max 1.5, 2.5 max 1.5, 2.5 max 1.6 Remark As the length of the cables is 5m, the location on the roof is very close to the tube to enable the connection to the receiver in the lab. 3. NovAtel WINSAT Software and NMEA Interface NMEA 0183 is a GPS receiver interface standard. It has been developed by the National Marine Electronics Association for interfacing marine electronic devices. The concept of the standard is talkers and listeners. For GPS observations, the talker is the GPS receiver and the listener is a computer that receives the data. The transmissions of the data use plain text with characters coded using 7-bit ASCII and are made in serial, which means bits are sent one at a time with one bit following the next. Moreover, the data are transmitted at a rate of 4 800 bits per second. Then, data are sent from a talker to a listener in the form of sentences with a maximum length of 82 characters. NovAtel WINSAT is a software that records, displays and interprets the data sentences. My study requests information about time, elevation angle, azimuth and signal-tonoise ratio. So I chose to log in GPGSV and GPZDA sentences in WINSAT software. 8 The GSV sentence provides the number of satellites in view and for each satellite its PRN number, elevation angle, azimuth, and carrier-to-noise density. And the ZDA sentence gives time and date of observation. GSV- Satellites in view $GPGSV Total number of message, 1 to 3 Message number, 1 to 9 Total number of satellites in view Satellite ID number Elevation angle, 0 to 90 deg Azimuth, 0 to 360 deg SNR (C/N0) 0 to 99 dB-Hz 2nd, 3rd, 4th SV *check sum ZDA- Time and date $GPZDA UTC Time Day Month Year Local zone hours Local zone minutes *checksum Settings Menu I have used a NovAtel OEM card. The configuration I used is: PC Port COM2 OEM Port COM1 Window Menu First, I have specified different functions in Command Control. unfix, to unfix the position ecutoff 0, to collect all the data for an elevation angle from 0 to 90 deg ¾ ¾ Then, I have made the configuration of the observations in Logging Control Edit logs : NMEA, then GPGSV and GPZDA Trigger : On time, period = 30.0 s Output : Save as a GPS-file (ASCII and binary mixed) Time : 24h of collecting Start log ¾ ¾ ¾ ¾ ¾ To check the good evolution of the testing, it is possible to observe the tracking of satellites in view by using Command Tracking Status, the good solution of the position of the antenna by reading Position and to note the recording by loading ASCII Records. Converter When the logging is finished, it is advised to use the converter linked to WINSAT to avoid the “junk” data and convert the selected file to ASCII Format logs, as the NMEA format logs are not clearly defined as ASCII or binary format. 9 4. How to sort the data? 1. How to sort by elevation angle and by azimuth • Open the file ‘.gps’ with EXCEL by using separations by comma and * and save it ‘ddmm-sv.xls’ • Insert a line of legend [ -, -, -, -, sat, elev, az, snr, sat, elev, az, snr, sat, elev, az, snr, sat, elev, az, snr] • Insert 2 columns before the columns called [sat] • Run the macro time() to insert time and day of observation and sort by columnA • Cut $GPZDA-lines and create a new file ‘ddmm-t.xls’ to paste these data • Make one column with $GPGSV-lines and delete the 4 first columns by running macro col() after having checked the number of lines • Sort by column [sat] and delete checksum • Create a new sheet sv0, run the macro sv0() to delete the SNR values equal to zero and sort by [sat] then by [date] then by [time] 2. How to sort the data by satellite • Create 3 files with a sheet by satellite: • Create 1 sheet for each satellite and 1 sheet “SNR” • Write the calculation of average of SNR and SNR without 0-values by AVERAGE (E:E) and AVERAGE (F:F) in columns G and H of all the sheets ”satellite” • Run macro sat() file‘ddmm-1.xls’ = satellites 1 to 10 file‘ddmm-2.xls’ = satellites 11 to 20 file‘ddmm-3.xls’ = satellites 21 to 31 and copy the data in each file in sheet11 “data” 3. Others macros • I developed others macros in EXCEL to sort the data to make the different plots below. • All the macros are listed in Appendix. 10 4. Analysis 1. SNR = 0 I plotted the averaged C/N0 values against elevation angle and azimuth, and these plots indicate some values equal to zero. I also checked my data’s files and the tracking of satellites by observing WINSAT processing. After having looked at the interface working, it seems that the SNR value equal to 0 correspond to a phase in the observations when the receiver is tracking a satellite but can’t lock that observation. Most of the time, it appears: • the first time the satellite is visible • when the elevation angle is about 5 degrees until 10 degrees • when the azimuth is between 170 and 210 degrees; indeed, that range is unusable due to signal blockage. Then, I decided to study the data after having deleted the SNR value equal to 0. 2. C/N0 = f (Time) These plots represent the raw values of 24h of observations against time for all the four sets of data, Tri-M Mighty Mouse II August 02-03, Tri-M Big Brother August 0304, Tri-M Mighty Mouse August 02-03 and Novatel August 08-09. I plotted time in x-axis, which unit is hhmmss, where h is hour, m minute and s second, and C/N0 in y-axis, which unit is dB-Hz. 11 Results. These plots show the range of the C/N0 values for these four days of observations. Novatel: Tri-M Mighty Mouse: Tri-M Big Brother: Tri-M Mighty Mouse II: 38 < C/N0 < 46 39 < C/N0 < 47 40 < C/N0 < 48 38 < C/N0 < 46 average = 42.47 43.16 43.79 42.47 Then, the antenna providing the strongest signal seems to be the Tri-M Big Brother as we could expect, given the higher gain of its preamplifier. 12 3. Average (C/N0) = f (Azimuth) I plotted the averaged SNR values against azimuth for the nine sets of observations I did. And the polar plot shows the elevation and azimuth of all the satellites in one day of observations. Legend N BB MM MMII NovAtel antenna Tri-M Big Brother antenna Tri-M Mighty Mouse antenna Tri-M Mighty Mouse 2 antenna X-axis Azimuth (degrees) Y-axis C/N0 (dB-Hz) Tri-M Big Brother August 03-04 ρ = f (Elevation angle, Azimuth) 13 Comments The first plot points out two drops in the northern and southern areas. The polar plot explains the bump in the North by representing the fact that there is no satellite in view in this area. The second drop at an azimuth around 180° can be accounted for by the location of the antenna on Gillin Hall roof. Indeed, the penthouse on the roof prevents tracking satellites from this area of the sky. 4. Average (C/N0) = f (elevation angle) • All the sets of data 50 48 46 44 n 0507 n 0607 mm 1907 bb 2407 mm2 2707 mm2 0208 bb 0308 mm 0408 n 0808 Average C/N0 42 40 38 36 34 32 90 84 87 78 81 72 75 66 69 60 63 54 57 48 51 42 45 36 39 30 33 24 27 18 21 9 12 15 6 3 0 30 Elevation angle Legend N BB MM MMII NovAtel antenna Tri-M Big Brother antenna Tri-M Mighty Mouse antenna Tri-M Mighty Mouse 2 antenna X-axis Elevation (degrees) Y-axis C/N0 (dB-Hz) I plotted Average (C/N0) = f (Elevation angle) for each set of data, 3 sets with the NovAtel antenna, and 2 sets with each Tri-m antennas. I calculated the average of C/N0 values for each elevation angle. General trend: This plot shows the trend of carrier-to-noise density against elevation angle. For low elevation angle below 50°, the carrier-to-noise density increases. It reaches its highest value at 50° and becomes stable. 14 Drops: All the curves are scattered. I guess that multipath effects can explain the bumps at the same elevation angles for each set of data. It is worth remarking that those drops are more significant at elevation angles below 50°. Comparison of the antennas: The Big Brother’s signal-to-noise ratio values are largely 2 or 3 units larger than the other antennas during the two days of observations. The Tri-M Mighty Mouse antenna gave better results August 02 and 03 than July 19 and 20. I wonder what can account for that irregularity. I checked my observations’ file and I pinpointed that I have less information the first day of data than the second one. In general, its results are better than Tri-M Mighty Mouse II and Novatel antennas. The Tri-M Mighty Mouse II and Novatel antennas are very close in performance. • Comparison between the block II-IIA satellites and block IIR satellites I plotted the averaged values of C/No (dB-Hz) against elevation angle (degrees) for the entire II-IIA block of the satellites and for each IIR satellites, SV11, SV13 and SV20, for 4 sets of observations: Tri-M Mighty Mouse 2 August 02-03, Tri-M Big Brother August 03-04, Tri-M Mighty Mouse August 04-05, and NovAtel 501 August 08-09. 15 Consequences It seems that there is no particular difference between the two blocks of satellites. It also depends on the antennas I used. The C/N0 values vary by 1 or 2 units. SV11 gives the most variable plot. SV13 and SV20 give better SNR values than the Block II-A. But, I can’t clearly define any general trend. Indeed, the Block II satellite is designed to provide reliable service over a 7.5 year life span. The satellite design requires minimal interaction with the ground and allows all but a few maintenance activities to be performed without interruption to the signal broadcast. Periodic uploads of data from the control segment cause no disruption to service. The improved Block II antenna provides slightly greater gain than the Block I antenna. The Block IIA satellites are essentially identical to the standard block II with one exception. In the event the ground stations are unable to upload new navigation information, the satellites will continue to transmit the same navigation message for up to 180 days. From a user standpoint, signals from the Block IIA, the orbit of the satellite will change over this period of time. Without periodic navigation updates from the ground, the accuracy of the system will degrade over time. However, the system would at least still be operational. The Block IIR satellites feature autonomous navigation. That is, they can create their own navigation messages without uploads from the ground. This allows the system to maintain system accuracy for much longer periods between contacts with the ground. Then, the Block IIR satellites are any different compared to the constellation of Block II-IIA satellites and perform at the same power levels. 16 5. Study of different satellites in view • Satellite in view SV31 These plots describe the elevation angle and azimuth against time, and C/N0 against time of the satellite in view SV31, for four 24 hours observations. fig1: X-axis = Time, 1 unit = 30s, Y-axis =Elevation and Azimuth, degrees fig2: X-axis = Time, 1 unit = 30s, Y-axis = C/N0, dB-Hz 17 Legend NovAtel Tri-M Mighty Mouse Tri-M Big Brother Tri-M Mighty Mouse II August 08-09, 2000 August 04-05, 2000 August 03-04, 2000 August 02-03, 2000 Results The plots show how the signal strength varies for a satellite with a high elevation angle. The expected consequences are obvious: the SNR value increase as the elevation is higher, and becomes constant as the satellite reaches a 50°-elevation angle. But, the second plot, C/N0 = f (Time), describes a drop when the elevation angle is the highest (50°). The third plot, a zoom at an elevation angle of 50°, confirms that drop. Concerning the azimuth, the angle value shift very quickly, it drops down from 180° to 60° in little time. It maybe can explain the bumpiness of C/N0 values. Remark There is a drop down of the elevation angle in the observations with Tri-M Big Brother August 03-04. I checked the EXCEL file and the ASCII file. I found the same drop. 18 • Satellite in view SV22 As previously, I plotted elevation angle and azimuth against time, and C/N0 against time for the satellite SV22. fig1: X-axis = Time, 1 unit = 30s, Y-axis =Elevation and Azimuth, degrees fig2: X-axis = Time, 1 unit = 30s, Y-axis = C/N0, dB-Hz 19 Legend NovAtel Tri-M Mighty Mouse Tri-M Big Brother Tri-M Mighty Mouse II August 08-09, 2000 August 04-05, 2000 August 03-04, 2000 August 02-03, 2000 Comments SV22 reaches a high elevation angle as SV31. These plots point out the same trend, increasing C/N0 values until a 50° elevation angle and then constant values, and the most significant the bump at the highest elevation angle and its relationship with the steep slope of the azimuth angle evolution. Remark We can observe a drop in the elevation angle and the azimuth in the data collected by Tri-M Big Brother August 03-04. I checked the different files, and that bump appears at the same time. The antenna was tracking 12 satellites, then 10, and then 11, which can perhaps explain that gap in the observations. 20 • Satellite in view SV20 As SV31 and SV22, I plotted elevation, azimuth and C/N0 against time for SV20, which is a satellite with a lower elevation angle. fig1: X-axis = Time, 1 unit = 30s, Y-axis =Elevation and Azimuth, degrees fig2: X-axis = Time, 1 unit = 30s, Y-axis = C/N0, dB-Hz 21 Legend NovAtel Tri-M Mighty Mouse Tri-M Big Brother Tri-M Mighty Mouse II August 08-09, 2000 August 04-05, 2000 August 03-04, 2000 August 02-03, 2000 Consequences As expected, that low elevation angle satellite gives worse C/N0 values than the two high elevation angle satellites. We can observe the same increasing and stable area in C/N0 area, and the bump at the highest elevation angle. Nevertheless, the slop is less steep than the other satellites. The usual gain pattern, as describes 2.3, can account for that drop. 22 5. Conclusion My study points out some of the factors which can affect C/N0 values, such as satellite antenna gain pattern, receiving antenna gain pattern, antenna preamplifier gain, multipath interference, and receiver noise. I also compared different antennas, NovAtel 501, Tri-M Mighty Mouse, Tri-M Mighty Mouse 2, and Tri-M Big Brother, which gave the best performance in terms of C/N0 values. To develop this project, and the knowledge of SNR effects on the quality of the GPS observations, I would compare C/No with elevation angle and azimuth for each satellite as I expect satellite transmitter power varies from satellite to satellite. Moreover, it would be interesting to identify the satellites with high multipath and remove their observations from the data to measure how strong is the multipath effect on C/N0 values. Then, it would be better to use another software to sort all the data. A file of 24 hours observations contains about 200 000 data. So the sorting process with EXCEL and macros developed in Visual Basic language is very slow and complex, and EXCEL is not useful to plot properly such a lot of data. MATLAB software would perhaps be more efficient. 23 6. References A Primer on GPS Antennas, by Richard B. Langley GPS World - INNOVATION, July 1998 GPS Receiver System Noise, by Richard B. Langley GPS World - INNOVATION, June 1997 GPS Theory and Practice, by B. Hofmann-Wellenhof, H.Lichtenegger, and J.Collins 4th edition, SpringerWienNewYork, 1997 NMEA 0183: A GPS Receiver Interface Standard, by Richard B. Langley GPS World - INNOVATION, July 1995 NMEA 0183 Standard For Interfacing Marine Electronics Association Version 2.30, March 1, 1998 Tracking Vehicles using GPS and Packet Radio, by Geoffroy de Montigny Geodetic Research Laboratory, UNB, August 14, 1999 Memorandum: GPS SNR Observations, by Paul Collins and Peter Stewart Geodetic Research Laboratory, UNB, July 21, 1999 Possible Weighting Schemes For GPS Carrier Phase Observations in the Presence of Multipath, by Paul Collins and Richard B. Langley, Geodetic Research Laboratory, UNB, March 1999 WINSAT, Graphical Interface Program, User Manual, NovAtel Communication Ltd GPSCard, Command Descriptions Manual, NovAtel communication Ltd GPSCard, OEM Series, Installation and Operating Manual, NovAtel communication Ltd Introduction to GPS Applications, by John T. Beadles http://www.redsword.com/gps A Comparison of four popular AMPLIFIED GPS ANTENNAS, by Joe Mehaffey http://joe.mehaffey.com/gpsantrev1.htm Test Results of some Low Cost GPS Antennas, by David Martindale http://www.gpscables.com/ant-test.htm http://home-2.worldonline.nl/~samsvl/anttest.htm http://home-2.worldonline.nl/~samsvl/anttable.htm http://home-2.worldonline.nl/~samsvl/mm2test.htm 24 7. Appendix: macro developed in Visual Basic 1. Macro time() to insert time and day of observations Sub time() Dim i As Integer Dim j As Integer ˝ For i = 1 To 11000 ˝ For j = 1 To 3 ˝ If Sheet1.Cells(i, 1) = "$GPZDA" Then ˝ If Sheet1.Cells(i + j, 1) = "$GPGSV" Then Sheet1.Cells(i + j, 5) = Sheet1.Cells(i, 2) Sheet1.Cells(i + j, 11) = Sheet1.Cells(i, 2) Sheet1.Cells(i + j, 17) = Sheet1.Cells(i, 2) Sheet1.Cells(i + j, 23) = Sheet1.Cells(i, 2) Sheet1.Cells(i + j, 6) = Sheet1.Cells(i, 3) Sheet1.Cells(i + j, 12) = Sheet1.Cells(i, 3) Sheet1.Cells(i + j, 18) = Sheet1.Cells(i, 3) Sheet1.Cells(i + j, 24) = Sheet1.Cells(i, 3) End If End If Next j Next i End Sub 2. Macro col() to sort the data and obtain one column of data Sub col() Dim i As Integer Dim j As Integer For i = 1 To 7960 For j = 1 To 6 Sheet1.Cells(i + 7960, j) = Sheet1.Cells(i, j + 6) Sheet1.Cells(i + 15920, j) = Sheet1.Cells(i, j + 12) Sheet1.Cells(i + 23880, j) = Sheet1.Cells(i, j + 18) Next j Next i End Sub 25 3. Macro elaz() to create 2 sheets by elevation angle and azimuth Sub elaz() Dim i As Integer For i = 1 To 28000 Sheet2.Cells(i, 1) = Sheet1.Cells(i, 4) Sheet2.Cells(i, 2) = Sheet1.Cells(i, 6) Sheet3.Cells(i, 1) = Sheet1.Cells(i, 5) Sheet3.Cells(i, 2) = Sheet1.Cells(i, 6) Next i End Sub 4. Macro sv0() to delete the SNR values equal to 0 Sub sv0() ˝ Dim i As Integer ˝ For i = 2 To 30000 ˝ If Sheet1.Cells(i, 6) <> 0 Then ˝ Sheet2.Cells(i, 1) = Sheet1.Cells(i, 1) ˝ Sheet2.Cells(i, 2) = Sheet1.Cells(i, 2) ˝ Sheet2.Cells(i, 3) = Sheet1.Cells(i, 3) Sheet2.Cells(i, 4) = Sheet1.Cells(i, 4) Sheet2.Cells(i, 5) = Sheet1.Cells(i, 5) Sheet2.Cells(i, 6) = Sheet1.Cells(i, 6) End If Next i ˝ End Sub 5. Macro sat() to sort the data by satellite Sub sat1() Dim i As Integer 26 For i = 1 To 10000 If Sheet11.Cells(i, 3) = "1" Then Sheet1.Cells(i, 1) = Sheet11.Cells(i, 1) Sheet1.Cells(i, 2) = Sheet11.Cells(i, 2) Sheet1.Cells(i, 3) = Sheet11.Cells(i, 4) Sheet1.Cells(i, 4) = Sheet11.Cells(i, 5) Sheet1.Cells(i, 5) = Sheet11.Cells(i, 6) End If If Sheet11.Cells(i, 3) = "2" Then Sheet2.Cells(i, 1) = Sheet11.Cells(i, 1) Sheet2.Cells(i, 2) = Sheet11.Cells(i, 2) Sheet2.Cells(i, 3) = Sheet11.Cells(i, 4) Sheet2.Cells(i, 4) = Sheet11.Cells(i, 5) Sheet2.Cells(i, 5) = Sheet11.Cells(i, 6) End If If Sheet11.Cells(i, 3) = "3" Then Sheet3.Cells(i, 1) = Sheet11.Cells(i, 1) Sheet3.Cells(i, 2) = Sheet11.Cells(i, 2) Sheet3.Cells(i, 3) = Sheet11.Cells(i, 4) Sheet3.Cells(i, 4) = Sheet11.Cells(i, 5) Sheet3.Cells(i, 5) = Sheet11.Cells(i, 6) End If If Sheet11.Cells(i, 3) = "4" Then Sheet4.Cells(i, 1) = Sheet11.Cells(i, 1) Sheet4.Cells(i, 2) = Sheet11.Cells(i, 2) Sheet4.Cells(i, 3) = Sheet11.Cells(i, 4) Sheet4.Cells(i, 4) = Sheet11.Cells(i, 5) Sheet4.Cells(i, 5) = Sheet11.Cells(i, 6) End If If Sheet11.Cells(i, 3) = "5" Then Sheet5.Cells(i, 1) = Sheet11.Cells(i, 1) Sheet5.Cells(i, 2) = Sheet11.Cells(i, 2) Sheet5.Cells(i, 3) = Sheet11.Cells(i, 4) Sheet5.Cells(i, 4) = Sheet11.Cells(i, 5) Sheet5.Cells(i, 5) = Sheet11.Cells(i, 6) End If If Sheet11.Cells(i, 3) = "6" Then Sheet6.Cells(i, 1) = Sheet11.Cells(i, 1) 27 Sheet6.Cells(i, 2) = Sheet11.Cells(i, 2) Sheet6.Cells(i, 3) = Sheet11.Cells(i, 4) Sheet6.Cells(i, 4) = Sheet11.Cells(i, 5) Sheet6.Cells(i, 5) = Sheet11.Cells(i, 6) End If If Sheet11.Cells(i, 3) = "7" Then Sheet7.Cells(i, 1) = Sheet11.Cells(i, 1) Sheet7.Cells(i, 2) = Sheet11.Cells(i, 2) Sheet7.Cells(i, 3) = Sheet11.Cells(i, 4) Sheet7.Cells(i, 4) = Sheet11.Cells(i, 5) Sheet7.Cells(i, 5) = Sheet11.Cells(i, 6) End If If Sheet11.Cells(i, 3) = "8" Then Sheet8.Cells(i, 1) = Sheet11.Cells(i, 1) Sheet8.Cells(i, 2) = Sheet11.Cells(i, 2) Sheet8.Cells(i, 3) = Sheet11.Cells(i, 4) Sheet8.Cells(i, 4) = Sheet11.Cells(i, 5) Sheet8.Cells(i, 5) = Sheet11.Cells(i, 6) End If If Sheet11.Cells(i, 3) = "9" Then Sheet9.Cells(i, 1) = Sheet11.Cells(i, 1) Sheet9.Cells(i, 2) = Sheet11.Cells(i, 2) Sheet9.Cells(i, 3) = Sheet11.Cells(i, 4) Sheet9.Cells(i, 4) = Sheet11.Cells(i, 5) Sheet9.Cells(i, 5) = Sheet11.Cells(i, 6) End If If Sheet11.Cells(i, 3) = "10" Then Sheet10.Cells(i, 1) = Sheet11.Cells(i, 1) Sheet10.Cells(i, 2) = Sheet11.Cells(i, 2) Sheet10.Cells(i, 3) = Sheet11.Cells(i, 4) Sheet10.Cells(i, 4) = Sheet11.Cells(i, 5) Sheet10.Cells(i, 5) = Sheet11.Cells(i, 6) End If Next i Dim j As Integer 28 For j = 1 To 10000 If Sheet1.Cells(j, 5) <> 0 Then Sheet1.Cells(j, 6) = Sheet1.Cells(j, 5) End If If Sheet2.Cells(j, 5) <> 0 Then Sheet2.Cells(j, 6) = Sheet2.Cells(j, 5) End If If Sheet3.Cells(j, 5) <> 0 Then Sheet3.Cells(j, 6) = Sheet3.Cells(j, 5) End If If Sheet4.Cells(j, 5) <> 0 Then Sheet4.Cells(j, 6) = Sheet4.Cells(j, 5) End If If Sheet5.Cells(j, 5) <> 0 Then Sheet5.Cells(j, 6) = Sheet5.Cells(j, 5) End If If Sheet6.Cells(j, 5) <> 0 Then Sheet6.Cells(j, 6) = Sheet6.Cells(j, 5) End If If Sheet7.Cells(j, 5) <> 0 Then Sheet7.Cells(j, 6) = Sheet7.Cells(j, 5) End If If Sheet8.Cells(j, 5) <> 0 Then Sheet8.Cells(j, 6) = Sheet8.Cells(j, 5) End If If Sheet9.Cells(j, 5) <> 0 Then Sheet9.Cells(j, 6) = Sheet9.Cells(j, 5) End If If Sheet10.Cells(j, 5) <> 0 Then Sheet10.Cells(j, 6) = Sheet10.Cells(j, 5) End If Next j Dim k As Integer For k = 1 To 2 Sheet12.Cells(1, k) = Sheet1.Cells(1, k + 6) Sheet12.Cells(2, k) = Sheet2.Cells(1, k + 6) Sheet12.Cells(3, k) = Sheet3.Cells(1, k + 6) Sheet12.Cells(4, k) = Sheet4.Cells(1, k + 6) Sheet12.Cells(5, k) = Sheet5.Cells(1, k + 6) 29 Sheet12.Cells(6, k) = Sheet6.Cells(1, k + 6) Sheet12.Cells(7, k) = Sheet7.Cells(1, k + 6) Sheet12.Cells(8, k) = Sheet8.Cells(1, k + 6) Sheet12.Cells(9, k) = Sheet9.Cells(1, k + 6) Sheet12.Cells(10, k) = Sheet10.Cells(1, k + 6) Next k End Sub 30