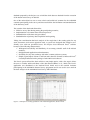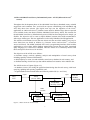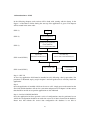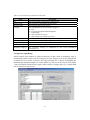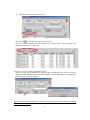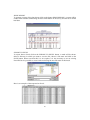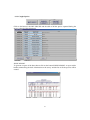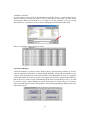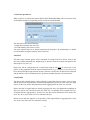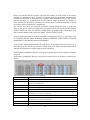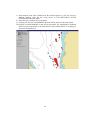
1
SCIENTIFIC COOPERATION TO SUPPORT RESPONSIBLE FISHERIES IN THE ADRIATIC SEA MiPAF Italian Ministry of Agriculture and Forestry Policies Food and Agriculture Organization of the United Nations AdriaMed GCP/RER/010/ITA AdriaMed Trawl Survey Information System (ATrIS): User Manual by Roberto Gramolini, Piero Mannini, Nicoletta Milone, Vincenzo Zeuli AdriaMed Technical Documents No.17 GCP/RER/010/ITA/TD-17 Termoli (Italy), May 2005 The conclusions and recommendations given in this and in other documents in the Scientific Cooperation to Support Responsible Fisheries in the Adriatic Sea Project series are those considered appropriate at the time of preparation. They may be modified in the light of further knowledge gained in subsequent stages of the Project. The designations employed and the presentation of material in this publication do not imply the expression of any opinion on the part of FAO or MiPAF concerning the legal status of any country, territory, city or area, or concerning the determination of its frontiers or boundaries. ii Preface The Regional Project “Scientific Cooperation to Support Responsible Fisheries in the Adriatic Sea” (AdriaMed) is executed by the Food and Agriculture Organization of the United Nations (FAO) and funded by the Italian Ministry of Agriculture and Forestry Policies (MiPAF). AdriaMed was conceived to contribute to the promotion of cooperative fishery management between the participating countries (Republics of Albania, Croatia, Italy, Serbia-Montenegro and Slovenia), in line with the Code of Conduct for Responsible Fisheries adopted by the UN-FAO. Particular attention is given to encouraging and sustaining a smooth process of international collaboration between the Adriatic Sea coastal countries in fishery management, planning and implementation. Consideration is also given to strengthening technical coordination between the national fishery research institutes and administrations, the fishery organizations and the other relevant stakeholders of the Adriatic countries. FAO-AdriaMed Project HQ Corso Umberto I, 30 86039 Termoli (CB), Italy Tel: ++39 0875 708252/708240 Fax: ++39 0875 720065 e-mail: [email protected] URL: http://www.faoadriamed.org iii GCP/RER/010/ITA Publications The AdriaMed Project publications are issued as a series of Technical Documents (GCP/RER/010/ITA/TD-00) and Occasional Papers (GCP/RER/010/ITA/OP-00) related to meetings and research organized by or conducted within the framework of the Project. Occasionally, relevant documents may be translated into national languages as AdriaMed Translations (GCP/RER/010/ITA/AT-00). Comments on this document would be welcomed and should be sent to the Project headquarters: FAO AdriaMed Corso Umberto I, 30 86039 Termoli (CB) Italy [email protected] For bibliographic purposes this document should be cited as follows: Gramolini, R. Mannini, P., Milone N. & Zeuli, V. 2005. AdriaMed Trawl Survey Information System (ATrIS): User Manual. FAO-MiPAF Scientific Cooperation to Support Responsible Fisheries in the Adriatic Sea. GCP/RER/010/ITA/TD-17. AdriaMed Technical Documents, 17: 141 pp. iv Preparation of this document The AdriaMed Trawl Survey Information System (ATrIS) is a computerized system, based on Microsoft Access© for organizing storing and undertaking the preliminary analysis of the dataset available after the AdriaMed trawl surveys. It was conceived and designed as a simple and common tool to store and perform basic processing of the data collected by the countries participating in the AdriaMed demersal trawl survey. The software has been designed and developed with the kind collaboration of the Laboratory of Marine Biology of Fano (Italy), the Institute of Oceanography and Fisheries of Split (Croatia), the Laboratory of Marine Biology of Bari (Italy), the Fisheries Research Institute of Ljubljana (Slovenia), the Institute of Marine Biology of Kotor (Montenegro) and the Fisheries Research Institute of Dürres (Albania). The scope of this manual is to provide users with guidelines on the various tools available to turn raw data into useful information. The following are summaries of the six chapters of this User's Manual: Chapter 1 contains the background information, Chapter 2 illustrates the System set up, and in Chapter 3 a general overview of ATrIS is given. Chapter 4 defines the data configuration rules and Chapter 5 explains the import/export routines. Chapter 6 illustrates how to input and retrieve data while Chapter 7 gives an overview of the analysis tools provided by the System. Finally in Chapter 8 some routines to check data consistency are illustrated. Acknowledgements Many thanks are due to Nedo Vrgo, Igor Isajlovi, Luca Ceriola and Bojan Mareta for their comments and information necessary to improve this application. Special thanks are also due to Nicola Ungaro a for his valuable advice which has led to the completion and the improvement of this product. The assistance of Caroline Bennett in the preparation of this document is gratefully acknowledged. Gramolini R., Mannini P., Milone N., Zeuli V. AdriaMed Trawl Survey Information System (ATrIS): User manual. AdriaMed Technical Documents. No.17. GCP/RER/010/ITA/TD-17, Termoli, 2005: 141 pp. ABSTRACT Through the FAO-AdriaMed Project the AdriaMed Trawl Survey Information System (ATrIS) has been developed as a simple and common tool to store and perform basic processing of the data collected by the countries participating in the AdriaMed demersal trawl survey. This document provides useful guidelines to ATrIS users. The objectives of the ATrIS are to facilitate storage, retrieval, updating, analysis and manipulation of trawl v surveys data including spatially referenced information; to build capacity to create, use and maintain a trawl survey database in each country; to facilitate sharing of trawl surveys data within and between countries in the Adriatic Sea. The ATrIS consists of 2 parts: i) a database (Access) for storing the spatial and monitoring data for each survey, with basic querying, updating and reporting capabilities. and ii) a spatial database that includes data stored directly within GIS (i.e. ArcView). Key concepts upon which ATrIS has been developed are regional management structure, database consistency management methods, capacity building for data analysis and GIS application and enhanced reporting capacity. vi Table of Contents Acknowledgements .............................................................................................................iv Table of Contents ................................................................................................................vi 1. Background information .................................................................................................1 1.1 AdriaMed Demersal Trawl Surveys.........................................................................1 1.2 Trawl Data..................................................................................................................2 1.3 The AdriaMed Trawl Survey Databank (Microsoft Excel© version) .....................5 1.4 The AdriaMed Trawl Survey Information System – ATrIS (Microsoft ACCESS© version) ...........................................................................................................7 1.5 Some key concepts of ATrIS .....................................................................................8 1.6 Introduction to ATrIS .............................................................................................10 2 SET UP and Installation of the Suite “AdriaMed Trawl Information System” (ATrIS)................................................................................................................................12 2.1 Stand Alone Installation ..........................................................................................12 2.2 Network Installation ................................................................................................12 2.2.1 PC Server Installation ......................................................................................13 2.2.1.1 PC Server Sharing Properties......................................................................16 2.2.2 PC Client installation........................................................................................17 2.2.2.1 Update the PC CLIENT ...............................................................................20 2.3 Activate the application...........................................................................................21 2.4 Set Up PC Client application ..................................................................................22 2.5 Update the data archive (Stand alone installation)...............................................25 2.6 How to change the screen resolution......................................................................26 3. The Application..............................................................................................................28 3.1 Data encoding ...........................................................................................................28 3.1.1 Haul data............................................................................................................28 3.1.2 Catch data..........................................................................................................29 3.1.3 Biological data ...................................................................................................29 3.2 Control panel............................................................................................................30 4. Data Configuration ........................................................................................................32 4.1 Survey Type Codes ..................................................................................................33 4.2 Survey Codes ............................................................................................................33 4.3 Unit Codes.................................................................................................................34 4.4 Unit-Survey Type .....................................................................................................34 4.5 Stratum Codes..........................................................................................................35 4.6 Vessel Codes .............................................................................................................36 4.7 Gear Codes ...............................................................................................................36 4.8 Species Category Codes...........................................................................................37 4.9 Species Codes............................................................................................................37 4.10 Species Length Range ............................................................................................38 4.11 Target species-Survey............................................................................................39 4.12 Maturity scale Codes .............................................................................................40 4.13 Maturity Scale-Species ..........................................................................................41 4.14 Maturity Scale Conversion ....................................................................................41 vii 4.15 Sea Condition Codes, Weather conditions Codes and Bottom Shape Codes ...42 4.16 Data management ..................................................................................................43 4.16.1 Password management (only for Administrators).......................................43 4.16.2 Print info about records update.....................................................................43 4.16.3 Enable species length validation rules...........................................................43 5. Import/export data.........................................................................................................45 5.1 Import data...............................................................................................................45 5.2 AdriaMed Databank format (Excel file)................................................................48 5.3 MEDITS format .......................................................................................................48 5.3.1 EXCEL format ..................................................................................................48 5.3.2 ASCII (text) format...........................................................................................49 5.4 Codification of errors messages..............................................................................51 5.4.1 General Errors ..................................................................................................51 5.4.2 Syntax Errors ....................................................................................................52 5.4.3 No Correspondence Errors ..............................................................................53 5.4.4 X Errors ............................................................................................................54 5.4.5 RED ERRORS ..................................................................................................55 5.5 Export........................................................................................................................56 6. Data Input and Retrieval...............................................................................................58 6.1 Survey features.........................................................................................................58 6.1.1. Map Hauls.........................................................................................................59 6.1.2 Survey Summary...............................................................................................59 6.1.3 Caught Species ..................................................................................................61 6.2 Generate Reports .....................................................................................................62 6.2.1 Haul Map Report ..............................................................................................63 6.2.2 Biological Data Report .....................................................................................63 6.2.3 Cover/Shoulder .................................................................................................63 6.3 Visualize data ...........................................................................................................65 6.3.1 Approve/disapprove a record ..........................................................................66 6.3.2 Delete a record...................................................................................................66 6.3.3 Add a new haul..................................................................................................66 6.3.4 Show hauls .........................................................................................................67 6.3.4.1 Map Haul Position .......................................................................................68 6.3.4.2 Survey...........................................................................................................70 6.3.4.3 Hauls ............................................................................................................70 6.3.4.4 Stratum .........................................................................................................71 6.3.4.5 Meteorological data.....................................................................................73 6.3.4.6 Biological data.............................................................................................73 6.4 New data entry .........................................................................................................78 6.4.1 Import/Export ...................................................................................................78 6.4.2 Add New Record ...............................................................................................78 6.4.3 Add New Record in a selected survey .............................................................79 6.4.3.1 Add biological data to a new record............................................................80 6.5 Data validation system.............................................................................................82 7. Data Analysis..................................................................................................................86 7.1 User defined strata scheme .....................................................................................87 viii 7.1.1 Use survey strata scheme..................................................................................87 7.1.2 Use strata aggregation scheme.........................................................................87 7.1.3 Use only hauls depth .........................................................................................89 7.1.4 Use GIS Tools to define strata .........................................................................91 7.2 Define species or category .......................................................................................95 7.2.1 Select a species...................................................................................................95 7.2.2 Select a category................................................................................................95 7.2.3 Select use species and category list ..................................................................96 7.2.4 Use list as one.....................................................................................................97 7.3 Selection parameters................................................................................................98 7.4 Use all data..............................................................................................................100 7.5 List of hauls ............................................................................................................101 7.6 Calculate Indexes ...................................................................................................102 7.6.1 Indexes Calculation.........................................................................................105 7.7 Multiplex Indexes Analysis ...................................................................................108 7. 8 Map of Indexes /Set Up Legend...........................................................................110 7.9 Some basic feature of ArcView.............................................................................111 7.9.1 Read a map: the legend ..................................................................................112 7.9.2 Useful buttons on ArcView ............................................................................112 7.9.3 Query by location (glasses).............................................................................113 7.9.4 Use GIS tool to define strata ..........................................................................113 7.9.5 Use GIS tool to Generate thematic maps......................................................113 7.9.6 Calculate the distribution area of a species ..................................................113 7.9.6.1 Generate Thiessen (Voronoi) polygons......................................................114 7.9.6.2 Generate Cells............................................................................................115 7.9.7 Print reports ....................................................................................................117 8 Consistency Control......................................................................................................119 8.1 Completeness ..........................................................................................................120 8.1.1 Verify Consistency Between Catch and Biological Data .............................120 8.1.2 Show Biological Data ......................................................................................121 8.2 Consistency .............................................................................................................121 8.2.1 Maturity Scales Check....................................................................................122 8.2.2 Length Frequency Distribution .....................................................................122 8.3 Congruence.............................................................................................................123 8.3.1 Hauls Length Validation ................................................................................123 8.3.2 Length Weight Relationship ..........................................................................125 8.3.3 Length /Sexual Maturity Relationships ........................................................126 8.4 Account management ............................................................................................127 9. References.....................................................................................................................128 Annex A --Report formats...............................................................................................129 Annex B - List of the Species code..................................................................................135 Annex C: Example of a sampling form used during the AdriaMed Trawl Survey...141 1. Background information 1.1 AdriaMed Demersal Trawl Surveys In the Adriatic, scientific bottom trawl surveys to monitor and assess demersal fishery resources have been carried out since the 1948-49 (Hvar Expedition). For the most part demersal survey sampling design could cover only national and international waters. Exceptions were the 1982-84 survey, jointly executed by Croatia and Italy in the Northern and Central Adriatic, and more recently, within the EU-funded MEDITS programme the whole Adriatic has been surveyed since 1996, with the exception of Montenegrin waters. Italy has been implementing demersal trawl surveys in national and international waters up to the territorial waters of the other coastal countries since 1985. A common approach is needed at regional level when the key demersal resources are straddling stocks across the boundaries between territorial seas and international waters where open access conditions apply. The consideration that the most important commercial stocks of the Adriatic are shared by the national fishing fleets makes it necessary their monitoring and assessment to be carried out over the whole Adriatic Sea. During the 2nd Coordination Committee Meeting held in Slovenia (Portorož, 22-23 November 2000, AdriaMed 2001, GCP/RER/010/ITA/TD-04 refers) the “AdriaMed Trawl Survey”, one of the proposed research activities, was regarded as being of prime interest; its aim was an eastward extension of the Italian demersal trawl survey to include Albanian, Croatian, Slovenian, and since 2004, Serbia and Montenegro waters. The major intentions were to collect, compile and process data following a common protocol prepared and agreed upon by all researchers involved; to carry out joint data elaboration and analysis and finally to make an appraisal of the status of demersal resources using stock assessment tools. The programme was adopted with the participation of the scientists from four countries: Albania, Croatia, Slovenia and Italy. The programme has several objectives and among the principal aims are: 1) to describe the zoogeographic distribution and pattern occurrence of target species encountered and where possible the relationship of such patterns to observed environmental features (sea depth, sediments, temperature); 2) to estimate relative abundance indices for target species in time and space and finally, where possible to perform stock assessment. Among the main tasks was the compilation of the index of relative biomass and abundance of shared commercial stocks and its geo-spatial variation within bathymetric strata as well as comparison between the two Geographical Sub-areas (GSA): northern and central (GSA 17) and southern (GSA 18) Adriatic Sea. At the same time research work included issues related to the biology and population dynamics of target species such as: possible effects of fishing pressure on resource biodiversity, information on target species spawning and nursery areas, biomass distribution, as well as species vulnerability to the fishing gear. 1 1.2 Trawl Data Three AdriaMed Trawl Surveys were performed in Autumn-Winter 2001/2002, 2002/2003 within international and national waters of Albania, Croatia and Slovenia and in Winter 2004 also comprising the territorial waters of Serbia-Montenegro. For the execution of the programme two vessels were used: chartered F/V “Pasquale e Cristina” in the southern Adriatic (GSA 18, Albania and Montenegro) and R/V “Andrea” in the central and northern Adriatic (GSA 17, Croatia and Slovenia). The number of surveyed stations in the AdriaMed 2001-2002 programme, due to the available budget, was increased in the year 2003 in the waters of Albania and Croatia and adjacent international waters. The increment in the number of stations was also the consequence of direct interests and financial support of national institutes. In the case of Albania, the number of stations was increased from 18 (2001-2002) to 31 in 2003, and in the case of Croatia from 22 (2001-2002) to 42 in 2003. The number of stations in Slovenian national waters remained constant at two stations. In Montenegro the sampling stations were 20. As example, sampling stations of AdriaMed trawl survey 2003 are given in Table 1 and Figure 1. The AdriaMed surveys were complementary to the Italian “Gruppo Nazionale Demersali” (GRU.N.D.) national survey programme in the western Adriatic. A list of 13 target species was identified taking into consideration the list of priority species whose stocks are shared in the Adriatic Sea as identified by the AdriaMed Working Group on Demersal Resources, and reported in Annex B, Table 5 of the Working Group report (AdriaMed, 2000; Group A). The AdriaMed surveys covered the trawlable area of the eastern Adriatic Sea, continental shelf and upper slope, from 10 to 400 m bottom depth. With regard to station selection and geographical allocation, random depth-stratified sampling design was applied, the same as is used in the case of the Mediterranean International Trawl Survey (MEDITS) Programme in the Adriatic (Anonymous, 1998). Strata were defined according to the following bathymetric limits: 10-50, 50-100, 100-200 m (GSA 17) and 200-800 m (GSA 18). The sampling procedures used are similar to and coherent with those of the Mediterranean International Trawl Survey (MEDITS) Programme (Anonymous, 1998; Bertrand, 1995, Bertrand et al., 1996). Catch in weight and number of target and non-target species was recorded and catch rates obtained. For target species biological data such as sex, gonad maturity and length-size composition were recorded. Sampling and sub-sampling procedures utilised “raising factors” in assessment of total numbers individuals caught per species. Data were entered into specially created sheets included as Annex C. The haul logbook held the following information: haul start and end positions and time, total catch weight, bottom depth at haul start and at haul end as well as length of trawl wire released into the sea. Standard haul duration was 60 minutes irrespective of the trawling depth (stratum). The Italian commercial bottom trawl net (“tartana”) used in the GRU.N.D. 2 programme was constantly utilised with standard auxiliary spare parts (bottom ropes, floating balls, knotless cod-end stretched mesh size was of 20 mm). Horizontal net opening, before surveys, was measured by “Scanmar”-Norway wireless transducers, in stratum of 50-100 meters. In this case the horizontal net opening was 24,2 meters and vertical opening around 1 meter. Table 1.1 - Coordinates of sampling stations in Albanian (A), Croatian (B) and Slovenian (C) waters and adjacent international waters during the ADRIAMED 2003 trawl survey. A – Albania STATION CODE COORDINATES BEGINNING OF HAUL END OF HAUL DEPTH (m) MN OE MN OE AATS0301 41°35.30’ 19°20.57’ 41°38.02’ 19°22.27’ 45 AATS0302 41°07.47’ 19°22.39’ 41°04.56’ 19°23.03’ 41 AATS0304 41°32.24’ 19°15.18’ 41°35.03’ 19°15.24’ 84 AATS0306 41°26.24’ 19°15.37’ 41°29.21’ 19°15.27’ 97 AATS0307 41°20.39’ 19°08.14’ 41°18.14’ 19°08.37’ 96 AATS0308 41°12.23’ 19°21.03’ 41°09.26’ 19°20.56’ 62 AATS0310 40°48.14’ 19°11.32’ 40°45.01’ 19°11.48’ 86 AATS0311 40°44.34’ 19° 11.04’ 40°42.20’ 19°10.44’ 89 AATS0312 40°51.38’ 19°11.55’ 40°48.47’ 19°11.21’ 89 AATS0313 40°55.18’ 19°12.05’ 40°52.17’ 19°12.20’ 90 AATS0314 41°26.57’ 19°07.04’ 41°24.08’ 19°06.47’ 118 AATS0315 41°23.20’ 19°07.22’ 41°20.55’ 19°08.12’ 111 AATS0316 40°52.53’ 19°09.22’ 40°50.04’ 19°09.32’ 104 AATS0317 40°42.27’ 19°09.33’ 40°39.18’ 19°09.27’ 119 AATS0319 40°38.30’ 19°09.40’ 40°35.17’ 19°11.70’ 140 AATS0321 40°39.11’ 19°07.58’ 40°41.54’ 19°06.14’ 168 AATS0322 40°36.17’ 19°08.60’ 40°39.06’ 19°07.56’ 174 AATS0323 40°34.48’ 19°11.02’ 40°31.45’ 19°11.58’ 148 AATS0325 41°07.00’ 18°52.08’ 41°08.35’ 18°52.47’ 292 AATS0326 41°02.32’ 18°53.47’ 41°05.05’ 18°52.28’ 284 AATS0327 40°43.58’ 18°59.26’ 40°46.22’ 18°58.29’ 328 AATS0328 40°34.53’ 19°05.32’ 40°37.55’ 19°04.53’ 309 AATS0330 40°31.23’ 19°06.06’ 40°34.17’ 19°05.40’ 310 AATS0331 40°28.12’ 19°08.33’ 40°30.52’ 19°08.00’ 295 AATS0332 40°55.11’ 18°48.48’ 40°57.24’ 18°47.08’ 534 AATS0333 40°51.50’ 18°50.46’ 40°54.11’ 18°49.53’ 534 AATS0335 40°48.01’ 18°54.05’ 40°50.16’ 18°52.02’ 502 AATS0336 40°40.02’ 18°59.54’ 40°42.05’ 18°58.32’ 545 AATS0338 40°36.21’ 19°00.22’ 40°39.01’ 19°00.11’ 526 AATS039 40°33.00’ 19°01.08’ 40°30.42’ 19°02.09’ 545 AATS040 40°29.53’ 19°03.08’ 40°27.39’ 19°04.40’ 537 3 B - Croatia STATION NUMBER COORDINATES BEGINNING OF HAUL END OF HAUL DEPTH (m) MN OE MN OE CATS0301 44°18.37' 14°58.85' 44°16.15' 14°57.57' 47.8 CATS0302 43°49.11' 15°26.70' 43°45.63' 15°28.41' 46.3 CATS0303 43°50.15' 15°10.02' 43°52.97’ 15°07.09' 52.1 CATS0304 43°59.76' 14°59.07' 44°01.73' 14°56.89' 60.6 CATS0305 44°24.66' 15°11.71' 44°27.17' 15°07.91' 60.8 CATS0306 44°31.48' 15°03.38' 44°32.96' 15°00.65' 76.7 CATS0307 44°37.35' 14°56.06' 44°39.59' 14°53.27' 200.5 CATS0308 44°47.10' 14°52.01' 44°49.32' 14°50.85' 186.0 CATS0309 44°55.40' 14°52.27' 44°57.01' 14°51.48' 169.5 CATS0310 45°04.69' 14°47.09' 45°06.94' 14°44.33' 128.5 CATS0311 45°10.32' 14°26.57' 45°06.87' 14°24.33' 81.7 CATS0312 44°04.36' 14°16.34' 45°01.36' 14°16.84' 110.0 CATS0313 44°48.89' 14°13.87' 44°46.06' 14°11.69' 141.5 CATS0314 44°42.42' 14°04.46' 44°41.20' 14°00.76' 140.5 CATS0315 44°26.61' 14°27.08' 44°24.55' 14°28.72' 118.5 CATS0316 44°15.76' 14°36.01' 44°13.72' 14°38.69' 111.5 CATS0317 44°11.66' 14°40.33' 44°10.10' 14°43.59' 119.5 CATS0318 44°33.55' 14°41.64' 44°36.98' 14°38.29' 132.0 CATS0319 43°33.09' 15°31.82' 43°31.37' 15°27.04' 139.5 CATS0320 43°30.80' 15°34.00' 43°31.65' 15°38.96' 152.5 CATS0321 43°29.92' 15°41.90' 43°27.58' 15°44.58' 160.0 CATS0322 43°26.15' 15°55.25' 43°25.54' 15°58.79' 156.0 CATS0323 43°16.26' 16°19.84' 43°16.06' 16°18.77' 76.5 CATS0324 42°57.55' 16°24.86' 42°56.77' 16°22.01' 83.8 CATS0325 42°49.72' 16°13.13' 42°50.63' 16°10.49' 53.8 CATS0326 42°52.11' 16°00.90' 42°53.55' 15°58.68' 32.0 CATS0327 43°07.07' 15°52.83' 43°08.67' 15°54.25' 24.1 CATS0328 43°09.70' 16°00.26' 43°10.27' 16°02.97' 33.9 CATS0329 42°47.20' 16°35.35' 42°45.72' 16°36.67' 72.3 CATS0330 42°40.43' 17°18.15' 42°39.72' 17°20.42' 47.8 CATS0331 42°38.81' 17°27.56' 42°38.79' 17°30.17' 46.3 CATS0332 42°37.21' 17°35.62' 42°36.54' 17°38.49' 52.1 CATS0333 42°35.08' 17°45.95' 42°34.66' 17°48.46' 60.6 CATS0334 42°33.72' 17°53.71' 42°33.54' 17°56.37' 60.8 CATS0335 42°47.65' 17°35.27' 42°47.91' 17°32.68' 76.7 CATS0336 42°49.40' 17°28.53' 42°50.02' 17°25.82' 200.5 CATS0337 43°04.01' 17°06.56' 43°04.70' 17°08.45' 186.0 CATS0338 43°01.29' 17°20.76' 43°00.26' 17°22.76' 169.5 4 CATS0339 42°54.79' 17°34.83' 42°56.04' 17°31.04' 128.5 CATS0340 43°03.23' 17°20.12' 43°04.62' 17°18.61' 81.7 CATS0341 43°23.01' 16°46.71' 43°23.18' 16°44.23' 110.0 C – Slovenia STATION NUMBER COORDINATES BEGINNING OF HAUL END OF HAUL DEPTH (m) MN OE MN OE SATS0301 45q36.29' 13q39.11’ 45q35.94' 13q36.52' 23.2 SATS0302 45q35.10' 13q34.14’ 45q34.11' 13q31.49' 23.6 Figure 1.1. Geographical allocations of the stations in the national and adjacent international waters of Albania, Croatia and Slovenia sampled during the AdriaMed 2003 bottom trawl survey. 1.3 The AdriaMed Trawl Survey Databank (Microsoft Excel© version) Since the AdriaMed trawl surveys were carried out, the need to have the large amount of collected data easily available for use was identified. The creation of a regional logical databank holding all the data collected by country and for the whole region was undertaken. The idea was to design a simple system to store the available data and which would facilitate basic analysis. The proposal was illustrated at the Fourth Meeting of the AdriaMed Coordination Committee held in Split, Croatia, December 2002 (AdriaMed, 2003). On that occasion it was agreed that it would be necessary and appropriate to finalize the logical 5 databank proposed by the Project so as to hold the whole data set obtained from the execution of the bottom trawl survey in 2001/02. One of the main objectives was to create a basic and useful tool common for the AdriaMed countries participating in the survey and that would allow the facilitation and standardisation of the data entry work. The creation of the data bank allowed for: x Effective survey data sharing among the participating countries; x Implementation of common data collection protocol; x Standardization of the data entry procedures; x Standardization of primary data compilation and reporting. Taking into consideration that basic analysis of the rough data is the starting point for any stock assessment and resource appraisal work, a system was designed that would be userfriendly even with non specialized users. The Project chose Microsoft Excel© software because of the following characteristics: 9 Widespread accessibility and familiarity of use among scientific staff of all Adriatic countries; 9 Straightforward application and maintenance; 9 Possibility for easy data exchange with other common software systems; 9 Simple export/import of data to and from other data file formats as Microsoft Excel© is usually distributed with a package of other Microsoft software. The Excel© system offered few basic utilities to run simple queries; with a few steps it allows the user to visualize tables and charts of the data filtered (Milone et al., 2004). The Excel© application was distributed to the National Focal Points and to the research institutes participating in the AdriaMed demersal survey programme and it was used to store and run the basic analysis of the AdriaMed Trawl Survey 2003/2004 data. Figure 1.2. Example of a working spreadsheet of the AdriaMed application, based on Excel©. 6 1.4 The AdriaMed Trawl Survey Information System – ATrIS (Microsoft Access© version) Throughout the development phase of the AdriaMed Trawl Survey Databank, many valuable suggestions and comments were received from experts collaborating with AdriaMed and were duly taken into account. The logical next step was the migration of the Excel© application on a Microsoft Access© platform, better suited to hold the large data set expected to be available in the near future (with the AdriaMed Trawl Survey 2004). The structure for the AdriaMed Trawl Survey Information System (ATrIS) has been designed to be simple, yet flexible. The objective was to create a simple database structure that could accommodate a wide range of data types. The new application is also easily linkable with GIS application. The software environment (Access) that was chosen was the one which makes it very easy to move data from one format to another (e.g. between Access and ArcView©, or between Access and Excel). The ODBC standards were used, a programming interface which enables applications to access data within database management systems that use SQL (structured query language) as a data access standard. This also allows it to seamlessly interact with tables and queries from Access in ArcView. The objectives of the ATrIS are as follows: -to facilitate storage, retrieval, updating, analysis and manipulation of trawl surveys data including spatially referenced information; -to build capacity to create, use and maintain a trawl survey database in each country; and -to facilitate sharing of trawl surveys data within and between countries in the Adriatic Sea. The ATrIS consists of 2 parts (Figure 1.3): --A database (Access) for storing the spatial and monitoring data for each survey, with basic querying, updating and reporting capabilities. and --A spatial database that includes data stored directly within GIS (i.e. ArcView). import XLS TXT export ATrIS (Access 2000) ATrIS MAP (ArcView 3.2a) ODBC standards DATA SETDATA 1 SET 2 DATA SET 3 SPATIAL DATA SETSPATIAL 1 DATA SET 2 SPATIAL DATA SET 3 Figure 1.3. Basic scheme of ATrIS structure. 7 EXCEL WORD ARCVIEW 1.5 Some key concepts of ATrIS Hereunder some key concepts upon which ATrIS has been developed are summarized. -- Regional management structure. It is vital that data access rules and procedures, and preferred data formats be developed or suggested by the countries rather than imposed by others. ATrIS was developed on request of the AdriaMed Adriatic experts and taking into a consideration the problems arising in data sharing, this led to the creation of a very flexible application. Moreover the active involvement by scientists in the improving and testing phase would gave a regional perspective to ATrIS. -- Database consistency management methods The general objectives of designing data entry functions are to establish consistency of data entry transactions, ensure compatibility of data entry with data display and provide flexibility of user control of data entry. Data validation is developed based on the data management/data validation plan and data specifications. They include several types of listings as well as queries. They cover, though are not limited to, the verification of out-of-range values and inconsistencies between data and protocol compliance checks. In ATrIS checking data consistency is done in three steps: i) Controlled data entry: a validation programme that verified field consistencies to identify records with errors (range checks, internal and external table look-up, rekey verification…) ii) Tracking of individual changes: automatic attribution of individual IDs, verification of household and individual IDs, using message boxes for warnings. iii) Illegal data checks: Illegal data are variable values or combinations of values that are literally impossible for the actual phenomenon of interest; ATrIS uses several filters to detect illegal data (e.g. keypunch errors; illegal data filter programs; detection of outliers in samples; and detection of outliers and leverage points in simple linear regression) The development and application of these methods of consistency management has great potential to improve the quantity and quality of data provided, also for decision support for management. -- Capacity building for data analysis and GIS application ATrIS provides basic querying, updating and reporting capabilities with the possibility to support a first basic data analysis based on GIS. The technical capacity to analyse data is built up providing two main analysis types: i) ii) Data analysis: a system of queries that allows the user to calculate biomass and abundance indexes, to chart length frequency distribution and maturity and sex distribution; GIS map creation: some basic GIS tools which provide the visualization of survey data. These tools represent an approach to developing meaningful, quantitatively 8 reliable and presentable thematic images. Moreover the final release of the trawl survey data bank application includes a digital chart (scale 1:250000) of the Adriatic Sea obtained through the cooperation of national hydrographical institutes. --Enhanced reporting capacity Database management systems are developed primarily for generating reports. A key function of ATrIS is the ability to generate tables and graphic reports of the selected data. Reports are available in a printer format and contain all fields and records that occur in the table or query that was used. The possibility to create a report gives the opportunity to: --give a general idea of the activities carried out during the survey --facilitate the data storing --facilitate data control --improve the daily activities of data research and recording --facilitate the organization of data. This automation can also be remarkable timesaving tool for users who are required to produce regular data reports and to review or plan a new survey. 9 1.6 Introduction to ATrIS In the following chapters each sections will be dealt with, starting with the Setup. In the Figure 3 a flowchart to follow during the start up of the application is given. The chapters will be treated in the same order. STEP 1) Set Up STEP 2) Open the application Configuring the application STEP 3) (codes definition) DATA CONFIGURATION Import data IMPORT/EXPORT DATA New data entry DATA INPUT AND RETRIEVAL STEP 4 and STEP 5) DATA ANALYSIS STEP 6 and STEP 7) CONSISTENCY CONTROL Step 1 --SET UP As for every application ATrIS must be installed on a PC following a Set Up procedure. The procedure is illustrated step by step in chapter 2 and will guide users to correctly install the application. Step 2 Once the application is installed ATrIS can be run on a PC: simply open on the menu bar the file ATrIS and the database will ask for a username and password. In chapter 2 all the actions that should be carried out to open the application are also indicated Step 3-- DATA CONFIGURATION Once the application has been opened a series of configurations must be performed to use ATrIS: the configuration should be run each time a new set of data is inserted in the database. Please note that without the correct data configuration the database is not able to 10 detect/analyze the data. The data configuration is given in chapter 4: all the necessary actions are illustrated guiding the users to setup the data codification system. Step 4 and 5 --IMPORT/EXPORT DATA-- DATA INPUT AND RETRIEVAL The next logical step, after the data configuration, is to insert data in the database: the import procedure or the simple data entry are both options contemplated in ATrIS. Chapter 5 and chapter 6 illustrate the import/export and the data retrieval. Step 6 –DATA ANALYSIS Once the data are in the database, data analysis can be performed. ATrIS provides some simple tools for the basic processing of data and some features for some GIS applications. Chapter 7 illustrates the basic data analysis tools provided by ATrIS. Step 7--CONSISTENCY CONTROL ATrIS has a powerful system of error control and checks of data consistency which help users to perform data control. Chapter 8 displays the checking data consistency tools. 11 2 SET UP and Installation of the Suite “AdriaMed Trawl Information System” (ATrIS) The package comes with the User Manual and a CD-ROM. The following minimum configuration is required: --Microsoft Access (version used to develop the Suite ATrIS), (the system has bee tested for Microsoft Windows 1998, 2000, XP, Xme but has not yet be tested on MSWindow 95) --Esri Software ARCVIEW ver.3.2x or higher**. --1024x768 high resolution monitor** The CDROM contains two folders with the two versions of the ATrIS application developed on Microsoft Access 1997 (97) and Microsoft Access 2000 (2000). For MSAccess 1997 use the ATrIS 97 version. For MSAccess 2000 or XP please use ATrIS 2000. The following procedures should be performed: 1) Open the CD-ROM 2) Open the folder you want to install (e.g. 97) 3) Install ATrIS Server (e.g. ATrIS_SERVER.exe) 4) Install ATrIS Client (e.g. ATrIS_CLIENT97.exe) 5) Launch ATrIS from the START Menu Bar 6) Set up the ATrIS Reference Files 7) Open ATrIS application 8) Insert User name and Password To install the system simply follows the indication in the following paragraphs. Please note that a different installation should be performed if a STAND ALONE or a NETWORK installation can be set up. 2.1 Stand Alone Installation If your PC is not part of a LAN, Local Area Network, you should install both the client and server side of the Suite ATrIS on your PC or, on each PC. See para 2.3 for Server Installation and 2.4 for Client Installation and 2.8 for updating of the data archive. or 2.2 Network Installation If your PC is part of a LAN you should perform a Network installation: in this case the installation of the server side of ATrIS is carried out just on one PC. The procedure for a network installation is the following: 12 a) Select a PC which will be considered the Server PC. On this PC install ATrIS_Server.exe (see para 2.3 for Server installation). b) On the other PC (the client PC) install only the Client side of ATRIS (ATrIS_Client.exe, see para 2.4 for Client Installation) c) On each PC Client in the SET UP (see para XX) link the Client to the Server (indicate the right path of the ATrIS_S.mde in the DATABANK field). d) On the PC Server (not on the PC client) activate the Sharing Property of the ATrIS Folder (see para 2.3.1) Install ATrIS Client side Install ATrIS Server side 2.2.1 PC Server Installation Double click on the file ATrIS_Server.exe: it will automatically install the file ATrIS_S.mde, the only component of the server side. This file contains the data consulted by the PC client. The procedures for the installation are as follows: 1) An introduction mask will introduce to the installation procedure. Click on NEXT 2) The Set UP procedures will automatically create a directory on C (C:\\ATRIS\Server). Please take note of the installation path: you should link the server PC to the Client PC/PCs (see para 2.7). Click on NEXT. 13 3) The following mask gives the copyright information. Please read it carefully before proceeding in the installation and click YES if you agreed to the above terms of agreement. 4) When the following mask is opened the default path of the destination folder will be displayed. Automatically the system will create the folder SERVER under the ATrIS Application (C:\\ATrIS\Server). To modify the path, click on Browse and select the new directory in which you would like to install the Server side. Please note that the installation path displayed in this mask is the same path that should be inserted during the SETUP to link the PC Server and the PC Client. WARNING. Do not use a name directory with space between words (e.g. do not put the ATrIS application under Program Files). If you like to create a new directory please use the underscore symbol (e.g. to create the “my software” directory write it as my_software). Click on NEXT 14 5) The SETUP application will then summarize the SETUP settings. Click on Install to begin the installation. 6) Click YES to start the installation. 7) Once the system files are all copied a mask will be shown. Click on FINISH. 15 2.2.1.1 PC Server Sharing Properties To define the sharing properties on the PC Server the procedures is as follows: 1) Click on the ATrIS Folder with the right button of the mouse. A window will open. 2) Click on SHARING 3) Select the Sharing folder and check the filed SHARE THIS FOLDER 4) Click on Apply and then on OK 16 2.2.2 PC Client installation On the CD-ROM double click on ATrIS_Client.exe file to start the installation. The procedure for the installation of ATrIS on PC client is the following: 1) An introduction mask will introduce to the installation procedure. Click on NEXT 2) The following mask gives the copyright information. Please read it carefully before proceeding in the installation and click YES if you agreed to the above terms of agreement. 3) When the following mask will be opened the default path of the destination folder will be displayed. Automatically the system will create the folder CLIENT under the ATrIS Application (C:\\ATrIS\CLIENT). 17 To modify the path, click on Browse and select the new directory in which you would like to install the Client side. Please note that the installation path displayed in this mask is the same as that which should be inserted during the SETUP to link the PC Server and the PC Client. 4) The Set Up will add an icon to the Program folder on the desktop BAR of your PC. The default name is ATrIS\Client. Click on NEXT. Please note that you may type a different folder name. 5) The SETUP application will then summarize the SETUP settings. Please check if the Space required is compatible (lower) with the Space available on the PC. Click on Install to begin the installation. 18 6) Click YES to start the installation. 7) Once the system files are all copied a mask will be shown. Click on FINISH. 19 Once the installation is completed the ATrIS icon will be displayed on the Menu Bar of your desktop. 2.2.2.1 Update the PC CLIENT Please note that if you are updating the PC Client (and the ATrIS directory is already on your PC) the following mask will be displayed. Click on Yes to continue the update procedures following the step 1-7 above illustrated. Please note also that since this operation is an update procedure you cannot change the installation directory. 1) Click on YES to update the system. The following mask will be shown: Click on SKIP to continue the update procedure. If you want to install the PC CLIENT version in a different folder: 1) Click NO to exit; 2) Open the CLIENT folder created during the installation C:\ATrIS\Client 3) Delete the folder C:\ATrIS\Client 20 4) Start a new ATrIS installation Please note that the update is possible only on the PC Client. An update on the PC Server will delete all the data added: for any problems with the PC Server configuration please contact the AdriaMed Project. 2.3 Activate the application When two or more versions of MS ACCESS are installed on a PC users can configure the ATrIS application in order to always launch it with the same MS Access version. The procedure is the following: 1) Click on the START BAR and select ATrIS 2) Select ATrIS CLIENT 3) Click with the right button of the mouse ATrIS CLIENT 4) Select Properties. In the Section SHORTCUT the field TARGET will show the PC CLIENT path (by default C:\\ATrIS\Client\ATrIS_C.mde) 21 5) Add to the PC CLIENT path C:\\ATrIS\Client\ATrIS_C.mde the path of the MS ACCESS version to be used. e.g. “C:\Program Files\Microsoft Office\Office\MSACCESS.EXE” C:\ATrIS\Client \ATrIS_C.mde Please note that quotes “” should be used to write the path in the correct way 6) Click on Apply than click on OK 2.4 Set Up PC Client application The first time you launch ATrIS the Set up of the Reference Files should be carried out. 1) Launch ATrIS 2) The following mask will be shown for few seconds 3) After few seconds a new mask will be displayed 4) Click on the magic wand button. A Setup Reference Files mask will be shown. 22 Please note that the system will automatically compile all the fields except for the last one (see point 4) 1) DATA BANK (SERVER): the system has already compiled this field correctly if a default configuration has been chosen. If you changed the Set up installation path please insert the new correct path by clicking on the BROWSE button. 2) APPLICATION (CLIENT): the system has already compiled this field correctly if a default configuration has been chosen. If you changed the Set up installation path please insert the new correct path by clicking on the BROWSE button. 3) GIS PROJECT: This part represents the graphic tool of ATrIS. During the installation a directory GIS will be created under C:\ATrIS\. If you changed the Set UP installation path please insert the new correct path by clicking on the BROWSE button. 4) ARCVIEW SOFTWARE: ATrIS contains some graphic features which can only be opened with ArcView software. The system will leave this field blank: if your PC has a registered version of ArcView please indicate the path of the executable file (ArcView.exe). Please note that to configure the system points 1 and 2 are needed and must be compiled. Points 3 and 4 are not needed for the correct functioning of the system. If you leave blank the GIS PROJECT and ARCVIEW SOFTWARE fields the system will work but the graphic tools will be not available. 5) Click on UPDATE to activate the new references 6) The following mask will be shown. Click on OK. Please note that if this mask will be not displayed an error has occurred. Check the path and try again. 23 7) Click on BACKUP to make a backup of the Server ATrIS containing all the data stored. 8) Click on CLOSE to go back to the USER LOG mask, insert the User name and password. A mask will be shown. You should register the application. Please note that you have just one month to use the application. If you click NO you will skip the registration If you click YES the following mask will appear: 24 Click on Cancel to work with ATrIS. To register the application kindly take note of the serial number, leave all the rest as in the picture, and communicate it to AdriaMed (by email or by telephone). You will receive a Registration Code: Insert the registration code in the relative field and click on REGISTER. 2.5 Update the data archive (Stand alone installation) If the installation carried out was a stand alone installation to update the archive two cases are to be considered. Case 1) Just one PC is qualified to update the archive Every time you update the archive (e.g. each time you open ATrIS and add/delete/modify data) you must update the ATrIS archive on the other PC on which you decided to install ATrIS. Use the EXPORT/procedure to extract the new inserted data (.txt or .xls). Afterwards import the data using the IMPORT/procedure on each other PC to update the other archive (see chapter 5 for import/export procedures). EXPORT IMPORT Case 2) two or more PC are qualified to update the archive Each PC must use the EXPORT/procedure to produce the file (.txt or .xls) containing the updated archive and use the IMPORT/procedure to insert the updated archive produced by the others PCs (see chapter 5 for import/export procedures). IMPORT/EXPORT IMPORT/EXPORT 25 IMPORT/EXPORT 2.6 How to change the screen resolution This software is developed for a screen resolution 1024 x 768. If your PC has a lower resolution please change it to display ATrIS correctly. To change or check the screen resolution the procedure is the following: 1) Right click on desktop and choose “Properties” from the MENU. 2) From the mask “Display Properties” choose the label Settings. Modify the section “Screen area” to the resolution to 1024 x 768 only if the settings of your PC are lower. 3) Now click on the button OK to confirm the choice: 26 4) Click on OK to confirm again the choice. 27 3. The Application 3.1 Data encoding The data are stored into three main tables: HAUL, CATCH and BIOLOGICAL DATA. Users are not allowed to see or manage these tables but in the procedure of import data or data entry the knowledge of the fields required by the system is essential to understand the application performance properly. Each table contains information on one survey. The table HAUL includes technical data on hauls carried out during that survey (such as geographical coordinates, duration and parameters required to estimate the area swept by the gear). In Table 3.1 details on specifications of the field used in the table HAUL are reported. Information on the catches recorded (in number and in weight) during the cruises is reported for each species in the table CATCH (Table 3.2). Finally records with frequencies grouped in length classes, for each species, or individual length and sex data are reported in the spreadsheet BIOLOGICAL DATA (Table 3.3). 3.1.1 Haul data Table 3.1. Fields in the structure record of the HAUL Data Table. Field Country Code Haul Code Vessel Code Gear Code Validity Date Time (00:00)B Latitude B Longitude B Depth (m)B Time (00:00)E Latitude E Longitude E Depth (m)E Stratum Code Note The name of the country participating. This number is a key field for accessing record in the database. Therefore each fishing station must have its unique station number. The haul code has a digit code indicating the number assigned to trawl station (e.g. 1,2,3…..n) The name of the vessel. The name of the gear used during the survey This field specifies if the haul is valid or not This field contains the date in European standard format in day/month/year sequence Time at the beginning of the trawl haul The Latitude at the beginning of the trawl haul, as degrees, minutes, and seconds in time format (indicate N or S, i.e. N41 13.41) The Longitude at the beginning of the trawl haul, as degrees, minutes, and seconds in time format (indicate E or W, i.e. E19 22.59) The bottom depth in metres at the beginning of the haul operation Time at the end of the trawl haul The Latitude at the end of the trawl haul, as degrees, minutes, and seconds in time format (indicate N or S, i.e. N41 13.41) The Longitude at the beginning of the trawl haul, as degrees, minutes, and seconds in time format (indicate E or W, i.e. E19 22.59) The bottom depth in metres at the end of the haul operation The code assigned to each stratum (i.e. for MEDITS survey the code is a five digit 28 Haul length Horizontal spread Vertical spread Sweep length Warp length Route Speed (knots) Bottom shape Weather conditions Sea conditions Wind direction Wind speed Note code assigned to each stratum “21101”). This field should be a text field. This field indicates the length of haul in metres The horizontal spread of the net mouth (meters) The vertical spread of the net mouth (meters) The length of the trawl sweep in centimetres The length of the trawl warp in centimetres The direction of the trawl operation in degrees The mean speed of the vessel during trawling in knots This is a three letter code indicating the bottom characteristics during the trawl operation Some notes on the weather conditions during the trawl operation Some notes on the sea conditions during the trawl operation The wind direction during trawling The wind speed during trawling Any comments 3.1.2 Catch data Table 3.2. Fields in the structure record of the CATCH Data Table. Field Country Code Haul Code Species code Total weight (Kg) Total number Raising factor Note The name of the country participating. This number is a key field for accessing record in the database. Therefore each fishing station must have its unique station number. The haul code has a digit code indicating the number assigned to trawl station (e.g. 1,2,3…..n) This is a 7 letter code to identify the species name following the MEDITS rules (i.e. Merluccius merluccius MERLMER) The weight of the species in kg on the total catch The number of the specimens caught The raising factor used 3.1.3 Biological data Table 3.3. Fields in the structure record of the BIOLOGICAL Data Table Field Country Code Haul Code Species code Total weight (Kg) Total number Length (mm) Note The name of the country participating. This number is a key field for accessing record in the database. Therefore each fishing station must have its unique station number. The haul code has a digit code indicating the number assigned to trawl station (e.g. 1,2,3…..n) This is a 7 letter code to identify the species name following the MEDITS rules (i.e. Merluccius merluccius MERLMER) The weight of the specimen/s in kg The number of the specimen/s caught The individual/grouped measurement of length in millimetres 29 Sex Maturity Maturity scale The sex of specimens caught The class of the maturity scale used The maturity scale used 3.2 Control panel Once the set up is completed the application will be opened in a “CONTROL PANEL” (Figure 3.1). It contains 5 labels which indicate 5 different panels of the application: Data input and retrieval Data analysis Import/export data Data Configuration Consistency Control The application will display by default the panel “Data input and retrieval”. Figure 3.1. Control panel. 30 On the top of the CONTROL PANEL three options are always available: --Quit ATrIS: it can be used to exit the application --Set Up Reference Files: it visualize the Set Up Reference Files Table set during the SET UP (already illustrated in Chapter 2.4, point 4) --About ATrIS: some information on the product. Please note that: --the button ESC on the keyboard can be used once to cancel the last action and twice to cancel the entire modification. --if click twice on a field it is possible (if applicable) to change it. 31 4. Data Configuration This section contains the general settings required to decode data (if applicable) and in the handling of data validation (see Chapter 5 Data Input and Retrieval and Chapter 8 Consistency control). The users can customize each code. The operation of configuration should be run each time new survey data, with characteristics not yet codified, is inserted in the database (see also Chapter 6 for the inclusion of data for a survey already in the database). Table 4.1 presents the settings that may be modified or added, and in the following paragraphs the configuration procedure for each code is illustrated. Table 4.1. List of the codes to be set. Survey Type Codes Survey Codes Unit Codes Unit-Survey Type Stratum Codes Vessel Codes Gear Codes Specie Category Codes Species Codes Species length range Target species-Survey Maturity scale Codes Maturity Scale-Species Maturity Scale Conversion Sea Condition Codes Weather conditions Codes Bottom Shape Codes 32 4.1 Survey Type Codes A mask with three fields appears. Add the name or the acronym of the survey and a brief description of it. An ID number is automatically assigned to each survey added. For example the AdriaMed trawl surveys is given the name AdriaMed and a definition which repeats the name of the survey. 4.2 Survey Codes This mask links the name of each survey to the type of survey. Add in the field survey name the complete name of the survey (e.g. AdriaMed 2001, AdriaMed 2002, etc.) and correlate a survey type to each survey name (i.e. AdriaMed 2001 is associated to the AdriaMed type of survey). Numerical ID will be automatically assigned to each survey name. 33 4.3 Unit Codes During a survey many institutions/countries (hereunder called “Unit”) may participate in the investigation. This mask allows the users to associate each Unit which took part to the survey to the survey type field. Insert the name or acronym of each unit, add a code (in the Unit code field) to identify each Unit, select a survey type (if available) with the scroll bar to be associated to the unit. If the scroll bar does not have the survey type to be associated with the unit code please check if the survey type codes you are looking for has been added in the survey type code field! 4.4 Unit-Survey Type This mask combines the units with the survey type. Select in the COUNTRY CODE field the country (UNIT) to associate with a survey (select the survey in the scroll bar). 34 4.5 Stratum Codes This mask allows the definition of the strata in a survey. The following fields should be completed. The stratum field is thus linked to the Unit field code. The AdriaMed trawl surveys strata were defined according to the following bathymetric limits: 10-50m, 50-100m, 100-200 m (GSA 17) and 200-500m and 500-800 m (GSA 18). Table 4.2. List of fields in the Stratum Code mask. Field ID Description Minimum depth Maximum depth Surface Unit Area Description Add a numerical ID to the stratum (i.e. if using MEDITS protocol the stratum between 10 and 50 m in the North Adriatic has the ID 21101) Add a description of the stratum The minimum depth in meters registered for that stratum The maximum depth in meters registered for that stratum The total surface (Km2) covered by the stratum Choose in the scroll bar the Unit associated to that stratum Add (if available) the zone in which the stratum is located 35 4.6 Vessel Codes This mask provides the vessel name and a three letter vessel code. 4.7 Gear Codes This mask records some technical details of the gear used in the trawl survey as follows. The horizontal and vertical spread are necessary to estimate the haul length (see Chapter 6, para 6.3.4.3 for the calculation of haul length). Table 4.3. List of fields in the Gear Code mask. Field ID Code Gear Code Gear name SW code Door Code Horizontal Spread Vertical Spread Survey Type Description The system assigns automatically a numerical ID Add a code to the gear (five letter or numeric code) Add the name of the gear Add a four letter code for the sweep type Add a four letter code for the door type The horizontal spread of the net mouth (meters) The vertical spread of the net mouth (meters) Choose in the scroll bar the survey type to be associated with the gear 36 4.8 Species Category Codes This mask contains the table with the description of each taxonomic code, as reported in the MEDITS protocol. The MEDITS codes for each taxonomic group are the following: A= Fish B = Crustacea (Decapoda and Stomatopoda) C = Cephalopods D = Other commercial species E = Other animal, non commercial species 4.9 Species Codes Users may customize a table of codes through this mask, using the MEDITS codes for the species name (Bertrand, 1995). The table of codes may be edited as required and new species can be added. A list of 648 scientific names is already registered in the database. Note that the scientific names in the table of codes are not validated by AdriaMed. It is the user’s responsibility to ensure that these names are correct. The coefficient a and b of the lengthweight relationship equation, although not a required input, are necessary to extrapolate length/weight if only weight/length data are available. 37 Table 4.4. List of fields in the scientific name Code mask. Field ID Species Code Scientific name Category a b Length Code Taxonomy category 1 Taxonomy category 2 Description The system assigns automatically a numerical ID The seven letter code MEDITS for the species The scientific name of each species The code MEDITS for each taxonomic group (i.e. A= Fish B = Crustacea (Decapoda and Stomatopoda) C = Cephalopods D = Other commercial species E = Other animal non commercial species) The coefficient a in the Length-weight relationship equation (W = aLb) The coefficient b in the Length-weight relationship equation (W = aLb) The MEDITS code for length interval The taxonomic category at phylum level (Vertebrata, Mollusca, etc.) The taxonomic category at subphylum or class level (Osteichthyes Gastropoda, etc) 4.10 Species Length Range ATrIS contains some features to control consistency of data: when an anomalous value is recorded the system is able to reveal it and gives an error message. One of the configuration on which the error control is based is the range of length for a species: determining the minimum and maximum length of a certain species (e.g. Merluccius merluccius, LEN. MIN. 1 mm, LEN.MAX 1500 mm) the system is able to detect a strange value (e.g. a length 2000 mm for Merluccius merluccius) 38 4.11 Target species-Survey In each survey a list of target species list is available. This mask allows users to add a target species using the scroll bar SPECIES: the list of all the species inserted in the database will be available. Pick up the species, which is to be considered target, in the SPECIES scroll bar and in the scroll bar SURVEY select the survey in which the species is target. This operation should be repeated for each target species. Another way to add target species for a new survey is the following. In the scroll bar SURVEY select a survey with the same (or very similar) target species list of the survey to be added. A button COPY will be activated. Click on the button COPY: the data will be automatically copied and the button PASTE will be activated. Select the new survey from the scroll bar and press the button PASTE. 39 Automatically the list of the target species of the old survey will be pasted and associated to the new survey. 4.12 Maturity scale Codes Users may define the maturity scale by completing this table (Table 4.5). In the field maturity scale code a five letter code should be added to identify the maturity scale used. Please note that when the same taxa have different maturity scale for each sex a maturity scale code should be added (i.e. for the family of Penaeideae the maturity scale MEDITS is available just for the females). Table 4.5. List of fields in the Maturity scale code mask. Field ID Description Maturity scale Code Number of classes Sex Description The system automatically assigns numerical ID Add a brief description of the maturity scale Add a five digit code to identify the maturity scale Indicate the number of classes allowed by the maturity scale chosen Indicate the sex for which the maturity scale is available Please note that if the Maturity scale Code inserted is not a five digit code the system will display the following error message. 40 4.13 Maturity Scale-Species This mask is strictly associated to the previous and allows to link each maturity scale to a species for and a survey. For each species for which a maturity scale is available, a survey should be associated. Another way to link a species to a maturity scale is the following (see also para 4.10). In the scroll bar SURVEY select a survey with the same (or very similar) species list/maturity scale of the survey to be added. A button COPY will be activated. Click on the button COPY: the data will be automatically copied and the button PASTE will be activated. Select the new survey from the scroll bar and press the button PASTE. Automatically the list of the species/maturity scale of the old survey will be pasted and associated to the new survey. 4.14 Maturity Scale Conversion This is the last mask related to the maturity scale. It allows users to convert the update or modify a maturity scale used for another scale. For example if the maturity scale applied to fish allowed three stages and a new fourth stage has been discovered, all the fish with stage 3 should be converted into 4 stage maturity. It is necessary to indicate in the table the maturity 41 scale to be converted, indicate one by one the maturity stage of the scale and indicate the new converted stage to be assigned. 4.15 Sea Condition Codes, Weather conditions Codes and Bottom Shape Codes These masks are related to the climatic and topographic conditions during the survey. Each table has the same structure: an ID automatically given, the description of the code, and the code to be assigned (preferably a four letter code). The users can customize or add new voices to these tables. 42 4.16 Data management On the right side of the panel there are three options to configure/manage data: --Password management --Print info about records update --Enable species length validation rules 4.16.1 Password management (only for Administrators) Only the administrator is allowed access to the data management is. To create an Administrator account please insert the prefix admin to the user field. The administrator may control/change the passwords of users. By clicking on the button PASSWORD MANAGEMENT a window will be opened. Insert the user name, the old password in the first field and the new password in the second field. The button on the bottom of the window will show the list of all the users allowed to access ATrIS. Users can not manage, then modify the passwords. The Administration account has some additional capabilities on data configuration and it can approve/disapprove a hauls (see Chapter 6, para 6.3). 4.16.2 Print info about records update ATrIS includes useful features to generate reports as illustrated in the following paragraphs. Users can define if a report should contains information on the management of records (the modifications, who made the modification, the date of the modification etc.) 4.16.3 Enable species length validation rules One of the data consistency controls is based on the species length range: if a range of length, minimum and maximum length, is defined for a species, it is easy to control if a single specimens has a length value outside the fixed range. This control is setup by default but 43 there could be the necessity to disable this option by click on the check on the DATA CONFIGURATION Panel. 44 5. Import/export data The system permits to import data from other databases or sets of data. The Import/Export panel allows the users for the exchange of data to/from AdriaMed Excel based database and MEDITS. The AdriaMed Databank format is based on Excel files while the MEDITS data are recorded as simple text files. 5.1 Import data Once the Set up has been carried out (see chapter 4), the records which have been downloaded on to a diskette or in a directory of your PC in a file may be imported on to the ATrIS System. Please note that the import procedures should be started only if Set-Up has been completed. Hereunder the procedures of import for the AdriaMed data or MEDITS data are illustrated. ATrIS recognize the AdriaMed databank format (.xls files) and MEDITS formats (.xls files and txt.files). The following six steps must be followed: 1. Choose the Survey Select using the scroll bar the corresponding survey to the data to be imported (field SURVEY) 2. Choose the type of data you want to import 45 Indicate in the field DATA TYPE using the scroll bar if the data to be imported are haul, catch or biological data. (see para 5.2 and 5.3) 3. Choose the species you want to limit the import procedure (if applicable) Using the scroll bar indicate one species in the field SPECIES to limit the data to import only to that species 4. Indicate the file name 5. Select the format type Click on the check for AdriaMed Databank format or MEDITS format. Both the Import/Export button procedures will be activated. 6. Select the file type (Excel file or Text file) 7. Follows the indication in para 5.2 if choosing AdriaMed Databank format or para 5.3 if choosing MEDITS format. 8. Click on CHECK for Errors. The system will start to check the data for errors. A series of messages will be displayed: the type of error and the location (row and/or column) will be indicated. If error/s occurs, please a) read the message, b) reopen the original file, c) check for the error the original file, d) remove the error/s, e) save the file and then 46 f) repeat the import procedure from step 1. The button visualizes the records to be imported. Once the control checking has been ultimate the system gives a green message and displays the records to be imported. 9. Import records by clicking on IMPORT button. All the records will be definitively imported and automatically they will no longer be displayed in the windows below; the button IMPORT will be deactivated. A message box will alert to the successful import. Please note that to import haul data, catch data, and biological data the import procedures should be run three times. 47 5.2 AdriaMed Databank format (Excel file) The AdriaMed Trawl Survey Databank has been used to store/analyse the data of the AdriaMed Trawl survey 2001 and 2003 (Milone et al., 2004). The Databank was an Excel based system. Therefore there would be the need to export from that system the data and import them to the ATrIS system. However it is essential that some of the parameters are changed to ensure that the AdriaMed Databank records are converted in a format compatible with the ATrIS application. Please note that to import the AdriaMed Databank format (Excel files only), the structure of a record should be modified using the following rules: 1. Open the AdriaMed Databank Excel file. 2. Rename the Excel spreadsheet into: AdriaMed format ATrIS format HAUL CATCH BIOLOGICAL Haul Catch Length distribution Be sure that the columns appear in the same order as reported in para 3.1.1 for the haul data, in para 3.1.2 for the catch data and in para 3.2.3 for the biological data. Please verify that the blank rows/columns below the records are truly unfilled: if the system reveals a formatting or a cell that is not clear during the import procedures the blank row/column will be counted and the system will display an error message indicating “Invalid Use of Null”. In this case delete all the blank rows/column. The file can now be imported to ATrIS. Follows the procedures already indicated in para 5.1. 5.3 MEDITS format ATrIS allows the import of the MEDITS data. The procedure for importing MEDITS records are similar to that described in para 5.2 for the AdriaMed Databank format. ATrIS detect two MEDITS formats: EXCEL format and ASCII format. 5.3.1 EXCEL format This option may be used when there is a need to import MEDITS data in an EXCEL format. Use the TA TB and TC files. The procedure then is as follows: 1. Open the TA, TB, TC.dbf files using Excel. Save the TA, TB, TC as Excel files (xls extension). 48 2. Rename the Excel spreadsheet into: MEDITS format TA TB TC ATrIS format HAUL CATCH BIOLOGICAL Please note that the field YEAR for the MEDITS procedure up to 1999 is a two digit number field. ATrIS uses a four digit code for the YEAR field. 3. Select the type of survey (SURVEY) and the type of data (DATA TYPE) to be imported. If the import procedure would be limited to one species please specify the species name using the scroll bar SPECIES. Please note that to import haul data, catch data and biological data the import procedures should be run three times. 4. Once steps 1 and 2 are completed indicate the source file and specify the format type (click on the check available, i.e. MEDITS format and Excel file). Both the Import/Export button procedures will be activated. 5. Click on CHECK FOR ERRORS and the system will start to check the data for errors. 6. Once all the errors have been removed (see para 5.2, point 5) and the import procedure is completed the system gives a green message. The list of the records to be imported will be shown. 7. Click on the IMPORT button. 5.3.2 ASCII (text) format The text MEDITS format import procedure is very simple as the ATrIS system recognizes the format as it is released from MEDITS. However some problems may occur, in this case see para 5.4 for the codification of error messages. 49 The import procedure is the same as illustrated in para 5.1 and it is reported below: 1. Select the type of survey (SURVEY) and the type of data (DATA TYPE) to be imported. If the import procedure is limited to one species please specify the species name using the scroll bar SPECIES. 2. Indicate the source file and specify the format type (click on the check available, i.e. MEDITS format and Text file). Both the Import/Export button procedures will be activated. 4. Click on CHECK FOR ERRORS and the system will start to check the data for errors. 5. Import data file. Please note that to import haul data, catch data and biological data the import procedures should be run three times. 50 5.4 Codification of errors messages This paragraph is intended to show the most frequent errors that could appear during the import procedures, it does not cover all the error types. Error messages are displayed when the information required to import/export data is incomplete. If an error occurs, please read the message, reopen the original file, check for the error, remove the error(s), save the file and then repeat the import procedure from step 1 (as described in Chapter 5, para 5.1). To facilitate the reading of the chapter the errors have been divided into five categories: -General errors -Syntax errors -No correspondence error -X errors -Red errors 5.4.1 General Errors A series of general messages could be displayed. When decoding the haul, a stratum should be allocated. If the message below is shown the code used could be not correct or missing: please control in the SET UP panel and in the original file. For example an incorrect stratum e.g. 21116 (10-50 m) has been associated to a haul carried out in a 62 m depth station, or the column stratum could be empty. If the data inserted in the original file do not follow the rules for the import procedures, a message could appear as shown below. For example the date is written in a different format (dd/mm/yy and not dd/mm/yyyy), or the latitude is given without the indication of the direction (N or E)..etc. 51 5.4.2 Syntax Errors If the error shown in the mask below appears, please control that the settings of your PC are International Settings. To control or modify the PC settings for the numbers follows the step: 1) Click on START of your PC and select Settings 2) Chose CONTROL PANEL 3) In CONTROL PANEL window select Regional Options In Regional Options select the mask Number and modify the Decimal Symbol in a dot (.) and Digit grouping symbol in a comma (,). 52 5.4.3 No Correspondence Errors This type of error occurs each time there is no correspondence in the SET UP configuration and the record included in the file. Some examples follow. For example if there is no correspondence between the stratum code and the depth an error message will appear (e.g. the mean depth is 160 and the MEDITS stratum associated in the file is 22144 (200-500 m) instead the value to be indicate should be 22143 (100-200 m). There could be no correspondence between the UNIT and the SURVEY TYPE. For example if a unit is recorded in both the AdriaMed survey type or MEDITS survey type attention should be paid to allocate the UNIT correctly: this could be the case of Albania, recorded in both the survey type. In the example below the error occurs in different rows but in the same column, the COUNTRY_CODE column. Probably during the Set Up the UNIT (COUNTRY_CODE column) has not been associated to a SURVEY. In the example below there is no correspondence between the sex indicated and the maturity scale used (e.g. a female Nephrops norvegicus with a maturity stage 4 will be not accepted if the maturity scale for female Penaeidae used is a three stage scale). In this case check if the value inserted is correct or control in the SET UP panel if the maturity scale used is correct. 53 5.4.4 X Errors If the number of column is lower than that indicated in Chapter 3, the following message will be shown. If an error occurs in a field, the system will indicate the column in which the error has been detected (in the example the Column GEAR CODE is not in a valid position). If a column is the a wrong position the error box will appear. When importing MEDITS format data in a .txt file the message below could appear: the MEDITS Protocol uses a two digit code (99) for the YEAR field however the ATrIS System needs a four digit number code (1999). If the spreadsheet has a different name from that indicated in the AdriaMed Databank Format the following error will be displayed (In the example the spreadsheet biological had another name). 54 5.4.5 RED ERRORS During the import procedure when a first control on the error has been carried out the system informs on the type of records it is going to import. Click on the button and the list of all the records to be imported will be shown. If the import procedure found repeated records the list of the double records will be displayed. When invalid hauls are listed the system will ask to verify the data before the completion of the import procedure. 55 5.5 Export The procedure for exporting ATrIS records to another system is similar to that described in the para 5.1 Import. 1. Choose the Survey Using the scroll bar select the survey corresponding to the data to be exported (field SURVEY) 2. Choose the type of data you want to export Using the scroll bar indicate in the field DATA TYPE if the data to be exported are haul, catch or biological data (see para 5.2 and 5.3). 3. Choose the species you want to limit the export procedure (if applicable) Using the scroll bar indicate one species in the field SPECIES to limit the data to export to that species 4. Select the format type Click on the check for AdriaMed Databank format or MEDITS format. Both the Import/Export button procedures will be activated. 5. Indicate the file name. It is possible to create a new file or use an existing one. Please note that when exporting data to an existing file, it will overwrite the file contents. The new file can be created directly: a) indicate the directory in which the new file should be created, b) give a new name to the file and then c) click on SAVE. The new file will be automatically generated. The new file will be shown in the FILE field of ATrIS. 56 6. Click on SHOW DATA TO EXPORT. The system will start to check the data for errors. Please note that the MEDITS format are exported using the same column names used by MEDITS protocol (in French). Some fields (like the diameter funes=diameter warp) are missing because they are not included in the ATrIS database. 7. Export records by clicking on EXPORT button. All the records will be finally exported and automatically they will be not displayed in the windows below; the button EXPORT will be disabled. A message box will alert you to the successful export. 57 6. Data Input and Retrieval The Data Input and Retrieval panel is opened by default each time the application is accessed. It visualizes the data included in the database (on the left hand side of the mask) and contains some useful features: -Survey features -Generate report -Visualize data (hauls). This section is also the starting point for a new data entry (see para 6.3). 6.1 Survey features This section contains three options: the possibility to map the hauls in the survey selected, the possibility to overview all data, hauls by hauls and the possibility to generate the list of all the species caught. 58 6.1.1. Map Hauls Click on the button MAP HAULS and all the hauls of the survey (or units) selected will be shown in a GIS Project. (see para 7.8 for the basic tools to view a map). 6.1.2 Survey Summary Click on the button SURVEY SUMMARY. A table with all the data displayed by survey, units and hauls will be shown. On the bottom of the table three buttons will allow the user to create a report (SHOW REPORT), to export to Excel the table (EXPORT To EXCEL) and to close the window (CLOSE). 59 SHOW REPORT To generate a report of the data chosen click on the button SHOW REPORT. A report will be created with a header summarizing the basic information on the survey and the list of all the haul data. EXPORT TO EXCEL To export data to Excel click on the EXPORT TO EXCEL button. A mask will be shown. Select a directory in which you want to save the file, choose a file name and click on the SAVE button. Please note that this is a save option, it is not necessary to use an existing Excel file but it is possible to create it when selecting the new file name in this mask. Here is an example of data exported on Excel. 60 6.1.3 Caught Species Click on the button CAUGHT SPECIES and the table of all the species captured during the survey selected will be displayed. SHOW REPORT To generate a report of the data chosen click on the button SHOW REPORT. A report with a header summarizing the basic information on the survey and the list of all the species will be created. 61 EXPORT TO EXCEL To export data to Excel click on the EXPORT TO EXCEL button. A mask will be shown. Select a directory in which you want to save the file, choose a file name and click on the SAVE button. Please note that this is a save option, it is not necessary to use an existing Excel file but it is possible to create it when selecting the new file name in this mask. Here is an example of data exported on Excel. 6.2 Generate Reports ATrIS has modules to generate reports. When a table is generated the possibility to create a report is represented generally by a button SHOW REPORT which will automatically create a report of the data selected. In the DATA INPUT AND RETRIEVAL there is a complete section dedicated to the report generation. The option in this panel is particular powerful as it allows the user to create a report summarizing all the data recorded during a survey. It could be useful to create a report annually to archive all the data of a certain survey or to create a report for administrative (ministerial) purposes. The following paragraphs illustrate the steps to generate a report. 62 6.2.1 Haul Map Report Click on this button and a report will be generated on all the haul recorded for the survey selected. The haul data are reported (start point and end point, gear, vessel, etc) and the list of the catches for that haul. The information on the person who performed the data entry or any modifications are shown in the report but they can be omitted (as illustrated in Chapter 4, para 4.16.2). 6.2.2 Biological Data Report In the same manner the report of all the biological data inserted for each haul of the selected survey can be generated. The report will show haul by haul, species by species (only the target species), all the biological data (length, weight, sex, maturity, maturity scale). As in the hauls data the information on the person who performed the data entry or any modifications are shown in the report but they can be omitted (as illustrated in Chapter 4, para 4.16.2). 6.2.3 Cover/Shoulder ATrIS provide this useful tool to complete the creation of a report. By clicking the COVER and SHOULDER buttons a cover and its corresponding shoulder for the report will be generated. The cover will show the ATrIS logo, the name of the survey selected and the 63 64 AdriaMed 2001 FAO-AdriaMed AdriaMed Trawl Information System (ATrIS) eventually selected unit. The shoulder will report the ATrIS acronym and the full name and the name of the survey selected. 6.3 Visualize data On the left hand side the mask SURVEY displays (if any) the surveys already in the database: automatically, by clicking on a survey the list of the Units reported for that survey will be displayed in the mask below (the UNIT mask). Figure 6.1. The Data Input and Retrieval section. Both the masks SURVEYS and UNITS display the data with a start and end date. To visualize the stations for each unit click on the HAULS mask: the list of all the hauls carried out will be shown. The mask HAULS automatically gives the number of hauls contained and, if selected, the number of the selected. The mask HAULS shows information on the date and time of each station and two more values: VAL (Validity) and APP (approved) with a Yes or No (Y/N) code. VAL (Validity) This field shows if the haul carried out is valid or not (i.e. the haul was carried out during the night and it is stored just for the archive but cannot be considered valid). APP (Approval) This field shows the approval status of the data. Each time new data are inserted in the database the Administrator should verify and approve the new data (see para 6.3.1). 65 6.3.1 Approve/disapprove a record To disapprove/approve a record, the button on the right side of the mask can be used. A message box will inform on the number of records to be approved/disapproved and the table will then display the changes. The Approval/Disapproval operation is only permitted to the ADMINISTRATOR account (see Chapter 4, para 4.16.1). 6.3.2 Delete a record To delete a haul or a selection of hauls, select with CTRL+ the hauls to be deleted and press the button indicated below. Two message boxes will appear. To delete the records press Yes in both messages. 6.3.3 Add a new haul To create a new record (haul) press the button indicated below and a new blank mask will appear. For more details see Chapter 6, para. 6.4.3. 66 6.3.4 Show hauls To visualize the data for the haul/hauls selected click on the button “SHOW HAULS”. A mask will appear with all the data. The mask contains information on: Survey, Hauls, Stratum, Meteorological data, Biological data. To visualize all the hauls recorded in the survey use the buttons on the bottom right side of the mask: 67 The button The buttons shows the first record. allow the user to scroll the hauls The button visualizes the last record. The buttons para 6.2.3). allows the user to add a new record (see the section on the new data entry, To close the sheet and come back to the list of hauls press the button CLOSE. The mask also visualizes information on the status of the record: A BY: Who approved the haul, H_ID: haul ID M BY: who made modifications, M ON: the date of the last modification (see also para 6.3.1 for the haul validation and/or modification). 6.3.4.1 Map Haul Position To visualize the haul position on a map click on the button MAP HAUL POSITION. ArcView will be opened and a window will be displayed with two options. SHOW OVERVIEW MAP Show overview map will show the position of the selected haul in the complete map with a red square. 68 HAUL POSITION (details) Haul Position (details) will show, by zooming, the exact position of the start point and the end point of the haul selected. 69 SHOW REPORT To generate a report click on the button SHOW REPORT. A report will be created for the selection. 6.3.4.2 Survey This part of the mask visualizes data on the survey. It contains the following fields (see also Chapter 3): SURVEY: the name of the survey COUNTRY: the name of the country/unit HAUL: the code of the station in that survey DATE: the date in which the haul was carried out VESSEL: the code of the vessel GEAR: the gear used in that survey VALID: a check to verify if the haul has been considered valid or not 6.3.4.3 Hauls This part of the mask contains technical information on the haul. 70 A two line series of boxes gives information on the time, LATITUDE, LONGITUDE and DEPTH for both the starting point and the end point of the haul. On the right hand side of the mask a green box visualizes data on the ROUTE (degrees), speed (Knots), DURATION of the haul (min), SWEEP LENGTH (m) and WARP LENGTH (m) of the gear used, and the BOTTOM SHAPE of that station. 6.3.4.4 Stratum This line of the mask contains data on the stratum in which the haul was carried out. A twofield box includes the STRATUM code and the description of it. These fields are read-only and they can not be changed when the haul is validated. Three boxes on the right contain information on HAUL LENGTH, and two technical information of the gear used: the HORIZONTAL SPREAD and the VERTICAL SPREAD of the gear. HAUL LENGTH/HORIZONTAL SPREAD/VERTICAL SPREAD ATrIS will automatically calculate the vertical and horizontal spread of the gear, if not available, by clicking on the buttons using the following algorithm: Gear Horizontal spread Vertical spread *L=warp length AdriaMed (GRUND) 13.13+0.00474*L 0.731-0.000067*L MEDITS 17.45613(1-e –0.33243 ((L/100)+ 3.60468)) 5.351(L –0.086) HAUL LENGTH Three different methods are available to estimate the HAUL LENGTH: -Start point and end point algorithm -Speed and duration -Use ArcView Click on HAUL LENGTH button to visualize the message box. Note that by clicking twice in the field HAUL LENGTH, it is possible to enter in the field and change/delete the contents of it (this is valid only if the haul is a not approved haul or during the data entry procedures). 71 -Start point and end point algorithm The HAUL LENGTH is estimated in units of nautical miles (nm) by (Sparre and Venema, 1998): D 60 * ( Lat1 Lat 2) 2 ( Lon1 Lon 2) 2 * cos 2 (0.5 * ( Lat1 Lat 2)) where Lat1 = latitude at start of haul (degrees) Lat2 = latitude at end of haul (degrees) Lon1 = longitude at start of haul (degrees) Lon2 = longitude at end of haul (degrees) -Speed and duration If exact positions are not available, but only the velocity of the vessel and the duration of the haul, then the distance covered per hour can be calculated from: D= V*t where V = velocity of vessel (knots = nm/hr) t = duration of the haul (min) -Use ArcView Another method to estimate the distance covered during the haul is to use the Projected coordinate system of ArcView. The system will project the start point and the end point in a X-Y plane. In a projected coordinate system, locations are identified by x, y coordinates on a grid, with the origin at the center of the grid. Each position has two values referencing it to that central location. One specifies its horizontal position and the other, its vertical position. The two values are called the x coordinate and y coordinate. In this case the x and y coordinates will be the start and end point. The system will then calculate the Euclid’s distance between the two points which will correspond to the length of the haul. If the haul length is already calculated and the user wishes to estimate, using another method, the following message will appear. Click Yes to calculate again the value or click No to leave the old value. 72 When the new value is calculated a message will ask to archive it. 6.3.4.5 Meteorological data On the right side of the mask four fields represent the meteorological information collected during the survey: Weather condition Sea condition Wind direction Wind speed (Kn) 6.3.4.6 Biological data This section of the mask summarizes the biological data of all the species caught during the survey. The fields appear in the following order: MEDITS Code: the MEDITS code used to identify the species Scientific name: the scientific name of the species W (kg): the total weight of the species caught during that haul Num: the total number of specimens caught RF: the conditional factor used (if available) for the catch BDRs: a filter to select only the target species (see below) Notes: shows the notes, if any. Then, in grey, three fields summarizing the status of the record: 73 Modified: the date and time of the modification MOD by: the name of the last person who modified the record Catch ID: the ID that the system automatically assigns to each catch record. To filter data by target species click on the button . The list will be limited to the target species. To go back to the list of all species, click again on the button BDRs. Another way to visualize the target species is to double click on the field BDRs. Double clicking on the field of each species an additional mask will be opened showing the single data for the selected species, for each specimen with data on the number, weight, length, sex and maturity scale associated. On the bottom of the mask the total number of specimens, total male, total female and total indiscriminate and total not classified are available. If individual data are not available the string reports a –1 value indicating that for that specimen the weight is not available. (This occurs mainly when length measurements on board are taken by length class). Three buttons on the top of the mask are displayed: USE INSERT DATA WIZARD, SHOW EXTRA INFO, DELETE EXTRA INFO. USE INSERT DATA WIZARD This tools facilitate users during data entry allowing the user to make a multiple input with individuals with the same characteristics (for more details see para 6.4.3.1). 74 SHOW EXTRA INFO The SHOW EXTRA INFO tool displays, if checked, additional information which can be available for a single individual (i.e. Standard Length (ST) or gonad weight). DELETE EXTRA INFO This tool allows the user to delete additional information previously added. To add a note double click on the mask, a pop up will be opened, Add the text and click on the button CLOSE. The text will be memorized and the record will show a check on the filed NOTES. To scroll all the records use the buttons of the bottom of the mask. To close this window and go back to the biological data list click on the button CLOSE or use the symbol X on the top of the window. When closing the window a warning message will appear if the number of record of biological data does not coincide with the number of specimens caught in the survey (i.e. 58 Merluccius merluccius caught in the haul 42, with biological data available just for 4 specimens). Click yes if it is really a problem of subsampling, click no if it is just an error in order to check the record again and if necessary modify it. 75 SHOW REPORT To generate a report of the biological data chosen click on the button SHOW REPORT. A report will be created with a header summarizing the basic information on the survey, the name of the species and the list of all the biological data, specimen by specimen, with, also, information on the record. To visualize all the reports use the buttons on the bottom of the page. To print the report/s click on the menu bar PRINT button , or on the menu FILE/PRINT or click with the right button of the mouse and select PRINT. 76 EXPORT TO EXCEL To export filtered data on Excel click on the button EXPORT TO EXCEL. A window will be opened asking the name of the file. Choose a file name and select the directory in which you want to put the file. Click on save and the data will be automatically exported on an EXCEL file. 77 6.4 New data entry When the set up is completed (see chapter 4) new records can be added to the database. The system provides three procedures to add new data: 1) Import/Export 2) Add New Record 3) Add New Record in a selected survey. Please note that by clicking the button ESC (escape) once on the top left side of the keyboard the field you are updating will be cleared. Double click on ESC will automatically delete all the record (=all the fields). 6.4.1 Import/Export The Import procedure allows the user to add new data, already on another databank or software, on the ATrIS system. See chapter 5 for a complete description of the method. 6.4.2 Add New Record To add a new record click on the NEW HAUL in the section Data Analysis and Retrieval and a new blank mask will appear. 78 Start to insert all the values needed. The data validation system will detect any error or mistake and will inform the user. For each field the warning/error message boxes are displayed in Chapter 5. 6.4.3 Add New Record in a selected survey There are two ways to add a new record when a survey is already selected. A) If a survey and the relative unit and haul is selected it is possible to add a new record by clicking on the button with the field already partially completed with the survey data (see para 6.2.2). For example if the survey AdriaMed 2004 is selected with the haul 12 of Albania, the new record will have the data relative to AdriaMed 2004 already in the mask and a successive haul number, 13. B) In a similar way it is possible to insert a new record when the data entry is already started. When the haul mask of a new haul is completed click on the button and a new mask with the same survey data will be opened. (see on the left side of the figure above). 79 6.4.3.1 Add biological data to a new record To add biological data in a new record double click on the scientific name of the selected species. The following mask will be displayed. Fill all the fields and be helped by the options for sex and maturity scale available. A specific tool is the INSERT DATA WIZARD. USE INSERT DATA WIZARD When click on the USE INSERT DATA WIZARD button the following mask will be displayed. This tool allow the user to insert biological data for a group of individuals having the same biological characteristics. Choose the SEX and then the maturity stage (MAT) and the related maturity scale. Select the length interval in which the individuals should be placed (minimum length (MIN.LEN) and the maximum length (MAX.LEN). 80 Please note that if a maturity scale value is missing the system will display the following warning message. Select a STEP: this number indicates the step of the length class is to be selected (e.g. if step is = 5, ATrIS will automatically generate length class 5 by 5 (10-15-20-25-30….). Modify the number of specimens if more than one individual is in a given length class. Then click on RUN WIZARD. The information selected will be showed indicating the total number of individuals added. At this point it is possible to load the data in the system by clicking on the LOAD DATA button. A warning message indicating that the number of specimens inserted has been changed will be displayed. 81 Please note that if the values inserted do not follow the rules indicated by the Administrator the following message can be shown. 6.5 Data validation system The data validation system comprises a controlled data entry system (which verifies field consistencies) and illegal data checks which filters values that are literally impossible for the actual phenomenon of interest. Hereunder a list, divided by topic, of typical warning or error message that could be displayed by ATrIS is given. HAUL LENGTH When calculating the haul length e series of error messages could be shown. If the Speed and Duration method is selected and the SPEED and/or DURATION fields are not completed the system will advise you. If the ArcView method is selected and the END POINT is not inserted the system can calculate it. Click YES if the end point has to be calculated by the system. Click NO to modify and insert the correct value in the field END POINT. 82 START POINT END POINT If the start point or the end point fields are not completed a series of error messages will appear. DEPTH If the depth field is not complete (e.g. the end depth is missing) the error message will inform the user. TIME If the fields related to the time are not completed the error message shown below will appear. STRATUM If a stratum not included in the setup, or a wrong value is inserted in the field, the error message below will inform the user (e.g. in the example below the start depth in 22 and the end depth is 23 so the stratum could not be the 50-100 m stratum). 83 BIOLOGICAL DATA Insert the data related to a single species one by one. WEIGHT If the weight is missing (or if no available the value –1 is not set) the error box shown below will be opened. LENGTH If the length is missing an Access error box will appear. Click on OK and add the length value. By default the field length is different from zero, therefore any time the length measure is equal to zero the error box will appear. To insert biological data related to a target species double click on the species name and the mask for the biological data will be opened. A series of controls are located in this section to help the error control. SEX If the sex is missing the error message will appear. 84 SEX/MATURITY SCALE If the sex does not match with the maturity scale chosen a error message will be displayed (e.g. if Indiscriminate is selected in the sex field a maturity scale cannot be stored). Please check that the maturity scale configured in the Set up Panel (see para 4) contains the stage you indicated. MATURITY SCALE If a wrong value in the maturity scale is inserted (e.g. higher than the maximum stage of the scale, on a scale 1-4 stage a value of 7) the error message below will be displayed. NUMBER If the number of specimens inserted is higher than that specified in the total catch the following warning message will appear asking to modify the number of specimen in the total catch or to delete the specimens. (e.g. in the total catch there are 12 Merluccius merluccius and in the biological data mask there are 13 specimens) 85 7. Data Analysis The Data Analysis panel allows users to run routines to analyze stored data. Using this panel the following analysis can be performed: Length Frequency distribution, Sex ratio, Length frequency/Maturity scale, Length frequency/Sex, Biomass/Abundance Indexes, CPUE. On the left side of the panel the SURVEYS, UNITS and STRATA are displayed. On the right side there are some tools to customize the queries and define the selection parameters. The following general step should be followed to perform the analysis of data. 1) 2) 3) 4) 5) 6) 7) 8) Select the Strata scheme (USER DEFINED STRATA SCHEME, see para 7.1). Select SURVEYS. Please note that a multiple choice can be performed. Select MONTH (if applicable) Select UNITS. Please note that a multiple choice can be performed. Select the STRATA stratum/strata (a multiple selection is possible). Select a species or category (if applicable, see para 7.2). Select parameters for the species or category (if applicable, see para 7.2.1). Click on the CALCULATE INDEXES/MAP INDEXES/MULTIPLE INDEX ANALYSIS buttons ( see para 7.5 and 7.6). For each section please refer to the paragraphs below. Please note that these examples are valid whichever to the strata scheme is used. 86 7.1 User defined strata scheme ATrIS was designed to store data from the AdriaMed Trawl Surveys. However the possibility to include data from other database or archives has been included. Thus the data analysis routine allows users to use the defined strata scheme applied during the surveys of AdriaMed or to use a user-defined scheme of aggregation. Hereunder the available options are listed and illustrated: -Use survey strata scheme -Use strata aggregation scheme -Use only hauls depth -Use GIS Tools to define strata 7.1.1 Use survey strata scheme With regard to station selection and geographical allocation, random depth-stratified sampling design was applied to the AdriaMed Trawl Survey, the same as is used in the case of the MEDITS programme in the Adriatic (Anonymous, 1998). Strata were defined according to the following bathymetric limits: 10-50 (GSA 17, GSA 18) 50-100 (GSA 17, GSA 18) 100-200 m (GSA 17, GSA 18) 200-500 m (GSA 18). 500-800 m (GSA 18). The USE SURVEY STRATA SCHEME allows performing data analysis on the strata defined during the surveys. The procedure is the same as that reported in para 7.5. 7.1.2 Use strata aggregation scheme ATrIS allows the user to choose the survey strata scheme as given by the AdriaMed Trawl survey protocol. The procedure permits the modification of the survey strata available and the aggregation of new strata indicating 1. Check on USE STRATA AGGREGATION SCHEME 2. Click on USE STRATA AGGREGATION SCHEME (the window STRATA AGGREGATION FORM will be opened). 87 3. Select the strata to aggregate (e.g. 10-50 m of different units) 4. Give a name to the new aggregated strata. If this step is skipped a warning message will appear. 5. Click on the right arrow. The strata selected will be automatically displayed in the right box AGGREGATED STRATA, disappearing from the left box. Details on the aggregated strata will be displayed at the bottom of the window showing the stratum, the stratum description, the depth range (minimum and maximum depth of the selected stratum) and the surface covered by the stratum. Please note that to change/delete strata already aggregated the aggregation should be dissolved. Select the strata to be disaggregated and click on the left arrow. The aggregated strata will disappear and the original strata will be displayed again in the SURVEY STRATA box. 88 Once the new aggregation scheme is configured the DATA ANALYSIS Panel will change: the UNITS box will be disabled (the UNITS are only related to the survey strata scheme) and the new strata scheme will be shown. The data can now be processed using the new strata aggregation scheme as described in para 7.5. 7.1.3 Use only hauls depth The third option to define a strata scheme allows the user to customize the strata by choosing the range of depth on which to focus the query. 1. Check on USE ONLY HAULS DEPTH 2. Click on USE ONLY HAULS DEPTH (the window USED DEFINED BATHYMETRIC STRATA will be opened). 89 Please note that the interval should be defined in a range which is different from the existing survey strata scheme (e.g. a new stratum between 10 and 50 m cannot be selected because it is already used by the survey strata scheme). An error message will be displayed. Once the new aggregation scheme is configured the DATA ANALYSIS Panel will change: the UNITS box will be disabled (the UNITS are only related to the survey strata scheme) and the new strata scheme will be shown. 90 When the new strata are defined the data can be processed using the new strata aggregation scheme as given in para 7.6. 7.1.4 Use GIS Tools to define strata This option is one very powerful feature of ATrIS which allows users to define strata with particular characteristics. The tools set up contains a sample theme map but the users knowledgeable in GIS can employ additional theme if they wish to work with the data more independently (for more details see para 7.9). Here is a guided example to use the theme provided by ATrIS. 1) Select a Survey (i.e. AdriaMed 2001) 7) Select a Country (i.e. Albania) Click on USE GIS TOOLS TO DEFINE STRATA button. A table will be displayed showing a strata defined by bottom sediment type. Minimum and maximum depth value and surface of the new strata may not be modified if this strata example is used. 91 8) Click on OPEN GIS FOR STRATA CALCULATION button. ATrIS will launch ArcView and the following map will be shown. 9) Click on the MENU bar on ATrIS and select the USE GIS to assign point to strata. 10) A table will be shown to select the theme to be used as “Strata theme”. Select theme3.shp and click OK. 92 11) A second table will be opened asking to select the “Stratum ID” field. Select stratum_id and click OK. 12) A third table will be shown. If available select the field in which the description data are stored. In this example select Description. 13) Now ATrIS will automatically calculate the new strata definition and will create a table with data on the new defined strata. In this example the table corresponds to the original showed in point 3 since no changes have been made. 93 14) Close the window and check the option button . The new defined strata will be shown in the STRATA mask. 15) Now that the new strata are defined the data can be processed using the new strata aggregation scheme as reported in para 7.6. 94 7.2 Define species or category The data can be filtered if just one species or category is to be analyzed. The scroll bar allows the user to select from the list of all the species that result from the choice made. With this option the user has four possibilities: i) Select just one species/category ii) Select all the species/category iii) Select a subsample of species/category (considering them as single species/category, the indexes are calculated species by species/category) iv) Select a subsample of species/category (considering them as a unique group, the indexes are calculated as a total of a group). 7.2.1 Select a species To select just on species choose a species name from the scroll bar. Please note that when a species is selected the button SELECTION PARAMETERS (see para 7.2.1) will be activated as well as the corresponding section in blue. Please note that to visualize data of all the species no species should be selected in the scroll bar. 7.2.2 Select a category The data can be filtered by category (see Chapter 4, para 4.8 for the category classification). Clicking on the check USE CATEGORY, the scroll bar will automatically display the category configured during the DATA CONFIGURATION (see para 4.8). 95 To select just one category choose from the scroll list bar. Please note that to visualize data of all the categories the USE CATEGORY should be checked and no categories should be selected in the scroll bar. 7.2.3 Select use species and category list ATrIS permits multiple choice for both the species and categories. If check the USE SP/CAT LIST options and click on the relative button the following mask will be displayed. It is possible to select those species on which the data analysis should be run by select the name and click on the ADD button. The selected species will be displayed in the SELECTED SPECIES field. To remove a species name, select the species in the SELECTED SPECIES field and click on the REMOVE button. The list can be further filtered by target species if click on SELECT TARGET SPECIES. The mask will only show the list of the target species defined during the data configuration (see para 4.11). If the USE CATEGORY check is on the USE SP/CAT LIST will display the list of category, and a multiple choice for category is possible. 96 7.2.4 Use list as one The USE LIST AS ONE option is just activated when a multiple choice has been selected (USE SP/CAT LIST checked). With this option the selection made in the USE SP/CAT LIST (see para 7.2.3) can be considered as a single group of species/categories and the information about the single species/category is missed. For example if the selection comprise two species, i.e. Merluccius merluccius and Mullus barbatus, the indexes will be calculated as a total indexes of both species as a single group. In this case the species will be displayed on the report as aggregated species (SP.AGG) and a box indicating the species which were selected for the aggregation will be included. 97 7.3 Selection parameters When a species is selected the button SELECTION PARAMETERS will be activated. Click on the button and the corresponding section will be activated/disabled. The data can be thus filtered defining: --Length interval and/or the class size; --Sex and maturity and/or the sex ratio. Two more options help user to define length interval using the L/W relationship or to define sex and maturity using the maturity scale conversion. LENGTH The data on the selected species can be redefined if a length interval is chosen. Insert in the two boxes (MIN and MAX) the length range in which to limit the analysis and perform the data analysis (see para 7.5). Please note that if a length interval is selected the analysis will only be carried out on the portion of the population with the selected characteristics (e.g. if Merluccius merluccius has been selected and the length interval chosen is between 10 and 100, the data will be analyzed and the indexes will be calculated just for specimens included between 10 and 100 mm). CLASS SIZE The data on the selected species can be limited to a particular class size (mm): select a range and the data will be automatically calculated and displayed on the basis of the class size range chosen. In this case all the data population will be aggregated in the class size selected. Please note that if original data are already aggregated in class size additional assemblage in class size may be only carried out if the new class size is a multiple of the original class (e.g. if original data are aggregated by 10 class size, the data can be allocated in new classes size of 10, 20, 30 etc. but a class size of 15 cannot be chosen). Moreover note that the opposite is not possible: if the original data are aggregated in a class size of 10 a new class size of 5 cannot be selected. 98 The LENGTH INTERVAL and the CLASS SIZE may be combined. Select both the parameters and the data will be calculated and displayed for the length interval and the class size chosen (e.g. if the length interval selected is 10-100 mm and the class size is 10, the data on Merluccius merluccius will be limited to the 10-100 portion of the population and will be shown in class size of 10 mm). Please note that if length interval and/or class size are selected ,a length frequency analysis will be carried out. USE LENGTH/WEIGHT RELATIONSHIPS This option is activated only if a length interval is selected. When only length data are available, ATrIS will automatically estimate weight data, using the Length/Weight Relationships W=a Lb The parameters a and b are those inserted during the data configuration (see Chapter 4, para 4.9). Hereunder there are two examples. The first example shows the biomass indices (kg/km2) plotted using the GIS tools: the data are not available and are displayed with the symbol X on the map. The second map has been generated using the LENGTH/WEIGHT RELATIONSHIPS option. The data are estimated and displayed on the map. 99 SEX, MATURITY SCALE, SEX RATIO The data can be displayed by sex (see Chapter 4, para 4.12 for the definition of sex class). Select the sex to limit the analysis and eventually the maturity scale stage (see Chapter 4, for the definition of the maturity scale). The data can be displayed by sex ratio. Please note that if a sex is selected and the sex ratio is chosen the system will only display data referred to the selected sex and not the sex ratio. USE MATURITY SCALE CONVERSION RULES This option is activated when a sex and a maturity scale are selected. If the data were processed using a different maturity scale this option allows the use of conversion rules determined during the DATA CONFIGURATION. The indexes will be thus calculated using the new maturity scale. 7.4 Use all data This check allows the use of all the data of the surveys selected. It can be applied when two or more surveys are chosen. An example will clarify the use of this option. Choose a survey A and then a survey B. The survey A has two units (a, b) and the survey B has the same units a and b and a third one, c: only the common units will be displayed in the window UNITS and used for the data analysis performance. To perform a data analysis using all the data please check the USE ALL DATA and all the units will be used (a, b and c). Please note that when the option USE ALL DATA is active the button CALCULATE INDEXES will be disabled. Use the button MAP INDEXES to estimate and visualize the data analysis. 100 7.5 List of hauls This option allows the user to calculate indexes for each haul present in the survey/units/stratum selected. 101 7.6 Calculate Indexes The button CALCULATE INDEXES starts the calculation of the abundance/biomass indices and CPUE. When click on the CALCULATE INDEXES button a window will be opened. In the upper part of the window a summary of the selection made is reported. On the left hand side the Survey, Unit and Strata selected are given. On the right hand side the information on number and weight data are shown. For both the data the hauls available (HAULS AVAIL.), the number of hauls used (TOT NUM) for the estimation and the total surface (TOT. SURFACE (km2)) are given. 102 Please note that the HAULS AVAIL represents the number of all the hauls in the stratum selected (5 in the stratum 21116: 10-50m). TOT NUM represents the number of hauls used to perform the estimation of the indexes. For example in the AdriaMed surveys, only number data are available (e.g. weight data are not recorded for single specimens): the number of hauls available for the indexes calculated on a number bases is different from that on which the indexes will be calculated on a weight basis. The window also shows the selection parameters selected during the query to define the query on the species selected: Length interval used (LEN.INT), Sex (SEX) and the maturity (MAT.) selected, the class size selected (CLASS SIZE), the length/weight relationships (L/W REL.) and the maturity scale conversion (MAT. SCALE CONV) if used. At the bottom of the window the data calculated are displayed: from two to four folders may be visualized: STUDY AREA INDEXES, STRATA INDEXES, TIME SERIES, LENGTH FREQUENCY, SEX RATIO and HAUL INDEXES. In the STUDY AREA INDEXES data for each species in the chosen interval of strata (e.g. if the strata 10-50 and 50-100 are selected a unique study area will be calculated between 10 and 100 m) considered as a unique study area are calculated. In the STRATA INDEXES data for each species/selected species in the stratum considered are given. In the HAULS INDEXES data for each species/selected species in the hauls considered are shown. The data displayed/calculated are the following: Field Survey Species Depth MIN Depth MAX N/Km2 ST/DEV (CV%) N/h ST/DEV Depth MIN Depth MAX Description The selected survey All the species (if a species is selected this field displays just the selected species, see Example C) The minimum depth of the selected stratum The maximum depth of the selected stratum The number of individuals per surface unit The standard deviation of the N/Km2 value. To visualize the Coefficient of Variation (CV%) click on the button. The number of individuals per unit of time (hours) The standard deviation of the N/h value. To visualize the Coefficient of Variation (CV%) click on the button. The minimum depth of the selected stratum The maximum depth of the selected stratum 103 Kg/Km2 ST/DEV (CV%) Kg/h ST/DEV (CV%) The biomass (Kg) of individuals per surface unit (Km2) The standard deviation of the Kg/Km2 value. To visualize the Coefficient of Variation (CV%) click on the button. The total weight (kg) of individuals per unit of time (hours) The standard deviation of the Kg/h value. To visualize the Coefficient of Variation (CV%) click on the button. At the bottom of the window there are three buttons: SHOW REPORT: visualize the report with all the data EXPORT TO EXCEL: export data to an excel file CLOSE: close the window. SHOW REPORT The report shows in a similar way the same data displayed in the window. In the TIME SERIES (e.g. only if two or more surveys are selected) a graph showing the indexes per single survey is given (to scroll all the indexes click on the top of the TIME SERIES window: a new graph will appear. 104 EXPORT TO EXCEL: If click on the button EXPORT TO EXCEL a new EXCEL file will be automatically opened reporting the data in the same order in which are displayed in the ATrIS window. Remember to save the data using the command “SAVE AS” of Excel. Please note that the file on which the system exports data is always the same: if the file used to export a set of data remains opened and a new set of data have to be exported, the system will show a error message. 7.6.1 Indexes Calculation ATrIS estimate the abundance/biomass indexes using the formula reported by Cochran, 1977, modified by Souplet 1996. Abundance indices The calculations of abundance indices based on density (Number/kg of individuals per surface) are hereunder reported: A N Ai Wi ni Ai,j fi xi,j total surface of the area number of strata in that area surface of the stratum i relative weight of the stratum i in the area number of hauls in the stratum i surface trawled by the haul j in the stratum i sampling fraction in the stratum i measured value in the haul j ni with Wi Ai A and fi ¦A j 1 i, j Ai It is possible to choose between two options. The first one is to calculate a value by surface unit for each haul and to average those values over all the hauls made in the stratum: 105 ni y i,j x i,j y i,j et A i,j ¦y j 1 i, j ni ni ¦x j 1 ni xi mean value of x by unit of surface in the stratum i : ¦A j 1 ~ S2 xi Variance of the value in the stratum i : i, j § x i,j · 1 ni x i ¸¸ A i,j ¨¨ ¦ ni 1 j 1 © A i,j ¹ 1 Var x i Variance of the estimate of the mean : i, j j 1 i i 1 varI Variance of that index: i, j N ¦Wx I Abundance index in the area : ~ S 2 xi ni ¦A 2 N ¦ i 1 i ~ Wi 2 S 2 x i ni ¦ A i,j 1 fi j 1 CPUE indices The formulae based on CPUE (weight or number per hour trawling) are very similar to those based on density. The calculation of area indices always uses a weighted average of indices by stratum, using the ratio stratum surface/area surface as weighting factor (Souplet, 1996). A N Ai Wi ni Ti,j fi xi,j total surface of the area number of strata in that area surface of the stratum i relative weight of the stratum i in the area number of hauls in the stratum i time trawled during the haul j in the stratum i sampling fraction in the stratum i measured value in the haul j ni with Wi Ai A and fi ¦A j 1 i, j Ai 106 ni ¦x j 1 xi mean value of x by unit of surface in the stratum i: ni ¦T i, j j 1 ~ S2 xi Variance of the value in the stratum i: § x i,j · 1 ni x i ¸¸ Ti,j ¨¨ ¦ ni 1 j 1 © Ti,j ¹ 1 Var x i Variance of the estimate of the mean: i, j ¦T i, j j 1 N ¦Wx I Abundance index in the area: i i 1 varI Variance of that index: N ¦ i 1 i ~ Wi 2 S 2 x i ni ¦T j 1 107 ~ S 2 xi ni i, j 1 fi 2 7.7 Multiplex Indexes Analysis This option permits to calculate indexes of two or more species simultaneously with a wide combination of options or for a single species to calculate the indexes of fraction of the population with different characteristics. Clicking on MULTIPLEX INDEX ANALYSIS button the following mask will be opened. 1) 2) 3) 4) 5) Select the species to be analysed. Select the minimum and maximum length (if applicable) Select a sex (if applicable) Select the maturity (if applicable) Click on ADD and the species name with the selected characteristics will be displayed in the right box. Repeat the step 1-5 as necessary. Please note that the selection can be repeated for the same species with different characteristics (e. g. Merluccius merluccius from 0-200mm, 200-400mm, >400mm).Please note that a maximum of 10 species can be selected. 6) If weight data are not available for the selected species the USE LENGTH WEIGTH RELATIONSHIP option can be checked 108 7) If the maturity scale used is different for the selected species (e.g. for two surveys a different maturity scale has bee used) check on USE MATURITY SCALE CONVERSION RULES option. 8) Select the type of indexes to be calculated. 9) Clicking on CALCULATE INDEXEX the data will be showed in the mask below. 10) Clicking on MAP INDEXES a map will be generated. The map displays calculated indexes as pie proportional to the total indexes value and divided in % according to the chosen characteristics. 109 7. 8 Map of Indexes /Set Up Legend The option to map the data, using the GIS tool, is activated when a species or category is selected. The procedure to map data is the following: 1) Click on SET UP LEGENDS 2) Click on MAP INDEXES SET UP LEGENDS The above window will be opened. For each index fix a range and then click on UPDATE. To modify the interval select the range to be deleted and click on DELETE MAP INDEXES Once the legend is configured the button MAP INDEXES can be clicked. A window will be opened: choose the indexes and click on OK. Automatically ArcView will be opened and the selected data will be visualized on a map (for more details see para 7.8.1). 110 7.9 Some basic feature of ArcView The GIS component of ATrIS has been designed to: --Support to the data entry procedures when geographic elaboration are needed (e.g. start and end point calculation to estimate the haul length); --facilitate the data retrieval for a given station (haul) by selecting the station on the map directly (query by location option); --associate the sampling station to a stratum defined by the user on the basis of the available cartography --generate thematic map in which to represent the spatial distribution of the calculated indexes --analyze in a spatial analysis mode the calculated indexes in order to obtain a preliminary estimate of the spatial distribution of a species --generate reports with the data and the selected area. These options are available by using a series of buttons and tools added to the Standard Menu and the Tools Bar of ATrIS, and in the ATrIS Menu added to the Standard Menu of ArcView. Here is a summary of each GIS option. 111 7.9.1 Read a map: the legend Some basic features to read a map are given. The map shows the calculated indexes. The legend on the left side explains the symbols and the colors used. Here are some basic tools to view the map. Species selected Zero value Theme legend Data not available Color of the land Color of the bathymetric borders Cell characteristics Thiessen polygons characteristics Bathymetry Line of boundaries 7.9.2 Useful buttons on ArcView ZOOM IN and OUT With the ZOOM IN and ZOOM OUT button in the toolbar, an area can be enlarged by placing the cursor near the place of interest and dragging it till the area of interest is selected. PAN To move the map without modifying it click on the PAN button move the map. and move the cursor to GLASSES The GLASSES button allows to visualize data corresponding to a certain haul. Click on the GLASSES button and select a particular haul. Automatically the system will display the 112 Access table with the haul data corresponding to the haul selected. Click on CLOSE and ArcView will be showed again. ACCESS KEY The ACCESS KEY button is a shortcut to Access: to go back to ATrIS click on this button and the application on Access will be displayed again. FULL EXTENT To go back to the principal theme, after some zooming and panning, click on the FULL EXTENT button or go via menu bar to View/Full Extent and the complete theme will be showed again. 7.9.3 Query by location (glasses) This option can be used during data entry or data retrieval and it allows the users to select one of the hauls mapped and obtain the corresponding data table. This option is activated when the map point is activated in the table of contents of ArcView (TOC) in the lefts hand side of the screen. To visualize the map just click on the name until the theme appears embossed. 7.9.4 Use GIS tool to define strata This option has been explained in Chapter 7 para 7.1.4. 7.9.5 Use GIS tool to generate thematic maps This option allow the user to generate map with the calculated indexes in ATrIS. This option can be used also to map data for more than one survey (see Chapter 6, para 6.3.4.1 for generation of hauls map, para 6.1.1 for generation of map of hauls in a survey; Chapter 7, para 7.1.4 for using GIS tool to define strata and para 7.7 to generate map of multiple indexes). 7.9.6 Calculate the distribution area of a species This option is due to two data interpolation techniques in order to estimate the distribution area of a certain species or a population fraction of that species. The techniques are the interpolation method to calculate the Thiessen (Voronoi) polygons and the generation of cells. 113 7.9.6.1 Generate Thiessen (Voronoi) polygons This option is included in the ATrIS menu created in ArcView and it is only activated when a thematic map has been generated for an index for a species. With this technique to each unknown point the value of the nearest known point is associated. With this approximation near a known points several polygons are calculated (the Thiessen polygons) which enclose the nearest space to the known point. To this space the indexes calculated for the known point are associated. Select the GENERATE THIESSEN (VORONOI) POLYGONS from the ATrIS Menu and a mask will be shown. The Thiessen polygons are represented with the same scale used to generate the point map (from which the polygon were generated). They may be generated: -Using each geographical unit separately -Using all the geographical units together -Using a series of points selected by the users (>3) Select the method and ATrIS will generate the corresponding map. Please use this utility for data of a single survey has been selected. If the utility is used for two or more data surveys the resulted points may generate clusters which make the creation of Thiessen polygons difficult. (See next para for more data surveys) 114 7.9.6.2 Generate cells The second option to calculate the distribution area of a species is to divide a selected area in a matrix with n rows/m columns of rectangular elements (cells) whose dimension are determined by the user. The number of points falling in a cell, the minimum, the maximum, the mean value, the variance and the standard deviation value of the index, for each cell, are then calculated. The calculated cells will be represented with the same scale used to represent points estimated with the estimated mean values. The rectangular elements which form this matrix (cells) and the extension of the matrix could be defined by the users using the option “Generate cells” given in the Menu bar ATrIS, or, alternatively, with the button matrix near the GLASSES button, drawing a rectangular. --GENERATE CELLS from the ATrIS Menu Bar A mask will be shown. 115 The user should define the external borders of the matrix which he/she wishes to generate (Minimum and maximum Latitude, and Minimum and Maximum Longitude) Then the dimension of cell (height and width) expressed in minutes (sixtieth of a degree). ATrIS will calculate the number of cells for each row and column automatically. If the cell dimension has been changed, the row and column number will be the same but the maximum longitude and the maximum latitude will be recalculated. -- GENERATE CELLS from the MATRIX Button In this case the boundary of the matrix are those defined for the rectangular drawn by the user. To calculate the indexes for the points which fall in the defined cells select from the ATrIS Menu “SUMMARIZE INDEX USING CELLS”. The calculation of the minimum, maximum, mean value, variance and standard deviation and the number of the points in the defined area will start. Please use this utility for data of two or more surveys: it encompass the problem of cluster formation and gives a view of the mean values for each cell using all the surveys. 116 Please also note that the cell generation may be a long operation if cell values higher than 50 rows/column are selected. 7.9.7 Print reports The option PRINT THE MAP in the ATrIS menu allow the user to print a report with the map generated in a format with all the data: A legend of the data The scale used The projection used The cartographic datum The geographic graticule The reference to the cartography used The area represented in the report will be the area zoomed by the user before launch the print option. 117 118 8 Consistency Control This panel is complementary and supporting all the data validation measures used in the other panels (see chapter 5, 6 and 7). Once the data are inserted the system will check on the consistency of data: it allows to check data a posteriori in order to improve data quality. The control can be carried out on a specific survey/unit and it is possible to specify a species. The consistency control, in particular the possibility to show biological data, permits the user to have (print or export) the list of all the specimens with biological data. Many of the data check controls were developed and are included in the DATA CONFIGURATION panel (see Chapter 5) and help the user to insert data correctly. Data can be further checked for consistency after data entry or if the Administrator has changed some rules, with the options given in the CONSISTENCY CONTROL panel. The following procedures should be carried out to check data: 1) Choose a survey 2) Choose a unit. The button SHOW BIOLOGICAL DATA, MATURITY SCALES CHECK, VERIFY CONSISTENCY CATCH/BIOLOGICAL DATA and HAULS LENGTH VALIDATION will be activated. 3) Select a species (if applicable). 4) Select a class size and/or a sex (if applicable). The buttons LENGTH FREQUENCY DISTRIBUTION, LENGTH WEIGHT RELATIONSHIP and LENGTH MATURITY RELATIONSHIP. 119 To visualize all the information related to the modification of a record: 1) Select a data type in which perform the query 2) Define the range of date in which limit the search 3) click on SHOW MODIFIED RECORDS Hereunder the main factors which may have consequences on the error generation are detailed: 1. Completeness; 2. Consistency; 3. Congruence. 8.1 Completeness ATrIS provides two options to check data completeness: --Verification of consistency between catch data and biological data --List of all the biological data 8.1.1 Verify consistency between catch and biological data To rapidly verify consistency between catch data and biological data press the button VERIFY CONS.CATCH/BIOLOGIC. DATA. The following mask will be displayed showing for the survey and unit chosen, the list of biological data for each haul. The table can underline the stations in which for a species the number of individuals given in the biological data table does not coincide with the number given in the catch data table. Furthermore, in the case of the target species, this option may underline stations in which there are no biological data available for that species. 120 8.1.2 Show biological data Attraverso la seconda funzionalità è possibile consultare tutte le informazioni inserite nella tabella relativa ai dati biologici, e di conseguenza verificare quali specie sono state inserite e quali invece sono ancora mancanti. E’ possibile effettuare il controllo specie per specie selezionando una specie nell’apposita casella combinata (Combobox “Species”). This button shows all the biological data included for the survey and unit selected. This option allows the users to check which species are inserted and which are missing. For a single species select for a species name in the combo box SPECIES. Please note that the data visualized cannot be modified, they are read only. 8.2 Consistency This option has been developed to guarantee the logical consistency of data. This can be achieved when: --inserted data follow the rules given by the Administrator --data are significant for the described phenomenon. 121 8.2.1 Maturity scales check To check if the inserted data follow the rules given by the Administrator the option MATURITY SCALES CHECK can be used. In this case the data should follow the rules given by a certain maturity scale and the maximum value indicated by the same scale. --Select a species --Click on MATURITY SCALES CHECK --The list of all the specimens for the species selected will be given. 8.2.2 Length frequency distribution When choosing a class size or a sex the control can be refined on the species selected. The LENGTH FREQUENCY DISTRIBUTION button displays the data in a length frequency table and a length frequency graph. The table shows the number of individuals included in a given length class and the value of the length interval set during data configuration (see Chapter 4). In particular the chart facilitates the visualization of specimens in anomalous length classes. 122 In particular the chart facilitates the visualization of specimens in anomalous length classes. 8.3 Congruence To estimate the congruence two options have been developed in ATrIS: --Hauls Length Validation --Length Weight Relationships 8.3.1 Hauls length validation Data on haul length is important in the estimation of indexes. Haul length validation is carried out comparing the haul length recorded with the theoretical haul length estimated as the time of haul duration multiplied the mean speed (SAMED Project, see also Chapter 6, para 6.3.4.3). If click on HAULS LENGTH VALIDATION button the following table will be shown. A summary of the information on the haul is given, showing the Haul Length calculated (H.LEN (m)), the theoretic length (TEOR.LEN(m)), the speed (SPEED (Km)) and the duration (DUR.(min)). 123 The points should appear near the bisector of the first quadrant. The point position will coincide with the bisector just when the haul length recorded was calculated using the Speed and Duration method. When the position of a point is distant from the bisector the following elements should be analyzed if the haul length was calculated using the “Start point and end point algorithm” (see Chapter 6, para 6.3.4.3) --if the haul length recorded is lower than the theoretical haul length, maybe the haul was not linear: in this case, probably the theoretical haul length value is more exact than the recorded one. -- if the haul length recorded is higher than the theoretical haul length, it should be checked if the speed during the haul has been regular and the start time and end time were registered in a correct way. In any case the user should evaluate case by case when the haul length recorded is not similar to the theoretical value. 124 8.3.2 Length weight relationship With this option a table summarizing the length-weight data for each individual or group of individuals is generated. If weight data are not included the value charted is equal to 0. This option allows the users to check for individuals with length-weight data which diverge with the length-weight relationships given for that species in the literature. 125 8.3.3 Length/Sexual maturity relationships Clicking on LENGTH/MATURITY RELATIONSIPS a table is generated with the data on sex, length and maturity stages for each individual. The graph is also useful, for example, to identify individuals with length lower than the length at fist maturity related with maturity stages not congruent with it. 126 8.4 Account management One powerful tool of the ATrIS Consistency control is the account management with the possibility to archive all the modifications performed in the system, the person responsible for the modification and the date of the modification. If click on the button SHOW MODIFIED RECORDS a list of all the modification will be generated. This kind of information together with the date is always printed on the report generated by ATrIS. In this way it is possible to check the data bank modification and to verify the congruence between a modification and the databank up-date status. 127 9. References AdriaMed. 2000. Priority Topics Related to Shared Demersal Fishery Resources of the Adriatic Sea. Report of the First Meeting of the AdriaMed Working Group on Shared Demersal Resources. FAO-MiPAF Scientific Cooperation to Support Responsible Fisheries in the Adriatic Sea. GCP/RER/010/ITA/TD-02: 21 pp. AdriaMed. 2001. Report of the Second Meeting of the AdriaMed Coordination Committee. FAO-MiPAF Scientific Cooperation to Support Responsible Fisheries in the Adriatic Sea. GCP/RER/010/ITA/TD-04. AdriaMed Technical Documents, 4: 41 pp. AdriaMed. 2003. Report of the Fourth Meeting of the AdriaMed Coordination Committee. FAO-MiPAF Scientific Cooperation to Support Responsible Fisheries in the Adriatic Sea. GCP/RER/010/ITA/TD-09. AdriaMed Technical Documents, 9: 39 pp. Anonymous. (1998) Campagne internationale de chalutage démersal en Méditerraneé (MEDITS) : manuel des protocoles. Biol. Mar. Medit., 5(2): 515-572. Bertrand, J. (1995) Campagnes internationales de chalutage démersal en Méditerraneé (MEDITS) Campagne 1994. Manuel des protocoles. Rapp de Contract ECIFREMER-IEO-SIBM-NCMR (MED 93:020 018 006004). 27 pp. Bertrand J., L. Gil de Sola, C. Papaconstantinou, G. Relini et A. Souplet, (Coordonnateurs). 1996. Campagne internationale de chalutage démersal en Méditerranée (Medits). Campagne 1995. Rapport final, manuel des protocoles et base de données. Rapport de contrat CEE-IFREMER-IEO-SIBM-NCMR (MED/93/020, 018, 006, 004), 172 p., 27 p. + annexes. Milone, N., Zeuli, V., Mannini, P. 2003. AdriaMed Trawl Survey Databank: User Manual. FAO-MiPAF Scientific Cooperation to Support Responsible Fisheries in the Adriatic Sea. GCP/RER/010/ITA/OP-12. AdriaMed Occasional Papers, 12: 18 pp. Souplet A. (1996) Calculation of abundance indices and length frequencies in the MEDITS survey. In: J.A. Bertrand et al. (eds), Campagne internationale de chalutage démersal en Méditerraneé. Campagne 1995. EU Final Report, Vol. III. Sparre, P., Venema, S.C. (1998) Introduction to tropical fish stock assessment. Part 1. Manual. FAO Fisheries Technical Paper. No. 306.1, Rev. 2. Rome, FAO. 1998. 407p. SAMED. (2002) Stock assessment in the Mediterranean. European Commission–DG XIV, Project 99/047 – Draft Final Report. 128 Annex A --Report formats The following are representations of the reports that can be generated from ATRIS. 129 130 131 132 133 134 Annex B - List of the Species code Species Code ABRAVER ABRRALB ACANEXI ACANPEL ACATPAL AEQUOPE ALCYPAL ALEPROS ALLOMED ALLOSPP ALLOSUB ALOPVUL ALOSFAL ALPHGLA ALPHPLA AMYGLUT ANADDIL ANAMRIS ANAPBIC ANAPLAE ANARGRA ANCINIC ANGUANG ANTHANT ANTOMEG ANTOSPP APHIMIN APOGIMB APORPES APORSER APTECAE ARGESPY ARGOOLE ARGRACU ARGRHEM ARGYREG ARIOBAL ARISFOL ARITANT ARMIMAC ARMITIG ARNOIMP Scientific Name Abralia veranyi Abra alba Acantephyra eximia Acanthephyra pelagica Acantholabrus palloni Aequipecten opercularis Alcyonium palmatum Alepocephalus rostratus Alloteuthis media Alloteuthis spp Alloteuthis subulata Alopias vulpinus Alosa fallax Alpheus glaber Alpheus platydactylus Amygdalum luteum Anadara diluvii Anamathia rissoana Anapagurus biconiger Anapagurus laevis Anarchias euryurus (grassii) Ancistroteuthis lichtensteini Anguilla anguilla Anthias anthias Antonogadus megalokynodon Antonogadus spp Aphia minuta Apogon imberbis Aporrhais pespelecani Aporrhais serresianus Apterichthus caecus Argentina sphyraena Argobuccinum olearium Argyropelecus aculeatus Argyropelecus hemigymnus Argyrosomus regius Ariosoma balearicum Aristaeomorpha foliacea Aristeus antennatus Arminia maculata Armina tigrina Arnoglossus imperialis ARNOLAT ARNORUP ARNOTHO ASPICUC ASPIOBS ASTARUG Arnoglossus laterna Arnoglossus rueppelli Arnoglossus thori Aspitrigla cuculus Aspitrigla obscura Astacea rugosa ASTRSPP ATELROT ATRIFRA AULOFIL BALICAR BASOPRO BATHDUB BATHMED BATISPO BATYMAR BATYSUP BELLAPO BENSGLA BENTROB BERYDEC BERYSPL BLENBAS BLENCRI BLENGAT BLENOCE BLENPAV BLENSPP BLENSPY BLENTEN BOOPBOO BOROANT BOTHPOD BRACRII BRESSPP BRURSPP BUCCCOR BUCCHUN BUCCSPP BUGLLUT CALAGRA CALCTUB CALICHI CALLRIS CALLRUB CALMLYR CALMMAC CALMPHA CALMRIS CALOCOR CALOMAC CANCCAN CANIGRA CAPOAPE CARAHIP CARARHO 135 Astropecten spp Atelecyclus rotundatus Atrina fragilis (= Pinna pectinata) Aulopus filamentosus Balistes carolinensis Bathysolea profundicola Batthypterois dubius Bathypterois mediterraneus Bathypolypus sponsalis Bathynectes maravigna Bathynectes superbus Bellotia apoda Benthosema glaciale Benthocometes robustus Beryx decadactylus Beryx splendens Lipophrys (Blennius) Scartella (Blennius) cristata Parablennius (Blennius) Blennius ocellaris Lipophrys (Blennius) pavo Blennius spp. Aidablennius (Blennius) Parablennius (Blennius) Boops boops Borostomias antarcticus Bothus podas Brachioteutis riisei Buccinulum corneum Buccinum humphreysianum Buccinum spp. Buglossidium luteum Calappa granulosa Calcinus tubularis Calyptraea chinensis Callanthias ruber Callionymus lyra Callionymus maculatus Synchiropus (Callionymus) Callionymus risso Calocarides coronatus Calocaris macandreae Cancellaria cancellata Calliostoma granulatum Capros aper Caranx hippos Caranx rhonchus CARCPLU CARCSPP Carcharhinus plumbeus Carcharhinus spp CARDACU CARDECH CARDSPI CARISPP CARISTE CARPACU CASSECH CASSSAB CASSTYR CATAALL CECACIR CENONIG CENTGRA CENTUYA CEPHVOL CEPOMAC CERAMAD CHAUSLO CHEOLAB CHIMMON CHLAOPE CHLAVAR CHLOGRA CHROCHR CIRCCAS CIROBOR CITHMAC CLOPBIC CLORAGA COBLGAL COELCOE COELOCC CONGCON CORIJUL CORYGUN CRANSPP CRASGIG CRASSPP CUBIGRA CUSPCUS CYCLPIG CYCLSPP CYMACOR CYMBOLL CYNPFER DALOIMB DARDARR DARDCAL DASICEN DASIPAS DASITOR DASIVIO DENTDEN Acanthocardia aculeata Acanthocardia (Cardium) Acanthocardia spinosa Cardiomya spp. Caridion steveni Carapus acus Cassidaria echinophora Phalium (Cassis) saburon Cassidaria tyrrhena Cataetyx alleni Centracanthus cirrus Centrolophus niger Centrophorus granulosus Centrophorus uyato Dactylopterus Cepola rubescens Cerastocopelus maderensis Chauliodus sloani Chelon labrosus Chimaera monstrosa DENTGIB DENTMAC DENTMAR DENTSPP DIAPHOL DIAPMET DIAPRAF DIAPSPP DICAMAY DICELAB DICEPUN DICOCUN DIODITA DIPGBIM DIPLANN DIPLCER DIPLPUN DIPLSAR DIPLVUL DORHTHO DORILAN DORITHO DORSVER DOSISPP DROMPER EBALCRA EBALNUX ECHEMIR ECHIDEN ELECRIS ELEDCIR ELEDMOS ELEDSPP ENGRENC EPHIGUT EPIGCON EPIGDEN EPIGTEL EPINAEN EPINALE EPINCAN EPINGUA EPINSPP ERETKLE ERGACLO ETHUMAS ETMOSPI EUCHLIG EUCRSPP EUPHSPP EURYASP EUTRGUR EVERBAL Chlamys varia Chlorotocus crassicornis Chromis chromis Circomphalus casinus Cirolana borealis Citharus linguatula Chlopsis bicolor Chlorophthalmus agassizii Coryphoblennius galerita Coelorhynchus coelorhynchus Coelorhynchus occa (labiatus) Conger conger Coris julis Coryphaenoides guentheri Crangon spp Crassostrea gigas Crassostrea spp. Cubiceps gracilis Cuspidaria cuspidata Cyclothone pygmaea Cyclothone spp Cymatium corrogatum Cymbium olla Cynoponticus ferox Dalophis imberbis Dardanus arrosor Dardanus calidus Dasyatis centroura Dasyatis pastinaca Dasyatis tortonesi Dasyatis violacea Dentex dentex FLEXFLE FUNCWOO 136 Dentex gibbosus Dentex macrophthalmus Dentex maroccanus Dentalium spp Diaphus holti Diaphus metopoclampus Diaphus rafinesqei Diaphus spp Dicranodromia mayheuxi Dicentrarchus labrax Dicentrarchus punctatus Dicologoglossa cuneata Diodora italica Diplacogaster bimaculata Diplodus annularis Diplodus cervinus cervinus Diplodus sargus Diplodus vulgaris Dorhynchus thomsoni Dorippe lanata Dorhynchus thomsoni Doris verrucosa Dosinia spp Dromia personata Ebalia cranchi Ebalia nux Echelus myrus Echiodon dentatus Electrona rissoi Eledone cirrosa Eledone moschata Eledone spp Engraulis encrasicholus Ephippion guttiferum Epigonus constanciae Epigonus denticulatus Epigonus telescopus Epinephelus aeneus Epinephelus alexandrinus Epinephelus caninus Epinephelus guaza Epinephelus spp Eretmophorus kleinenbergi Ergasticus clouei Ethusa mascarone Etmopterus spinax Euchirograpsus liguricus Euphausiidae Eurynomia aspera Eutrigla gurnardus Evermannella balboi (ou balbo) Flexopecten flexuosus Funchalia woodwardi FUSIROS FUSTUND GADAMAR GADIARG GADUMER GAIDMED GAIDVUL GALADIS GALAINT GALANEX GALEGAL GALIDEC GALUATL GALUMEL GENNELE GEPYDAR GERYLON GIBBSPP GLOSLEI GLOSVAL GLOUHUM GNATMYS GOBICOL GOBIFRI GOBIGEN GOBILIN GOBINIG GOBIQUA GOBISAN GOBISPP GOBISUE GONERHO GONICOC GONODEN GYMACIC GYMNALT HADRCRA HELIDAC HEPTPER HETEDIS HEXAGRI HEXAVIT HINIINC HINIRET HIPPHIC HISTBON HISTREV HISTSPP HOMAVUL HOMOBAR HOPLATL HOPLMED HYGOBEN HYGOHIG HYMEITA Fusinus rostratus Fusituris undatiruga Gadella maraldi Gadiculus argenteus Merlangius merlangus Gaidropsarus mediterraneus Gaidropsarus vulgaris Galathea dispersa Galathea intermedia Galathea nexa Galeorhinus galeus Galeoides decadactylus Galeus atlanticus Galeus melastomus Gennadas elegans Gephyroberyx darwini Geryon longipes Gibbula sp. Glossanodon leioglossus Glossodoris valenciennesi Glossus humanus Gnathophis mystax Deltentosteus (Gobius) Leusueurigobius (Gobius) Gobius geniporus Crystallogobius (Gobius) Gobius niger Deltentosteus(Gobius Lesueurigobius (Gobius) Gobius spp Lesueurigobius suerii Goneplax rhomboïdes (= angulata) Gonichthys coccoi Gonostoma denudatum Gymnammodytes cicerellus Gymnura altavela Hadriana craticuloides Helicolenus dactylopterus Heptranchias perlo Heteroteuthis dispar Hexanchus griseus Hexanchus nakamurai Hinia incrassata Hinia reticulata Hippocampus hippocampus Histioteuthis bonnellii Histioteuthis reversa Histioteuthis spp Homarus vulgaris Homola barbata Hoplostethus atlanticus Hoplostethus mediterraneus Hygophum benoiti Hygophum hygomii Hymenocephalus italicus HYMPSPP HYPESPP HYPOPIC ICHTOVA ILLECOI INACCOM INACDOR INACTHO JAXENOC LABRVIR LABSBIM LAEVCAR LAGOLAG LAMACRO LAMAPUS LAMASPP LAMPGUT LAPPFAS LATRSPP LEPALEP LEPICAU LEPMBOS LEPMWHS LEPOLEP LEPTCAV LEPTDIE LESTSPD LESTSPP LICHAMI LIGUENS LISSCHI LITHMOR LIZAAUR LIZARAM LIZASAL LOBIDOF LOBIGEM LOLIFOR LOLIVUL LOPHBUD LOPHPIS LOPOTYP LUNACAT LUNAFUS LUTRSPP MACOSCO MACRLIN MACRLON MACRROS MAJACRI MAJASQU MAURMUE MCPIARC MCPICOR MCPIDEP MCPIMAC 137 Hymenopenaeus spp. Hyperiidae Hyporhamphus picarti Ichthyococcus ovatus Illex coindetii Inachus communissimus Inachus dorsettensis Inachus thoracicus Jaxea nocturna Labrus viridis Labrus bimaculatus Laevicardium oblongum Lagocephalus lagocephalus Lampanyctus crocodilus Lampanyctus pusillus Lampanyctus spp Lampris guttatus Lappanella fasciata Lepadogaster lepadogaster Lepidopus caudatus Lepidorhombus boscii Lepidorhombus whiffiagonis Lepidion lepidion Lepidotrigla cavillone Lepidotrigla dieuzeidei Lestidiops sphyrenoides Lestidiops spp Lichia amia Ligur ensiferus Lissa chinagra Lithognathus mormyrus Liza aurata Liza ramada Liza saliens Lobianchia dofleini Lobianchia gemellarii Loligo forbesi Loligo vulgaris Lophius budegassa Lophius piscatorius Lophogaster typicus Lunatia catena Lunatia fusca Lutraria spp. Macrorhamphosus scolopax Macropodia linaresi Macropodia longipes Macropodia rostrata Maja crispata Maja squinado Maurolicus muelleri Liocarcinus arcuatus Liocarcinus corrugatus Liocarcinus (Macropipus) Liocarcinus maculatus MCPIPUB MCPITUB MEGANOR MELAATL MERLMER MICMPOU MICOSAB MICRMCS MICUAZE MICUBOS MICUOCE MICUVAR MOLAMOL MOLVDYP MOLVMOL MONOHIS MORAMOR MORIRUG MUGICEP MUGISPP MULLBAR MULLSUR MUNICUR MUNIINT MUNIIRI MUNIPER Necora (Macropipus) puber Macropipus tuberculatus Meganyctiphanes norvegica Melanostigma atlanticum Merluccius merluccius Micromesistius poutassou Microcosmus sabatieri Microstoma microstoma Microchirus azevia Microchirus boscanion Microchirus ocellatus Microchirus variegatus Mola mola Molva dipterygia Molva molva Monochirus hispidus Mora moro Morio rugosa Mugil cephalus Mugilidae Mullus barbatus Mullus surmuletus Munida curvimana Munida intermedia Munida iris Munida perarmata (= tenuimana) MUNIRUG MUNITEN MURAHEL MUREBRA MURETRU MUSTAST MUSTMED MUSTMUS MYCOPUN MYCOSPP MYCTRUB MYLIAQU MYTIGAL MYTISPP NANSOBI NASSSPP NATIMIL NATISPP NAUCDUC NEMISCO NEORCAR NEPRNOR NEROMAC NEROOPH NETOBRE NETTMEL NEZUAEQ NEZUSCL Munida rugosa Munida tenuimana Muraena helena Bolinus (Murex) brandaris Murex trunculus Mustelus asterias Mustelus mediterraneus Mustelus mustelus Myctophum punctatum Myctophidae Mycteroperca rubra Myliobatis aquila Mytilus galloprovincialis Mytilus spp Nansenia oblita Nassariidae Naticarius millepunctatus Naticidae Naucrates ductor Nemichthys scolopaceus Neorossia caroli Nephrops norvegicus Nerophis maculatus Nerophis ophidion Dysomma (Nettodarus) Nettastoma melanurum Nezumia aequalis Nezumia sclerorhynchus 138 NOTABON NOTORIS NOTSBOL NOTSELO Notacanthus bonapartei Notolepis rissoi Notoscopelus bolini Notoscopelus elongatus NOTSKRO OBLAMEL OCENERI OCTODEP OCTOMAC OCTOSAL OCTOSPP OCTOTET OCTOVUL OCYTTUB ODONFER ODONTAU OEDALAB OLIGATE ONYCBAN ONYCSPP OPDIBAR OPDIROC OPHCRUF OPHISER OPHOFRA OPISSPP OPLOSPP OPTOAGA OSTREDU OSTRSPP OXYNCEN PAGEACA PAGEBOG PAGEERY PAGIERE PAGUALA PAGUCUA PAGUEXC PAGUFOR PAGUPRI PALIELE PALIMAU PANDPRO PAPANAR PAPELON PAPOHUM PAPOOCT PARALEP PARLCOR PARLSPE PAROCUV PARTANG PARTMAC PARTMAS PASIMUL Notoscopelus kroyerii Oblada melanura Ocenebra erinacea Octopus defilippi Octopus macropus Octopus salutii Octopus spp Pteroctopus tetracirrhus Octopus vulgaris Ocythoe tubercolata Odontaspis ferox Eugonphodus (Odontaspis) Oedalechilus labeo Oligopus ater Onychoteuthis banksi Onychoteuthis spp Ophidion barbatum Ophidion rochei Ophichthus rufus Ophisurus serpens Ophiothrix fragilis Opisthobranchia spp Oplophoridae Opistoteuthis agassizii Ostrea edulis Ostrea spp Oxynotus centrina Pagellus acarne Pagellus bogaraveo Pagellus erythrinus Paguristes eremita Pagurus alatus Pagurus cuanensis Pagurus excavatus Pagurus forbesii Pagurus prideauxi Palinurus elephas Palinurus mauritanicus Pandalina profonda Parapandalus narval Parapenaeus longirostris Parapristipoma humile Parapristipoma octolineatum Paraliparis leptochirus Paralepis coregonoides Paralepis speciosa Paromola cuvieri Parthenope angulifrons Parthenope macrochelos Parthenope massena Pasiphaea multidentata PASISIV PECTJAC PECTMAX PELTATR PENAKER PENNPHO PERCGRA PERICAT PHALGRA PHILECH PHOTSPP PHRYREG PHYIBLE PHYIPHY PHYLTRU PHYSDAL PILUSPI PILUVIL PINNNOB PINNPEC PINOPIN PISAARN PISANOD PISILON PLATFLE PLEOMED PLERMEC PLESACA PLESANT PLESEDW PLESGIG PLESHET PLESMAR PLEUPIL POLARIS POLBHEN POLCTYP POLYAME POMABEN POMSMAR POMSMIC POMSMIN POMTSAL PONIKUH PONPNOR PONPSPI PONTCAT PONTLAC PRIOGLA PROCEDU PROCMED PROCNOU PROSSPP PSAMMIC PSENPEL PSETMAX Pasiphaea sivado Pecten jacobaeus Pecten maximus Peltodoris atromaculata Penaeus kerathurus Pennatula phosphorea Periclimenes granulatus Peristedion cataphractum Phallium granulatum Philoceras echinulatus PSEVCAR PTEOBOV PTERHIR PUNTPUN RAJAALB RAJAAST RAJABAT RAJABRA RAJACIR RAJACLA RAJAFUL RAJAMEL RAJAMIR RAJAMON RAJANAE RAJAOXY RAJAPOL RAJARDA RAJAUND REGAGLE RHINCEM RHINRHI RHIPMAR RHYNHEP RICHFRE RISSDES RISSPAL ROCHCAR RONDMIN ROSSMAC SADASAR SALOTRU SARDPIL SARIAUR SARIMAD SARPSAL SCAEUNI SCALSCA SCAPNIG SCHEOVA SCIAUMB SCOBSAU SCOHRHO SCOMPNE Phrynorhombus regius Phycis blennoides Phycis phycis Phylonotus Physiculus dalwigki Pilumnus spinifer Pilumnus villosissimus Pinna nobilis Pinnotheres pinnotheres Pisa armata Pisa nodipes Pisidia longicornis Platichthys flesus Plectorhinchus mediterraneus Pleurobranchea meckely Plesionika acanthonotus Plesionika antigai Plesionika edwardsii Plesionika gigliolii Plesionika heterocarpus Plesionika martia Pleurobrachia pileus Polyacanthonotus rissoanus Polybius henslowi Polycheles typhlops Polyprion americanum Pomadasys incisus (bennetti) Pomatoschistus marmoratus Pomatoschistus microps Pomatoschistus minutus Pomatomus saltator Pontinus kuhlii Pontophilus norvegicus Pontophilus spinosus Pontocaris cataphractus Pontocaris lacazei Prionace glauca Processa edulis Processa canaliculata Processa nouveli Prosobranchia spp Psamechinus Psenes pellucidus Psetta maxima SCOMSCO SCORELO SCORLOP SCORMAD SCORNOT SCORPOR SCORSCO SCYLARC SCYLLAT SCYLPYG SCYMLIC 139 Pseudosimnia carnea Pteromylaeus (Myliobatis) Pteria hirundo Diplodus (Puntazzo) puntazzo Raja alba Raja asterias Raja batis Raja brachyura Raja circularis Raja clavata Raja fullonica Raja melitensis Raja miraletus Raja montagui Raja naevus Raja oxyrhynchus Raja polystigma Raja radula Raja undulata Regalecus glesne Rhinobatos cemiculus Rhinobatos rhinobatos Rhinoptera marginata Rhynchogadus hepaticus Richardina fredericii Rissoides desmaresti Rissoides pallidus Rochinia carpenteri Rondeletiola minor Rossia macrosoma Sarda sarda Salmo trutta trutta Sardina pilchardus Sardinella aurita Sardinella maderensis Sarpa salpa Scaeurgus unicirrhus Scalpelum scalpelum Scaphander lignarius Schedophilus ovalis Sciaena umbra Scomberesox saurus Scophthalmus rhombus Scomber (Pneumatophorus) japonicus Scomber scombrus Scorpaena elongata Scorpaena loppei Scorpaena maderensis Scorpaena notata Scorpaena porcus Scorpaena scrofa Scyllarus arctus Scyllarides latus Scyllarus pygmaeus Dalatias (Scymnorhinus) licha SCYOCAN SCYOSTE SEPENEG SEPEOBS SEPEOWE SEPESPP SEPIELE SEPIOFF SEPIORB SEPOAFF SEPOINT SEPOLIG SEPOROB SEPORON SEPOSPP SERAATR SERACAB SERAHEP SERASCR SERGARC SERGROB SERGSAR SERIDUM SOLEIMP SOLEKLE SOLELAS SOLESEN SOLEVUL SOLOMEM SPARAUR SPARCAE SPARPAG SPHOCUT SPHYSPY SPICFLE SPICMAE SPICSMA SPISSPP SPISSUB SPODCAN SPRASPR SQUAACA SQUABLA SQUIMAN SQUTACU SQUTOCL SQUTSPP SQUTSQU STEPDIA STICREG STOLLEU STOMBOA STROFIA SUBECAR SUBEDOM SUBESPP Scyliorhinus canicula Scyliorhinus stellaris Sepietta neglecta Sepietta obscura Sepietta oweniana Sepietta spp Sepia elegans Sepia officinalis Sepia orbignyana Sepiola affinis Sepiola intermedia Sepiola ligulata Sepiola robusta Sepiola rondeleti Sepiola spp Serranus atricauda Serranus cabrilla Serranus hepatus Serranus scriba Sergestes arcticus Sergestes robustus Sergestes sargassi (= henseni) Seriola dumerili Solea impar Solea kleini Solea lascaris Solea senegalensis Solea vulgaris Solenocera membranacea Sparus aurata Pagrus (Sparus) Pagrus (Sparus) pagrus Sphoeroides cutaneus Sphyraena sphyraena Spicara flexuosa Spicara maena Spicara smaris Spisula spp Spisula subtruncata Spondyliosoma cantharus Sprattus sprattus Squalus acanthias Squalus blainvillei Squilla mantis Squatina aculeata Squatina oculata Squatina spp Squatina squatina Stephanolepis diaspros Stichopus regalis Stoloteuthis leucoptera Stomias boa Stromateus fiatola Suberites carnosus Suberites domuncula Suberites spp. SYMBVER SYMDCIN SYMDMED SYMDOCE SYMDROS SYMDTIN SYMPLIG SYMPNIG SYNDSAU SYNGACU SYNGPHL SYNGTAE SYNGTYP TAENGRA TELLSPP TETHFIM TODASAG TODIEBL TORPMAR TORPNOB TORPTOR TRACMED TRACPIC TRACTRA TRAHARA TRAHDRA TRAHRAD TRARTRA TRAYCRI TRIGLUC TRIGLYR TRIILEP TRIPLAS TRISCAP TRISLUS TRITNOD TURRCOM TURRSIM TURRSPP UMBAMED UMBRCAN UMBRCIR UMBRRON URANSCA VENUSPP VENUVER VINCATT VINCPOW XANTCOU XENOCRI XENOSPP XIPHGLA ZEUSFAB 140 Symbolophorus veranyi Symphodus cinereus Symphodus mediterraneus Symphodus ocellatus Symphodus rostratus Symphodus tinca Symphurus ligulatus Symphurus nigrescens Synodus saurus Syngnathus acus Syngnathus phlegon Syngnathus taenionotus Syngnathus typhle Taeniura grabata Tellina spp Tethys fimbria Todarodes sagittatus Todaropsis eblanae Torpedo marmorata Torpedo nobiliana Torpedo torpedo Trachurus mediterraneus Trachurus picturatus Trachurus trachurus Trachinus araneus Trachinus draco Trachinus radiatus Trachyrhynchus Trachyscorpia cristulata Trigla lucerna Trigla lyra Trichiurus lepturus Trigloporus lastoviza Trisopterus minutus capelanus Trisopterus luscus Charonia (Triton) rubicunda Turritella communis Turris similis Turritella spp Umbraculum mediterraneum Umbrina canariensis Umbrina cirrosa Umbrina ronchus Uranoscopus scaber Venus spp. Venus verrucosa Vinciguerria attenuata Vinciguerria poweriae Medaeus (Xantho) couchi Xenophora crispa Xenophora spp Xiphias gladius Zeus faber Annex C: Example of a sampling form used during the AdriaMed Trawl Survey AdriaMed Trawl Survey Haul form PARTNER: VESSEL: DAY: MONTH: YEAR: HAUL code: COORDINATES AT BEGINNING TIME (00:00): LATITUDE (00°00'00) TIME (00:00): LONGITUDE (00°00'00): LATITUDE (00°00'00): DEPTH (m): LONGITUDE (00°00'00): DEPTH (m): COORDINATES AT THE END ROUTE: SPEED (knots): WEATHER CONDITIONS: DURATION (min.): SWEEP LENGTH: SEA CONDITIONS: WARP LENGTH: BOTTOM SHAPE: WIND DIRECTION AND SPEED: NOTES: ENVIRONMENTAL PARAMETERS: Stored file code (.bin): SCIENTIFIC STAFF ON BOARD: 141 Stored file code (ASCII):