1
A Comprehensive Guide to Fitting
Contact Lenses with
EyeSys Pro-FitTM
Contact Lens Fitting Software
by
Beth A. Soper, COA, NCLC
This page intentionally left blank
A Comprehensive Guide to Fitting
Contact Lenses with
EyeSys Pro-FitTM Contact Lens Fitting Software
by
Beth A. Soper, COA, NCLC
EyeSys System 2000
Version 4.0
1
We wish to thank Linda J. Rhodes, H.F.C.L.S.A.
for her contributions to this contact lens fitting guide.
2
Table of Contents
Introduction ............................................................................................................. 4
Accessing Pro-FitTM ................................................................................................ 4
Acquiring eye images to be used for CL fitting purposes....................................... 4
Adjusting the view of the simulated fluorescein pattern ......................................... 5
When trial lenses are recommended...................................................................... 5
Saving the contact lens fitting information.............................................................. 5
How to set up a fitting protocol ............................................................................... 5
How to use the Patient Evaluation screen.............................................................. 6
How to use Pro-FitTM to fit an RGP lens ................................................................. 7
How to design a Custom RGP lens: .................................................................... 8
RGP Order Form: ............................................................................................ 11
How to fit a Manufacturer's Design RGP Lens .................................................. 11
RGP Order Form: ............................................................................................ 13
Using Pro-FitTM to select soft spherical and soft toric lenses ............................... 13
Post Fitting Considerations................................................................................... 15
Follow Up Analysis............................................................................................. 15
Refitting the Previous Wearer ............................................................................ 16
Special Lens Fitting Applications.......................................................................... 17
Keratoconus ....................................................................................................... 17
Proposed Methods for Choosing Diagnostic Lenses ...................................... 17
Averaging Method......................................................................................... 17
Apex Value and Size Method ....................................................................... 18
Piggy Back Fitting System ............................................................................ 18
Refractive Surgery ............................................................................................. 18
Post Keratoplasty ............................................................................................... 19
3
Introduction
For decades, many contact lens fitters have recognized the importance of determining and defining the
corneal surface of their patients, but have been unable to do so for lack of proper instrumentation. To
achieve "the perfect fit," more knowledge of the cornea is needed than what one can glean from central
and peripheral keratometric readings using manual or automatic keratometers. In the past, designing
contact lenses using methods and nomograms based on K readings has been a process of necessity.
With the arrival of corneal topography, our knowledge of the cornea has greatly increased, along with
our methods for designing contact lenses.
Pro-Fit TM, EyeSys' new contact lens fitting software, enables clinicians to fit RGP lenses using topographical data, and provides access to the most comprehensive soft and soft toric contact lens data
base available today. Predicted residual astigmatism is calculated for each lens type, and these
calculations are displayed to assist in selecting the lens to best fit your patients.
Contributing elements that affect the positioning of the contact lens such as tear dynamics, lid tension
and asymmetric topography are factors that currently are not taken into consideration. However, with
the ability to replicate the actual position of the contact lens on the cornea using the Pan and Tilt
features of this program, and by viewing the simulated fluorescein pattern displays, clinician time for
refits and patient adaptation time is reduced to a minimum.
Note: The fitting methods utilized in the 4.0 version of Pro-Fit TM have been developed to be
used with NORMAL EYES. Special applications for Keratoconus, Penetrating Keratoplasty, post
refractive surgery, abnormal corneal curvatures due to trauma and symmetric astigmatism
greater than three diopters will be discussed at the end of this guide.
Accessing Pro-FitTM
Videokeratograph images must first be acquired before accessing Pro-FitTM. When using previously
saved exams, the patient's name must first be selected from the patient locator screen. Highlight the
exams to be used for fitting, then click on the Display button. Click on the Contact Lens button to begin
the fitting process.
Note: Contact lens fitting may be performed for either one or both eyes simultaneously.
Acquiring eye images to be used for CL fitting purposes
Proper placement and positioning of the patient before the system is required before acquisition of the
eye image. Adjust the table so that it is comfortable for the patient. Put the patient's forehead on the
forehead strap, his chin all the way in the chin-rest, and turn his head slightly in the opposite direction of
the eye being examined. This allows maximization of the data acquired. The patient should be looking
directly at the fixation light, and should be asked to blink before the image is captured. Once the image
is acquired, care should be taken to properly edit the images of any limbal lines or artifacts.
Failure to do so may cause the software to calculate very flat RGP lens base curves, as limbal lines
create a 'false' flat periphery. Note: Please refer to your EyeSys User's Manual for instructions on
editing eye images.
4
Adjusting the view of the simulated fluorescein pattern
Initial display of simulated fluorescein patterns can be dramatically affected by the brightness and
contrast level of the monitor used with the system. We suggest after fitting a lens suggested by the
software, evaluate the actual fluorescein pattern of the lens on the patient. Adjust the brightness and
contrast level of your computer monitor to match more closely the appearance of the actual fluorescein
pattern to that of the simulated fluorescein display. This will ensure that the brightness of the display will
match the actual brightness for subsequent exams, provided that no additional adjustment is made to
the monitor brightness level.
When trial lenses are recommended
The presence of irregular astigmatism may cause RGP power calculations to be somewhat inaccurate. Sphero-cylindrical refractions obtained for these patients usually do not accurately reflect the
best corrected visual acuity. Best-corrected visual acuity is be obtained by fitting an RGP lens, then
performing an over refraction. Therefore, we strongly recommend the use of trial lenses and
overrefractions to calculate final parameters for these patients.
Saving the contact lens fitting information
Contact lens fitting information is not saved in this version (4.0). We suggest printing the order form and
making note of the refraction and eye images used. Saving and accessing patient history and contact
lens information will be available in a future version.
How to set up a fitting protocol
The basis of this software program is such that all clinicians may customize their own fitting preferences
(or protocol 'defaults') to use throughout the program. To design a protocol, click on the 'Protocol'
button located at the bottom of the Patient Evaluation screen (see Figure 1).
The first step is to give the new protocol a name. We suggest using the doctor or clinician's name, and
the type of RGP lens to be designed. Pro-Fit includes five back surface designs from which to select.
Aspheric or spherical base curves can be paired with spherical or aspheric peripheral curves. The
design selected will be applied to all custom designed lenses utilizing this particular protocol. For
example: Doctor Smith likes to use an aspheric back surface design for some of his patients. Type in
the name 'Dr. Smith's Asphere' in the box next to the label 'Fitting Protocol.' Next, click on the selection
'Aspheric Base/ with 1 Aspheric Peripheral Curve. Using the sample fluorescein pattern in the area
entitled 'Lens / Cornea Relationship,' establish the desired sagittal depth for this protocol. The software
will recommend RGP lens parameters based on these preferences and the lens design. This is
accomplished through an iterative process where the system calculates the base curve of the optical
zone until the desired sagittal depth is achieved between the front surface of the cornea and the back
surface of the contact lens. For example, Dr. Smith wants a 20-micron vault for his aspheric lens
design. Click on the arrow in the 'steeper' direction until you reach the number 20. Click on 'Recalculate
Fluorescein' to see the amount of fluorescein created by this vaulting effect. Selecting 10-15 microns of
rear tear layer approximates an Alignment or parallel fit, whereas 18 - 22 microns will display an Apical
Clearance fitting technique. The range you may select from is 0 - 60 microns.
5
Clicking on the left or 'flatter' arrow will decrease the sagittal
depth, while clicking on the right or 'steeper' arrow increases
the sagittal depth. The slide bar can also be moved (achieving
the same effect) by clicking on the bar and holding the left
mouse button until reaching the desired position. Note: 12
microns of sagittal tear depth creates an approximate
one-half Diopter tear lens, and 25 microns creates an
approximate one Diopter tear lens.
Refractions may be entered in either minus or plus cylinder
format. Should the clinician choose to enter refractions in plus
cylinder notation, the software will automatically convert each
Figure 1
entered Rx to minus cylinder format, standard for contact lens
prescriptions calculations. RGP curvature display is indicated by selecting either Radius or Diopter.
Custom and Manufacturer Lens Preferences can be designated in the Lens Default area. Diameters for
lens designs will be calculated by selecting either a constant diameter or designated by using a formula
of millimeters subtracted from the HVID (Horizontal visible Diameter). Your preference for custom lens
RGP materials can be assigned in the drop down menu under the heading "Custom RGP". Select a
Constant Diameter for use in this protocol. Next select a stock or manufacturer's RGP lens design, as
well as the choice of diameter preference. Note: All Default setups are easily changed in several of
the RGP fitting screens. Click on 'Save' at the bottom of the screen to add a new protocol to the
protocol selection list.
To delete a previously saved protocol, highlight the protocol name, and click on the 'Delete' button at
the bottom of the screen. Click on the 'Patient Evaluation' button to begin the fitting process.
How to use the Patient Evaluation screen
A fitting protocol must first be selected before further information can be entered. Keratometric and
corneal eccentricity information displayed is derived from the topography data of the eye image exam
selected for the fitting process.
Type in the patient's refraction that will be used for the contact lens power calculation (see
Figure 2). Remember, if plus cylinder was indicated for use in the protocol, the refraction will
be entered in plus cylinder format. However, the software will convent all plus cylinder
refractions to minus cylinder format, standard for contact
lens prescription calculations for final power calculations.
This conversion takes place after exiting the Patient
Evaluation screen. It is not necessary to enter the +
(plus) or - (minus) sign between the spherical component
and the cylinder component. Vertex distance should also
be selected when compensation for the spherical component is necessary. The software will default to 12
mm of vertex distance for power calculations, if one
is not selected. Visible Iris diameter measurement may
also be entered, however this value is not used for any
contact lens parameter computations. The software
Figure 2
will default to 12 mm VID.
6
A unique feature of this software is calculation of Predicted
Residual Astigmatism. Predicted Residual Astigmatism (or
PRA) is the amount of uncorrected astigmatism that may be
present for a certain lens type. This calculation is based upon
the patient's spectacle refraction, corneal toricity and a lens'
ability to correct astigmatic errors.
The software will also calculate changes in power for
monovision fits (see Figure 3). Monovision is the practice of
fitting one eye with a power that corrects for distance vision,
and one eye that is corrected for the patient's reading vision.
This is used for patients who normally wear bifocal spectacles,
and have chosen not to wear bifocal contact lenses. Select a
power for the 'Near Add' (or reading lens) and notice the box
that appears at the bottom of the screen. Indicate if the
powers for the lenses are to be calculated for distance vision
in both eyes, or monovision. Next select which eye is to be
used for the reading or 'near' lens. The clinician should decide
if the full reading power (or 100%) is to be used for final power
calculations, or if a smaller percentage of the 'near' power is to
be considered.
Spherical soft, soft toric, and RGP lens information can be
accessed in this program. The best fit for each patient is a
lens that has a low or zero PRA.
Figure 3
Figure 4
How to use Pro-FitTM to fit an RGP lens
After selecting a Protocol and entering refraction information
on the Patient Evaluation screen, click on the radio buttons
next to 'RGP' on both the right and left sides. Click on
'Continue' at the bottom of the screen. The software will now
take you to the RGP Selection screen (see Figure 4).
A wide variety of RGP fitting philosophies can be encompassed by designating sagittal tear depth and over-all lens
diameter. Corneal eccentricity as well as central corneal
radius information is used to design a lens relative to each
patient's unique topography, while maintaining the fitter's
preferred lens/cornea relationship specified in his fitting
Figure 5
protocol. The fitter need only to select the diameter of the lens
to view the results of the fit reflected in the simulated fluorescein display. Custom designed lens
peripheral curves will achieve as close to a .08 mm corneal edge clearance as allowed by each
patient's unique topographical information. Various manufacturers' RGP lens designs can also be
accessed in this new program (see Figure 5). These designs are composed of proprietary information
supplied by the manufacturer that has been incorporated in the software, but which we are not
permitted to disclose to the general public. The software applies the same iterative process for
calculating the base curve, but only selects from the manufacturers' available base curves. The
manufacturer's peripheral curve system is utilized to create the simulated fluorescein display.
7
To further illustrate this unique feature of Pro-Fit TM, we will fit the left eyes of two patients with a custom
designed RGP lens. These patients have in common almost identical K readings and very similar
spectacle refractions. The difference between the two patients is that Patient #1 has a corneal
eccentricity value of .54, while Patient #2 has a corneal eccentricity value of .32. We must remember
that a sphere has an eccentricity or "e" value of 0.00. The human cornea is not spherical, but ellipsoidal in shape, with eccentricity values ranging from 0.00 to 1.00. The average corneal "e" value is .50.
Therefore, the larger the "e" value of the cornea, the flatter that cornea is in the periphery. Thus, the
cornea of Patient #1 flattens more towards the periphery than the cornea of Patient #2.
Topographical analysis and clinical evaluation reveal the following:
Patient
#1
#2
Corneal
Eccentricity
.54
.32
Spectacle
Refraction
-4.00 - 1.25x015
-4.00 - 1.25x165
Keratometry Readings
43.37x013 / 44.62x10³
43.37x162 / 44.62x72
A spherical base curve with 2 spherical peripheral curves was the RGP custom design of choice for
these patients. A 20-micron sagittal depth for desired tear film was selected to use in the fitting protocol.
9.2 mm lens diameters were chosen for both lenses. The software calculated the following parameters
using the patient's topographic information, along with the criteria indicated in the fitting protocol:
Patient
#1
#2
Base Curve
7.72 (43.62)
7.64 (44.12)
Power
-4.37
-4.62
Diameter
9.2
9.2
Apical Sag
20 microns
19 microns
Peripheral
Curves
9.16/11.04
8.85/10.36
Edge
Clearance
.11 mm
.10 mm
In order to attain the same lens/cornea relationship for both patients, the software calculated different
base and peripheral curves, designing custom lenses to fit the unique topography of these patients.
Due to topographical differences and the higher eccentricity value of his cornea, Patient #1 was fit with
a flatter lens than Patient #2. The program searched for the closest base curve to achieve the desired
apical sag of 20 microns, resulting in what is commonly referred to as an 'on K' fit for Patient #1. The
software selected a steeper base curve to achieve virtually the same lens/cornea relationship for
Patient #2.
How to design a Custom RGP lens:
Upon entering Pro-FitTM, select a protocol from the Patient Evaluation screen. Enter the patient's
spectacle refraction, and select all other fields necessary. Choose RGP on the right and left eye
information boxes. Click on the 'Continue' button on the bottom of the screen.
On the RGP Selection screen (see Figure 6), click next to 'Design a Custom Lens Based on Protocol'
for both the right and left eyes. (Protocol information is noted at the bottom of the screen in an
information box.) Selecting the 'Auto-Fill OU' button will fill in the default manufacturer or stock lens
8
information designated in your protocol. However, selection
can be made independently by simply selecting a diameter,
lens material and color choice. Information chosen for the
right eye may be copied directly to the left eye by clicking on
the OD=OS button. Clicking on the 'More Lens Detail' button
will provide information concerning the material selected, as
well as manufacturer information. Clicking on the individual
folder tabs (Lens Info., Manufacturer Info., Additional Info.,
Custom Info.) displays files specific to each lens material or
design. Now click on the 'Fluorescein Display' button.
Simulated fluorescein patterns and tear depth graphs are
displayed for both eyes simultaneously. A grid representing
Figure 6
1 square millimeter divisions overlay the simulated
fluorescein pattern. The scale to the left of each pattern
corresponds to the amount of fluorescein (in microns) simulated for the contact lens as it would appear
on the cornea. The default values for the Absolute view of the fluorescein scale are from zero to 75
microns, and have been determined to be the most realistic values for fluorescein simulation in most
cases. Each eye can be enlarged or zoomed' to evaluate the patterns in greater detail. Click on the
button with the arrow located in the upper right hand comer of each eye to activate the 'zoom' function.
Reposition Lens button: Clicking on this button enables you
to view the pan and tilt controls of the software (see Figure
7). Pro-FitTM is the only software program that provides an
interactive analysis with automatic or manual lens tilt as well
as manual lens positioning. Replicating the actual position of
the contact lens on the patient's eye image is accomplished
by moving the simulated lens (as if you are facing the
patient) right (+ numbers) or left (- numbers) in 0.1 mm
increments. The Pan U/D enables movement of the contact
lens up (+ numbers) or down (- numbers) in 0.1 mm
increments to correspond with superior or inferior
displacement of the contact lens. Click on the Up/Down
Figure 7
arrows on the right hand side of each box to
increase/decrease the numbers, then click on the 'OK' button to view the change in the Simulated
Fluorescein Display. The Tilt controls default to 'automatic', as the system normally computes the best
lens tilt angles for any Pan position. Tilt is best described in relationship to each individual's
topography. A lens will tilt in the direction of the steepest part of the cornea. This function enables ProFitTM to replicate simulated fluorescein patterns as they actually would appear on the patient's cornea.
Recalculate button: Click on this button when changes have
been made to any of the lens parameters to display a new
fluorescein pattern for the modified contact lens design.
Show Color Map button: To visually correlate the patient's
corneal topography and the simulated fluorescein pattern, a
color map can also be viewed next to either of the
fluorescein maps. Click on the 'Show Color Map' button and
a normalized color map will appear (see Figure 8). Viewing
the Color Map is essential when determining where the
contact lens will position, once it is placed on the patient's
eye.
9
Figure 8
A contact lens will always attempt to position over the area of greatest steepening, thus moving away
from a flat area of the cornea. When looking at the color map, use the Pan function to position the
simulated lens over the steepest area of the cornea. The simulated fluorescein pattern will change to
reflect the new position of the contact lens. Once the Color Map is displayed, the user may select to
overlay different features by clicking on the 'Color Map Options' button. Click on 'OK' to close this
feature.
Sagittal Meridian and Circumference Graphs: The Sagittal Meridian Graph initially displays the amount
of tear film thickness across the flat meridian of the patient's cornea. The clinician can select any other
axis to view by simply clicking the left mouse button anywhere on an axis inside the fluorescein pattern.
The position of the mouse cursor is located by the angle notation located at the bottom of the graph. To
view the circumference graph, click on the button next to the word 'Circumference'. The data initially
displayed is at the center of the lens, thus giving the user a quick read-out of the central sagittal depth.
The clinician may select any radius around which to display the amount of tear film thickness for 360
degrees by clicking on an area in the simulated fluorescein pattern with the left mouse button. The
distance from center is indicated in the lower portion of the graph. When there is missing data in the
periphery of the eye image, the software uses extrapolation and indicates extrapolated data points with
red dots on the circumference graph.
Suggested Parameters: This group of controls initially displays the software suggested contact lens
parameters. The controls allow modification to most of the following:
BC (displayed in either diopters or millimeters):
Lens Power (Diopter):
Diam. (mm):
O.Z. (mm):
PC1 (diopters or mm):
PC2 (diopters or mm):
PC3 (diopters or mm):
Width (mm):
Sph. e:
Corneal e:
Lens e:
Axial Edge Lift:
The lens base curve
The lens refractive power
The overall lens diameter
The optic zone width
The first peripheral curve curvature
The second peripheral curve curvature
The third peripheral curve curvature
The width of the peripheral curve,
displayed below each curvature reading
A display only field for the eccentricity
value of a spherical lens (zero)
The eccentricity value of the patient's
cornea
The eccentricity value of the optic zone
of an aspheric contact lens
A display only field for the distance
between the edge of the contact lens,
and the virtual prolongation of the
lense's base curve
Modifications to most of these parameters can be done manually by clicking on the Up/Down arrows on
the right hand side of each box, then clicking on the 'Recalculate' button. The simulated fluorescein
display will then reflect any operator entered changes. Any change made to the base curve of the lens
will automatically change the power.
Reset Fitting Values button: Clicking on this button restores the original parameters suggested by
software to all fields, once a modification has been made.
10
Print: Clicking on this button will print a hard copy of the fluorescein screens, once the screen is
exited. You may return to either the RGP Selection screen, or proceed to the Lens Order Form by
clicking on the appropriate buttons located at the bottom of the screen.
Once a lens design is complete, click on the Lens Order Form to view the order or to produce a hard
copy of the patient's contact lens prescription.
RGP Order Form:
The patient's name, ID number and today's date appear on the order form automatically (see Figure 9
on page 12). The lens parameters (determined in the Simulated Fluorescein Display) are also displayed
on this form. Selections may be made for type of peripheral curve blend, center lens thickness, and
special edge designs. For example: a lens that will ride high on the cornea due to an area of superior
steepening (located when viewing the Color Map) may indicate the need for a prism ballast. Select
'Prism Ballast' from the Special edge design box, and notice another box ('Prism Ballast Choices') will
appear below. You may specify the amount of prism to be added, from a range of .50 Diopters to 3.00
Diopters. Special lab instructions may be typed in the 'Notes' box. Dispensing information can be typed
in the lower right hand box located at the bottom of this form. You may select from a list of authorized
laboratories from which to order the lenses, or type in your own laboratory's name, phone and fax
numbers. Laboratories that have been added will appear in the list the next time you return to this
screen. The 'Ordered By' and 'Delivery' boxes can be customized for your clinic in the same manner.
Click on the 'Print Order' button to print a hard copy of the order form for your patient's records, or to
use to fax directly to the lab.
How to fit a Manufacturer's Design RGP Lens
Upon entering the contact lens fitting software, select a protocol on the Patient Evaluation screen. Enter
the patient's spectacle refraction, and select all other fields necessary. Select RGP on the right and left
eye information boxes. Click on the 'Continue' button on the bottom of the screen. On the RGP
Selection screen, click next to 'Select From Manufacturer's Designs' for both the right and left eyes.
Selecting the 'Auto-Fill OU' button will fill in the default manufacturer or stock lens information
designated in your protocol. However, selection can be made independently by simply selecting a lens
name, diameter, lens material and color choice. Selections for the right eye can be automatically
transferred to the left eye by clicking on the OD=OS button. Clicking on the 'More Lens Detail' button
will provide information concerning the lens you have selected, as well as manufacturer information.
Clicking on the individual folder tabs (Lens Info., Manufacturer Info., Additional Info., Custom Info.)
displays files specific to each lens material or design. Proceed to the simulated fluorescein display by
clicking on the 'Fluorescein Display' button.
Note: The software will select the appropriate base curve based on the sagittal depth specified
in your fitting protocol, and the lens diameter selected. It does not use the manufacturers' own
fitting methods or nomograms to design a lens.
Simulated fluorescein patterns and tear depth graphs are displayed for both eyes simultaneously. A
grid representing 1 square millimeter divisions overlay the simulated fluorescein pattern. The scale to
the left of each pattern corresponds to the amount of fluorescein (in microns) simulated for the contact
lens as it would appear on the cornea. The default values for the Absolute view of the fluorescein scale
are from zero to 75 microns, and have been determined to be the most realistic values for fluorescein
simulation in most cases. Each eye can be enlarged or 'zoomed' to evaluate the patterns in greater
detail. Click on the button with the arrow located in the upper right hand corner of each eye to activate
the 'zoom' function.
11
Reposition Lens button: Clicking on this button enables you
to view the pan and tilt controls of the software. Pro-Fit TM ~ the
only software package that provides an interactive analysis
with automatic or manual lens tilt as well as manual lens
positioning. Replicating the actual position of the contact lens
on the patient's eye image is accomplished by moving the
simulated lens (as if you are facing the patient) right (+
numbers) or left (-numbers) in 0.1 mm increments. The Pan
U/D enables movement of the contact lens up ( + numbers) or
down (- numbers) in 0.1 mm increments to correspond with
superior or inferior displacement of the contact lens. Click on
the Up/Down arrows on the right hand side of each box to inFigure 9
crease/decrease the numbers, then click on the 'OK' button to
view the change in the Simulated Fluorescein Display. The Tilt controls default to 'automatic', as the
system normally computes the best lens tilt angles for any Pan position. Tilt is best described in
relationship to each individual's topography. A lens will tilt in the direction of the steepest part of the
cornea. This function enables the EyeSys software to replicate simulated fluorescein patterns as they
actually would appear on the patient's cornea.
Recalculate button: Click on this button when changes have been made to any of the lens parameters
to display a new fluorescein pattern for the modified contact lens design.
Show Color Map button: To visually correlate the patient's corneal topography and the simulated
fluorescein pattern, a color map can also be viewed next to either of the fluorescein maps. Click on the
'Show Color Map' button and a normalized color map will appear. Viewing the Color Map is helpful in
determining where the contact lens will position, once it is placed on the patient's eye. A contact lens
will always attempt to position over the area of greatest steepening, thus moving away from a flat area
of the cornea. When looking at the color map, use the Pan function to position the simulated lens over
the steepest area of the cornea. The simulated fluorescein pattern will change to reflect the new
position of the contact lens. Once the Color Map is displayed, the user may select to overlay different
features by clicking on the 'Color Map Options' button. Click on 'OK' to close this feature.
Sagittal Meridian and Circumference Graphs: The Sagittal Meridian Graph initially displays the
amount of tear film thickness across the flat meridian of the patient's cornea. The clinician can select
any other axis to view by simply clicking the left mouse button anywhere on an axis inside the fluorescein pattern. The position of the mouse cursor is located by the angle notation located at the bottom of
the graph. To view the circumference graph, click on the button next to the word 'Circumference'. The
data initially displayed is at the center of the lens, thus giving the user a quick read-out of the central
sagittal depth. The clinician may select any radius around which to display the amount of tear film
thickness for 360 degrees by clicking on an area with the left mouse button. The distance from center is
indicated in the lower portion of the graph. When there is missing data in the periphery of the eye
image, the software uses extrapolation and indicates extrapolated data points with red dots on the
circumference graph.
12
Suggested Parameters: This group of controls initially displays the software suggested contact lens
parameters. The controls allow modification to some of the following:
BC (diopters or millimeters):
Lens Power (Diopter):
Diam. (mm):
Corneal e:
Axial Edge Lift:
The lens base curve
The lens refractive power
The overall lens diameter
The eccentricity value of the patient's cornea
A display only field for the distance between the edge of the
contact lens, and the virtual prolongation of the lens base curve
The software has determined the base curve based on the sagittal depth previously specified in the
fitting protocol and availability of the appropriate base curve by the manufacturer. Note: if a base
curve is not available to produce the sagittal depth specified in the fitting protocol, the software
will recommend the closest base curve available from the manufacturer to produce the
specified lens/cornea relationship. Optical zone values and peripheral curve information are not
displayed for manufacturer designed lenses, as this information is often proprietary and not available to
the general public. The user has the option of changing the base curve of the suggested lens. You will
be able to select from only the base curves available for the selected diameter. Modifications to the
base curve can be achieved manually by clicking on the Up/Down arrows on the right hand side of each
box, then clicking on the 'Recalculate' button. The simulated fluorescein display will then reflect any
operator entered changes. Any change made to the base curve of the lens will automatically change
the power
Reset Fitting Values button: Clicking on this button restores the original parameters suggested by
software to all fields, once a modification has been made.
Print: Clicking on this button will print a hard copy of the fluorescein screen, once the screen is exited.
You may return to either the RGP Selection screen, or proceed to the Lens Order Form by clicking on
the appropriate buttons located at the bottom of the screen.
Once a lens design is complete, click on the Lens Order Form to view the order, or to produce a hard
copy of the patient's contact lens prescription.
RGP Order Form:
The patient's name, ID number and today's date appear on the order form automatically. The lens
parameters (determined in the Simulated Fluorescein Display) are also automatically displayed on this
form. Special lab instructions may be typed in the 'Notes' box. Dispensing information can be typed in
the lower right hand box located at the bottom of this form. You may select from a list of authorized
laboratories from which to order the lenses, or type in your own laboratory's name, phone and fax
numbers. Laboratories that have been added will appear in the list the next time you return to this
screen. The 'Ordered By' and 'Delivery' boxes can be customized for your clinic in the same manner.
Click on the 'Print Order' button to print a hard copy of the order form for your patient's records, or to
use to fax directly to the lab.
Using Pro-FitTM to select soft spherical and soft toric lenses
Contact lens selection and ordering utilizes an extensive and comprehensive database that is updated
on a regular basis. The software does NOT recommend a specific lens to best fit the patient, as there
13
are hundreds of lens names in the database from which to choose. The software WILL calculate a
suggested power for the lens. Suggested power calculations are based on spherical equivalent formulas, vertex distance compensation, and monovison considerations. When using the software for toric
lens fitting, the suggested power of the lens may not always be available for the selected lens name.
We suggest ordering the CLOSEST lens parameters in this situation, or selecting another lens that may
provide the exact power needed.
Upon entering Pro-FitTM software, select a protocol on the Patient Evaluation screen. Enter the
patient's spectacle refraction, and select all other fields necessary. Click on either 'soft spherical' or 'soft
toric' for one or both eyes. Click on the 'Continue' button at the bottom of the screen.
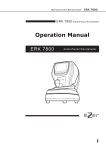
The contact lens database is sorted by daily wear lenses, extended/flex wear lenses, or you can
choose from a combined list of lenses with various wearing options. Information located in the toric lens
and spherical lens analysis box refers to previously entered refraction information, suggested power for
lens selection, and simulated over refraction power calculations for the suggested power (see Figure
10).
Lenses may be selected by manufacturer, or by the lens name in alphabetical order. Selecting the lens
name first will automatically fill in the manufacturer's name. The software will indicate which base
curves are available for that particular lens, as well as diameter, power, and lens color information.
Should you choose a lens power different from the suggested power, the software will now note this as
the 'User Selected Power' and recalculate the simulated over refraction. The original suggested power
can be accessed by clicking on the 'Suggested Power' button. The Trial Fit function can be activated
for soft toric lens fitting (see Figure 11). Click on the 'Trial Fit' button, and enter the amount and
orientation of rotation that is present with the trial lens you are fitting on the patient. The software will
automatically recalculate the axis necessary to fit the patient. Computations based upon trial lens fitting
will be highlighted in red. You must then re-select the appropriate axis in the axis field box.
To clear all fields once a selection has been made, click on the 'Reset Lens Parameters' button.
Extensive information regarding the selected lenses can be accessed by clicking on the 'Show More
Lens Detail' button (see Figure 12). Lens material name, water content, oxygen permeability, and
recommended disinfecting systems can be displayed by clicking on the 'Lens Info.' Folder tab at the top
of the screen. Manufacturers' address, telephone numbers and customer service lines can also be
referenced by clicking on the 'Manufacturer Info.' Folder tab. Most toric lenses (U.S. version only) have
the manufacturer's fitting guide scanned into the database for quick and easy reference. The 'Additional
Info.' Folder provides lens care recommendations, as well as noting the life expectancy of the material
selected. 'Custom Info.' Displays availability of custom design parameters and all color choices for the
selected lens material.
Once the lenses have been selected for both eyes, click on the 'Lens Order Form' button at the bottom
of the screen.
The Soft Lens Order Form can be printed to use as an order form, and/or to insert into the patient's
record (see Figure 13). Patient information is automatically printed on the form, as well as the Clinic
name and address entered in the Protocol screen. The telephone and FAX numbers must be entered in
the appropriate boxes at this time, also. Once this information is entered, it will become a choice for
selection for future ordering. The 'Ordered By' box may be customized in the same manner. There are
three pre-programmed choices in the Delivery box, however this box can be customized with your own
selections, too. Notes or comments to the lab or dispenser can be typed in the 'Comments' box. Click
on the 'Print Order' button for a hard copy of this form.
14
Figure 10
Figure 11
Figure 12
Figure 13
Post Fitting Considerations
Follow Up Analysis
Clinicians use several criteria for determining whether a rigid or soft contact lens is fitting properly. One
of those criteria is if corneal measurements have been maintained within certain limits. Measurements
taken on follow up visits that are within + (plus) or - (minus) .50 diopters of the original keratometry
readings are considered acceptable when measured by keratometry. The quality of the reflected
keratometry image is another measure of whether contact lenses are fitting properly. However, since
the keratometer derives its measurements from a very limited area of the central optical zone of the
cornea it is not necessarily the best tool for evaluating effects of contact lenses on corneal topography.
Computer assisted videokeratography provides a more comprehensive view of the cornea. Not only
can the clinician determine if simulated K's at the three millimeter zone are within + (plus) or - (minus)
.50 diopters of the original readings, but the clinician can compare quantitatively, readings at the three,
five and seven millimeter zones by semi-meridians. By comparing post-fitting data to pre-fitting data,
the clinician can determine the presence, location and degree of corneal warpage, distortion and/or
apical displacement that may be caused by improperly fit contact lenses. This information along with a
qualitative evaluation using the EyeSys Color Map illustrates the effect of the contact lens on the
patient's corneal topography and provides a more accurate picture of corneal topography changes
induced by the wearing of rigid or soft contact lenses. On each follow up visit, computerized
videokeratoscopic imaging is performed and the new data is compared to the prefitting data. Most of
the display screens can be used for comparative purposes.
15
The Difference Map display is useful in checking the cornea for changes that could be taking place from
one visit to the next. This display subtracts the difference in curvature obtained from one exam from a
second exam. The Difference Map is displayed using a separate normalized scale in half Diopter steps,
which allows the fitter to assess areas of the cornea that have been affected by the lens. Viewing data
in this manner can demonstrate that a lens may need only minor modification to the peripheral curve
system, as opposed to major changes in the overall fitting method or design. Once modifications have
been made to the lens, the cornea can be imaged again, and assessment made by viewing the
difference Map displays.
Refitting the Previous Wearer
Computerized videokeratography can play a vital role in refitting rigid contact lens wearers who have
developed corneal warpage from poorly fitting rigid contact lenses. A key function of videokeratography
in refitting rigid contact lenses is the system's ability to demonstrate when a cornea is stable. Serial
viedokeratoscopic images are performed on successive visits until the simulated keratometric readings
are stable and the topographic color maps indicate similar scaling and patterns. Once stability has been
achieved, the patient is ready to be refit. After the patient has been refit, videokeratography allows the
clinician to follow and maintain a stable fit by evaluating corneal topography on subsequent visits.
It is also possible to refit rigid or soft contact lenses without discontinuing the use of lenses and waiting
for the cornea to become stable. It requires the clinician to obtain keratometry measurements from a
time when the patient had been without their lenses for a minimum of one to two months. This
information may be obtained from the patient's original contact lens fitter, or from a subsequent fitter.
(As long as the patient has been out of lenses for an extended time, the K readings can be considered
relatively reliable). Once the clinician has the original K readings, videokeratoscopic images should be
obtained. If the patient's original K readings differ from the videokeratograph K's, the base curve of the
lens to be fit is calculated using the original K data, This base curve is then substituted in the Simulated
Fluorescein Display screen. The simulated fluorescein pattern and sagittal vaulting effect over the
patient's current topography are then evaluated. If the lens parameters produce a reasonable
fluorescein pattern and vaulting effect, this lens should be ordered. If the parameters produce a poor
vaulting effect, the base curve and or diameter and peripheral curve system can be altered on the
Simulated Fluorescein Display screen until the desired vaulting effect is achieved. If the wearing of
contact lenses has caused the K's to flatten significantly, and lenses are reordered based on the
original K's, the clinician may find that the Simulated Fluorescein Display will show a tremendous
increase in the sagittal values. However, in time, the patient's cornea will stabilize and this reading will
become more normal.
This method of refitting may slow the cornea's ability to stabilize. To date, there are no statistically
significant long term studies using computer assisted videokeratography which demonstrate the time it
takes for the cornea to stabilize using this or any other refitting method. If this method is used, it would
be wise to inform the patient that it may take from one month to one year for the cornea to stabilize.
However, using the information from the Map displays and the patient's best-corrected acuity with a
manifest refraction, the clinician can determine when corneal topography has become stable.
16
Special Lens Fitting Applications
Art and science go hand in hand when it comes to fitting patients who have Keratoconus, corneal
transplants, refractive surgery and other corneal irregularities due to trauma or corneal disorders.
Although the EyeSys Corneal Analysis System currently does not have a contact lens fitting program to
design rigid lenses for these typically very difficult cases, analyzing the data produced by the Color
Maps can decrease patient chair time and reduce the number of diagnostic lenses necessary to
achieve a good fit.
Keratoconus
Current methods of fitting rigid contact lenses on patients with Keratoconus involve the use of standard
design lenses on patients with incipient cones, and the use of either the Soper Cone, McGuire Cone or
Aspheric and Bi-Aspheric lens designs on moderate to advanced cones. For any fit to be successful,
the clinician must be able to identify the type, size, position and degree of advancement of the cone.
Although cones can be located any where on the cornea, most begin in the inferior temporal region of
the cornea. Using computer-assisted videokeratographs, the clinician can determine if a cone exists
long before there are clinical signs. They can identify the shape of the cone, locate the position in
relationship to the center or mid line of the cornea, determine the degree of steepening and determine
where to start with diagnostic lenses.
Proposed Methods for Choosing Diagnostic Lenses
Several methods have been proposed for determining how to choose the best diagnostic lens. Two of
these methods are as follows:
Averaging Method
Using the topographic Color Map, the clinician places the cursor on the steepest area of the cone and
records the radius at that point. The flattest reading of the cornea is then located and is recorded. The
average of these two readings is used to select the initial diagnostic lens. For example: if the steepest
reading is 56.37 diopters and the flattest reading is 42.12 Diopter, the average of these numbers is
49.25 diopters. A diagnostic lens with a 49.25 Diopter base curve is tried on the patient. If the majority
of the cone is located close to the midline, a Soper Cone design lens with a base curve of 49.25 with a
43.00 Diopter flange could be tried (over all diameter 7.5 to 8.5 mm). If an aspheric lens design is tried,
the clinician would select an initial diagnostic lens with a 49.25 Diopter base curve (diameter 8.0 to 8.5
mm). Usually small central cones can be fit with small diameter lenses, starting around 7.5 to 8.8 mm
regardless of the lens design.
If the cone is grossly displaced, the same base curve of 49.25 diopters either in the Soper Cone design
or an aspheric design should be tried first. However, the clinician will need a larger diameter
(somewhere between 8.8 and 9.5 mm) and a larger optical zone to insure the patient's field of vision
will be adequately covered.
17
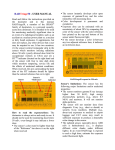
Apex Value and Size Method
A second fitting method utilizes the relative size of the cone and the degree of steepness at the apex of
the cone to determine what base curve should be used for the first diagnostic lens. With this method,
the cursor is placed on the steepest reading of the cone, and the reading is noted. The clinician then
moves the cursor 2.5 mm laterally to the right of the cone, then 2.5 mm to the left of the cone, and
records those readings (see Figure 14 on page 20). These two peripheral readings are then averaged.
This average is used to select the initial diagnostic lens. For example, if the reading nasally 2.5 mm
from the steepest reading on the cone is 52.50 diopters and temporarily 59.62 diopters, the average is
56.00 Diopters. An initial diagnostic lens with a base curve of 56.00 diopters is tried on the patient.
Again, the design of the lens and the diameter will depend on the location of the cone and its relative
size. As with the previously mentioned method, the optical zone and diameter of the diagnostic lens
should be sufficient to satisfy the patient's optical needs.
Either one of these methods should provide the clinician with adequate information to determine the
best starting point for diagnostic lens evaluation. The initial diagnostic lens will determine whether the
clinician needs to go steeper, flatter, smaller or larger. Using these methods can decrease the amount
of time spent trying different diagnostic lenses and should produce more successful fits. The choice of
using one type of lens design over another is up to the clinician and what they are comfortable with. In
general, aspheric and Bi-aspheric cone designs work best with small central cones that are located
close to the midline of the cornea, whereas the Soper Cone lens works well for almost all cones.
Piggy Back Fitting System
On advanced and difficult to fit cones it may be necessary to fit the patient in a piggyback system.
Although this type of fitting is more cumbersome and requires greater patient compliance, the rewards
can be great in the form of relieving the stress over the cone, reducing the risk of corneal abrasions and
increasing the visual acuity for many of these patients. A soft lens with a high DK value is first fit on the
patient. Once the best soft lens has been determined and the lens in on the patient's cornea, a
videokeratoscopic image is taken of the front surface of the soft lens. If the curvature findings and
overall topographic findings over the soft lens are suitable, simulated K's over the soft lens are used to
determine the base curve of the rigid contact lens. Particular attention should be paid to the proper
fitting of the RGP lens to insure that it will move freely over the surface of the soft lens and position
adequately over the patient's visual axis. If the lens does not move the effect of two lenses can cause
corneal edema and decreased visual acuity.
Refractive Surgery
The term refractive surgery is used here to cover all corneal surgery performed to alter the patient's
cornea in an attempt to meet a particular visual need. Although there are many of these surgeries being
performed everyday, not all will be successful as the surgeon or patient may want them to be. Surgical
manipulation of cornea topography with a poor result can be quite challenging to the contact lens fitter
Most clinicians agree that it is best to wait at least four to six months after most refractive surgery
before the fitting of contact lenses is to be considered. Once the cornea is deemed stable, fitting
contact lenses on these patients can be made easier using computer assisted videokeratography. A
videokeratoscopic image of the patient's cornea is first obtained. Information from the Color or Numeric
Map is used to determine an initial lens for diagnostic purposes. Generally, the central three millimeters
of the topography is grossly affected by the surgery, therefore data at 3 millimeters is of little value in
fitting these patients. Data from the mid-periphery approximately three to four millimeters from
geometric center measured by semi-meridian or the readings at the 5 mm zone on the Numeric Map
18
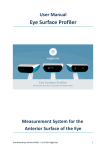
are used to determine the base curve of the diagnostic lens. For example, the radius of curvature in the
center of the cornea may read 34.00 diopters, while at four millimeters from the center the reading is
44.50 diopters (see Figure 15 on page 20). In this case a 44.50 Diopter lens with a 9.0 mm diameter
would be the first choice for the diagnostic contact lens. If an air bubble formed under the lens, the
clinician would need to go to a flatter base curve, such as a 40.00 Diopter lens, and increase the
diameter of the lens to 9.5 or 10.5 millimeters. It is necessary to use a large diameter lens when fitting
this much flatter to achieve stability and the best centering.
RGP lenses will usually position over the steepest portion of the cornea. If the superior cornea demonstrates a greater area of steepening, the lens will probably want to ride up under the upper lid. If the
inferior portion of the cornea has a greater area of steepening, the lens will ride low. It may be
necessary to order special lens designs to help center some lenses. For lenses that ride high, a prism
ballast lens may be used to help position the lens properly. If the lens rides low on the cornea, it may be
necessary to use a lenticular design to lift the lens. In some cases, just going to a slightly larger
diameter or steeper base curve will be sufficient to stabilize, if not center, the lens.
Several rigid contact lens manufacturers make lenses with a periphery that is steeper than the base
curve. These lenses were first developed for clinicians who were attempting to fit patients using
orthokeratology. This type of lens has a flatter base curve to fit the flatter central cornea and steeper
periphery to fit the steeper transitional zone of the cornea.
Aspheric lenses have been used in some refractive surgery cases, however these lenses work best
when the central cornea is steeper than the transitional and peripheral zone of the cornea.
The beauty of videokeratography in working with refractive surgery patients is that the clinician can
easily visualize the corneal topography, which is a wonderful aid to help the clinician select the right
contact lens for these patients.
Post Keratoplasty
Some clinicians prefer to wait until the patient is one year to eighteen months post-op and/or after
sutures have been removed before the fitting of contact lenses are initiated on a cornea transplant.
Others fit lenses within one to two months with all sutures intact. Most clinicians initiate fitting around
four to six months post-op, usually because the patient has become impatient with not being able to
see as well as he would like to. Most post keratoplasty patients require the fitting of a rigid contact lens
due to high degrees of irregular corneal astigmatism. Some have very flat grafts in relationship to
steeper hosts and others have very steep grafts in relationship to grossly flatter hosts. In all of these
situations, computer assisted videokeratographs are valuable tools in determining the best fit for post
keratoplasty patients. Data from the simulated K readings and information from the Topographic Color
Map is used to choose an initial diagnostic lens. The following chart is designed to give the clinician a
starting point for choosing a diagnostic lens.
Simulated K's:
Suggested Base Curves:
Suggested Diameters:
34.00 to 49.00 Diopters
38.00 to 40.00 Diopters
9.5 to 10.5 mm
42.00 to 49.00 Diopters
Standard Fit
9.0 to 10.5 mm
42.00 to 70.00 Diopters
48.00 to 60.00 Diopters
9.0 to 9.5 mm
For example, if the largest area of the graft is flat with a smaller area of steepening, the clinician should
choose an initial diagnostic lens with a flat base curve and a 10.0 mm diameter. If the graft measures
between 42.00 diopters in the flat meridian and 44.00 diopters in the steep meridian, the patient can
quite possibly be fit using standard fitting methods. It may be necessary to use a larger diameter of
between 9.0 and 10.5 mm. If the greatest area of the graft is steep, a diagnostic lens with a steep base
19
curve such as 48.00 diopters and a diameter around 9.0 mm to 9.5 mm should be used. After
performing a slit lamp evaluation of the initial diagnostic lens, the clinician will know whether to go
steeper, flatter, smaller or larger and whether a special lens design will be necessary to help center and
stabilize the lens over the graft.
There are several factors that affect how a lens will position and move over a corneal graft. The lens
will always attempt to position over the area of greatest steepening. If the patient's cornea is steeper in
the inferior temporal quadrant, the lens will position low and temporal on the cornea. In most
circumstances it will be necessary to use larger diameters in the range of 9.0 to 10.5 mm as mentioned
previously to help center and stabilize the lens over the patient's visual axis. The degree of steepness
at the graft host junction will directly affect the way the lens positions on the cornea and will dictate
which lens design is best suited for the patient. It may be necessary to order an orthokeratology type
design, aspheric, lenticular, prism ballast, cone, softperm or piggyback lens design td improve the
centering and movement of the lens. It should be noted that with the Softperm and/or piggyback lens
designs, these lenses and lens combinations may decrease the amount of oxygen to the cornea. For
some corneal transplant patients, insufficient oxygen transmission may cause graft rejection. When
Softperm or piggyback lenses are used, these patients should be followed frequently. To maximize the
amount of oxygen available with piggyback fitting systems, both of the lenses should have a high DK
value.
Figure 14
Figure 10
Eyesys, Eyesys Technologies and EyeSys Software are registered trademarks; Pro-Fit and Eyesys 2000 Corneal Analysis System are
trademarks of EyeSys Technologies, Inc. Copyright © EyeSys Technologies, Inc. 1995. All Rights Reserved. Printed in the U.S.A. 1997.
20
This page intentionally left blank