1
ADMINISTRATION
CENTER
2.0
eMPATHY ANALYTICAL
INTERFACE
FUNCTIONALUSER
SPECIFICATIONS
MANUAL
13. CUSTOMISED REPORTING
The eMPATHY application allows you to customise the already-created reports in the List,
Chart, Map, and Report modules, i.e. to define the way the numeric values can be
displayed, their format, the number of the items to be displayed, etc. You may also reorganise the reports in the desired way, i.e. include it into a group of reports or create a
new report group for it, rename the report, etc. The eMPATHY application can also export
the reports to the desired format (Word, Excel, etc.) or print them out.
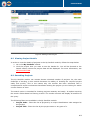
13.1 Setting Report Options
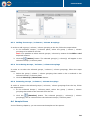
In the List and Report modules, you can set the report options, i.e. define whether the
numeric values should be displayed in thousands, millions, etc.
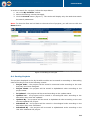
In order to set the report options, follow the steps below:
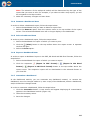
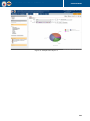
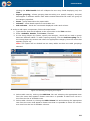
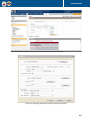
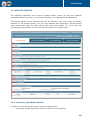
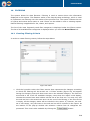
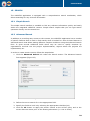
1. Click the
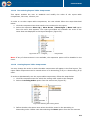
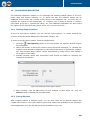
(Set Options) button in the top toolbar. An Options window (Figure
56) will appear.
2. Define the format in which the numeric values should be displayed, i.e. whether the
original values should be displayed or they should be shown in thousands, millions,
etc. This prevents large numeric values represented by many zeroes from taking a
lot of space in the report.
3. Indicate whether empty and unspecified rows should be hidden by selecting the
respective checkboxes.
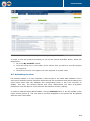
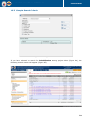
Figure 56: Setting the Chart Report Options
4. After finishing, click the Ok button for the changes to take effect. Or, click the
Cancel button to discard the changes made.
13.2 Saving Reports
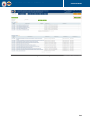
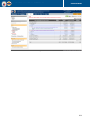
After creating reports of different types, you can save them as pre-defined reports and
include them either in the Public Reports group and make them available for all users who
access application or in the My Reports group available to you only.
68