1
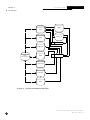
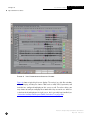
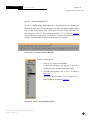
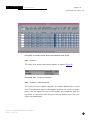
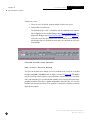
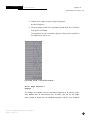
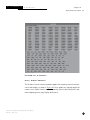
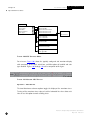
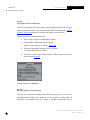
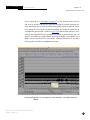
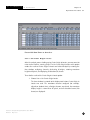
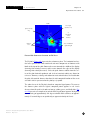
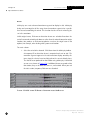
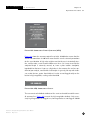
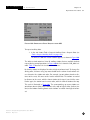
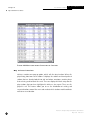
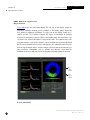
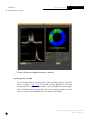
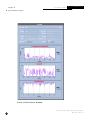
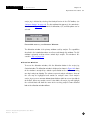
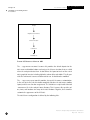
I D C
Chapter 2:
▼
D O C U M E N T A T I O N
Te c h n i c a l I n s t r u c t i o n s
Operational Procedures
The plot can be thought of abstractly as viewing the station or array from directly
above. For seismic data, a peak in the middle area of the FK plot represents signal
wavefronts striking the array nearly parallel to the earth’s surface. A peak along the
edges of the FK plot represents wavefronts striking at a significant angle to the
earth’s surface. An array station measures the apparent horizontal components of
velocity as the wavefront sweeps across the elements of the array.
Consider a seismic event that occurs at great teleseismic distance from an array. It
would deliver core phase signal energy essentially straight up to the array, and the
signal’s wavefront would be detected nearly simultaneously at all station elements.
This would imply a very high apparent horizontal velocity; the FK slowness would
approach zero. The signal energy peak in the FK plot would occur at the axes origin. It follows that as the slowness approaches zero the azimuth becomes indeterminate. For events located closer to the array the apparent horizontal velocity
decreases and the slowness increases. For a teleseismic P phase the signal energy
peak would occur inside the “10” circle, for a regional P phase it would occur
between the “6” and “8” circles, and a regional S phase peak would occur outside
all circles.
For array stations, XfkDisplay computes an FK spectrum power value for each grid
point in the FK plot. The power is computed by summing the complex valued
spectra computed from each array element’s waveform. For each grid point, the
spectra have been phase shifted1 to account for that grid point’s view of the geographical coordinates of the station’s elements. Each grid point can be thought of
as a different test case in phase shifting the waveforms. Grid points show the highest signal power when phase shifting yields the highest signal coherence among
the array elements. This shows up as a peak on the plot. The azimuth of the peak
represents the direction towards the incoming wavefront.
1. Phase shifting in the frequency domain is analogous to time shifting waveforms and is computationally
more efficient. The time shift must remain small relative to the waveform duration converted into the frequency domain. Such is the case with the small differences in arrival times across the elements of an array.
Interactive Analysis Subsystem Software User Manual
206
May 2001
IDC-6.5.1