1
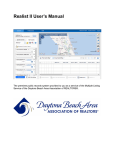
An Introductory Guide 2nd Edition - September 2014 Confidentiality Statement This guide is intended solely for the use of those individuals who receive it. The information presented, including without limitation, oral presentations, visual/graphic depictions, documents and all attachments, constitutes proprietary and confidential information and each person shall use commercially reasonable efforts to keep the information confidential and prevent unauthorized disclosure. The information contained within this document shall remain the exclusive property of CoreLogic. CORELOGIC and REALIST are registered trademarks of CoreLogic © 2010 CoreLogic Confidential to CoreLogic® The recipient of this document agrees that at all times and notwithstanding any other agreement or understanding, it will hold in strict confidence and not disclose contents of this document to any third party and will use this document for no purpose other than evaluating or pursuing a business relationship with CoreLogic, or for training purposes. No material herein may be reproduced, in whole or in part, by any means without the express written consent of CoreLogic. Unauthorized distribution is strictly prohibited. Realist® – An Introductory Guide Table of Contents 1. Logging In .................................................................................................................................................... 3 2. The Top Menu Bar ....................................................................................................................................... 3 3. The Main Realist Page ................................................................................................................................. 2 4. Preferences ................................................................................................................................................... 3 5. Realist Help .................................................................................................................................................. 5 6. My Region .................................................................................................................................................... 6 7. Quick Search ................................................................................................................................................ 7 8. My Search .................................................................................................................................................... 8 9. Understanding My Search Attributes ......................................................................................................... 10 10. The Grid ..................................................................................................................................................... 11 11. Special Indicators on the Realist Grid ........................................................................................................ 13 12. Realist Reports ........................................................................................................................................... 14 13. Printing Labels ........................................................................................................................................... 16 14. Exporting Data ........................................................................................................................................... 17 15. Printing & Emailing the Grid and/or Map .................................................................................................. 18 16. Basic Map Navigation ................................................................................................................................ 20 17. Property Detail Report................................................................................................................................ 28 18. Comparables Report ................................................................................................................................... 30 19. Market Trends Report ................................................................................................................................ 34 20. Neighbors Report ....................................................................................................................................... 35 21. Neighborhood Profile Report ..................................................................................................................... 36 22. Foreclosure Report ..................................................................................................................................... 37 23. Assessor Map Report.................................................................................................................................. 38 24. Flood Map .................................................................................................................................................. 39 25. Printing/Saving/Emailing Reports .............................................................................................................. 40 1 2 Welcome to Realist! This Introductory Guide is designed to help you rapidly explore the exciting information and tools offered by Realist. Please take a little time to review this guide, the system, and its content. You’ll be glad you did, because Realist is quite possibly the most comprehensive information resource available to the nation’s real estate professionals. Please note that this Introductory Guide describes the “desktop” version of Realist. However, Realist automatically detects users employing tablets and other mobile devices. For those users, the system will provide access to Realist Lite, a distinct and different solution that is specifically optimized for such mobile devices. 1. Logging In Realist is accessible through your MLS system, and as a result, you do not need to log into Realist. When you access Realist, it recognizes who you are and remembers your specific preferences. From your MLS system you can simply and securely: Link to the Realist home page, Link from a listing display directly to a Property Detail Page on Realist Link to other portions of Realist that your MLS may choose to support When you link, Realist opens in a new window or tab, enabling you to easily toggle back and forth between your MLS system and Realist. When you are done, simply close the Realist window or tab of your browser. 2. The Top Menu Bar At the top of the Realist interface is a menu bar with the following selections: Search is the default view enabling you to perform Realist searches, view data, and explore maps. Preferences control how you wish to search and/or display information via Realist. Help contains contact information for the team at your MLS who can field your questions about Realist, as well as links to the Realist User Guide and video Tutorials that can help you learn much more about Realist. Note that the menu bar displays your name. Realist maintains awareness of who you are and how you work to make your time on the system as efficient and personal as possible. 3 3. The Main Realist Page Once you open Realist, you will see that its main page is split into three primary panels: The Search panel on the left allows you to access, create, change and save customized searches tailored to your individual search needs. You can hide the Search panel by clicking the caret to the right of the Search panel. This maximizes your view of a Grid or Map. To re-open the Search panel, click the caret again. The Realist Map panel on the top enables you to view road, aerial or bird’s eye views for a region and its homes, to layer important public records, MLS data, and other features over a map, and to perform searches within specific areas. The Grid panel on the bottom displays the properties returned by any search in a column and row format that can be customized to suit your needs. Three options are available to manage the Map and Grid. The Split view displays the Grid below a Map. If you wish to hide the map, click on Grid. If you wish to hide the Grid, click Map. If you wish to return to the default view simultaneously showing the Grid and Map, click Split. 2 4. Preferences When you begin using Realist, you should visit Preferences to configure Realist for your personal use. Changes to Preferences are also recorded during your general use of Realist. Preferences are broken into four sections. Search Options Select the maximum number of properties to return from a search (up to 1,000). Choose to use or omit properties registered on the “Do Not Mail” list. The Do Not Mail flag is updated quarterly and identifies individuals who have registered with the Direct Marketing Association and other agencies to indicate that they do not wish to receive direct mail solicitations. When you choose to omit properties on the Do Not Mail list, mailing labels will automatically be suppressed for such properties and export files will automatically omit the owners mailing address. Choose to show or hide unmatched sale transactions. Unmatched sales are transactions on properties which are not fully reflected in the public records, typically arising from newly formed properties that are not yet individually assessed. Report Options Report Preferences controls whether reports are dynamic or fixed formats. Choose dynamic reports to suppress all fields for which a property has no corresponding data to display; choose fixed to include all fields. Comparables Report, Market Trends Report, Neighbors Report, Neighborhood Profile Report, Assessor Maps & Market Trends each enables you to set your preferences to generate these individual reports. 3 Assessor Maps allows you to choose whether or not to use Realist’s Map Viewer to view static Assessor Maps. Email Signature Enter an email signature that will appear as the footer to all email you distribute via Realist. Use the simple formatting options provided by Realist to select a font, size, color, and more. Map Options Display property boundaries, or parcel lines on the map as a default. 4 5. Realist Help Realist offers a variety of tools to introduce you to the service and answer questions that may arise from time to time. Click Realist’s Help menu to: Explore the online User Guide. Watch the video Tutorials on core Realist functionality. Determine Contact information for your MLS help desk. Read the Legal, Privacy and Microsoft policies associated with Realist use. 5 6. My Region My Region refers to the county or counties in which you wish to search. Click the Change Region link near the upper left corner of the Realist to select display a list of the counties you are eligible to search through the MLS to which you belong. Select up to 8 counties to search at a time. Each selected county will be shown on the Selected Counties list on the right hand side of the My Region box. Note that the date of the most recently recorded transactions available via Realist also appears below each selected county. Click the red Remove All symbol here to instantly clear all selected counties. To delete all previously selected counties, click the red Remove All symbol appearing above the Selected Counties list. To delete one previously selected county, click the X appearing to the left of the county name in the Selected Counties list. When your selections are complete, simply click Apply. The region you select will remain active and apply to all further searches until you change selected counties at a later time. Of course, if you do not wish to make a change, simply click Cancel. 6 7. Quick Search The Quick Search enables you to easily search by the most frequently used criteria to find properties by: Address Owner Name MLS Listing # Tax ID or APN Click the plus (+) sign to the right of a search parameter to add additional criteria. Using the plus sign, you can search for 5 owner names at a time, 10 listing numbers at a time, or 15 Tax ID’s at a time. Click “starts with” to change the search logic to “is” and solely find properties with an exact match on your search criteria. “Starts with” allows you to find properties where the first few letters or numbers of your search criteria match the property. Owner names can be searched in formats such as: Smith Smith, J Smith, John Address search is special. While you can only search one address at a time, please note that: The address search overrides My Region and searches all matching addresses available within your Realist coverage area. You can use address search to find properties at an exact address or in a general locale. For example: Search 4990 2nd Street to find a property at that exact address. Search 2nd Street to find all properties on that street. Search 2nd Street Rocklin CA or 2nd Street 95677 to find 2nd Street properties in only that city or zip code. To search street names containing numbers, enter 2nd or 5th. Searching by 2 or 5 is not sufficient. To search street names such as Saint Albans Ct, enter Saint Albans; St Albans is not sufficient. In the event an address search finds a near match to your criteria, it will “auto-suggest” up to 25 possible matches for your criteria. 7 8. My Search My Search enables you to quickly create and perform queries to pinpoint properties meeting your research and marketing needs. Many fields – or Attributes as they are known in Realist – are available for your use. Use My Search to open, create and save Forms or Searches. Forms are searches without saved criteria, whereas Searches are saved forms that also include specific search criteria. My Search will contain pre-configured searches for your use when you first access Realist. Click the Open icon to review the searches pre-configured for your own MLS, then add the searches that will help your personal, professional needs. Pre-configured searches display a lock icon such as the Geo Search picture to the right. Locked searches can be saved with a new name, but cannot be overwritten or deleted. The icons at the top of the My Search panel offer the following: Create a new Form or Search by clicking the Create icon. Creating a new Form or Search opens the Edit Data Attributes page appearing on the following page. Open an existing Form or Search by clicking the Open icon. Save changes by selecting the disk icon. A dialog box opens, allowing you to name the Form or Search. Instantly clear all search criteria and results by selecting this Clear Search & Grid icon. Open any of the last several searches you performed by clicking the down arrow by the Recent History icon. The My Search panel can be hidden by clicking the caret to the right of the My Search panel. This maximizes your view of a Grid or Map. To re-open the My Search panel, click the caret again. 8 To edit an existing My Search form, click Edit Attributes appearing at the bottom of My Search. This opens a new dialog box in which you may select or de-select search attributes and re-order the attributes. You may choose to Show All attributes, or select a data category such as Owner Information to find a specific attribute. Attributes are presented in alphabetical order. You may select up to 30 attributes to include in a search. To re-order the sequence of attributes on search panel, simply drag and drop them into your chosen order under the Selected Attributes heading, then click Apply to record and use your new or modified My Search. To delete an attribute from a search, click the “X” by the attribute name on the Selected Attributes panel. 9 9. Understanding My Search Attributes Search attributes offer a variety of controls to help you find the properties. To change any search control, click on the operator adjacent to the search attribute to open a drop down selection of available controls. Numeric attributes such as House # default to find exact numbers using the “is” control. Numeric attributes also offer controls to search a range (is between), as well as greater than or less than a number. Text attributes such as Owner Name default to a starts with control, enabling you to find any result that matches the first few letters you enter into the search box. Text attributes also offer an is control to find exact matches. Some attributes allow you to search and/or choose values by Select from a List, while other attributes offer a drop down for Yes / No and other options. For example, the subdivision attribute uses a select from list, while the exemption attribute pictured to the left uses a yes/no drop down list. Some attributes enable you to enter multiple search parameters; simply enter a value, click the “+” button, and then enter your next parameter. Note that the each parameter you enter is displayed below the attribute box. To remove a value, use the “X” next to that value. To clear all parameters from an individual attribute, click on the hash icon to the right of the attribute’s name, then click on Clear Values. All entered parameters are removed. To eliminate an attribute from the search entirely, simply click Delete. 10 10. The Grid The Grid displays brief information about each property found by a Realist search. Click any property on the Grid to highlight that property’s location on the Map. Conversely, click any property on the map to highlight the corresponding row on the Grid. The default sort sequence for properties on Grid is by Tax-ID or APN. To sort all properties on the Grid on a different attribute, click the sort arrow next to any column header. Up arrows indicate ascending sorts; down arrows indicate descending sorts. You can also sort on as many columns as you wish; the number next to each sort arrow indicates if it is the primary, secondary or tertiary sort column. To clear the sort order, select Edit Grid, then Clear Column Sorting. 11 Click the check box above all individual rows on a Grid to select or deselect all properties. Click Edit Grid, then Show Only Selected Rows to hide de-selected rows on the Grid. You can restore the full list of results by clicking Edit Grid, then Restore Full Results List. Rows on a Grid can also be manually dragged and dropped to totally customize the Grid’s order. To modify columns appearing on the Grid, select the Edit Grid option appearing at the lower right hand corner of the Grid. Then select Show/Hide Columns, which opens the Show/Hide Column Attributes dialog box below. From the dialog box, select or de-select the columns you wish to display on the Grid, Your selections appear on the Selected Attributes panel on the right where you can drag and drop them into the desired order. When you are done designing your personalized Grid, click Apply. A maximum of 30 columns can be selected. 12 11. Special Indicators on the Realist Grid Realist provides a series of indicators that you be included on your Grid. The available indicators, as depicted by the four columns with icons above, are respectively: MLS Photo Indicator: This indicator signifies a property for which MLS photos are available. Clicking the camera icon opens up a new window allowing you to view up to 25 agent-uploaded photos attached to a listing in your MLS listing solution. MLS Listing Indicator: This indicator signifies a property that has appeared in your MLS system. Green flags indicate active listings; orange flags indicate pending listings; red flags indicate sold listings, and purple flags indicate expired listings. Click the listing icon to open a new window and display the listing information for that property via your MLS system. Foreclosure Indicator: This indicator signifies a home with foreclosure activity; orange flags indicate properties in a pre-foreclosure stage, yellow flags indicate properties in an auction stage, and green flags indicate REO properties. Click the flag to instantly open the Foreclosure Report for that property. Distressed Sale Indicator: This indicator signifies a property for which the prior sale is likely to have either been a short sale or a bank owned (REO) sale. A purple flag predicts that the last sale was a short sale and a brown flag indicates an REO sale. 13 12. Realist Reports Realist reports convey information about the property, market trends, and the community. The reports can be accessed via the Grid or the Realist map. To open the Realist report window: Click on the View Reports button below the Grid Double click any row on the Grid to jump to a specific property Click on the report icon accessible by clicking on any parcel on a Realist map The Realist report window is pictured below. Note the series of tabbed reports accessible across the window. The default view of the report window is always the Property Detail report, but your MLS system may enable you to link from listings in the MLS system directly to other reports available from Realist. 14 The other reports are accessible by clicking the tabs appearing at the top of the report window. Reports available to your MLS may include: Comparables Market Trends Neighbors Neighborhood Profile Foreclosure Flood Maps Assessor Maps Building Sketches To close the entire report window, simply click the Close Report button appearing at the top right of the window. 15 13. Printing Labels Printing mailing labels is incredibly easy. First, select the properties on the Grid for which you wish to print labels. Then click the Print Labels button at the bottom of the Grid. A new Print Labels window appears that enables you to select label features including label type, mixed case vs. all CAPS, property or tax billing address, customized salutations, and print range. Click Print to generate and print labels. Labels are prepared in a rich text (RTF) format that can be opened using virtually any word processing software. Though the total number of records for which you can generate labels or exports is limited each month, you can save the label or export files you generate for future re-use. Though the maximum number of records displayed by a Realist search is 1,000, you can override that cap to generate 3,000 labels at a time by clicking the Create Labels button. Please be patient when you are generating large mailing lists; the process to create the labels may take several minutes. To learn more about the Do Not Mail flag, please refer to Section 4 about Preferences. 16 14. Exporting Data Exporting data from Realist is also incredibly easy. First, select the properties appearing on the Grid for which you wish to export data. Then click the Export button at the bottom of the Grid. On the Grid, check the boxes next to each property that you wish to export. Then click the Export button at the bottom of the Grid. You have the option to choose: Grid to export all checked records and the columns currently displayed on your Grid. Customize to select attributes from a wide array of choices offered through the Custom Export window pictured below. On the Custom Export window, check the attributes to export. As you do so, the Selected Attributes box displays the fields you have chosen. To remove a selected attribute, click the “X” next to it in the Selected Attributes box and it will be removed from your export. If you wish to save the selected attributes for re-use at a later time, click Save Export, which will prompt you to provide a name for the saved export format. Saved formats are available for later use via the My Exports box on the lower right corner of the Custom Exports window. When you are ready to generate the download, click Export. Exports are prepared in a CSV format that can be opened using virtually any spreadsheet software. Export files can also be saved for your future re-use. Though the maximum number of records displayed by a Realist search is 1,000, you can override that cap to export 3,000 records at a time by clicking the Export Results button. Please be patient when you are generating exports; the process to create the labels may take several minutes. 17 15. Printing & Emailing the Grid and/or Map and Saving Map Printing and Emailing the Grid and/or Map are popular and easy-to-use Realist features. To start, simply click Print Grid/Map or Email Grid/Map. Print Email/Grid Selecting Print Grid/Map displays the dialog box appearing to the left. Choose to print Map Only, Grid and Map, or Grid Only. The report generated for the Grid is a PDF, with a multi-line representation of the columns on the Grid that is formatted specifically for effective printing. 18 Email Grid/Map Selecting Email Grid/Map displays the dialog box appearing to the left. Complete email requirements, including at least your email address and that of your recipient, plus any changes you wish to the subject line, body of the email, and your signature. Then select to email the Map Only, Grid and Map, or Grid only. The selected report will be attached to your email as a PDF. Save Map Selecting Save Map displays the dialog box appearing to the left. You can choose to Open the Map Image, or Save the Map Image to your computer. The map image will display exactly as it is on your screen, including any properties or layers you may have selected. 19 Basic Map Navigation Core Features Realist maps offer core features and controls on the upper left hand corner of the map. They are: Click the Plus (+) or Minus (-) signs to Zoom in or out; alternatively you can zoom by using the left or the scroll wheel on your mouse. Click points of the Compass to pan the map left, right, up or down. You can also simply click and drag on the map to the map to pan in any direction. Click Road to display roads, significant geography, as well as principal points of interest. This is the default view each time Realist maps are initially displayed. Click Aerial to layer photographic imagery of the homes and terrain over the road view. Click Hybrid to layer street names and geographical references over an aerial view. Click Birdseye to view homes and terrain at an oblique angle. Birdseye enables you to view the image from four vantage points; click each point on the Compass to rotate through the views. Birdseye also supports two zoom levels; click the Plus or Minus sign to select the zoom level you prefer. 20 Identify Click any location for which the boundary lines of a property are displayed to display thumbnail information about the property. The pop up offers the following icons and corresponding options: Click the Magnifying Glass to zoom directly to a detailed map view of the property. Click the Ruler to display estimated lot dimensions for the property. Click the Left/Right Arrows to link directly to your MLS system and a view of the detailed listing information. Click the Search All Units icon to open a Realist Grid view of all the properties located in a multi-unit building. Click the Report icon to view the Realist Property Detail and other reports for the property. Click the Photo icon to open a new window displaying a gallery of listing photos for the property. The displayed options will vary from property to property. For example, the Photo icon will only appear when photos are available for the specific property. 21 Introduction to the Map Tools Each icon appearing on the top right of the Realist map opens a suite of corresponding tools. They are: Shape Drawing Tools enable you to define one or more areas on the map in which you wish to search or obtain dimensions. Note that drawing tools are not accessible when you are using Quick Search; please click My Search to enable the drawing tools. Boundaries enable you to overlay boundaries for zip codes, cities, school districts and other areas on a map. Property and Sales Information enables you to identify properties that are distressed, multiply listed, recently sold, or to display properties characteristics and current valuations. Trends enable you to display heat maps that show sales, valuation and distressed property trends by zip code or neighborhood. Points of Interest enables you to display the location of local businesses and services in a neighborhood. Driving Directions enables you to plot point to point directions on a map, accompanied by a turn by turn narrative for the trip. Locate on the Map enables you to enter an address, town, or key point of interest on which to recenter the map. Clear Map Tools enables you to instantly clear the layers you have displayed on a map and begin anew. To open a tool and view its corresponding options, click on the corresponding icon. To hide the tool, click on the icon again. Layers selected using map tools are displayed on a map concurrently. For example, you can concurrently display neighborhood boundaries along with flags locating properties that sold in the past 12 months. But you can only display 6 layers on a map at a time; you cannot insert additional layers until you use Clear Map Tools to clear all layers or disable specific layers. Users find they use the same layers again and again on Realist maps. For that reason, Realist memorizes the layers you last chose to view and will show them again on your subsequent visits to Realist. The following sections provide additional insight into using each individual map tool. 22 Shape Drawing Tools Click Radius, Rectangle or Polygon to draw a shape in which you wish to perform a search. Radius draws a circle, rectangle draws a box, and polygon draws irregular, multi-sided shapes. You can draw multiple circles, rectangles or polygons to be searched on a map. Circles and Rectangles are drawn by clicking on the map, letting go, and moving the mouse to create the shape size, then clicking again when it is the desired size. Polygons are drawn by clicking as many points on the map as you like. Click on the point where the polygon started or by double clicking to close the shape. Shapes can be moved after they are drawn by clicking and dragging the shape. Shape sizes and dimensions can also be edited by clicking on them, then clicking and dragging the grey circles on the shapes to morph the shape and size. Each time you draw a shape, it is added to the My Search panel as a search attribute. Each shape is given a specific name (for example, Polygon 1, Circle 2, etc.) You can perform a search, then change attributes and add search criteria in the same way that you do in any other search, but the results are always limited to the constraints of the shape(s) that you have drawn. Clicking a shape provides a pop up that includes information on the size of the shape you drew and allow you to rename the shape. To delete a shape, click the “X” next to it on the My Search panel. Or, click on the shape on the map and select Delete Shape via the pop-up window. Or, click the Clear All Shapes selection on the Map Tools menu. Shapes can also be hidden or shown using the Hide/Display Map Shapes button on the menu bar. Searches can span one or more shapes you draw on a map, but the maximum area of all defined shapes for which Realist will search is 6.875 square miles. Line Tool enables you to measure the distance between points on a map. Clicking on the map allows you to change the direction of your measurement and offers a running total of the distance of the line you have drawn. Double click to end the line to terminate drawing. 23 The Annotation tool enables you to enter and display on the map. Clicking and dragging allows you to move the text box in a desired location. You can delete the text box by clicking on it and selecting delete. Boundaries It is often important to know whether a home is located in or outside a city, school district or other jurisdiction. Boundaries can help! Click Parcel to display the lot lines of each property. Parcels appear only when the scale displayed on the map’s lower right hand corner is 150 yards or less. Click Zip, City, County or Unified School District to display the boundaries of each. Click Neighborhood to display the boundaries of common neighborhoods on the map. Click MLS Area if these boundaries are supported for your MLS. Selected boundaries appear in a legend at the bottom of the map indicating the color of each. If a boundary does not appear in legend, it is not available at that level of resolution. 24 Property & Sales Information Maps spring to life when you overlay property and sales information. Each item you select appears on a legend at the bottom of the map. Click each category to open the options; click the category again to minimize its options. Click Distressed Properties to select and plot the location of pre-foreclosure, auction, or REO properties, as well as the locations of short sales or REO sales. Click Sales and Values to flag: Tax Sales recorded sales in the past 3, 6, 9 or 12 months. Tax Sales include FSBOs. RealAVM to plot estimated values on top of each property. Click MLS Status to flag the location of Active, Pending or Expired listings. Sold and expired listings must be filtered within 3, 6, 9 or 12 months. Click Property Characteristics to overlay information such as lot area, bed/bath, or building area of properties on the map. Note that the tool bar pictured to the right shows the flag associated with each selection. As shown on the sample map below, the selected flags are also displayed on a legend at the bottom of the map. Note that tools such as Lot Area without a corresponding icon display the data itself overlaying each property. 25 Trend Layer The Trend Layer enables you to visualize patterns related to home sales, values and distressed properties on a map. You may know these layers as heat maps or thematic maps. To display a Trend Layer, you must select: Type of trend: Such as Median Sale Price, Sales Activity, or % of homes in Foreclosure. Select None to turn off the Trend Layer. Aggregation Level: Select Zip Code or Neighborhood Property Type: Select Single Family Residential, Condos or both. You can optionally select an Opacity Scale. Think of opacity as the level of transparency. Lower opacity reveals more of the underlying layers; higher opacity obscures the underlying layers. Click on an area while pressing the Ctrl key to see more information about the trend data in a specific neighborhood or zip code. Points of Interest Points of Interest enable you to depict the location of businesses and services near a home or in a community. For example, you may wish to show a prospective buyer the location of restaurants and shopping locations near a home. Click the icon for each point of interest displayed on a map to learn the address and contact information about that point of interest. 26 Driving Directions To load driving directions on the map, enter the starting and ending point in the Drive From and Drive To dialog box. To automatically populate address information into the boxes, right-click on the map and select Drive From or Drive To. Directions can be set for shortest time, distance and round trip calculations. They can also be printed or emailed from Realist by using the Print or Email buttons at the bottom of the Directions Toolbox. To remove driving directions from the map, you must click in the Clear button contained in the Driving Directions dialog box. 27 16. Property Detail Report The Property Detail Report is the key and default Realist report for properties. Navigating the Property Detail Reports To the right of the Property Detail Report is a vertical list of all properties appearing on the Grid. Click any property on the list to view that Property Detail report. Or click on the left or right arrow above the list to navigate to the previous or next property on the list. Report Sections While the content of each Property Detail reports vary from county to county, property to property, and MLS to MLS, Property Detail Reports are universally organized by grouping like data in sections such as: Property Summary Owner Information Foreclosure Information Location Information Tax Information Assessment & Tax Table Characteristics Features Estimated Value Listing Information 28 Last Market Sale & Sales History Mortgage History Foreclosure History Property Map Section Controls You can show or hide sections that appear on the Property Detail Report by clicking on the Modify button below the report window, then selecting Display. Then click on each section of the report you wish to show or hide. When your selections are final, move your mouse outside the selection box to finish. Realist memorizes your selections and will continue to show the selected sections until you modify the sections you wish to view again. The choices you make here also directly impact the content of reports you print or email. For example, to remove mortgage history from an email to a client, hide that report section before printing or emailing the report. County Links Depending on the Realist configuration developed for your MLS, Property Detail Reports may also include links: From the APN or Tax-ID to the county assessor’s site to display assessor information From a County Treasurer button to a county treasurer’s site to determine tax payment status From the document number to the county recorder’s site to display a copy of the recorded document 29 17. Comparables Report Click the Comparables tab to automatically display a list of potentially comparable sales, select the one you wish to use, and then click Generate Comparables Report. If you wish, you may also modify the default search criteria and re-run the search prior to selecting the sales you wish to use. Selecting Comparables When a comparable search completes, it displays: A Comparables Map on the upper left depicting the geographic location of the subject and each prospective comparable Summary Statistics on the upper right depicting high, low and median metrics about the selected comparables. A Comparables Grid on the lower half of the window depicting basic facts about the Subject property on the top row and prospective comparables on subsequent rows Each row on the Comparables Grid can be selected or deselected. As you select and deselect properties on the Comparables Grid, the Comparable Map and the Summary Statistics are automatically updated. Review each section – the Comparables Grid, Comparables Map and Summary Statistics -- to determine which properties will result in the most effective final report. Also note that you can: Click the View Property Detail icon on each row if you wish to fully explore property information before deciding if the property is truly comparable. Click the Hide Statistics button on the far right if you wish to enlarge the Comparables Map. Click Map | Grid | Split to toggle between different views. 30 When you have chosen all the comparable properties for your report, click the Generate Comps Report button below the Comparables Grid. Your report will be available in a moment. Modifying the Comparable Search Criteria From time to time, you will find it useful to modify the criteria to find, sort, and report comparable data. Key search criteria options with which you should be familiar are: Number of Comparables Select the maximum number of comparables to potentially include on a report. You can select 5 to 50 properties. Sort Method Select the means by which to order comparable sales. The default sort sequence is by Distance from the Subject Property, and other sort options include by Sale Date, by Sale Price, and by Living/Building Area. 31 Report Options Four report options enable you to Include Property Images, Include Value Projected by Assessment, Include Value Projected by Square Feet, and Include RealAVM on the final comparable report. Data Source You can search comparables Tax data, MLS data, or Both. Note that Comparable Searches using Tax data permit you to also utilize criteria pertaining to Distressed Sales. Distance from Subject Choose the maximum distance from the subject property that you wish to find comparable sales. You can select distances from a tenth of a mile to 10 miles. Sale Price Entering a high and/or low sales price plainly enables you to find comparables within a defined range. Less obviously, entering a low sales price enables you to eliminate closed rental transactions that may otherwise be returned as comparable sales within MLS data. When you complete modifications to the Comparable Search Criteria, click: Save and Submit saves the revised criteria for future searches, then executes the search. Submit executes the search without saving the revised criteria. Cancel abandons the changes and exits the Comparables Search Criteria screen. Generating the Comparable Report When you are ready to prepare the Comparable Report, click the Generate Comps Report button on the lower left of the comparable screen. The report will be generated in a moment and contain: The default display includes: Map showing the location of the subject and comparable properties Search Criteria appear at the top of the Comparable Report Summary Statistics for the selected subject property and selected comparable sales. Statistics show the high, low, median and average values for the subject property and the selected comparables. Statistics may also include: The projected value of the subject property calculated by applying the average price per square foot of the selected comparables to the square footage of the subject property The projected value of the subject property calculated by applying the average ratio between sale price and assessed value for the selected comparables to the assessed value of the subject property RealAVM, the estimated value applied by the CoreLogic automated valuation engine All comparable reports include the columnar comparison of the subject property and selected comparables pictured below. Click the right and left arrows to traverse back and forth through the comparables. 32 Click on the Edit Report button if you wish re-select the comparable sales to be included on the report. The search criteria can be modified by clicking Modify, then Search. The default report sections can be modified by clicking Modify, then Display. 33 18. Market Trends Report Click the Market Trends tab at the top of the report window to review detailed market trends for the locale surrounding a home. Market Trends are compiled from data collected by Realist and the MLS. The Market Trends Report is an excellent way to deliver information about recent market conditions in a specified area and provides you with colorful charts and graphs to enhance reports that you can print, save or email to clients. Market Trends are broken into the following categories: Pricing Trends Market Activity Distressed Properties Reports also include descriptions of each chart. If you wish, the descriptions can be suppressed. The default report sections and descriptions can be controlled by clicking Modify, then Display. Market Trends searches can be modified to utilize specific Property Types (single family or condo), Trends Periods (monthly or quarterly), and Geography (zip, city and/or county). To control the Market Trends searches, click on Modify, then Search. If you require more interactive trends or wish to add trends to your own website, click on MARKETrends Premium and explore that valuable, but optional Realist service. 34 19. Neighbors Report Click the Neighbors tab to quickly display facts and photos for the Neighbors of the subject property. The content of Neighbors report is based on the Preferences you selected for the report. A map is populated with “teardrop” icons that indicate where each neighbor owner on the list below the map is located. Below the map is a matrix comparing information about the subject and neighboring properties. Click the arrows above the matrix of neighbors to navigate. The subject property remains visible as you navigate on the left hand side of the report, while three neighbors appear to the right. If more than three neighbors are found, click the arrows to scroll back and forth and compare neighboring properties. The arrows enable you to navigate to the beginning/end of the list, one column at a time, or three columns at a time. Click Modify, then Display at the bottom of the page to include or exclude the map above the displayed report. Click Modify, then Search at the bottom of the page to change criteria used to find neighbors. 35 20. Neighborhood Profile Report Select the Neighborhood Profile tab to display demographics, schools, and local businesses for the area surrounding the subject property. The data is enhanced by colorful charts and graphs to accompany the statistics. Click Modify, then Display at the bottom of the page to include or exclude core sections of the report. Click Modify, then Search at the bottom of the page to change criteria used to find schools and area businesses. 36 21. Foreclosure Report The presence of the Foreclosure tab indicates there is a current foreclosure action against a home. The action may be in the following stages: Pre-foreclosure, indicating that proceedings to foreclose on the property have been initiated Auction, indicating that the date for a property’s foreclosure auction has been established Bank Owned, indicating that the foreclosure proceeding has resulted in the foreclosing lender taking title to the property A Foreclosure Activity Report typically contains a summary of the foreclosure, information pertaining to the mortgage in default, and a history of prior foreclosure actions pertaining to the property. Please note that the content regarding foreclosures – and even the stages of foreclosure on which CoreLogic can collect data -- varies greatly from state to state. 37 22. Assessor Map Report The presence of the Assessor Map tab indicates if there is a static assessor map available for viewing. The Assessor Map – or the plat map – is not interactive like a Realist Map, but may contain information such as easements that are unavailable elsewhere. Clicking on the Assessor Map tab takes you to the Assessor Map for that property. It may be viewed using generic software available on your computer or handheld device. Or it may be viewed with Realist’s proprietary Map Viewer (chosen in the Preferences section). A guide to the proprietary CoreLogic Assessor Map Viewer is provided under separate cover. 38 23. Flood Map The presence of the Flood Map tab indicates that a static flood map is available to display. The Flood Map is not interactive, but provides information about the flood zone in which a property lies and the surrounding area as well. Information about the flood zone and associated codes can be found at the top of the report above a color-coded map indicating flood zones in the area. 39 24. Printing/Saving/Emailing Reports At the bottom of each report are Print, Save & Email buttons. Clicking any of these buttons enables you to select between Quick and Customize options. Select Quick if you want to print, save or email the specific report you are currently viewing. For example, you may wish to only email a Comparable Report you just prepared; select Quick to generate and/or deliver only that report. Select Customize if you want to print, save or email a package of reports. The Customize option opens a window titled Report Options and enables you to direct not only the reports to include in your package. If you choose to print, save or email a package of reports you have not yet viewed, please allow time for each report to be generated. All reports are generated, printed, saved and/or emailed in a PDF format. Note that the specific sections of each report that are printed, saved or emailed correspond to the most recent selection you have made for each report. In the event you include a comparable report, but have not reviewed and selected specific comparables to be included, the report will incorporate all the comparable properties automatically found by the search. Also note that you can include a gallery of MLS photos in your report, even though the photos do not appear as a “tabbed” report. 40 Emailed reports will be sent from Realist on behalf of you as PDF attachments. You may use the email template to enter recipients, copy additional parties, or BCC yourself or others. The subject line and email text can be modified as you wish. Even add formatting to the email text. 41 © 2014 CoreLogic, Inc. All rights reserved. 42 CORELOGIC, the CoreLogic logo, and REALIST are trademarks of CoreLogic, Inc. and/or its subsidiaries. corelogic.com