1
Eye Tracker Studies
Author: Valentina Ragni, MA
PI: Serge Sharoff, Centre for Translation Studies
1
Table of Contents
1. Introduction and objectives..................................................................3
2. Tobii eye tracker and software..............................................................4
3. Preliminary set up..................................................................................5
4. Case Studies...........................................................................................9
4.a - Case study 1 - Reading a text.........................................................9
4.a.1 - Reading a text in English...................................................9
4.a.2 - Reading a text in Chinese................................................14
4.a.3 - Reading comprehension with MCQs in English.............17
4.b - Case Study 2 - Watching subtitled video material.....................19
4.b.1 - The Edukators - General considerations.........................19
4.b.2 – Land and Freedom - A practical application................23
4.c - Case study 3 - Translating a text in a separate application........28
5. Limitations and obstacles....................................................................31
6. Conclusive remarks.............................................................................32
7. Appendix..............................................................................................34
8. Bibliography........................................................................................38
2
1. INTRODUCTION AND OBJECTIVES
In recent years, remarkable technology advancements have been recorded in the
field of eye tracking, especially regarding non-intrusive remote systems (Böhme et
al., 2006: 1) such as the likes of Tobii eye tracker.
In line with these fast technological developments, eye tracking has proven a
promising tool to study and assess human attention distribution on screen (Schiessl
et al., 2003: 2). Despite its vast potential, however, according to Jacon and Karn
(2003: 1) there seem to be a slow progress in the use of eye tracking technology for
Human Computer Interaction (HCI) research purposes. Nevertheless, the authors
themselves acknowledged in that same study that “the field is indeed beginning to
flourish” (ibid.). This seems to be substantiated by the numerous and diverse
applications 1 the technology has today, which makes eye-tracking systems an
attractive tool to invest in for a number of industries as well as a useful device in
different scientific research fields such as physiology, psychology, engineering,
linguistics and cognitive science, to name a few. This study is concerned with eyetracking technology and linguistics research, and in particular with providing an
insight on the use of a specific system (Tobii X120 Eye tracker and Tobii Studio) in
different linguistic experiments. In particular, this paper will discuss eye tracking
technology in an attempt to:
Raise interest in the subject and generally promote the use of this medium by
researchers within the University of Leeds.
Give examples of possible applications and uses of the device in linguistics
experiments.
Investigate the practicalities of using the eye-tracking system within the
specific hardware and software arrangements currently available at the
University of Leeds.
Discuss and identify the most suitable set up for the case studies presented.
Highlight the practical issues that might arise during experiment set up and
its implementation.
Touch on related problems that require to be investigated more thoroughly
through experimental studies.
Provide a starting point for future more in-depth analysis and research
projects from which other researchers in the Department can benefit.
We will start by describing the main features of both the eye tracker and the
software it is connected to, as well as highlighting preliminary actions that need to
be taken when setting up an experiment. We will then move on to a series of case
studies aimed at describing the software and hardware performance when it comes
to the following actions:
Reading a text in English
Reading a text in Chinese
Carrying out a reading comprehension with multiple choice questions
1
For a review of some of the possible applications, both for diagnostic and interactive purposes, see
Duchowski (2002).
3
Watching subtitled video material
Translating a text in a separate application
A brief outline of general limitations and obstacles will be then presented before
drawing a conclusion.
2. TOBii EYE TRACKER & SOFTWARE
Experiment set ups
Tobii allows for various experiment set up options. The basic set up involves eye
tracker connection to a primary computer screen where the stimuli are presented to
the test subjects. Other arrangements include connection to the primary as well as
to a secondary PC screen (remote Live viewer), a projector, TV monitor or a scene
camera (to track real 3-D objects). For all the cases analysed in this report the basic
set up was used, where the X120 eye tracker is connected to the machine where
Tobii Studio is installed and only one screen is used.
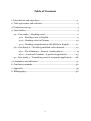
Media element types
Experiment design can be customised through the use of different media (often
referred to as ‘stimuli’). Figure 1 below shows all the media types available. In this
paper, the following media were considered: Movie, Web, Screen Recording,
Questionnaire, PDF element.
Figure 1 – Media types available in Tobii Studio.
Menus and Tabs
When organising and carrying out an experiment in Tobii, the user will navigate
between the four main tabs ‘Design and Record’, ‘Replay’, ‘Visualisations’ and
‘Statistics’.
Figure 2 – Tabs in Tobii Studio.
The ‘Design and Record’ tab (also referred to as ‘view’) allows the user to create
and modify tests, manage participants, calibrate and configure the tracker.
In the ‘Replay’ view, the recording can be replayed with the gaze path overlaid
on the stimuli. This is also the tab where scenes need to be created. Scenes are
portions of the recording selected by the user. They must be created to be able to use
the visualisation tool and select Areas of Interest (AOIs) when working with certain
media types (namely those presenting moving images, typically ‘Movie’ and ‘Screen
Recording’). The still background image of a scene (Scene Image) is also chosen
here. The timeline detail for the recording can be increased to show shorter time
4
intervals, and the playback speed can be adjusted so that the recording can be
replayed at a faster or slower pace (see Tobii StudioTM 2.X, User manual, pp. 57-58).
The ‘Visualisations’ tab contains a series of tools for different visualisations. The
tools available in the current Tobii Studio licence are: Gaze Plot, Heat Map and AOI
Tool. In the case studies presented hereafter the AOI Tool has been used. An AOI is
a portion of the active screen selected by the user, on which the metrics will be
calculated. AOIs need to be created on a static image, therefore if the stimulus
chosen is a video or screen recording, a scene needs to be created first and a suitable
scene image has to be assigned to it.
The ‘Statistics’ view provides descriptive statistics based on the AOIs selected by
the user. The data are based on fixations and mouse clicks, and can be presented in
the form of a chart or table. This tab allows for several views and options, for a full
description see Tobii StudioTM 2.X, User Manual, pp. 113-125.
3. PRELIMINARY SET UP
Prior to the implementation of any specific recording made with Tobii, there
are a number of points that users should be aware of.
Licence key activation & deactivation
Firstly, the University of Leeds currently owns only one licence key, meaning that
only one person at the time can use the software. It is therefore recommended that,
before exiting the programme at the end of each session, the licence be deactivated
in order to allow the next user to be able to open and run the programme. To do so,
go on the toolbar at the top left of the window and select Help > Deactivate licence >
Press OK (see Figure 3).
Figure 3 – Tobii Studio licence deactivation.
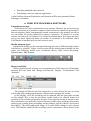
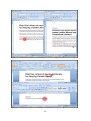
When the programme will be next opened by a new user, Tobii will require a new
licence key to be entered (see Figure 4 below). This is because a newer version of
Tobii Studio was installed, thus requiring the old key to be substituted by a new one.
If the licence has been deactivated by the last user, the key number will already
appear in the dialogue window. Just click on ‘Activate Now’ and the programme will
open. If the last user has not deactivated the licence on their profile, it will not be
possible to run Tobii.
5
Figure 4 – Tobii Studio licence key activation.
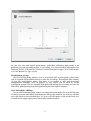
Creation of new project and choice of stimuli
Once the programme is open, a new project and subsequent test(s) can be
created. A project in Tobii can contain several tests made of different stimuli (please
refer to Tobii Studio 1.X, User Manual, pp. 9).
Configuration Tool
During the setup, information on the exact placement of the tracker in relation to
the screen must be provided. The different available parameters are listed in figure 5
below. For more detailed information, please see the Tobii X120 Eye Tracker User
Manual, pp. 8-12. A digital angle ruler has been provided to measure the angle
width where necessary. Please note that for computer monitors and other types of
supported displays the height and width parameters should refer to the visible
active area on the screen where one can see the actual image, rather than the whole
screen. The standard eye tracker angle is usually around 30 degrees.
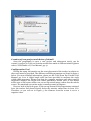
Due to a lack of physical space, in the set up chosen for the experiments analysed
here, the tracker was placed directly below the monitor rather than in front of it.
Therefore, as you can see in Figure 5, the distance from the screen is set to a
negative value.
6
Figure 5 – Configuration Tool showing the parameters used in all the experiments described in this
paper.
Eye tracker calibration
After configuration, the tracker needs to be calibrated to the user’s eyes. Open the
Calibration Dialog box in the Design and Record tab, under Set up > Calibrate.
Firstly, a black window with a status bar at the bottom will appear. This box
represents the field of view of the camera inside the tracking device. The user’s eyes
are represented by two white circles. It is recommended that the user's eyes be in
the middle of the track status metre, and that the distance indicator be between 6070 cm. The default calibration consists of a red point moving around the screen,
which should be followed by the user’s eyes. Calibration stops automatically when
complete, and the results are displayed in two vector plots in the Calibration Result
dialog box (see Figure 6). If the calibration plot shows error vectors, i.e. green lines
instead of green dots, the tracker will need recalibration. The size of each green line
indicates the difference between the user’s gaze point calculated by the eye tracker
and the actual dot position during calibration.
7
Figure 6 – Correct calibration.
In case of a test with several participants, individual calibration data needs to be
gathered for each test subject prior to recording. For more detailed information see
both the Tobii T/X Series Eye Tracker Product Description (pp.11) and Tobii Studio
1.X User Manual v.1 (pp. 24-28).
Participant set up
Each recording made within a test is associated with a participant, whose data
can be created and modified before or after the recording. The default data consists
of just the participant’s name, but there is an option to add user-generated
independent variables, such as gender or age, which can be used to create
participant groups. The eye tracking data gathered during the recording can then be
filtered by participant group while generating the descriptive statistics.
Test locked for editing
It is worth mentioning that, after a recording has been made, the test will become
locked to prevent accidental modifications during the sessions. In order to edit the
test, this needs to be unlocked first. To do so one will need to click on the lock icon
located in the upper-right part of the media element toolbar.
8
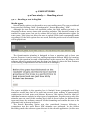
4. CASE STUDIES
4.a Case study 1 – Reading a text
4.a.1 – Reading a text in English
Media types
Several media options can be used to carry out reading tests. The ones considered
here were the following: ‘Web’, ‘Questionnaire’, ‘Screen Recording’, ‘PDF’.
Although the text chosen was available online, the Web media type had to be
discarded as there was an issue with recording websites. This function seems to be
enabled for some users, but not for others due to lack of administration rights. In
some cases, Tobii does not allow the user to upload URLs (and consequently make
recordings). If the Web option does not work, both the preview and record buttons
will be greyed out:
Figure 7 – Recording issues using the Web stimulus.
The Questionnaire stimulus is designed to have a question and at least one
answer; however it can be used in a reading experiment without MCQs by inserting
the text in the question box and a blank answer in the answer box. By doing so, the
software allows to preview and save the item (see figure 8, where the first sentence
of the reading comprehension has been used as an example).
Figure 8
The space available in the question box is limited; hence paragraphs and long
sentences would have had to be split into several parts, making it unnecessarily
cumbersome for both tester and testees. However, this option could be ideal for
individual sentence analysis in other types of experiments. Another reason why this
stimulus was not used in this reading test is that it doesn’t allow for different font
types and sizes; the software removes all the formatting and enables the text to be
presented only as shown in figure 8.
The Screen Recording option was also considered, however following a
comparison test the more direct PDF stimulus was preferred. In the Screen
Recording mode the software opens the text in the chosen application (in this case
9
MS Word or Acrobat Reader) whilst the eye tracker records the whole screen,
meaning that the application menus, tabs and toolbars are also displayed,
potentially causing distraction. Moreover, this mode involves more adjustments (the
text might have to be zoomed in and out, scrolling might be required) to be made by
either the testee or tester. Using a PDF was much simpler as the only action
requested from the participants was to press ‘Esc’ when they finished reading.
The objectives of the experiments were the following:
Test general tracker performance during a reading activity
Test accuracy in detecting gaze behaviour
Gather empirical data regarding different text formatting options
The same text excerpt was presented as a PDF each time with a different formatting.
The following options were tested:
Main
tests
Test 1
Test 2
Test 3
Test 4
Arial
Arial
Arial
Arial
18
20
22
24
1pt
1.5pt
1.5pt
1.5pt
Partcipants
who took
the test
9
9
9
9
Additional
tests
Formatting options
Test 5
Test 6
Test 7
Test 8
Test 9
Test 10
Courier New
Arial
Arial
Arial
Arial
Arial
20
12
36
20
20
22
1.5pt
1.5pt
1.5pt
1pt
1.5pt
1.15pt
2
1
1
2
4
3
Font type
Font size Line spacing
Bold
x
Table 1 – Reading tests details.
Tests 1-4 were taken by all 9 participants and are discussed hereafter. Additional
tests were carried out but as the number of participants taking each test varied, and
less people in total took the additional tests, the results were not analysed.
The font Arial was chosen based on the assumption that sans serif fonts are
easier to read on screen. However, this assumption is not universally accepted as
proven by the rich debate on the subject2. Despite the wealth of empirical studies on
readability and legibility carried out over a period of over 70 years, there still seem
to be a divide within the scientific and typographic community regarding serif and
sans serif fonts. The font adopted by the Tobii Studio interface is a sans serif, so is
the default font used in the Questionnaire stimulus; a sans serif type was selected
for all the experiments to maintain consistency.
The minimum font size threshold was decided based on the clarity and neatness
of the text when read in full-screen mode during a test. An initial test was taken with
a 12-point font but the letters appeared quite cloudy during the reading exercise
(figure 9). The screenshot below has not been resized and shows quite accurately the
level of blur during the actual test in full-screen view.
2
For a study on the effects of text layout on reading, see Dyson, 2004. For an exhaustive and welldocumented review of the serif-sans serif debate, see Poole, 2008.
10
Figure 9: P_1 – Extra test performed on a smaller font (Arial, 12 points, line spacing 1.5).
Given the decision to compare the same text (same number of sentences and
same content) and to have it always displayed on a single page (to avoid scrolling
between different pages), the maximum font size was dictated by the page size. The
maximum font size used was 24 points, as the whole text could still fit on one page
with line spacing 1.5. Increasing the font size to more than 24 points would cause
the text to go over two pages, and was therefore avoided. After a few tests it was
decided to avoid scrolling because it makes it somewhat more difficult to assess gaze
behaviour and it creates potential confusion as to which line the participant’s is
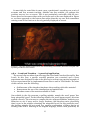
actually looking at. Figure 10 shows the gaze plot on a participant’s regression at a
defined moment. A few frames later (Figure 11), the same fixations appear to be
related to the line below that of figure 10. This is because the test was taken using
the Screen Recording stimulus and the participant had to scroll down the page to
keep reading.
Figure 10
Figure 11
11
In fact, in the PDF view scrolling is not necessary even if the text is longer than a
page, as the content of each page is displayed all at once, so participant can read
without scrolling and just need to click on the spacebar to move to the next page.
However, as the initial idea was also to compare tracker performance for the same
text in the four media types mentioned above– which would have involved scrolling
in the case of screen recording – the excerpt was shortened considerably so that it
could fit on one page and allow for increases in font size and line spacing. However,
media type cross-comparison was not carried out due to the lack of resources and
issues with one of the media types (Web element), therefore this could be an
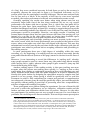
interesting starting point for further research or case studies.
Findings
It must be pointed out that not enough participants took the tests for the
conclusions drawn to be considered fully reliable. More thorough testing involving
more participants is required to investigate eye tracker accuracy with different text
formatting. However, the findings can be useful if taken as general considerations or
as the proem to further more exhaustive studies.
Tobii does not allow letter-by-letter analysis, nor does it give the possibility to
have a closer look at gaze movement on individual words during the replay of a test.
The replay view just plays back the recording, which can be watched in full screen
(same actual size the participant was looking at during the test), paused and
advanced frame by frame, but not zoomed in. It is possible to zoom in only on a
static image in the Visualisation view. At individual word level, Tobii cannot tell if
during the reading activity a participant is looking at the top or bottom of each
letter. At sentence level, however, it is possible to detect readers’ tendency to look at
the top or bottom of consecutive words whilst reading a whole sentence. Compare
gaze position in participant one (P_1, scan path in the middle) and two (P_2, path
just below the words) for the same sentence part in the same test:
Figure 12: P_1 – Test 3
Figure 13: P_2 – Test 3
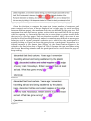
The determining factor to define eye tracker accuracy in this short set of
experiments was how far the recorded scan path was from each line being read. If
the tracks were in the middle or at the edges of the lines (touching the top or bottom
12
of a line), they were considered accurate. In both figure 12 and 13 the accuracy is
acceptable, whereas the scan path in figure 9 is considered inaccurate, as it is
unclear which line the participant is actually looking at. The text was analysed both
line by line and as a whole. If the majority of the lines in a test were recorded
accurately, the tracker performance in the test was considered accurate overall.
Generally speaking, the results were better when using shorter texts but not
necessarily larger fonts. Out of the four sizes considered (18, 20, 22, 24), overall
performance was better with size 22 points (Test 3), where less scan paths fell in
between the print lines. Quite surprisingly, however, Test 1 (Arial 18 points, the
smallest font adopted) was fairly accurate too, seeming to suggest that as long as the
text was comfortably readable (not blurred), even if the font was small, the tracking
performance would be acceptable. However, one might wonder if tracking just
seemed better because there was less space between the lines (line spacing was 1 pt
instead of 1.5 pt like in the other three tests), as having more available space
between print lines makes any scan path deviation more noticeable.
Across participants and recordings, tracking was most accurate in the centre of
the active screen, while the lowest performance was recorded at the bottom of the
screen, where scan paths were often less well-aligned with the text. This was also
substantiated across all tests by the real-time checks in the calibration grid3 that all
participants were asked to perform before accepting calibration and proceeding to
the reading exercise.
In most participants there was a high degree of variability within the same
recording, e.g. the beginning of a reading exercise was tracked accurately but the
scan paths towards the end (bottom of the page) started to deviate from the lines of
text.
Moreover, it was interesting to record the differences in ‘reading style’, whereby
some people seemed to read in a more linear way (the paths being almost straight
while moving left to right), whereas other people’s gaze seemed to jump up and
down whilst moving left to right.
Another striking aspect of the reading activity is that gaze tracking was more
accurate when the person was reading more quickly, i.e. reading as fast as they
could rather than reading to understand as much as they could. Reading pace was
faster, fixations much shorter and scan paths straighter. It would be interesting to
develop this point further by designing an experiment around a complex text and
present it to two groups, where group A would be specifically told to read the
document in order to fully understand its content and perform a comprehension
test afterwards, whereas group B would be specifically told to just read through the
text quickly without putting a great deal of processing effort into comprehension,
and then compare the resulting scan paths.
Three participants wore glasses during the experiment. For one of them this did
not seem to affect the performance, as eye detection, calibration results and the
further real-time post-calibration checks were all positive. However, for the other
two participants, eye tracking was not very accurate in any test. For one of them in
particular, the recordings were almost unusable. This test subject wears prescription
3
The post-calibration real-time checking consists of a plain screen with 9 red fixed dots (calibration
grid) – three at the top, three in the middle, three at the bottom – on which the user has to focus, their
eyes being tracked and represented live on the screen by a circle. If the red dot the user is focussing on
is in the centre of (or at least inside) the circle, the tracker is recording the user’s gaze accurately. If the
user is focussing on a red dot but the circle does not contain the dot, the tracker is having difficulties in
detecting the real position of the eye. When testees were looking at the three bottom dots, the tracker
was consistently less accurate, with the red dots rarely being in the centre of the circle.
13
glasses and is short-sighted, his right eye being considerably worse than the left.
This difference was detected by the eye tracker, as confirmed by the track status box
in the calibration process, where the device at times struggled to detect his right eye,
as well as in the calibration results, where the right eye showed long error vectors
(green lines). The participant’s eyelids were not droopy nor were the spectacles
bifocal, dirty or scratched. The person was sitting correctly in front of the screen and
the room lighting was the same as in all the other tests. Several tests were carried
out on two separate occasions and the results were the same. This could suggest that
the Tobii tracking performance with people wearing glasses could be lower when
common vision problems are very pronounced. Despite the claim that Tobii eye
trackers have a “very good tracking ability on people with glasses” (Tobii T/X Series
Eye Trackers, Product Description, pp. 13) the device did perform considerably less
well with two out of three testees wearing spectacles. This could be due to a number
of reasons. According to Böhme et al. (2006: 3):
“Systems that use infrared illumination often do not work well for users
who wear glasses because of reflections on the surface of the glasses. The
existing systems can usually be made to work with glass wearers to a
certain extent, but only for some head orientations where no interfering
reflections occur. For other head orientations, the reflections can obscure
the user’s eyes completely, making eye tracking impossible.”
Given that one user taking the experiments in the same conditions wore glasses and
this didn’t seem to affect tracker performance, head orientation and the angle at
which the eye reflections hit the tracker device could be a reasonable explanation for
the differences registered, as these are highly dependent on the individual
participants’ physical features. However, as only 9 people took these reading tests
and only 3 wore glasses, there is not enough evidence to make a definitive statement
in this sense. Only further testing involving larger groups of test subjects might
provide a clearer idea of how the Tobii eye tracker actually performs on people with
low vision.
4.a.2 – Reading a text in Chinese
In order to assess general eye tracker behaviour with non-Latin scripts, a Chinese
text was analysed with the following objectives:
Identify potential issues with recording character-based texts.
Verify if individual characters are displayed correctly during tests and
replays.
Test whether individual character detection is possible.
The sentence chosen was saved as PDF with different MS Word formatting
options and previewed in Tobii Studio. It was found that, despite the PDF had been
created correctly and was clearly legible, when the document was previewed some of
the characters didn’t show correctly, namely some of the strokes were blurred or not
clearly detectable, making it very difficult to read the sentence. The first PDF had
the following formatting:
Font type : Arial – Font size : 14 points – Line spacing: 1pt
14
It was initially thought that unclear character display was due to the font size
being too small. This was therefore increased to 18, 20 and 26 points, only to
discover that, even with the largest font tested, the software still did not display the
text correctly. Take, for example, the following characters:
习
and
红 . During the
Tobii preview, some of the characters’ strokes disappear altogether or are barely
visible (figure 14):
Figure 14 – Character corruption with Arial font at 14 points.
However, when font type was changed, the sentence was displayed correctly.
Characters were not corrupted in the Tobii preview mode with the following text
formatting:
Font type : Arial Unicode MS – Font size: 26 points – Line spacing: 1pt.
Figure 15 – Characters displayed correctly during preview in Arial Unicode MS.
Smaller sizes were also tried with this font (20, 18, 14 points) at 1.5 line spacing and
the characters were displayed correctly. However, at 14 point size the characters
started to be slightly blurred. Several other font types were tried at 20 points, some
of which are listed in the table below. Some fonts displayed the text correctly;
however, most of the fonts tested in MS Word caused character corruption.
15
Font type
Arial
Arial Unicode MS
MingLiu
Verdana
Lucida Sans Unicode
SimHei
DotumChe
Character Corruption
Characters displayed
correctly
x
x
x
x
x
x
x
Table 2 – Some of the fonts tested with Chinese characters in Tobii Studio.
Once a usable text formatting was identified, a reading test was performed. Tobii
shows eye movement on a sentence level but does not allow character detection nor
does it distinguish which strokes or parts of the character the reader is looking at.
When the reader was spending more time on one or more adjacent characters
looking at the component parts, Tobii simply registered a very long fixation (a larger
circle overlaid on the text). The scan path resulted in a series of long fixations which
didn’t reflect accurately what the reader was doing (fig. 16):
Figure 16
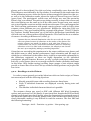
The participant was an English native speaker studying Chinese. Based on the
assumption that mother-tongue speakers of Chinese would spend less time than a
foreigner on each character, it would be interesting to repeat the experiment with a
native to see if it yields improved or similar results in terms of scan path accuracy.
However, it could be expected that even Chinese natives would be unlikely to have
as many short fixations as the ones on figure 19 or 20 below (page 21), and it could
16
be presumed that, taking the same line length from an English and a Chinese text,
the Chinese reader would spend more time reading the Chinese than an English
reader reading the English, given information density and linkage of the characters
in the former. Moreover, an obstacle to detecting gaze paths could be the lack of
word spacing in Chinese, which makes it more difficult to distinguish word unit
boundaries and to structure the visual field.
As for scan path analysis and statistics, since the metrics in Tobii are based on
AOIs created on still images, there should not be a difference between analysis of
Latin and non-Latin scripts, as the software analyses eye behaviour (fixation count,
length, and the like) in relation to a selected area of the screen, regardless of its
content. However, running statistics on a recording such as the one above would not
produce any accurate and reliable data; therefore, the use of this tool with the
Chinese text considered has not been explored.
4.a.3 – Reading comprehension with MCQ in English.
The document chosen for this experiment was a reading comprehension in
English about littering and recycling in Britain (see Appendix). The media types
considered were Screen Recording, PDF and Questionnaire. Initially some tests
were taken using the whole text (four paragraphs, six questions). However, for ease
of comparison and analysis, as well as in view of previous considerations regarding
text length and scrolling, the final exercise was made shorter – two paragraphs and
two related questions – and was structured in two pages. Each page contained just
one question preceded by the relevant paragraph of text. By using this exercise in
the Screen Recording stimulus it was still necessary to move from the first to the
second page, but scrolling down while reading would be avoided. Moreover, having
a shorter text meant it was possible to keep it at the centre of the page, where
tracking performance is generally more precise.
The aim of the experiments was to establish which stimulus is the most effective
in this type of test when an action is performed (answering MCQs) through mouse
clicks.
Findings
Bearing in mind that this test was taken by only one person and therefore more
recordings need to be made to substantiate the findings, tracking appeared quite
accurate in the Screen Recording and Questionnaire media types, with the scan
paths falling mostly in the middle of each line, at times touching the bottom or top
of the print. In the PDF, gaze paths tended to be above the print lines, making the
tracking of ocular movement less accurate. Mouse clicks were recorded precisely
not only in the Questionnaire (which is designed to contain MCQs answered
through mouse clicks), but also in the other two stimuli. The font used was Arial, 16
points (line spacing 1.5pt) for the text and 14 points for the questions.
Considerations about the Questionnaire stimulus
It is worth commenting on this stimulus as the Tobii Studio User Manual 1.X
does not mention it, and only a very brief and basic description can be found on pp.
37-39 of the newer release (Tobii Studio User Manual 2.X). This stimulus is less
flexible, as the following aspects of text appearance cannot be changed or
customised by the user:
17
Formatting – Font size, type and other formatting options are pre-set. When typing
or copying text in the question box, the formatting is automatically removed,
meaning this stimulus cannot be used when comparing fonts, for example in
legibility and readability studies.
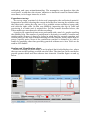
Text length – At first, there did not seem to be a set length limit, as it was possible to
type or paste large amount of text in the in the question set up window. However, if
adding too much text, one will end up with the following situation during recording:
Figure 17 – This image represents the whole screen as it appears in the questionnaire stimulus
during recording. This initial paragraph was excessively long, resulting in the text being cut.
A length limit does indeed exist and is ultimately dictated by the space occupied
by the text on screen. In the test performed with this reading comprehension, the
first paragraph (initially 91 words) had to be considerably shortened (70 words)
in order to fit the page (Figure 18).
18
Figure 18 – The same question of figure 17 had to be adapted to fit on screen.
Paragraph parting – Paragraphs cannot be separated by pressing the Enter key. In
the question text box one can press Enter and start a new line, however when
recording or previewing the item this does not show, i.e. all the words are displayed
seamlessly one after the other. See figure 17, where the first two words are in fact the
title ('Dirty Britain'), which should appear in bold (but formatting is lost) and be
followed by the rest of the text on the line below.
In view of what highlighted above, if longer or more complex reading
comprehension tests are to be performed, where the text cannot or is not supposed
to be shortened or adapted, using this media type might not be the optimal solution.
4.b Case study 2 – Watching subtitled video material
4.b.1 – The Edukators – General considerations
In the second case study, two clips were anlaysed with different purposes. The
first excerpt was taken from the German film The Edukators (original title: Die
fetten Jahre sind vorbei) by Austrian director Hans Weingartne. The main objective
here was to test the software in order to report the steps required to create, record
and replay a clip correctly in Tobii, identify possible difficulties throughout this
process, record all the video specifications required by the software and measure
accuracy in detecting eye movement when reading subtitles. The following general
considerations stemmed from the analysis of this first clip:
19
1) Tobii only supports AVI files4, therefore the user has to make sure they either
choose a clip already in this format or they convert their chosen clip to AVI using
external video editing software, as this operation cannot be performed in Tobii.
2) Not all AVI files necessarily work. Several were tried and in certain cases the
software would play the audio but not the video, or viceversa. This depends on the
file codec, i.e. a piece of software or a device enabling video compression and
decompression for digital video. The standard codecs in Windows Media Player are
Microsoft Video 1 and MP3 (installed on all Microsoft computers). The Techsmith
codec is also available as it is included in the installation of Tobii Studio (Tobii
StudioTM 2.X, User manual, p. 28). On the machine where the software is currently
installed, the MP4 codec also works, as that is the encoding used for all the clips in
this case study. If one wishes to use other codecs, these should be installed first.
Nevertheless, this might present a problem, as explained in the following point.
3) If the audio of a clip works but the video doesn’t or vice versa, one cannot
necessarily fix the problem in what would be the easiest way, namely downloading
and installing the right codec, as most users will not have enough administration
rights to perform this action. This practical issue can be resolved by liaising with IT
to be granted the necessary rights, choosing a different clip if possible, or converting
the chosen file using a different encoding compatible with Windows Media Player
and Tobii.
4) Subtitles need to be burnt onto the video track. In the present study, Any Video
Converter has been used. The merging of subtitles with the video can also be done
with other video-editing programmes such as Video Pad, Power Director or Virtual
Dub. Once the subtitles have been burnt-in, it is recommended to do a trial test in
Tobii to make sure their size and position is suitable.
5) Tobii Studio does not resize the video, which is played in actual size but limited to
the eye tracker’s screen resolution. With the Tobii X120 Eye Tracker, the maximum
video size is 1280×1024 pixels, therefore files with larger resolutions will be cropped
during media presentation. To avoid this, the video needs to be resized using a video
editor such as the ones mentioned above. The screen resolution used in all the clips
analysed here is 1024×768. The resolution must also be the same as that of the PC
monitor, so before making a choice it is advisable to check what sizes the monitor
supports.
6) The two media options of choice for working with audiovisual material were
‘Screen Recording’ and ‘Video’. Currently the Screen Recording view does not work
in the replay mode, i.e. it works while taking a test but not when playing it back. The
software allows a recording to be made, but in the replay view, where the scan paths
should be overlaid on the moving images, the latter simply do not show, i.e. all that
can be seen on screen is the gaze paths on a black background. Given the short
timeframe allowed it was not possible to investigate the root cause of this issue,
therefore the Screen Recording option was left out and all the recordings were made
using the Video stimulus.
4
According to the Tobii StudioTM 2.X User Manual (pp. 27-28), the ASF format is supported too, however this
file type has not been considered in the present case study.
20
7) Using this stimulus the clip has to be uploaded to Tobii first, which can take a
long time, especially if the video’s length is that of a whole film. It is therefore
advisable to choose an excerpt and cut it with a video-editing application to save
time. The clip chosen and cut from the film The Edukators for eye tracker testing
was 03min 02sec long.
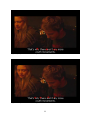
Five people watched this subtitled clip. Generally speaking, when calibration was
good, so was eye tracker performance. However, good calibration results were more
difficult to achieve, as the bottom of the screen seemed to have the weakest
calibration points, i.e. it was more challenging for the device to detect gaze position
accurately and give an good representation of gaze movement. Two examples of
tracking for the same scene from two different participants are shown below. Both
the trackings of Figure 19 and 20 were considered acceptable, although in the
second recording the scan path is slightly above the subtitle line.
21
Figure 19 – Eye movement in Viewer_1
Figure 20 – Eye movement in Viewer_2
22
It must duly be noted that in most cases a participant’s recording was a mix of
accurate and less accurate tracking. Subtitle size was suitable, yet perhaps the
position was too low on screen. This is not particularly noticeable with the twoliners above but became evident with one-liners such as the one displayed in Figure
21, as these appeared on the bottom line rather than the top one, thus sometimes
causing some of the fixations to be only partially displayed on screen.
Figure 21 – Here the subtitle position is too low and tracking is inaccurate, hence the scan path ends
up falling outside the active screen.
4.b.2 – Land and Freedom – A practical application
The second clip was taken from the 1995 film Land and Freedom directed by Ken
Loach. In this case, a specific research question was conceived and a short
experiment was designed in order to be able to give at least one practical example of
how an experiment can be implemented from start to end in Tobii Studio. The aims
of this exercise were the following:
Outline some of the interface functions when working with video material.
Demonstrate the use of the visualization and statistic tabs.
Introduce some of the metrics available in Tobii.
One subtitle in the clip presents a spelling mistake, namely the word ‘power’ has
been misspelled ‘poser’. In the following subtitle, the word appears again, this time
spelled correctly. The aim was to compare the two adjacent subtitles, analysing eye
behaviour to see if more and/or longer fixations (and therefore more processing
time) occur in the subtitle containing the misspelled word. In this particular case,
the spelling mistake did not result in a random combination of letters but in an
existing word with a meaning in the English language, which could potentially be
23
misleading and cause misunderstanding. The assumption was therefore that the
word ‘poser’, would draw the viewers’ attention to itself and overall be fixated either
more times, or for longer intervals, or both.
Experiment set up
The set up stage consisted of choice and preparation the audiovisual material.
Preparation involved selecting the excerpt from the film, burning the subtitles onto
the video track, cutting the clip, save it in a suitable screen resolution (1024×768)
and with the right codec (in this case MPEG4), importing the clip in Tobii and
previewing it to make sure it worked fine. For the reasons described above, the
Video media type was chosen for all the recordings.
A project was created and tests were performed with a total of 7 people watching
the subtitled clip. The number of participants is obviously too small to consider any
results usable, however it has to be borne in mind that the research question was
chosen purely for the sake of demonstrating how the software works, rather than to
prove a specific point. None of the conclusions reached is claimed to be valid or
usable for anything other than providing practical evidence as to how Tobii can be
used in AVT studies.
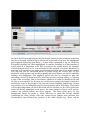
Replay and Visualization views
Once a recording has been made, it can be played back in the Replay view, where
the user can see the tracking overlaid onto the video. The time bar can be rescaled to
provide greater detail and show shorter time intervals. Consider figure 22 and 23
below.
Figure 22 – Timeline before zooming in.
24
Figure 23 – Timeline after zooming in.
In figure 23 the intervals between the clip length indicators (the numbers in the blue
bar) are 9 seconds, whilst in fig. 22 they were 30 seconds. Note how the highlighted
grey segment indicating New Scene_1 is now wider compared to fig. 22, while the
horizontal scrolling bar (also highlighted) is smaller. Zooming in to the timeline is
useful when it is important to be able to advance the replay slowly, for example
when having to select an in- and out-time for the creation of a scene. Morever, by
zooming in it is easier to see where a scene starts and ends once it has been created.
The clip can also be navigated frame by frame using the arrows keys on the
keyboard, which proves very useful to identify the exact frames on which a subititle
appears and disappears. The playback speed can also be changed to play the
recording a slower or faster pace. The next step involves creating scenes, i.e. slecting
a part of the recording. This is a necessary operation in order to identify AOIs and
be able to run statistics. In this test two scenes were created, the length of which is
exactly the same as the length of the first and second subtitle respectively. Scenes
are portions of a recording that need to be associated with a still image. This frame
will be the background on which the AOIs will be selected. As the AOI in the first
scene will be the misspelled word ‘poser’, the static image for Scene 1 will need to
contain the subtitle where the word appears. The same thing goes for the
background image for Scene 2, which will have to show the second subtitle
containing the word ‘power’. Once the correct Scene Images were selected, the
Visualisation view allowed the creation of the AOIs (Figure 24). These can be
25
copied, pasted, renamed and be assigned differet colours for ease of identification.
Figure 24 – Creation of the first AOI on the misspelled word “poser”.
Statistics view
In this view it is possible to select which scenes and related AOIs to import for
analysis and which metrics to run. In this experiment the aim was to see if viewers
are somewhat distracted by the spelling mistake and spend more time on it or go
back to re-read the word. The idea was to compare number of fixations and fixation
length between the two AOIs. The following metrics were selected: Fixation count,
Fixation Duration, First Fixation Duration. For a detailed explanation on fixations,
what they are, how they are calculated, and what types of filters are available in
Studio 2.3.2.0, see Tobii StudioTM 2.X User manual, pp.76-79. Statistics were
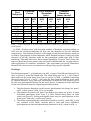
generated for all the 7 viewers, and the following results emerged:
26
Test
Subjects
Fixation
Count
AOI
1
V_1
V_2
V_3
V_4
V_5
V_6
V_7
All subjects
2
6
2
3
3
3
3
22
AOI
2
1
2
3
1
2
7
First Fixation
Duration
(sec)
Fixation
Duration
(sum, in sec)
AOI
1
AOI
1
AOI
2
0.34
0.16
0.12
0.19
1.19
0.17
0.37
2.54
0.33
0.04
0.22
0.54
0.21
1.34
0.82
1.17
0.95
1.68
2.02
0.63
1.22
8.49
AOI
2
0.33
0.66
0.64
0.54
0.36
2.53
Table 3 – Values calculated on the three selected metrics for both AOI_1 (word ‘poser’) and AOI_2
(word ‘power’).
In Tobii, ‘fixation count’ tells the total number of fixations occurring within an
AOI over the selected timeframe (in this case the duration of the two subtitles
respectively); ‘first fixation duration’ is the length of only the first fixation made on
an AOI by a participant in that timeframe, while ‘fixation duration’ is the sum of the
duration of all the fixations made by the participant within that AOI in that
timeframe. The table above has been created separately, however Tobii allows the
export of both the chosen metrics onto an Excel worksheet and the raw gaze data to
other application for statistics calculation. The experiment was purely illustrative
therefore the viewers were not selected according to any specific requisite.
Findings
The third participant V_3 fixated twice on AOI_1 (‘poser’) but did not fixate at all on
AOI_2 (‘power’), hence the blank cells. The same thing goes for V_7, who fixated
three times on the word ‘poser’ but none on ‘power’. In AOI_2 (subtitle containing
the word ‘power’) for V_1 and V_5 the value for ‘first fixation duration’ is the same
as ‘fixation duration’ (0.33 and 0.54 respectively) because the first fixation was in
fact the only participant’s fixation on the word ‘power’. Comparison of the AOI data
for the two selected scenes for all participants showed that:
1. The first fixation duration overall (across participants) was longer for ‘poser’
(AOI_1) than ‘power’ (AOI_2) by 1.2 seconds.
2. The number of fixations on ‘poser’ was higher than those on ‘power’ in each
individual participant apart from V_4 (who fixated three times on both
‘poser’ and ‘power’). Across participants, there were 22 total fixations on the
word ‘poser’ and only 7 on the word ‘power’.
3. The values representing the total fixation duration on AOI_1 and AOI_2 (last
two columns of the table), indicate that in each and every individual
participant more time was spent during fixations on AOI_1 than on AOI_2.
27
Points 2 and 3 in particular show the strongest evidence for the initial assumption
that more processing time is spent on the misspelled word, as this has been fixated
both more times and for longer. However, as previously mentioned, the results are
not intended to prove or disprove a point but to provide an example of what can be
achieved through the Visualisation and Statistics tabs in Tobii.
4.c Case study 3 – Translation in a separate application
For the third case study, a short excerpt (92 words) of an English article on
climate change taken from the Guardian was translated into Italian using MS Word.
The source text was opened in one window and the translation was typed in another.
Two window arrangements were tested, namely the vertical and horizontal
alignments. The Screen Recording mode was the only viable choice for this type of
experiment, as both MS Word windows need to be open and navigated freely, and
typically some online resources will be used during translation (thesaurus, reference
websites, dictionaries, and the like). Gaze movement between all these applications
and windows can be tracked only by recording the whole screen. In both test, the
sample rate of the tracker was between 50-60%. According to the Tobii StudioTM 2.X
User manual (p.57), this percentage shows the quality of the recording:
"The quality of the recording is calculated by dividing the number of eye
tracking samples that were correctly identified, by the number of attempts.
100% means that both eyes were found throughout the recording. 50%
means that one eye was found for the full recording or both eyes during half
the time. Note that the eyes cannot be found when a person is looking away
from the screen; this will result in a lower percentage."
If translating a text, looking away from the screen is inevitable as the user will have
to look down to the keyboard in order to type the translation, meaning the device
will lose track of their eyes. In spite of this, the accuracy of both recordings was good
overall. Mouse clicks were recorded correctly, the scan paths were aligned precisely
with the print lines in both the source and the target text, and gaze movement was
correctly followed as the user's eyes were switching between the two windows (see
figure 25 and 26).
28
Figure 25 - Scan paths during translation in the vertical window alignment in MS Word.
Figure 26 - Scan paths during translation in the horizontal window alignment in MS Word.
29
Tracking was also accurate on online pages (fig. 27 and 28), where the font had
variable sizes and was at times considerably smaller than in the two translation
windows.
Figure 27 - Accurate eye tracking during online browsing.
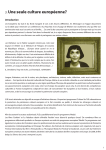
In the image below (fig. 28), the target text was overlaid onto a web page used for
reference. The user was compairing two similar Italian words to decide which one to
use, namely the term poesia (piece of poetry, poem) found in the Wikipedia page or
their initial translation poema (poem). The eye tracker picked up both fixations,
whose centres fall on or very close to said words on screen, proving tracking was
accurate. The only problem registered on websites was related to scrolling up and
down a page, which seemed to cause the scan paths to be out of sync with the gaze.
Figure 28 - Accurate tracking while using websites for reference during translation.
In Tobii Studio, the desired folder path (location of the files to be opened at the
beginning of the test) must be indicated in the Screen Recording dialogue window.
Only one path can be entered, meaning only one of the two windows will be
displayed and the user will have to align the other during the recording before
starting the actual translation. To save time, this can be avoided by aligning the two
documents before commencing the test. If only those two MS Word windows are
open and arranged in the desired way, they will appear side by side when starting
the recording.
30
In the horizontal alignment the visible page space is much smaller, meaning not
as much text is displayed on screen. However, this view entails a lesser degree of
page movement than its vertical counterpart. As you can see in fig. 25, the vertical
view does not allow the sentences to be displayed in their entirety, which involves a
considerable amount of left-to-right movement every time a new line is being read.
One cannot see in full the source sentence nor their translation as it is being typed.
Moreover, the tracking performance in the vertical alignment was slightly sketchier,
with less scan paths and more individual fixations being recorded. In general, the
user found the horizontal alignment better as there were fewer sentences visible on
screen without scrolling, but they were fully displayed and therefore did not require
moving the horizontal scroll bar at the bottom of the window, or enlarging the page
to its full size to see the text as a whole.
A difference was noted between top-to-bottom (scrolling) and left-to-right
movment, the latter being more easily and accurately traceable by the eye tracker,
perhaps becasue the linear progression of the gaze mirrored the left-to-right motion
of the horizontal bar.
5. LIMITATIONS AND OBSTACLES
Jacob and Karn (2003: 4) identify three main groups of limitations related to the
use of eye-tracking devices for research purposes: technical problems, labourintensive data extraction and data interpretation issues.
Some of the technical problems involved with the experiments have been the
subject of discussion here. Two technical issues that do not relate to any experiment
in particular, and yet might affect the implementation of any test are software
crashes and eye tracker ‘disappearance’. In the two-month period during which all
the experiments were carried out, the software crashed seven times whilst different
actions were being performed, e.g. while previewing a video before recording, while
replaying a clip, during a screen recording test or while moving between the
Statistics and Replay tabs. While there did not seem to be a particular action
triggering the crash, the application was more likely to stop working after having
been open for several hours.
Software-hardware communication also presented technical problems. In the set
of experiments carried out the basic set up has been adopted, where the tracker
needs to be connected to a standard power socket through a power cable and to the
computer through a LAN cable to USB adapter. Usually a minute or so after
pressing the power switch, the computer connects to the LAN line and Tobii ‘finds’
the tracker. If the device is correctly plugged in, the connection status bar at the
bottom of the screen will say ‘Eye tracker TX120-203-73000025 - Ok’. At times,
however, even if all these steps have been correctly followed and the tracker is
switched on (two blue lights flash at the sides of the device and two circular infrared lights come on), the connection is not established. While there did not seem to
be a clear explanation for this, it was found that by switching the power cable off
and on again, closing and re-opening the programme, or doing both, the connection
was normally re-established and Tobii Studio correctly recognised the tracker.
However, this can take some time and can therefore cause disruptions if happening
during an experiment with an external participant. This issue could be related to the
quality of the LAN cable, which had to be changed once during the two months of
testing. Since LAN cables are not very enduring it could be advisable to have a spare
one stored with the tracker.
31
Another major problem encountered, although not strictly a technical one, was
defining eye tracker accuracy. For the sake of this study, a very basic and intuitive
definition has been outlined, rather than a scientific one. It was sometimes quite
difficult to assess whether a scan path was not overlaid exactly with the print line
because of actual tracking inaccuracy, or because that was simply a feature of that
participant’s reading behaviour. A more comprehensive and precise definition of
tracker accuracy should be required as an essential pre-requisite to conduct
meaningful eye tracker based research in the future.
The labour-intensive data extraction issue is partially resolved in Tobii by
automated software calculations. On one hand, data collection seems to be relatively
easy; on the other, however, retrospective data analysis still presents researchers
with the challenge to ‘‘find appropriate ways to use and interpret data’’ (Jacob and
Karn, 2003: 1). Choosing the most suitable metrics for an experiment, for example,
is not always a straightforward task.
Moreover, fully understanding the gaze movement parameters available and
defining which ones are the most suitable for a specific experiment can present the
user with a great deal of difficulty. In Tobii Studio, statistics are based on fixations,
and even the software creators admit that there is a degree of subjectivity to their
identification:
“Fixation identification is mostly a mathematical and statistical process that
attempts to describe how the eye moves. Despite the accuracy and flexibility
of some of the algorithms, the limiting factor is that there is no precise
definition for the start and end of a fixation and thus the identification
process still remains partly subjective. Therefore, the best identification
validation process is still to perform a test where you compare the fixation
filter data with an observer’s subjective impression on the position and
duration of the fixations.” (Tobii StudioTM 2.X User manual, p.76)
Fixation filters are used to present the raw gaze data in a more meaningful way
through classifying it as ‘part of’ (or ‘not part of’) a fixation. To do so, a series of data
processing functions and different algorithms are used. The filters available in the
2.3.2.0 version of the software currently available within CTS are the following:
Tobii fixation filter, Raw Data fixation filter, ClearView fixation filter, I-VT fixation
filter. All but the last filter are addressed briefly in the 1.X User Manual. The I-VT
filter has been introduced later, so a definition and an explanation can be found only
in the Tobii StudioTM 2.X User Manual (pp. 9-15). In this study the default Tobii
fixation filter has been used. Users should be aware of the meaning and the different
effects that choosing different parameters will have on their research before settingup an experiment.
6. CONCLUSIVE REMARKS
The case studies presented above were not intended to provide a comprehensive
description of the several alternatives available in Tobii as far as experiment design,
set up, implementation and statistics are concerned. Points of interest in each of
these stages were identified and tested using some of the options offered by the
software.
Initially, the third case study was to include testing with two other separate
applications, namely PET and Translog II. PET is a tool for the post-editing of
translations and Translog is a piece of software for recording and studying reading
32
and writing processes on a computer which allows to monitor various aspects of the
translation progress5. The idea was to study eye tracker performance when used in
conjunction with these external applications relevant to linguists and translators in
particular. However, due to lack of administrator rights it was not possible to install
and run the two applications and therefore only testing of translation in MS Word
was carried out. Moreover, a fourth case study was envisaged, where eye tracking
was to be used as a support in the analysis of human response to the hearing of a
voice stimulus, or more precisely to investigate ‘‘the immediate effects of repairs on
listeners' linguistic predictions’’ (Corley, 2010: 706). Obstacles to the
implementation of this case study where identified in the limits of what media types
can be utilised by the software. As audio files alone are not supported in Tobii, the
source file would have had to be made into a flash animation. However, as the
desired source file was not provided, it was not possible to implement this particular
study. Future eye tracker based research in this direction is needed to test and
assess participants' response to speech repairs.
In terms of general information provided on Tobii, the software and hardware
features presented at the beginning of this document include what was relevant to
the case studies considered rather than giving a complete overview on the Tobii
technology. Ergo, studies of a different nature or carried out for different purposes
might have slightly different needs and requirements, implying the adoption of
different parameters in the setup, data collection and analysis.
Nevertheless, it is hoped that the various points analysed here and the
considerations stemmed from their analysis will be a useful starting point for other
users who wish to customise themselves with the device and eventually use it
confidently in their own experiments.
5
For more information on PET, see Aziz et al. (2012). For an article on Translog II, please refer to Carl
(2012).
33
7. APPENDIX
Case Study 1
a. A small excerpt from from a study of Mary Shelley’s ‘Frankenstein: or, The
Modern Prometheus’ written by Harold Bloom. Available from:
http://legacy.owensboro.kctcs.edu/crunyon/CE/Frankenstein/Bloom/3839_Bloom.htm
“A Romantic poet fought against self-consciousness through
the strength of what he called imagination, a more than rational
energy, by which thought could seek to heal itself. But
Frankenstein's daemon, though he is in the archetypal
situation of the Romantic Wanderer or Solitary, who
sometimes was a poet, can win no release from his own story
by telling it. His desperate desire for a mate is clearly an
attempt to find a Shelleyan Epipsyche or Blakean Emanation
for himself, a self within the self. But as he is the nightmare
actualization of Frankenstein's desire, he is himself an
emanation of Promethean yearnings, and his only double is his
creator and denier.”
34
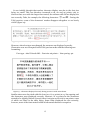
b. Excerpts from a text on the Chinese New Year taken from the Web:
http://wenku.baidu.com/view/c9386127192e45361066f520.html
中国年逐渐融入老外生活
2010 年春节期间,美国纽约时代广场上,纳斯达克总部大楼外的大屏幕
打出了恭贺中国新春的图案和中英文字样。
中华民族最盛大的传统节日——春节即将来临。每年春节,中国人
都会按照祖先传下来的风俗习惯阖家团聚、辞旧迎新。而现在,来自世
界各地在中国学习、工作的外国友人也逐渐融入了中国的文化传统中,
喜欢并享受着春节这个喜庆热闹的节日,和中国人一起红红火火“过大年”
。
法国人阿莱克斯·杜波已经在中国生活了近六年,学习过两年中文的他正
在对外经济贸易大学学习国际贸易,他自言正在过真正的“中国式生活”。
对于春节这一中国人特有的传统节日,阿莱克斯的认知和中国人已经没
有什么两样了。
“确实是这样,现在我完全是以中国人的方式在生活。我在这里已经
生活了快六年,所以我度假和过节都是按照中国人的习惯。我也和中国
人一样,中国新年对我来说也是一个休息放松的机会,并且可以长达十
几天。同时,春节期间,我的父母也可以从法国来北京和我团聚,所以
说我的春节符合中国的习惯,也是家庭团聚的好机会。”
近些年来,越来越多的美国人开始认识“中国年”。美国财政部造币和印
钞局从 2002 年起发行中国生肖吉利纪念币,为美国华裔社区送上新春祝
福。一些美国网站在春节到来前推出专门介绍春节知识的网页。在纽约
州,春节已经成为法定节日。而中国社团每年举行的迎新春活动也已成
为美国百姓了解中国文化的一个窗口。一些普通美国人对中国春节的习
俗能够脱口而出。
35
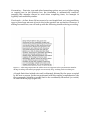
c. Reading comprehension ‘Dirty Britain’, available from:
http://www.usingenglish.com/comprehension/29.html
Dirty Britain
Before the grass has thickened on the roadside verges and leaves have started growing on
the trees is a perfect time to look around and see just how dirty Britain has become. The
pavements are stained with chewing gum that has been spat out and the gutters are full of
discarded fast food cartons. Years ago I remember travelling abroad and being saddened by
the plastic bags, discarded bottles and soiled nappies at the edge of every road. Nowadays,
Britain seems to look at least as bad. What has gone wrong?
The problem is that the rubbish created by our increasingly mobile lives lasts a lot longer
than before. If it is not cleared up and properly thrown away, it stays in the undergrowth for
years; a semi-permanent reminder of what a tatty little country we have now.
Firstly, it is estimated that 10 billion plastic bags have been given to shoppers. These will
take anything from 100 to 1,000 years to rot. However, it is not as if there is no solution to
this. A few years ago, the Irish government introduced a tax on non-recyclable carrier bags
and in three months reduced their use by 90%. When he was a minister, Michael Meacher
attempted to introduce a similar arrangement in Britain. The plastics industry protested, of
course. However, they need not have bothered; the idea was killed before it could draw
breath, leaving supermarkets free to give away plastic bags.
What is clearly necessary right now is some sort of combined initiative, both individual and
collective, before it is too late. The alternative is to continue sliding downhill until we have a
country that looks like a vast municipal rubbish tip. We may well be at the tipping point. Yet
we know that people respond to their environment. If things around them are clean and tidy,
people behave cleanly and tidily. If they are surrounded by squalor, they behave squalidly.
Now, much of Britain looks pretty squalid. What will it look like in five years?
Questions
Q1 - The writer says that it is a good time to see Britain before the trees have leaves because
Britain looks perfect.
you can see Britain at its dirtiest.
you can see how dirty Britain is now.
the grass has thickened on the verges.
Q2 - According to the writer, things used to be
worse abroad.
the same abroad.
better abroad.
worse, but now things are better abroad.
36
Q3 - For the writer, the problem is that
rubbish is not cleared up.
rubbish last longer than it used to.
our society is increasingly mobile.
Britain is a tatty country.
Q4 - Michael Meacher
followed the Irish example with a tax on plastic bags.
tried to follow the Irish example with a tax on plastic bags.
made no attempt to follow the Irish example with a tax on plastic bags.
had problems with the plastics industry who weren't bothered about the tax.
Q5 - The writer thinks
it is too late to do anything.
we are at the tipping point.
there is no alternative.
we need to work together to solve the problem.
Q6 - The writer thinks that
people are squalid.
people behave according to what they see around them.
people are clean and tidy.
people are like a vast municipal rubbish tip.
37
8. BIBLIOGRAPHY
Aziz, W., Sousa, S. C. M. and Specia, L. (2012). PET: a tool for post-editing and
assessing machine translation. In: The Eighth International Conference on
Language Resources and Evaluation, LREC ’12, Istanbul, Turkey [online] Available
at: <http://pers-www.wlv.ac.uk/~in1676/publications/2012/AZIZ+LREC2012.pdf>
[Accessed 10 July 2012].
Böhme M., Meyer, A., Martinetz, T. and Barth , E. (2006). Remote Eye Tracking:
State of the Art and Directions for Future Development. In: The 2nd Conference on
Communication by Gaze Interaction – COGAIN 2006: Gazing into the Future.
[online]
Available
at:
<http://www.inb.uniluebeck.de/publikationen/pdfs/BoMeMaBa06.pdf> [Accessed 20 June 2012].
Bloom, H. (1965). An excerpt from a study of ‘Frankenstein: or, The New
Prometheus’. In: Partisan Review. 32, 4, pp. 611-618. [online] Available at: <
http://legacy.owensboro.kctcs.edu/crunyon/CE/Frankenstein/Bloom/3839_Bloom.htm> [Accessed 25 June 2012].
Carl, M. (2012) Translog-II: a Program for Recording User Activity Data for
Empirical Reading and Writing Research. In: Proceedings of the Eight
International Conference on Language Resources and Evaluation (LREC'12).
[online]
Available
at:
<http://www.lrecconf.org/proceedings/lrec2012/summaries/614.html> [Accessed 25 July 2012].
Corley, M. (2010). Making predictions from speech with repairs: Evidence from eye
movements. In: Language and Cognitive Processes, 25, 5, pp. 706-727. [online]
Available
at:
<http://www.tandfonline.com/doi/pdf/10.1080/01690960903512489> [Accessed
25 June 2012].
Duchowski, A. T. (2002). A breadth-first survey of eye-tracking applications. In:
Behavior Research Methods, Instruments, & Computers 2002, 34 (4), pp. 455-470.
Dyson, M. (2004). How physical text layout affects reading from screen. In:
Behaviour and Information Technology, 23(6), pp. 377-393. [online] Available at:
<http://dx.doi.org/10.1080/01449290410001715714> [Accessed 28 July 2012].
Jacob, R. J.K. and Karn, K. S. (2003). Commentary on Section 4. Eye tracking in
human-computer interaction and usability research: Ready to deliver the promises.
In: The Mind’s Eye, Elsevier, North Holland. [online] Available at:<
http://www.google.co.uk/url?sa=t&rct=j&q=&esrc=s&frm=1&source=web&cd=1&v
ed=0CEoQFjAA&url=http%3A%2F%2Fciteseerx.ist.psu.edu%2Fviewdoc%2Fdownl
oad%3Fdoi%3D10.1.1.100.445%26rep%3Drep1%26type%3Dpdf&ei=gg4dUPLhF4G
a0QWyw4GgCw&usg=AFQjCNG5dzyKgmZUbwnEPNaE1uAYEpgFNA> [Accessed
19 July 2012]
Monbiot, G. (2012). Stop this culture of paying politicians for denying climate
change. Guardian.co.uk Environment blog, [blog] 02 August. Available at:
38
<http://www.guardian.co.uk/environment/georgemonbiot/2012/aug/02/climatechange-political-funding-us> [Accessed 28 July 2012].
Noe, A. (2006). AVI File Format, [online] Available at: <www.alexandernoe.com/video/documentation/avi.pdf> [Accessed 15 June 2012].
Poole, A. (2008). Which Are More Legible: Serif or Sans Serif Typefaces? [online]
Available at: <http://alexpoole.info/blog/which-are-more-legible-serif-or-sansserif-typefaces> [Accessed 15 July 2012].
Rayner, K. (1998). Eye movements in reading and information processing: 20 years
of research. In: Psychological Bulletin, 124, pp. 372-422.
Schiessl, M., Duda, S., Thölke, A. And Fischer, R. (2003). Eye tracking and its
application in usability and media research. In: MMIInteraktiv, 6 (6), pp. 1-10.
Boston: William F. Connell School of Nursing. [online] Available at: <http://deesquare.com/mediapool/120/1207353/data/Eye_Tracking_Application_Duda.pdf>
[Accessed 03 July 2012]
Tobii Eye Tracking. An introduction to eye tracking and Tobii Eye Trackers. Tobii
Technology,
White
Paper.
[online]
Available
at:
<http://www.tobii.com/Global/Analysis/Training/WhitePapers/Tobii_EyeTrackin
g_Introduction_WhitePaper.pdf> [Accessed 20 July 2012]
Tobii StudioTM 2.X, User manual release 1.0, Software Release 2.2. (2010). Copyright
Tobii ® Technology AB.
Tobii Studio 1.X, User manual v. 1.0. (2008). Copyright Tobii Technology.
Tobii X120 Eye Tracker User Manual, Revision 2.0. (2008). Copyright Tobii®
Technology AB.
Tobii T/X Series Eye Tracker Product Description (2007). Copyright Tobii ®
Technology AB.
39