1
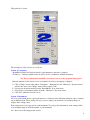
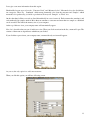
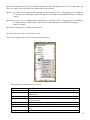
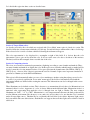
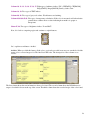
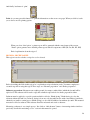
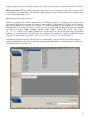
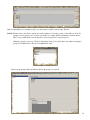
2
USER MANUAL
This book is intended to explain how to use “ShadeArt”, a color measurement, quality control,
recipe prediction software.
Before to begin:
The minimum requirements of the computer to run ShadeArt are as follows
512 Mb RAM
50 Gb HardDisk
CD driver
Monitor supporting 1280x1024 pixel resolution
Video card supporting 1280x1024 pixel resolution
Windows Me, Xp, NT, 2000 operating system
1 piece USB port
Keyboard
Mouse
Color printer
3
Dear customer,
We congratulate you for your choice to be a member of ‘ShadeArt family”. You can now start to overcome the color
related problems one-step ahead. You are going to understand what we mean once you read this manual and you are
proud of you.
Before starting to explain ShadeArt, we strongly remind to visit official web site www.artoksi.com of the owner of
ShadeArt, ‘Artoksi Engineering Arts Center, perodically. This helps to catch new improvements which may your
life easier.
Besides, we espacially take your notice to another state-of-art product which gets impressive feedbacks from all
over the world. We call this product “Color Calculation Treasure”. This product lets the people to write a color
matching software without knowing how to do. Interesting? We say, “do not think you can not succeed. Be
independent!”. You can get detailed informations on our web site www.artoksi.com.
Finally, we wish to inform that, we always need your suggestions and friendship. We would be very glad if we
could have any assitance on your achiveness.
Wellcome…
Best regards,
Engineering Arts Center
4
Fırst steps:
Instaling the software is very simple. The only thing you need to do is to run the ShadeArt Setup.exe file in the CD.
The program will be automatically intall on your computer with an usual Windows installation steps.
When yo run the software at first, you will be asked with three question in a window. These are language,
instrument brand/model you have and communication channel number. The window will be as follows
ShadeArt Pro can talk in any language. Turkish and English is already installed. If you wish to use another language
you need to perform a step before running the software. There is an Access file, ‘abc.mdb’ in the directory you
installed. Open it and fill the USER column with the terms according to equivelents. After finishing it, run ShadeArt
pro and select “User” as language. ShadeArt will talk to you with the language you preferred.
ShadeArt Pro can also communicate with almost all model of well known color measurement instruments,
GretagMacbeth and KonicaMinolta. Select any of this as instrument. You can also select “Demo” option which lets
the ShadeArt Pro to work without a color measurement device.
If you use any device you need to specify a communication port tol et the software to communicate with device.
This is the number of serial port wich was assigned by Windows operating system. If you have selected ‘Demo’
option as instrument, channel settings will be uneffective.
When you fill three fields pres “Go”. That’s all. This window will not appear again when yo run ShadeArt pro next
time. You can also change all these three settings at any time when you are running the software. This will be
explained later in this manual.
5
The welcome screen of ShadeArt Pro is as follows. You are now at a gate of ShadeArt’s magnificant world.
Let’s have look at this window.
The name of the software is at upmost: ShadeArt Pro.
The version information is just benetah of it. The higher number the newer version. You can check it via our web
site www.artoksi.com if it is newest version.
You can see our email adres which you use to contact us for your all questions regarding the product. When you
click any place on this window, you reach the new window which we call “Main window”.
6
As you see, main window consist of 6 regions. Each of this has special purpose as will be explained detailed in this
document. The regions are numbered as follows.
7
Bu pencelerin isimleri ve işlevleri kısaca aşağıdaki gibidir:
Region 1:
Status panel
Shows color measurement instrument’s status currently connected to
computer.
Region 2:
Licencing panel
Shows licensing information (licensed to ….)
Region 3:
Advertisement panel
It is to make you informed of our other products
Region 4:
Record panel
Region 5:
Comparing panel
Region 6:
Recipe panel
All customers, thier standartds, your samples is listed in this panel
hierarchically in tree view mode.
Shows the rich results about the differences amongst colors selected from
region 4 by the user.
Calculates a recipe for color from region 4 selected by the user
Now, let give more details about each of these regions.
REGION 1: STATUS PANEL
As describe above, status panel gives detailed status information about the device connected to computer.
8
This panel has 3 section.
The descriptions of the sections are as follows.
Section 1: Connection
Brand/Model: Refers the brand and model of the intrument connected to computer.
Channel no : Indicates which serial port will be used to communicate with the instrument.
PS: These 2 informations should be selected correctly to let the program run properly.
If the information on this sections is not correct then follow below description to change it.
1) Click “Change” button at the right of ‘Channel no’. ‘Brand/model’ and ‘Channel no’ dropdown menu
will turn into active and “Chnage” button will be replaced “Ok”.
2) Select proper brand and model from the ‘Brand/Model’ drop down menu.
3) Select proper serial channel number from the “Channel no’ drop down menu
4) Click “Ok” when the selections are ok.
Section 2: Instrument
All color measurement devices (spectrophotometers, colorimeters) have different settings in order to let them
use in different fields. These settings are set by user according to the metarial to be measured. Region 2,
displays these settings status.
Each settings may not be supported by each instrument. You can get the informations about settings which
your instrument supports from the manual of your instrument.
Let’s have look at the settings in this section.
9
UV Position
UV fitler is needed to measure optically white meterails. If your instrument has an adjustable UV fitler
then you can use this setting. UV filter is used to eliminate UV component of the light which is emited
by the light source of the instrument during measurement.
Upmost option, “%100 Included”, means no UV filtering. The other option represent UV filtering in
different styles. .Your instrument may not support all of these options even it has an adjustable UV
fitler.You can get detailed information about your instrument’s UV fitler styles from the user manual of
device. Let’s now have look at the UV filtering styles.
UV position
Description
%100 Included
No UV filtering or UV fitler is not active. In this case, the measurement results
will have UV lights effects. Commonly used for colored surfaces.
%100 Excluded
UV fitler is in action. All UV components from the light source is filtered. In
this case, the measurement results will have UV lights effects. Commonly used
for optically white samples.
Excluded 400nm
UV components at 400nm wavelength is filtered.
Excluded 400nm (low) UV components at 400nm wavelength in low illumination is filtered.
Excluded 420nm
UV components at 420nm wavelength is filtered.
Excluded 420nm (low) UV components at 420nm wavelength in low illumination is filtered.
Partial 400nm
UV components at 400nm wavelength is patially filtered.
Partial 400nm (low)
UV components at 400nm wavelength in low illumination is partially filtered.
Partial 420nm
UV components at 420nm wavelength is patially filtered.
Partial 420nm (low)
UV components at 400nm wavelength in low illumination is patially filtered.
Mode:
Some color measurement devices can perform transmission measurement. This is used to measure the
liquids or to determine the transperancy of the sample.
Mode
Description
Reflection
Reflective measurement. The light emited from the lightsource is directed to the
sample to be measured and the light reflecting back from sample is measured. This is
a method for opaque samples
Transmission
Transmission measurement. The light from the lightsource is passed through the
liquid and the light outputs from the liquid is measured. This is a method for
transparent samples.
SCI/E:
The position of Specular Component. It is either INCLUDED (SCI) or EXCLUDED (SCE). This is for
measuring the color for the sample which emites lights itself. (like neon or phosphoric samples).
SCI/E position Description
SCI
Specular component included. For normal samples
SCE
Specular component excluded. For light emiting samples
Wiew:
The measurement area can be changeable for some color measurement devices. The more accurate
measurement the more measurement area. In the other hand, if sample size is not enough big then
measurement area is forced to smaller size if the instrument lets.
Wiew
Description
Large (LAV)
Large area view.
Medium (MAV)
Medium area view
Small (SAV)
Small area view
Very small (VSAV) Very small area view
10
Lens position:
The position of the lens should be set according to the view type selected. These 2 parameters (wiew and
Lens) should match to focus the light to the measurement area.
Lens position
Description
Large (LAV)
Lens position is set for focusing to the large area view
Medium (MAV)
Lens position is set for focusing to the medium area view
Small (SAV)
Lens position is set for focusing to the small area view
Very small (VSAV) Lens position is set for focusing to the very small area view
Calibration:
The instrument must be calibrated before taking any measurement. If the calibration is not done then
measurment can not be performed in any way. Some of instrument may need only white calibration and
some others need both white and black calibration.
The sign shows that corresponding calibration was done succesfully.
Section 3: Making calibration
There are two buttons in this section. One of them is to calibrate the instrument with white and the other with
black.
As mentioned above, some of instruments may only need white calibration some others may need both. You can
get correct information about your instrument’s calibration process from the intrument’s user manual.
If the instrument need both then the sequence of the calibration is also important and differs for each instrument.
You should know the sequence (first white and then black or vice versa) and obey it. You can also get correct
information about it from the user manual of the instrument.
Calibration must be performed when one of following situation occured.
1)
2)
3)
4)
When the instrument powered on
When any settings of instrument (view, lens, UV, SCI/E) changed
The temporature of enviroment (i.e room) changed plus or minus 5 degrees or more
6 hours later after the last calibration.
The calibration process is done with the special parts supplied with instruments. These are commonly known
“White calibration plate/ceramic” for white calibration and “Black trap” for black calibration.
REGION 2: LICENSING
This regions displays licensing information about the software you are using.
The region has only two information which can be edited by the customer. The others are permanent. The only
editable area is the contact information (telephone and web) of your company.
11
When you need to change contact information, just click ‘change’ button and change the infromations as you
wish and click the same button again. These contact informations are also used as a footnote in all printer
reports.
The permanent informations in this region are follows
Information type
Description
Licence owner (user license) The purchaer of the software. Your company name.
White plate no
Serial number of the white calibration plate.
Instrument serial
Intrument body serial number
Software model
The modal of software
01 Quality control
02 Quality control + Recipe prediciton (full version)
Integration
If the software is configured to communicate with other systems
(like automation system, pipetting system etc), the corresponding
code will appear in here. Code “00” means no integration.
REGION 3: ADVERTSING
This region is to keep you informed about our other products. When you click any place on this region, you will be
forwarded to new screen which have a general list and descriptions abou aur product range. As our product range is
improving day by day, the contents of the page may not represent the latest product range. It is beter to visit our web
site www.artoksi.com
REGION 4: RECORDS
This region displays all your records. These are, customers, standarts and samples. All records are displayed
hierarchically in tree wiew. So, you can easily distinguish the record at first look.
12
Let us give some more information about this region.
ShadeArt Pro has two types of records. “Customer Cards” and “Measured colors”. Measured colors also divided into
two cetagories. These are, ‘Standartds’ which means demanded color from the customer and ‘Samples’ which
means the color produced by you in lab or production. We may call “Samples” as ‘Trials’ also.
On the other hand, all these records are listed hierarchically in a tree view mode. Each customer has standart(s) and
each standard(s) has samples under it. More than one standart to a customer and more than one sample to a Standard
can be recorded. The limit is the memory size of your computer.
At the top of this tree view, your company name will automatically appear.
Now, let’s desceribe what can you do in this tree view. When you click on an item in the list, a menu will open. The
contents of the menu are dependent to which item you clicked.
If you click the top most item, your company name, a menu with only one item will apprear.
As you see, the only option is to add a new customer.
When you click this option you will have following screen.
13
You are now facing the first difference of ShadeArt Pro then other compatitors. Color evaluation criterias and
methods is different for each customer. Color space, light sources, observer and pass/fail limits can be assigned to a
customer specifically so that each time you compare colors for that customer it is recognized automatically.
The settings in this frame are as follows.
DL
Pass/Fail limit for lightnes
Da
Pass/Fail limit for redness/grenness
Db
Pass/Fail limit for yellowness/blueness
DC
Pass/Fail limit for chroma
DH
Pass/Fail limit for hue
Color space
Internationaly accepted method to covert the color into a numerical
equivelents.
Light source 3 light source to be used while comparing the colors to see differences and metarmerism.
Observer
2 or 10 degree. Represents virtual viewing angle
These settings will be filled automatically when the screen comes out. If you are not sure about the settings then
leave them as is.
Now, lets back to previous screen.
If you click on a customer on tree view then a menu with more then one option will appear.
Here are the descriptions of the menu items.
Menu item
Delete customer
Clear customer
Show cutomer
Add standard
Description
Deletes selected customer with all colors (standards, samples)
Deletes only all colors of the selected customer. Does not delete customer
himself.
Displays customer all details entered while creating it.
Lets you jump the measurement screen to add a color as standard to the
selected customer.
When you select ‘Add standard’, the following measurement screen will open.
14
When click ‘Measure’ button, a measurement is taken by the device and results will be displayed in screen similar to
the following.
15
Almost all informations for the color are displayed in the screen. The only thing you need to do is to put a name and
select one of three options and click ‘Save’ button. Three options means,
Option 1: Saves the color as a standart to the customer and also sends this color to “comparing panel” automatically
as a standard color. This helps to reduce the steps about saving the color and then selecting it as standart to
compare.
Option 2: Saves the color as a standart to the customer and also sends this color to “comparing panel” automatically
as a sample/trial color. This helps to reduce the steps about saving the color and then selecting it as
sample to compare.
Option3: Saves the color as a standart to the customer.
Now, let’s take back to the “records region” screen.
If you click a standart on tree view the following menu will open.
The description of menu items are as follows.
Menü item
Delete standard
Clear standard
Edit standard
Add trial
Set as main
Set as trial
Calculate recipe
Correction recipe
Description
Deletes selected standard with all sample colors
Deletes only all sample colors of the selected standard. Does not delete
standard itself.
Displays the details of selected standard.
Lets you jump the measurement screen to add a color as trial to the
selected standard.
Sends the selected color to “Color Comparison region” as a target color.
Sends the selected color to “Color Comparison region” as a trial color.
Send the selected color to “Recipe prediction region” to calculate its
recipe.
Under construction. Not ready yet.
16
When you select ‘Add trial” option following screen comes out.
A measurement is taken by clicking the “Measure” buton.
17
This screen is different then previously explained “measuring a standard” screen. You are now facing another point
which makes ShadeArt better then others.
In this screen, it is not enough to put a name for the color. You should also input the recipe of that color. As the
color measured is prepared in your la bor production you know the recipe!
In order to input the recipe of the color first select a “Dye group”. Defining a dye group is to explained in “Recipe
Panel” (Region 6) in this manual.
When you select a dye group, new fields will appear automatically.
Select the dyes and amount (%c) informations of this color and substrate into these fields. The combo boxes (Dye1,
Dye2, Dye3, Dye4, Dye5) will will be automatically filled with your dyes you defined before. Defining a new dye
process will be explained later in this document. As yo can define your existing dyes, the fields of Dye1, Dye2,
Dye3, Dye4 and Dye5 will list your dye names. You can define as many dyes as you want.
Here is a sample screen filled with a recipe.
As soon as you enter the recipe of the color and press “Save” button, ShadeArt calcultes the recipe information and
finds a calculated color. This calculated color is compared with the color you measured and the differences (if exist)
is reported in a window similar to follows.
18
If you think that the difference is due to wrong information you entered (like wrong dyename or amount), click ‘No’
to return to previous window. If the recipe is correct then click ‘Yes’ button.
Once you click ‘Yes’, ShadeArt will stores this color and its recipewith a correction factor. This correction factor is
used for the colors for the next time while calculation another recipe around that color. This meakes ShadeArt
smarter. This means that you can get beter recipies as much as you record the sample/trial colors in archive. We call
this ‘smart recipe system’.
Smart Recipe System, is automatically recognized by the software while you calculating a recipe. The system
searchs the sample/trial colors in the archive fort he near colors to target. If any near color found in arhive, it also
added to recipe report screen and gives you a chance to modify it manually by clicking it.
19
Now, let’s take back to “Records Region” window.
When you click a sample/trial color in this windows, the menu will open as follows.
Description of the menu items are below
Menu item
Delete trial
Change trial
Set as main
Set as trial
Calculate recipe
Correction recipe
Description
Deletes trial color
Displays trial details
Sends the selected color to “Color Comparison region” as a target color.
Sends the selected color to “Color Comparison region” as a trial color.
Send the selected color to “Recipe prediction region” to calculate its
recipe.
Under construction. Not ready yet.
REGION 5: COMPARING PANEL
This region is used to get various informations about the differences of a color versus to one or more colors.
20
Let’s divide this region into three section to describe better.
Section 1: Target (Main) color:
As describe previously, the color which was assigned with ‘Set as Main” menu option is placed tsis section. The
first filed shows the customer name which the color belongs. Second field shows standart name of the color belongs.
If the selected color is a trial color then a third field showing the trial name will appear.
The color represantation is also displayed in a rectangular at right of this fields. It is obvious that, the color
information is just to give an idea about the color. It does not refer exact color due to deviations of the monitors.
The date just below this rectangule shows recorded date of the color.
Section 2: Comparing criterias
The colors are converted to numerical representations (digitizing) according to some formulas and methods. There
are many formulas and methods to digitize the color. In this region, user can define which formula or method will be
used to convert the color into numerical values. Color space represents the formula name (like CIELab, CMC[1:1],
CMC[2:1] etc), observer (10 or 2 degree) represents the version of formula. Light sources represents simulation of
perceivness of human eye under different illuminants.
This region is filled automatically when you set a color as main/target. Another saying that, when you send a color
to section 1 (as previously explained in “Set as main” menu option), the fields are automatically filled with the
informations which was defined while creating the customer. This informations can also be changed in this screen
temporarily.
Three illuminants can be defined at a time. This is because to see metamerism effect for the color. Metamerism is an
unwanted effect for colors. Apperance of a color is always different under different lights. Metemerism index is a
numerical value representing how much the color is changed from one light to another. The most common
illuminants are “D65”, “”A” ve “CWF”. Metamerism is a very important matter. Because the final product will be
used in different environment (like showcase, room, outdor etc) and you have to be sure that the color is matched
under all target light sources. ShadeArt Pro let you identify this bad effect if exist before shipment. Light sources
has been named with some abbreviations. ShadeArt Pro can support almost all these light sources which is listed in
table below.
21
LIGHT SOURCE SELECTION TABLE
Light source
abbreviations
“A”
“C”
“CWF”
“D50”
“D65”
“D75”
“U30”
“TL83”
“TL84”
“F2”
“F7”
“F11”
“NBF11”
Description
Incandencent A (2856K). Represents home and store illumination.
Suitable for metamerism evaluation.
Halojen daylight (6775K). CIE avarage daylight. Suitable for metamerism
evaluation.
White flouresance (Cool white at 4150K). Also known as “F2”. Suitable
for metamerism evaluation.
Northern hemisphere daylight (5000K). Suitable for metamerism and
general color evaluation.
Avarage Nortern hemisphere daylight (6500K). Suitable for metamerism
and general color evaluation. Corresponds Europe and Japan standards.
Suitable for metamerism and general color evaluation. (7500K). Suitable
for metamerism and general color evaluation. Preferable fort he opaque
metarials in ASTM D1729 standard.
Ultralume30 (3000K). Also known as F12 or TL83.. Represents
flourescent light in Sears stores.
Philips TL83 (3000K). Similar to U30 or F12. Represents general Europa
and pacific flouresance illumination standard.
Philips TL84 (4100K). Similar to F11. Represents general Europa and
pacific flouresance illumination standard.
Wide band flouresance (4150K). Similar to “CWF”. Suitable for
metamerism test. Represents USA home and store illumination.
Wide band flouresance (6500K). Similar to D65. Suitable for metamerism
test. Represents USA flouresance illumination.
Philips TL84 (4000K). Similar to Ultralume40. Represents USA narrow
band flouresance illumination. Suitable for metamerism test.
Narrow band flouresance. Represents USA narrow band flouresance
illumination. Suitable for metamerism test.
When you change any criteria in this section (i.e color space, observer, light sources), the all calculations will be
automatically recalculated and the results (L*, a*, b*, C*, H*, DeltaE, assesments, metamerism indices) is displayed
instantly.
This section also consists of a sub section refering acceptance limits of differences. We call these as Pass/Fail
limits. ShadeArt decides the color is matched or not according to these limits values.
These fields ar also filled automaticallay when you set a color as main. These values comes from customer’s card of
the color belongs. You also change this values temporarily.
Section 3: Results
All the detailed results about differences between the main (target) color versus many samples (trial) are displeyed
here. It is organized as a table and each line represents a color. The meanings of the coloumns are as follows.
Column 1: The name of the customer which the color belongs. The owner of the color.
Column 2: The name of the ‘standard’ which the color belongs.
Column 3: This filed is only field if the selected color is a trial/sample color. It refers the name of the sample
color.
Column 4: Visual representation of the selected color.
Column 5: Delta E difference calculated according to the color space and the first illuminants specified
in section 2 (comparing criterias)
Column 6: Pass or fail decision according to the difference in column 5.
22
Sütun 7: Delta E difference calculated according to the color space and the second illuminants specified
in section 2 (comparing criterias)
Sütun 8: Pass or fail decision according to the difference in column 7
Sütun 9: Delta E difference calculated according to the color space and the third illuminants specified
in section 2 (comparing criterias)
Sütun 10: Pass or fail decision according to the difference in column 9.
Sütun 11: Metamerism index comparing illuminat 1 to illuminant 2.
Sütun 12: Metamerism index comparing illuminat 1 to illuminant 3.
Sütun 13: Metamerism index comparing illuminat 2 to illuminant 3.
Sütun 14: Assesment about the color according to D65/10 (daylight – 10 degree observer)
Above sample screen shows a comparison table for a standard versus 4 samples.
There are also 3 buttons on this screen.
These buttons has been has been associated to following tasks.
Details: This button takes you to another screen which has more details
This new screen has 7 devisions. Here are the explanations of these devisions.
L*a*b* color space: This is a visual and graphical representation of the colors in a single L*a*b*
coordinate system.
It is a good idea to explain this graphical representation.
The graphic consist of two portions. First portion shows two-dimesional a*b* coordinate system and
the second shows L* one-dimensional coordinate system.
L* means lightness of a color. a* and b* means coloring ingredients of a color.
Axis a* is the horizantal axis and positive values represent red and negative values represent green
region.
Axis b* is the vertical axis and positive values represent yellow and negative values represent blue
region.
23
The target (or main) color is assumed at the middle of the both graphics. The middle of the graphic of
the left one is the intersection points of a* and b* axis. The middle of the graphic of the right one is the
middle point which is labeled with L=0. All the sample colors are represented with small green circles
on this graphics. Each color is represented with two green circles, one for a*b* coordinate system and
one for L* coordinate system. The nearer to origin the closest match.
As this program can compare one color to multiple color many green circles may appear on the both
graphics. There is way to identify the pairs of colors in both screen. If you click on any green circle the
other complementary green circle will also change its shape. This a good way to locate the color for its
particular place on both graphic.
You may also want to learn the name of the color of a particular green circle represents. If you drag
over the mouse on any green circle for a few seconds it will display the name of the color which is
represented by it.
The rectangules with dotted line represents pass/fail limits which was desceribed in previous screen.
Inside of it is “Pass” and outside “Fail”.
If the difference is very big it will not be shown on the graphics. Another saying that if the difference is
very big, the green circle will be out of graphics boundires. In such cases, you can decrease the scale of
graphics via setting “scaling factor” to a value less then 100% at the top of the left graphic.
On the other hand, some of colors may be so close that green circles may seemed overlapped. In such
case you can increase the scale of graphics via “scaling factor” to a value more then 100% at the top of
the left graphic.
Chromaticicty diagram: Another way to represent the colors on a colored graphic is “Chromaticity
diagram”. The color set as main is represented with a asteriks mark and sample color are represented
with a black circle on it. This diagram is to give general hint about the correlations of colors but does
not give any idea about lightness degree.
24
As in the case of previous graphic presenttion, when you drag over the mouse on any color on this graphic,
its name is displayed automatically.
Reflectance curves: Measuring a color via spectrophotometer is to get a few numerical values between 0
and 200 for a certain range of visible area (360nm-750nm). These values are named as “reflectance values”
of the color. Most spectrophotometers can scan this range with 10nm intervals. This means that 40 pieces
reflectance values are obtained for the range of 400nm-750nm. Each wavelenght represent a color shade.
Horizantal axis represents wavelength and vertical axis represents how much percentage of light is measured
for that wavelegth.
Red-white dotted curve is for target color and others ar efor sample colors. This curves shows how much
light from the meausered color is being reflected for each wavelength. Reflection is labeled as %R.
Absorbtion curves: Absorbtion can be considered as the opposite of reflectance. This curves shows how
much light is being absorbed by the color easured. Absorbtion is labeled as ‘K/s’.
25
Variation follow-up: In most cases, customer brings a color as target and you produce it in your plant fort
hat order. If you are producing that color in diferent times for a single standard you may want to know what
is the color variation of your production is going on. Are you still around the target in a acceptible variation
or are you edging away from the target day by day? This is a very annoying problem especially fort he bulk
productions which is unable to produce in a single time. Each partition of the same production should be
enough identical to each other.
This charts is designed as an answer to this problem. There are 4 charts on the screen representing DL*
(lighter/darker variation), Da* (redder/greener variation), Db* (bluer/yellower variation) and finally DE
(total variation).
How to comment these 4 charts.
Horizantal axis of all 4 charts shows the colors and horizantal exis shows values.
Chart 1 (DL –Lighter/Darker): The lightness of targer color is at zero line. If the other colors on chart goes
negative are (below zero), the sample is darker then target. If the color goes positive area (above zero) then
the sample is lighter then target.
Chart 2 (Da – redness/greennes): Target is at zero line. If the other colors on chart goes negative are (below
zero), the sample is greener then target. If the color goes positive area (above zero) then the sample is redder
then target.
Chart 3 (Db – blueness/yellowness): Target is at zero line. If the other colors on chart goes negative are
(below zero), the sample is yellower then target. If the color goes positive area (above zero) then the sample
is bluer then target.
Chart 4 (DE – Total variation): Target is at zero line. Technically it is not possible to have minues values for
total variation. The more farer from the base line the more total variation is.
Grouping/lotting: If you are making serial production then sometimes you may need to classifiy them to put
the nearer color in same batch. This section is intended to classify the production for this purpose.
26
Grouping can be done according to three criterias. These are “by DE, by yellowness index (ASTM1925) and by
whitness index (Berger)”. This can be selected from dropdown menu at top left “Grouping criteria”.
Precision value is to tell the program how much difference can be in a same batch. All the colors in listed in the
table. The left most column in each line has a value which is automatically calculted showing the bacth number
according to criteria you entered. Same number in many lines shows the color to put in same batch.
Indices: In many times, some additional informations may need to identify the colors. This sort of informations
are called “Indices”. There are many indices for differents industries. This screen shows a list of commonly
used indices for the colors. As indices are many, all of them can not be displayed in a screen same time. You
can use sliding bars to see all of them.
Here are the indices list which the table shows.
Cloumn 1: Name of the customer
Column 2: Name of the standard
Column 3: Name of trial (if exist)
Column 4,5,6: Tristimulus values (X, Y and Z) of the color
Column 7,8,9: Chromaticity values (x,y and z) of the color
Column 10,11,12,13: L (lighter/darker), a (redder/yellower), b (bluer/yellower) ve DE (total) difference to target color for
CIEL*a*b* color space with 10 degree observer under illuminant D65 daylight.
Column 14,15,16,17: L (lighter/darker), a (redder/yellower), b (bluer/yellower) ve DE (total) difference to target color for
HunterLab color space with 10 degree observer under illuminant D65 daylight.
Column 18,19,20,21,22,23: L (lighter/darker), a (redder/yellower), b (bluer/yellower), C (Chroma), H (Hue) ve DE (total)
difference to target color for CMC(2:1) color space with 10 degree observer
under illuminant D65 daylight.
Column 24, 25, 26: RGB (red-green-blue) representation of the color. R,G and B values is the essential
values between 0 to 255 in digital technology.
Column 27, 28, 29: Three types of yellowness indices. ASTM1925, ASTM313, BASFGB
27
Column 30, 31, 32, 33, 34, 35, 36, 37: Eight types of whitness indices. E313, CIE[D65/2], CIE[D65/10],
Berger[D65/2], Berger[D65/10], Stensby, taube, Ganz
Column 38, 39: Two types of TINT indices
Column 40, 41: Two type of gray scale values. Wash fastness and staining.
Column 42,43,44,45,46: Five types of transperancy calculation. If the color is measured on black and wtite
ground, these columns shows a value indicating how much it is opaque or
transperant.
Sütun 47, 48: Two types of brightness indices. Zz and R457.
Now, let’s back to comparing region and continue to explain buttons.
Let’s explain second button ‘Archive’
Archive: When you click this button, all the colors previously recorded in any way are searched to find the
nearer color to selected target color. The final list in DE order. The descriptions of the columns are as
follows.
The first column shows the text informations about color found. The second column shows the DE difference to
target color which is shown at the top of the screen. The third column shows the recorded recipe of the color found.
28
And finally, last button is ‘print’
Print: As you may guess this button is to print the informations on the screen on a paper. When you click it, it asks
you to choice one two printing options.
When you select ‘brief option’, a printer report will be genarated with the same format of the screeen.
‘Detail’ option generates more detailed printer reports with all components of DE (DL, Da, Db, DC, DH)
End of explaination about the reigon 5.
REGION 6: RECIPE PANNEL
This region is used to calculte a recipe for a color selected.
Before describing the fields in this region, let’s explain how recipe calculation works. You must complete two
essential steps before using this region. These steps are “Substrate preperation” and “Shades preperation”.
Substrate preperation: Substrate means a white ground (for exampe a white fabric) which the dyestuff will be
aplied on it. This substrate will be used to aplly the calculted recipe and also for shades preperations either.
Substrate must be applied to a special operation which is called as “Blank dyeing”. Blank dyeing is to dye the
substrate without dyestuff. As you know, dyeing is done not only dyestuffs but also with some additives (auxilaries,
chemicals etc) under a certain process. Blank dyeing is to dye with all additives but without dye stuffs. This matured
metearial is called as substrate. This substrate should be measured and saved as substrate.
Measuring a substrate is very simple process. Just click on “Add substrate” button. A measuring window similar to
previously described in measuring a color” section in this manual is opened.
29
Clicking the ‘Measure’ button will take the measurement and details about the substrate will be shown on the
window similar to this.
30
Just put a name in the color name field and pres “Save”. You can measure and save substrates as many as you need.
Shade preperation: Each dye must be defined in a certain way in order to calculate a recipe. This is a must to teach
to program the “dye stuff behaviour and character”. Shade preperation step should be performed for each dye stuff
you use while producing the colors.
Shade preperations are done as folllows.
Each dye is applied to the substrate mentioned above in different amount (% concentration). The substrate to be
dyed must be the blank dyed substrate. It is critical to decide which % concentration (%C) will be used for each dye.
Best reccomendation is to select 10 or 13 different %C between minimum %C and maximum %C of each dye.
Althought there is no certain %C values it is good to select %V values withh less intervals in small %C range then
biger range. For example, %0.001 - %0.0025 - %0.005 - %0.01 - %0.025 - %0.05 - %0.1 - %0.25 - %0.5 - %0.75 %1 - %2 - %3 could be a good shade preperation for a light colored dye, like yellow. Please keep in mind that,
minimum %C and maximum %C depends on the dye’s character. For example, for a dark dye stuff, like black, the
following %C values may be a good way. %0.5, %1, %1.5, %2, %2.5, %3, %3.5, %4, %4.5 and %5.
After finising all shade preperations, the next step is to measure them. ‘Add dye’ button is used fort his purpose.
Açılımlar hazırlandıktan sonra, bunlar ölçülerek yazılıma aktarılmalıdır. When you click this button, you will see a
new window smilar to following one.
31
All the shades previously measured are being displayed in alphabetical order at the top field. Click on ‘Add new
shade’ button. You will have same mesuring window.
After taking the measurement, the window displays details about the color.
32
Put a name in ‘color name’ field for the shade and put the %C value and click ‘Save’ button.
After finising all the shades for dyestuff, the next step is to put them together under a single name. This is done in
the same window as below.
All the measured and saved shades are in the top field in alphabetical order. Repeat following steps for each difeeent
dye stuff.
1)
Select all shades of a single dye stuff by marking the left handed small rectangule with mouse. As soon as
you mark any shade it will be moved to the ‘selected shades’ field.
2)
When you finish marking, chose the substrate you used for these shades. This is done by selecting a substrate
from drop down list named ‘substrate in use’ which consist of previously recorded substrates.
3)
Next step is to associate a “Group” for this dye. Put a name manually in the ‘Dye group’ field or select any
dye group you have written previously. If you put a name in this filed manually, this name will be added to
dye group list and will seen in drop down list for next use.
It is recomended that to give the dye group names according to their usage. For example COTTON for cotton
dye stuffs, POLLIESTER, WOOL or REACTIVE; DISPERSE etc.
4)
And finally click on ‘save’ button. Now, the dye stuff is ready for recipe calculation when you need.
Now, let’s back to recipe calculation pannel
33
Before explaining how to calculate a recipe, it is necessary to explain on more topic “Palette”.
Palette: Palettes can be described to put the dye stuffs together for selecting a gorup of dye with one click. For
example you can group a few of cotton dye sutiable for lighter shades and sutiable for darker shades.
This is very usefull when you wish prevent to select wrong dye for a special process.
Defining a palette is very easy. Click on ‘Add palette’ button. You will a have new window listing dye
groups you defined before. The list is in alphabetical order.
Select a group and get all the dyestuffs realted to the group you selected.
34
As you see, all the dyes are listed at the right panel. All you need to do is to select the dyes you want to put in a
palette and put a name in the field ‘Palette name’ and then click ‘Save’.
At last, we are ready for recipe prediction.
Follow the steps below for recipe prediction.
1)
Select the color you want find its recipe. This is done by selecting the color from the region 4. Right click on
any target or trial color in tree view in region 4 and select “calculate recipe” from the menu. The color you
selected will be moved to recipe panel as target color.
2)
Select the substrate you want to apply the recipe from the drop down list named “target substrate”. If the
substrate is not recorded before you can measure and save a new substrate instantly by the button ‘Add
substrate’ at right of this drop down list.
There is no obligation that selected substrate shoul be the substrate which the dyes applied on it. Shade Art
compares two substrate and calcultes a correleation between them calculates the recipe for the new substrate.
3) Next step is to select the dyes you wish to us efor that color. Sıradaki işlem, bu rengi oluşturmak için
kullanılmasını istediğimiz boyarmaddelerin seçimine geldi. Bunun için “Boyalar” başlıklı alanda bulunan iki
adet düğmeyi kullanacağız.
Selecting dyes is possible in two ways. You can select the dyes either one by one or select a palette. Depending
on your decision click on one of two buttons ‘Groups’ or ‘Palettes”. If you click on ‘groups’ button, a menu will
be open listing the dye group you defined before. When you select any of those groups all the dyes in that group
will be listed in the selected dyes fields at the right hand.
If you click on ‘Palettes’ button then a menu will appear listing all palettes you defined before. Eğer alttaki
düğmeyi tıklarsanız, bu sefer daha önce tanımladığınız boya paletleri listesi çıkacaktır. When you select any of
those palettes all the dyes in that palette will be listed in the selected dyes fields at the right hand.
At the bottom of the recipe panel there are two fields which are initially filled. These are labeled as ‘Dye max’
and ‘DE max’.
“Dye max” You can select many dye stuffs to calculte recipe alternatives with different dyes. Dye max value
indicates that how many dyes will be in a recipe. For exmaple you may want to have a recipe with three dyes
but you can select more then three (say 5 dyes) dyes for the recipe calculation. In such a case dye max value is 3.
ShadeArt calcultes more than one recipe alternatives with three dyes in each recipe.
“DE max” This is a limit value which says to ShadeArt to omit recipies which it’s DE is bigger then this
value. This is usefull to get reasonably closer recipies instead of all calculted recipes.
Finally, you can click on ‘Calculate’button.
35
As soon as you click on this button, ShadeArt starts to calculate the recipies. When calculating is finished a new
window showing the results is appeared automatically.
Let’s explain what does this window say?
The yellow colored area at the upper left-hand corner lists the dyes selected in previous screen. The blue area lists
the recipies calculated or found in archive.
P.S: It’s time to mention another advantage of ShadeArt. Recipe prediction is performed in two phases. First
phase is to calculate the recipe according to dyes and substrate you calculate and in second phase the
recipes recorded previously (recipe archive) is searched if a near recipies are exist. All of results
from these phases are listed in a single window in DeltaE order.
Let’s have a look at the meaning of the columns of this blue area.
Column 1: Ingredients of the recipe. It is either calculated or archive recipe. If the recipe is a calculated recipe
then this column shows, customer name, target color and/or trial color, the dye stuffs with %C
amount, substrate name. If the recipe is an archive recipe then this column shows to whom it was
used before (Customer, Standard and/or trial name), dye stuffs with %C amount, substrate name.
Column 2: The variation between the calculated or found recipe and target color. This variation is deltaE value
according to CIEL*a*b* color spcae under illuminat D65 with 10 degree observer. The more it is
closer to zero the more closer color to target.
Column 3: If the variation is not equal to zero, then this columns says the reason of that difference. It is also
known as assessments.
Column 4: The cost of the recipe. (It is not active when this document published)
Column 5: The type of the recipe. It is calculated or from archive.
36
Column 6: Visual appearance of the target color selected in previous target.
Column 7: Visual appearance of the calculated or found recipe
In this windows there is another state-of-art advantage. We call it “Smart recipe”
When you click on a row in blue area, you get a menu with two options. These are “Print” and “Modify”. If the
selected row refers a calculated color, the option “Modify” is in disabled mode. If the selected row refers a color
from archive then this option becomes enable.
A magnificant State-of-Art feature is hidden under this “Modify” option. Let’s have a look at it detailly.
When you select this option a new window which will makes your life more comfortable will appear. You can
modify the recipe in this screen and see results of the final color. Recipe modification means you can increace or
decrease the quantity of a dye or remove a dye or add/replace a dye etc.
37
In order to explain the screen beter, we will label the same areas on this window.
Area 1: The original form of the recipe in archive. The informations in this area are dytestuffs’ name, amount of
dyestuffs, substrate applied, differences (DeltaE) to the targeted color under 3 illuminants and assessments.
Area 2: A copy of the recipe in area 1. The difference of this area then Area 1 is that the recipe can be modified.
When you make any changes on this recipe, the other areas (3, 4 and 5) is cahnged instantly.
Area 3: Pass/Fail limits and visual presentations of the target color and recipe color in area 2.
Area 4: According to 3 illuminants, graphical presentation of the difference between the recipe in area 2 and target.
Bölge 5: According to 3 illuminants, numerical presentation of the difference between the recipe in area 2 and
target. This area also displays assessments ans Pass/Fail judment.
Now, Let’s explain how to use this window.
It is very easy. Modify the recipe in area 2 and review the effect in area 4 and 5. Area 4 and area 5 shows the same
thing in two different ways. Decide which ever is good on you.
Modifying a recipe means changing (reducing, increasing) the amout of a dyestuff, replacing a dyestuff with another
one, removing a dyestuff, add a new dyestuff, changing the substrate, etc. You can do all in region 2 and the effects
of your modification will be displayed instatnly in area 4 and 5.
38
The aim is to make the difference to zero on area 5 or move the points to origin of the graphic. For example, in the
sample windows above, you see that the recipe result color is lighter, redish and yellowish (See area 5). You can
decrease the red dye and so you get closer color to target. Difference zero means perfect match. You can also see the
metamerism factor at the botoom of the area 4.
In area 2, there is a small icon (three point shaped) at the right side of each dyes. When you right clicc it you get
menu to change the amount of that dye stuff.
You are at the end of ShadeArt user manual. Thanks for
for your time. As you may nıotice that
ShadeArt has very skilled on color matching
matching issues and so you will have more time for other job
you need to do tanks to ShadeArt.
For all questions and comments we welcome you. Please do not hessitate to contact us. Our email
is support@artoksi
support@artoksi com
Wish you all best…
best…
Enginnering Art Center
39