1
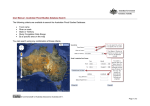
User Guide Prepared for: Tasmanian Climate Change Office Date: March 2014 Rev00 transport | community | industrial | carbon & energy Celebrating 50 years of Table of Contents Overview.................................................................................... i 1. 2. 3. 4. 5. Overview of functionality ............................................................................... 1 1.1 Data sources ...................................................................................... 1 1.2 Climate change scenario ....................................................................... 2 Input selection ............................................................................................ 2 2.1 Input – ‘Initial Parameter’ ..................................................................... 2 2.2 Input – ‘Specific Variable / Feature’ ......................................................... 3 2.3 Input – ‘Projection Period’ ................................................................... 4 2.4 Input – ‘Difference Value’ .................................................................... 5 Google maps functionality .............................................................................. 7 3.1 Zoom level ........................................................................................ 8 3.2 Panning the map ................................................................................. 8 3.3 Map / Satellite ................................................................................... 9 3.4 Street view ....................................................................................... 9 3.5 Specific address selection ...................................................................... 9 Legend manipulation .................................................................................. 10 Linked information ..................................................................................... 12 Table of Figures 1-1. Functional Areas of ClimateAsyst ....................................................................... 1 2-1. Initial Climate Change Parameter Selection .......................................................... 2 2-2. Initial Selection of Climate Change Variable or Infrastructure Feature ......................... 3 2-3. Projection Period Selection .............................................................................. 4 2-4. Data Value Selection ...................................................................................... 5 3-1. Google Map Functionality Section ...................................................................... 7 3-2. Google Maps Functionality ............................................................................... 7 3-3. Adjust Map Zoom Level ................................................................................... 8 3-4. Street View Image Selection ............................................................................. 9 3-5. Specific Location Search ................................................................................. 9 4-1. Legend Manipulation Section .......................................................................... 10 4-2. Legend Manipulation - Colour Swatches ............................................................. 12 5-1. Example of Additional Information Available Relating to Rainfall Impacts ................... 13 5-2. Additional Information Relating to Coastal Vulnerability (ACE CRC – Canute Calculator) .. 13 pitt&sherry ref: FINAL_climateasyst user manual _March2014.docx/SR/as © 2014 pitt&sherry This document is and shall remain the property of pitt&sherry. The document may only be used for the purposes for which it was commissioned and in accordance with the Terms of Engagement for the commission. Unauthorised use of this document in any form is prohibited. Prepared by: ____________________________ Sven Rand Date: 1 March 2014 Reviewed by: ____________________________ Stuart Attenborrow pp Date: 1 March 2014 Authorised by: ____________________________ Stephen Avery Date: 1 March 2014 This material was produced with funding support from the Australian Government’s ‘Natural Disaster Resilience Program’ initiative. The views expressed are the responsibility of the author and are not necessarily those of the Australian Government. This material was produced with funding support from the Tasmanian Government’s Climate Change Office. The views expressed are the responsibility of the author and are not necessarily those of the Tasmanian Government. pitt&sherry ref: FINAL_climateasyst user manual _March2014.docx/SR/as Overview ClimateAsyst is a free, web-based tool for planners, developers, engineers, farmers and others to assist in understanding climate changes projected for Tasmania. This user guide provides an overview of ClimateAsyst’s functionality, input selection, google maps functionality, legend manipulation and linked information. ClimateAsyst can be accessed at: http://www.pittsh.com.au/climateasyst/ Background to ClimateAsyst’s development ClimateAsyst was initially developed as a subscriber based tool through contributions from pitt&sherry in partnership with the Antarctic Climate and Ecosystems Cooperative Research Center (ACE CRC) and support from the Tasmanian Government, local government and other stakeholders. ClimateAsyst has subsequently been expanded to its current web based format through funding from the Australian Government’s Natural Disaster Resilience Program and the Tasmanian Government’s Climate Change Office. Climate change variables included ClimateAsyst enables analysis of a broad range of climate change variables that have been provided through the Climate Futures for Tasmania project1 and through coastal inundation mapping developed by the Tasmanian Government. Climate Futures for Tasmania (CFT) project information The CFT project variables included are: Projected temperature related variables including: Annual average temperatures (average daily, maximum or minimum for example) Frost or warm days (number of days expected with minimum below 2oC or maximum to exceed 30oC respectively) Growing degree days (a measure of agricultural impact of daily temperatures). Projected rainfall change including: Effects on long term average and seasonal rainfall Effect on short duration rainfall events from 24to 48 hours. Humidity and evaporation variables. 1 For more information on the Climate Futures for Tasmania project, please refer to http://www.dpac.tas.gov.au/divisions/climatechange/adapting/climate_futures pitt&sherry ref: FINAL_climateasyst user manual _March2014.docx/SR/as i The CFT project variables are presented in ClimateAsyst as 10 km grid based model outputs. These projections can be manipulated through choice of projection period, generally with a base period (usually representing the period 1961 to 19902) and three modelled future projection periods. Future projection periods are generally an averaged thirty year interval representing the periods 2010 to 2039, 2040 to 2069 and 2070 to 2099. CFT information can be presented either as modelled projected values or the calculated difference between selected projection periods, as a number or a percentage change. Users also have the ability to manipulate the colour legends and data range of CFT information being considered. Coastal vulnerability (Inundation) mapping The coastal vulnerability (inundation) mapping included incorporates projected sea level rise and is presented as inundation extents for an estimated 1% annual exceedance probability event. Future periods incorporate the sea level rise allowances as set by the Tasmanian Government from a base year of 2010 and for projections at 2050, 2075 and 21003. Database of knowledge and documents A database of knowledge and documentation is linked to the selected map layer with information on how various climate variables affect infrastructure or other features, such as coastal assets and buildings for example. 2 Please refer to the Climate Futures for Tasmania project technical reports for further information on the projections and to confirm the base period time frame. The technical reports are available at http://www.dpac.tas.gov.au/divisions/climatechange/adapting/climate_futures 3 Please refer to the Coastal Inundation Mapping for Tasmania – Stage 2 Technical Report for further information. The technical report is available at http://www.dpac.tas.gov.au/divisions/climatechange/what_the_government_is_doing/new_tools_to_im prove_planning_for_sea_level_rise_and_coastal_hazards pitt&sherry ref: FINAL_climateasyst user manual _March2014.docx/SR/as ii 1. Overview of functionality Figure (1-1) presents an overview of the front screen when initially accessed and indicates basic functionality of various components of the tool. 1-1. Functional Areas of ClimateAsyst As depicted in the above figure, ClimateAsyst provides three main functional areas: Input Selection Map functionality Legend manipulation Section 2 of the user guide provides more detail on aspects of each of the three functional areas. 1.1 Data sources All of the gridded data sets presented have been prepared as components of the CFT project, while the coastal vulnerability (inundation) mapping was provided by the Tasmanian Government. Users are strongly encouraged to review the CFT technical reports, including relevant limitations on the use of the information developed through those projects and presented in ClimateAsyst. pitt&sherry ref: FINAL_climateasyst user manual _March2014.docx/SR/as 1 1.2 Climate change scenario The Climate Futures for Tasmania project investigated changes under the A2 high Greenhouse Gas emissions scenario or alternatively a lower emission scenario B1. Unless stated as a selection option in the climate change variable dataset the information relates to the A2 high greenhouse gas emissions scenario. The coastal vulnerability (inundation) modelling information presented is derived from the mapping developed by the Tasmanian Government4 which investigated inundation levels for various likelihood events (annual exceedance probabilities) under current (2010) conditions. Projected sea level rise contributions incorporate the Tasmanian sea level rise planning allowances5 for the State’s coastal areas of 0.2 metres by 2050 and 0.8 metres by 2100. In addition, a projection year of 2075 is provided utilising a 0.4 metre allowance. 2. Input selection 2.1 Input – ‘Initial Parameter’ 2-1. Initial Climate Change Parameter Selection 4 Please refer to the Coastal Inundation Mapping for Tasmania – Stage 2 Technical Report for further information. The technical report is available at http://www.dpac.tas.gov.au/divisions/climatechange/what_the_government_is_doing /new_tools_to_improve_planning_for_sea_level_rise_and_coastal_hazards 5 Further information is available at http://www.dpac.tas.gov.au/divisions/climatechange/what_the_government_is_doing/new_tool s_to_improve_planning_for_sea_level_rise_and_coastal_hazards pitt&sherry ref: FINAL_climateasyst user manual _March2014.docx/SR/as 2 The first selection choice requires a selection of either Climate Change variable or Infrastructure feature (by mouse clicking on the text as indicated in figure 2-1 above). The list below the selection is then populated according to the initial selection and represents either a general list of climate change features or alternatively a list of infrastructure or sectors for which for which specific climate change impacts are identified. It is anticipated that most users would select the climate change variable option as this initially presents the more comprehensive list of the available climate change outputs. 2.2 Input – ‘Specific Variable / Feature’ Following the initial parameter selection users are prompted to select from the list of available climate or infrastructure features (refer to left or right box respectively in figure 2-1 above). As indicated in the below figure (2-2 ) selections then populate the respective lists with either climate change variable type, specific feature and then infrastructure or infrastructure feature and indicative climate change variable which may affect it. 2-2. Initial Selection of Climate Change Variable or Infrastructure Feature pitt&sherry ref: FINAL_climateasyst user manual _March2014.docx/SR/as 3 For each of the listed final selections additional information may be accessible (using the blue circled i button). Climate change outputs currently incorporated in the tool include 33 climate change variables. 2.3 Input – ‘Projection Period’ For the Climate Futures for Tasmania outputs users can select from one of four projection periods as indicated in Figure 2-3. 2-3. Projection Period Selection Climate projections have been modelled to provide an average value for a number of specified time intervals. The intervals typically include a base reference modelled on historically observed data which for most variables investigated represents the period 1961 to 19906. The base period was produced with modelled historical data and provides a basis for comparison to future projected periods. The projected periods are: A Base Period, typically 1961 to 1990 in most modelled outputs: 2025 (2010 to 2039): 2055 (2040 to 2069): 2085 (2070 to 2099): Approximating an end of century projection period. 6 Users should confirm the base period in available supporting information or the original technical reports. pitt&sherry ref: FINAL_climateasyst user manual _March2014.docx/SR/as 4 Coastal vulnerability (inundation) Coastal vulnerability (inundation) mapping is presented as a single combined data overlay indicating the modelled areas inundated during an estimated 1% annual exceedance probability (AEP) event7 for each of four specific years: 2010 2050 2075 2100 The coastal vulnerability (inundation) mapping dataset represents a high resolution overlay8 on the chosen background image or map. Due to the high resolution nature of the mapping layer the information does not appear when viewing the map at large scales and a slight delay 9 may be experienced when viewing the information. 2.4 Input – ‘Difference Value’ The CFT project outputs can be selected from one of three data value options indicated in Figure 2-4. 2-4. Data Value Selection The map screen colour scale and legend will be automatically generated from this selection. Absolute Value Absolute Value represents the raw value as modelled10 for the projection period. The units relate to the specific variable selected. Difference Value and Difference % Selection of Difference Value or Difference % enables a comparison between two nominated projection periods (the Delta Period box becomes selectable when one of these options is selected). 7 For a situation with a constant unchanging sea level this is the inundation ‘storm surge tide’ level which may be expected to be exceeded on average once every hundred years. 8 High resolution data requires significant data processing for presentation 9 when compared to other layers 10 For further information on the detail of the modelled variables refer to climate futures for Tasmania technical manuals http://www.dpac.tas.gov.au/divisions/climatechange/adapting/climate_futures pitt&sherry ref: FINAL_climateasyst user manual _March2014.docx/SR/as 5 The map overlay is coloured according to the nominated selection where the Difference Value represents the difference period between the nominated Projection Period (the top box) and the Delta Period (the lower box). When the Difference % is selected the map overlay is presented as a percentage difference of the projection period when compared to the delta period11 (expressed as either a positive or negative change). Note: if the projection period and the delta period are the same when presenting differences then no data will be displayed. Coastal vulnerability (inundation) The above selections are not enabled for the coastal vulnerability (inundation) dataset which is presented as a series of overlapping polygon areas representing changing inundation levels. 11 Users should consider the relevance of difference calculations which may not be appropriate for all data sets. For example a percentage change in daily temperature expressed as degrees Celcius (as per the data presented) would be very different if the temperature variable was expressed in degrees Kelvin or Fahrenheit. pitt&sherry ref: FINAL_climateasyst user manual _March2014.docx/SR/as 6 3. Google maps functionality 3-1. Google Map Functionality Section The map overlays are presented on a current version of the Google Maps web interface. 3-2. Google Maps Functionality pitt&sherry ref: FINAL_climateasyst user manual _March2014.docx/SR/as 7 The following section describes basic functionality of the map view12 for the three elements indicated above:- 3.1 Zoom Level Map Underlay Specific Address search Zoom level The maps interface provides a number of methods for zooming in and out on specific features of interest. 3-3. Adjust Map Zoom Level 1. Left mouse click on the – button at the lower end of the zoom scale to zoom the map out to a larger scale (see a larger area) or alternatively 2. Select the + button to zoom in for more detail. 3. Changing the zoom level is also possible through selection by left mouse click and holding the zoom bar and dragging the bar up to zoom in for more detail or down for a greater area. 4. Double clicking with left mouse button zooms in and 5. Double clicking with right mouse button zooms out Alternatively, rotating the mouse central wheel will also alter the zoom level. 3.2 Panning the map Simply clicking and holding the left mouse button within the map image enables the map window to be dragged without adjusting the map scale. 12 Fort advanced help in Google Maps functionality users are referred to http://support.google.com/maps/bin/answer.py?hl=en&answer=144352 pitt&sherry ref: FINAL_climateasyst user manual _March2014.docx/SR/as 8 3.3 Map / Satellite Select either Map or Satellite to choose the underlying imagery in Google Maps. 3.4 Street view 3-4. Street View Image Selection Street view functionality, while enabled in ClimateAsyst to present Google street view functionality, does not incorporate climate change projection information. Select the close box in the top right hand corner of a street view image to return to the map overlay view. 3.5 Specific address selection Google maps provides functionality to rapidly zoom to specific locations or property addresses (figure 3-5). 3-5. Specific Location Search pitt&sherry ref: FINAL_climateasyst user manual _March2014.docx/SR/as 9 Simply type in the property or location of interest and select the option returned from the Google search. 4. Legend manipulation ClimateAsyst provides a variety of methods to manipulate the presentation of data on the map. Depending on initial selections, the legend presentation is automatically set to the limits of the selected climate feature data. Changing the values used for the legend scale or changing the colours used will affect how the colours are shown in the cell data. By changing the middle value you can offset at what point the colour transitions through the middle colour. The area for selecting these options is indicated in figure 4-1 below. 4-1. Legend Manipulation Section pitt&sherry ref: FINAL_climateasyst user manual _March2014.docx/SR/as 10 'Show Colours' When a climate feature is selected, the map will be highlighted with a number of coloured cells. Turn this option off if you want to see the map without colours (or with labels instead). Selection labelled A in figure 4-1 above. 'Show Labels' When a climate feature is selected, the map will be highlighted with a number of coloured cells. The value for each cell can be shown in the map by selecting this option. Selection labelled B in figure 4-1 above. 'Use Middle Colour' When selected, a third colour will be available to make it easier to highlight transitions in values of the cells. Selection labelled C in figure 4-1 above. 'Value Range' These are automatically set to the limits of the selected climate feature data but can be manually varied. Changing these values will affect how the colours are shown in the cell data. By changing the middle value you can offset at what point the colour transitions through the middle colour. Selection labelled D in figure 4-1 above. Choosing a narrower range than the entire dataset will produce dark non-coloured cells where these correspond to values outside the selected range. 'Colour Swatches' and Gradient The colour of the legend can be varied by selection in the area labelled E in figure 4-1 above. The horizontal bar shows the full range of colours selected. If the middle colour is in use, clicking on this bar will allow you to alter the transition through this colour. Click on these boxes to change the colour gradient as indicated in figure 4-2 below. pitt&sherry ref: FINAL_climateasyst user manual _March2014.docx/SR/as 11 4-2. Legend Manipulation - Colour Swatches Altering the legend colour enables variation of colours to better highlight transitions in the data, to provide more contrast to transitions or alternatively to ‘reverse’ the colour gradient. Coastal vulnerability (inundation) The above selections are not enabled for the coastal vulnerability (inundation) dataset which is presented with preset legend s for the series of overlapping polygon areas representing changing inundation levels. 5. Linked information When the information button is selected (refer to section 2.2) further information available is presented in a new web window. Two examples are provided of additional information available from the linked datasets (figures 5-1 and 5- 2 following): Short duration rainfall events and also Sea level rise inundation levels): pitt&sherry ref: FINAL_climateasyst user manual _March2014.docx/SR/as 12 5-1. Example of Additional Information Available Relating to Rainfall Impacts 5-2. Additional Information Relating to Coastal Vulnerability (ACE CRC – Canute Calculator) pitt&sherry ref: FINAL_climateasyst user manual _March2014.docx/SR/as 13 transport | community | industrial | carbon & energy Brisbane 2nd Floor 276 Edward Street Brisbane QLD 4000 T: (07) 3221 0080 F: (07) 3221 0083 Canberra Tower A, Level 5 7 London Circuit Canberra ACT 2601 T: (02) 6295 2100 F: (02) 6169 4100 Devonport 1st Floor 35 Oldaker Street PO Box 836 Devonport TAS 7310 T: (03) 6424 1641 F: (03) 6424 9215 Hobart GF, 199 Macquarie Street GPO Box 94 Hobart TAS 7001 T: (03) 6210 1400 F: (03) 6223 1299 Launceston 4th Floor 113 – 115 Cimitiere Street PO Box 1409 Launceston TAS 7250 T: (03) 6323 1900 F: (03) 6334 4651 Melbourne Level 1, HWT Tower 40 City Road, Southbank VIC 3006 PO Box 259 South Melbourne VIC 3205 T: (03) 9682 5290 F: (03) 9682 5292 Sydney 1st Floor 56 Clarence Street Sydney NSW 2000 T: (02) 8216 4700 F: (02) 8216 4747 Celebrating 50 years of Incorporating E: [email protected] W: www.pittsh.com.au incorporated as Pitt and Sherry (Operations) Pty Ltd ABN 67 140 184 309