1
SMART Dispersant Module
v. 1/2000
2. MONITORING PROCEDURES
2 . 1 Tier I: Visual Observations
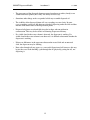
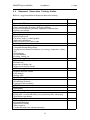
Tier I recommends visual observation by a trained observer. A trained observer, using
visual aids, can provide a general, qualitative assessment of dispersant effectiveness. Use
of guides such as the NOAA Dispersant Application Observer Job Aid is recommended for
consistency. Observations should be photographed and videotaped to help communicate
them to the Unified Command, and to better document the data for future use.
When available, visual monitoring may be enhanced by advanced sensing instruments such
as infrared thermal imaging. These and other devices can provide a higher degree of
sensitivity in determining dispersant effectiveness.
Visual monitoring is relatively simple and readily done. However, visual observations do
not always provide confirmation that the oil is dispersed. Tier II provides a near real-time
method using fluorometry and water sampling.
2 . 2 Tier II: Fluorometry for Efficacy
Sometimes dispersant operations effectiveness is difficult to determine by visual
observation alone. To confirm the visual observations, a monitoring team may be deployed
to the dispersant application area to confirm the visual observations by using real-time
monitoring and water sampling. This is called Tier II monitoring.
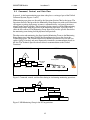
Tier II monitoring uses a continuous flow fluorometer (Turner Designs™ or equivalent) at
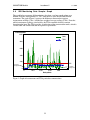
an approximately 1-meter sampling depth. The fluorometer measures the concentrations of
hydrocarbons in the water column. It measures all hydrocarbons and is therefore not oilspecific. It can be used, however, to show the relative increase of hydrocarbons over
background concentrations. This can be a good indication of oil dispersion. Tier II requires
water samples to be taken for later analysis, which will help confirm that the increases
observed were due to dispersed oil.
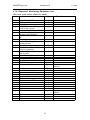
A water-column monitoring team composed of at least one trained technician and a support
person is deployed on a suitable platform. Under ideal circumstances, the team collects data
in three primary target locations: (1) background water (no oil); (2) oiled surface slicks
prior to dispersant application, and (3) post-application, after the oil has been treated with
dispersants. Data are collected in real-time by both a built-in data-logging device and by the
technician who monitors the readings from the instrument's digital readout and records
them in a sampling log. The sampling log not only provides a backup to the data logger,
but allows the results to be communicated, near real-time, to the appropriate technical
specialist in the Unified Command. Data logged by the instrument are used for
documentation and scientific evaluation.
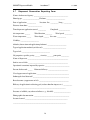
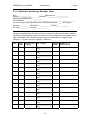
The field team should record the time, instrument readings, and any relevant observations
at selected time intervals. Global Positioning System (GPS) instruments are used to
ascertain the exact position of each reading.
Water samples are collected in bottles to validate and quantify the fluorometry monitoring.
Samples are collected at the outlet port of the flow-through water hose, past the fluorometer
cell. Exact time and position are noted for each sample, for correlation with fluorometer
readings. The number of water samples taken reflects the monitoring effort. Generally, five
samples collected for each fluorometer data run is considered adequate in addition to
background samples. The water samples are stored in a cooler and sent to a laboratory for
future analysis.
4