1
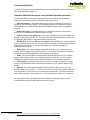
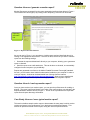
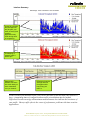
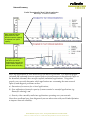
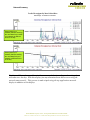
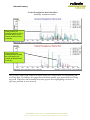
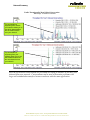
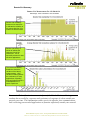
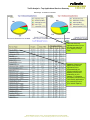
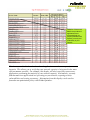
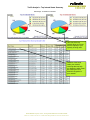
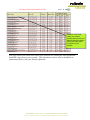
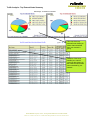
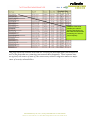
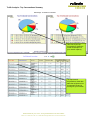
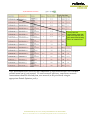
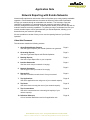
Application Note
Network Reporting with Exinda Networks
Network traffic optimization reduces the reliance of business upon costly capacity bandwidth
upgrades. Exinda Networks delivers the means to effectively deliver traffic optimization
through your network through an accessible user interface. The first step to using this
interface for optimization is to ascertain how your network is operating to identify any
efficiency changes that must be made. Exinda Optimizer allows you to take this step with its
extensive network monitoring capabilities. To present an easy to understand overview your
network, detailed reports can be generated with your Exinda Optimizer, allowing you to
determine how your network is operating.
We now provide an overview of how you can use the reporting feature of your Exinda
Optimizer.
About this Document
This document contains the following sections:
1. About Exinda Monitor Reports
See what type of Reports your Exinda Optimizer can generate.
Page 2
2. Generating Reports
See how to generate Reports with Exinda Optimizer.
Page 3
3. Reading Reports
See how to open Report files on your computer.
Page 3
4. Interface Summaries
See how much data your network is carrying.
Page 4
5. Network Summaries
See the type of data your network is carrying.
Page 5
6. Remote SLA
See how accessible a remote host is from your network.
Page 9
Page 10
7. Top Applications
See which applications are using most of your network capacity.
8. Top Hosts
See which hosts are using the most of your network capacity.
Page 12
9. Top Conversations
See which conversations are consuming the majority of your
network capacity.
Page 16
10. Definition Reference
A list of technical Definitions used in this application note
Page 18
Exinda Networks Pty Ltd, Level 1, 35 King street Melbourne VIC 3000 Australia
Phone +61 3 9614 2199 • fax +61 3 9629 2800 • [email protected] • www.exinda.com.au
Document Definitions
A complete reference of technical terminology used in this application note is provided at the
back of the document on page 18.
Question: What kind of reports can my Exinda Optimizer generate?
Your Exinda Optimizer can create Adobe portable document format (pdf) compatible
documents containing the following information about your network:
Interface Summary: This section allows you to see how much data your network is
carrying at different times of the day. This information allows you to determine the peak
traffic periods on your network and verify whether additional network resource capacity is
required.
Network Summary: This section allows you to pinpoint the specific sources of the
majority of your network traffic at different times in the day.
Optimizer Policy Throughput: This report section displays how your Exinda Optimizer
policies are performing over the day. For more information about Optimization policies, refer
to “Application Note: Policy Configuration with Exinda Optimizer”1
Remote SLA: This section displays the availability and reachability of a remote (external)
host over different times of the day. Use this report to verify that your ISP is providing with an
appropriate level of service, or simply to ensure that your network is meeting your
connectivity requirements.
Applications: This section displays the specific applications that are consuming the
majority of your network resources over the day. You can use this information to determine
whether any unnecessary applications are congesting your network.
Hosts: This section displays the specific hosts (internal and external to your network)
that are consuming the most of your network resources over the day. You can use this
information to determine which of your network hosts are the most resource intensive.
Conversations: This section identifies the specific conversations (between two hosts
using a single application) that are consuming the majority of your network resources over
the day.
Subnets: This section provides details about the network traffic into and out of the
defined subnets of your network. You can use this feature to identify the network traffic from
each department of your business or from groups of external hosts. For further information
about defining subnets, refer to section 2.17 of “Exinda Optimizer: Appliance User Manual”.
As mentioned previously, this application note contains an annotated sample report to
demonstrate the power of Exinda Optimizer’s monitor reports.
1
Available at: http://www.exinda.com/pdfs/Exinda_AppNote_Policy_Configuration.pdf.
Question: How can I generate a monitor report?
Monitor Reports are generated from the report generation interface shown below in Figure 1.
This interface can be brought up by clicking on the “Reporting” sub menu link as shown:
Reporting
sub menu
link.
Figure 1. Report Generation Interface.
As you can see in Figure 1, you can select to include report sections (described above) by
clicking on the appropriate check boxes. Once this is done, select how you want to view the
report from the following settings:
1. Generate the report and download it directly to your computer, allowing you to generate a
report on demand.
2. Send the report as an email attachment. This can be done on demand, or automatically
configured to send a report to you periodically.
Reports are generated to conform to the Adobe Portable Document Format (pdf) standard.
As such, you will need to have Adobe Acrobat reader installed on your computer in order to
read your reports. Acrobat can be downloaded free of charge from the internet:
http://www.adobe.com/products/acrobat/readstep2.html. Once you have installed this
software, you can open Monitor reports as through your Windows Filesystem explorer.
Question: How do I read my monitor report?
Once you have received your monitor report, you can open the pdf document for reading or
printing. The report is structured simply in the order of the report sections you selected in the
Report Generation Interface shown in Figure 1. A front cover is provided for the report with
report title and report data range information.
Case Study: How can I use a typical monitor report?
This section details a sample monitor report to demonstrate the many ways in which monitor
reports can improve in the performance of you business communications network. This
section will provide an actual monitor report, noting the various important sections.
Exinda Networks Pty Ltd, Level 1, 35 King street Melbourne VIC 3000 Australia
Phone +61 3 9614 2199 • fax +61 3 9629 2800 • [email protected] • www.exinda.com.au
Interface Summary
Data Range: 12am 14/4/2003 to 12am 15/4/2003
As the 95 percentile
and average lines
are far apart, your
traffic is bursty (time
sensitive
applications may
suffer during times
of congestion).
The Majority of
network traffic is
before 6pm
Data transfer
statistics can show
how much data you
have transmitted
over you network
Differences between
average and max
throughput show
how bursty your
traffic is.
In this section of the monitor report, you can see the times of the day that your network is
busy – pinpointing times of congestion when traffic prioritization may be needed.
Differences between average and maximum measurements also indicate the burstiness of
your traffic. Bursty traffic often is the cause of performance problems with time sensitive
applications.
Exinda Networks Pty Ltd, Level 1, 35 King street Melbourne VIC 3000 Australia
Phone +61 3 9614 2199 • fax +61 3 9629 2800 • [email protected] • www.exinda.com.au
Network Summary
Traffic Throughput By Most Utilised Application
Data Range: 14/4/2003 to 15/4/2003
Many network links are
asymmetrical so that
downlink network capacity
is separate from uplink
capacity.
Top application transfers
can show you which
applications consume the
most network capacity at
different times of the day
Here, top applications in your network over the day are presented. Two different graphs
(inbound and outbound) as most network links are asynchronous so that network traffic on
the downlink (inbound) does not affect uplink (outbound) applications. Using these
graphs, you can easily determine which applications are consuming the most network
capacity and diagnose problems such as:
a) Starvation of resources for critical applications,
b) Over utilization of network capacity by non-essential or wasteful applications (eg.
Kazaa file sharing), and
c) Security risks caused by malicious applications operating over your network.
Once these problems have been diagnosed you can take action with your Exinda Optimizer
to improve network reliability.
Exinda Networks Pty Ltd, Level 1, 35 King street Melbourne VIC 3000 Australia
Phone +61 3 9614 2199 • fax +61 3 9629 2800 • [email protected] • www.exinda.com.au
Network Summary
Traffic Throughput By Most Utilised Host
Data Range: 14/4/2003 to 15/4/2003
Hosts (inside your
network) that are receiving
the most data from outside
your network at different
times of the day.
Hosts (inside your
network) that are sending
the most data from your
network at different times
of the day.
Top Internal Hosts shows each host inside your network that is sending and receiving the
most data over the day. With this display you may determine hosts that are accessing the
network unnecessarily. This process is made simple using the top applications network
display in addition to this display.
Exinda Networks Pty Ltd, Level 1, 35 King street Melbourne VIC 3000 Australia
Phone +61 3 9614 2199 • fax +61 3 9629 2800 • [email protected] • www.exinda.com.au
Network Summary
Traffic Throughput By Most Utilised Host
Data Range: 14/4/2003 to 15/4/2003
Hosts (outside your
network) that are receiving
the most data from your
network at different times
of the day.
Hosts (outside your
network) that are sending
the most data to your
network at different times
of the day.
The previous report page showed the hosts inside your network that are transmitting and
receiving data. In contrast, this page shows the hosts outside your network that are being
accessed. Malicious and unwanted hosts may appear here highlighting a security or
efficiency problem in your network.
Exinda Networks Pty Ltd, Level 1, 35 King street Melbourne VIC 3000 Australia
Phone +61 3 9614 2199 • fax +61 3 9629 2800 • [email protected] • www.exinda.com.au
Network Summary
Traffic Throughput By Most Utilised Conversation
Data Range: 14/4/2003 to 15/4/2003
Top conversations
originating from outside
your network allows you to
see which data transfers
are the most intensive
over your network.
Top conversations
originating from your
network allows you to see
which data transfers are
the most intensive over
your network.
Here the top network conversations are presented according to whether or not they were
initiated from your network. Conversations can be used to determine problems with
large and extended data transfers between two hosts with the same application.
Exinda Networks Pty Ltd, Level 1, 35 King street Melbourne VIC 3000 Australia
Phone +61 3 9614 2199 • fax +61 3 9629 2800 • [email protected] • www.exinda.com.au
Remote SLA Summary
Remote SLA Measurements For 132.220.64.136
Data Range: 12am 14/4/2003 to 12am 15/4/2003
Remote site availability
losses can be seen here
to indicate the reliability of
this remote site from your
network at different times.
Remote site latency is
shown to indicate the
response time of the
remote site. This is
especially relevant for time
sensitive applications.
The remote site latency
distribution shows the
variation of the latency
measurements. High
variation in latency affects
the consistency of many
applications, degrading
their performance which is
unacceptable from a
users’ experience.
Remote site SLA verification is an essential part of the Exinda Monitor, allowing you to
evaluate the accessibility, response and consistency of response of a host outside your
network over time. This information enables you to see whether your communications
link is allowing your network applications to function sufficiently outside your network.
Exinda Networks Pty Ltd, Level 1, 35 King street Melbourne VIC 3000 Australia
Phone +61 3 9614 2199 • fax +61 3 9629 2800 • [email protected] • www.exinda.com.au
Traffic Analysis - Top Applications/Services Summary
Data Range: 14/4/2003 to 14/4/2003
This view of the top
applications allows you to
see how the majority of
your capacity is being
used.
Statistics of how much
data the top inbound
applications have
consumed help you
pinpoint problems with
capacity, security and
productivity in your
network. For example,
this display will show if any
unnecessary applications
are consuming most of
your network capacity.
Exinda Networks Pty Ltd, Level 1, 35 King street Melbourne VIC 3000 Australia
Phone +61 3 9614 2199 • fax +61 3 9629 2800 • [email protected] • www.exinda.com.au
Statistics of how much
data the top outbound
applications have
consumed help you
pinpoint problems with
capacity, security and
productivity in your
network.
This shows you which inbound and outbound applications are the most capacity
intensive. This allows you to verify that your network capacity is being used in the most
efficient manner possible. For example, this display will alert you of any unnecessary
applications consuming the majority of your network capacity. Alternatively, you may
find that malicious applications are operating on your network, exposing security
vulnerabilities and costing you money. Information from this display can be used to
formulate an optimization policy with Exinda Optimizer.
Exinda Networks Pty Ltd, Level 1, 35 King street Melbourne VIC 3000 Australia
Phone +61 3 9614 2199 • fax +61 3 9629 2800 • [email protected] • www.exinda.com.au
Traffic Analysis - Top Internal Hosts Summary
Data Range: 14/4/2003 to 14/4/2003
This view of the top
internal allows you to see
how the majority of your
capacity is being used.
Statistics of the hosts
inside your network
receiving data can help
you determine which hosts
are causing the most
downlink congestion in
your network.
Exinda Networks Pty Ltd, Level 1, 35 King street Melbourne VIC 3000 Australia
Phone +61 3 9614 2199 • fax +61 3 9629 2800 • [email protected] • www.exinda.com.au
Statistics of the hosts
inside your network
sending data can help you
determine which hosts are
causing the most uplink
congestion in your
network.
This page shows you which hosts inside your network are causing the most uplink and
downlink congestion in your network. This information can be used to formulate an
optimization policy with your Exinda Optimizer.
Exinda Networks Pty Ltd, Level 1, 35 King street Melbourne VIC 3000 Australia
Phone +61 3 9614 2199 • fax +61 3 9629 2800 • [email protected] • www.exinda.com.au
Traffic Analysis - Top External Hosts Summary
Data Range: 14/4/2003 to 14/4/2003
This view of the top
external hosts shows you
where data transmitted
from your network is
going.
Statistics of the hosts
outside your network
receiving data shows you
the external hosts that are
most contacted by your
network.
Exinda Networks Pty Ltd, Level 1, 35 King street Melbourne VIC 3000 Australia
Phone +61 3 9614 2199 • fax +61 3 9629 2800 • [email protected] • www.exinda.com.au
Statistics of the hosts
outside your network
sending data shows you
the external hosts that are
contacting your network
most frequently.
This page shows the external hosts that are receiving the most data from your network as
well as the hosts that are contacting your network most frequently. These external sites
are typically the source of most of your unnecessary network congestion and are a major
cause of security vulnerabilities.
Exinda Networks Pty Ltd, Level 1, 35 King street Melbourne VIC 3000 Australia
Phone +61 3 9614 2199 • fax +61 3 9629 2800 • [email protected] • www.exinda.com.au
Traffic Analysis - Top Conversations Summary
Data Range: 14/4/2003 to 14/4/2003
This view of your top
conversations shows the
overall consumption of
your network capacity.
The top inbound
conversations show data
traffic that originates from
an external host and is
coming into your network.
Exinda Networks Pty Ltd, Level 1, 35 King street Melbourne VIC 3000 Australia
Phone +61 3 9614 2199 • fax +61 3 9629 2800 • [email protected] • www.exinda.com.au
The top inbound
conversations show data
traffic that originates from
your network and is being
sent to an external host.
Top Conversations allow you to see the composition of your network traffic over extended
periods in and out of your network. To ensure network efficiency, unnecessary network
conversations should be blocked from your network (or de-prioritised) using an
appropriate Exinda Optimizer policy.
Exinda Networks Pty Ltd, Level 1, 35 King street Melbourne VIC 3000 Australia
Phone +61 3 9614 2199 • fax +61 3 9629 2800 • [email protected] • www.exinda.com.au
Definition Reference
Adobe Portable Documents: The Adobe Portable Document Format (pdf) is a type of document
that is used extensively due to their small document size. In order to view portable
documents, you must install Adobe Acrobat Reader on your computer. This software can
be downloaded free of charge from the internet
(http://www.adobe.com/products/acrobat/readstep2.html)
Application: A network application is a type of data that is sent over a network to support
applications such as file sharing and web browsing.
Conversation: A network conversation is a transaction of data that occurs between two hosts
using the same application.
Capacity (Network): Network capacity – sometimes called bandwidth – is the raw amount of
data that your network can transmit in a specified time period. Simply, network capacity is
the speed of your network link.
Host: Any computer on a network that is a repository for services available to other computers on
the network. It is quite common to have one host machine provide several services, such
as SMTP (email) and HTTP (web).
Inbound/Outbound Traffic: Inbound traffic is data that is transmitted into your internal network
from external hosts, outbound traffic is data that is transmitted from your internal network.
Internal/External Host: Hosts are either internal or external depending on whether or not they
are part of your private network (Internal).
ISP (Internet Service Provider): An institution that provides access to the Internet in some form,
usually on a commercial basis.
Latency: Latency is the time it takes for a message to travel from your network to a remote host.
Latency is an important way of measuring the efficiency of a network link for network
applications.
Latency Distribution: Latency distributions are important to determine the consistency of a
network link. Many network applications are intolerant of variations in latency, and so
require a low distribution of latency.
Network Interface: The point between your Exinda Optimizer and the network. Typically, each
Exinda Optimizer is packaged with two network interfaces: one for your internal network,
and one for your external network.
SLA (Service Level Agreement): An agreement between a company and an ISP to deliver a
particular Internet access service level.
Subnet: A group of hosts in a network that are assigned similar network (IP) addresses.
Throughput: The rate at which data is transmitted over your network.
Exinda Networks Pty Ltd, Level 1, 35 King street Melbourne VIC 3000 Australia
Phone +61 3 9614 2199 • fax +61 3 9629 2800 • [email protected] • www.exinda.com.au