1
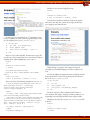
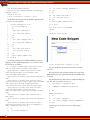
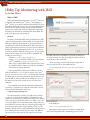
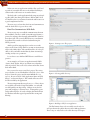
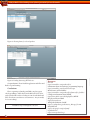
JRuby Tip: Monitoring with JMX by Joshua Moore
20
JRuby Tip: Monitoring with JMX
by Joshua Moore
What is JMX?
JMX (Java Management Extensions) is a JavaTM tool used
to monitor and control a JavaTM process. Since JRuby is a
JavaTM process, it can also be monitored using JMX. The great
thing about JMX is that it is not just one way communication.
You can also use JMX to change settings within the JRuby/
JavaTM process and within your own application. This article
will only cover the briefest of introductions about JMX. The
goal is to help you get started using it.
JConsole
JConsole is the default JMX client provided with the JDK
(JavaTM Development Kit). Unfortunately, it is not part of the
JRE (JavaTM Runtime Environment) so if you do not have it
you will need to download and install the JDK. JConsole is a
simple application that connects to a JavaTM process and then
displays the collected information to the user. It can also be
used to set variables within the JavaTM process. To get started
with JConsole simply execute one of these commands (depending on your OS type):
• Windows: c:\path\to\java\bin\jconsole.exe
• Linux: jconsole (it should be added to the path with the
JavaTM command) or /path/to/java/bin/jconsole
• Mac: Sorry, I cannot afford a Mac right now but I guess
it would be similar to Linux (currently the Josh Moore
Mac fund is accepting donations).
* One bug with JMX on Linux is that JMX uses the IP
address found in the /etc/hosts file to connect to the JavaTM
process. So if you execute hostname -i on the machine running
the JRuby process you want to monitor, and the output is not
your IP address, then you will need to modify the /etc/hosts
file and then restart your network process or restart your
computer.
the JMX connection. In addition, if you want to change any
of the Java settings, use this tab. It depends on the version of
JConsole that comes with JDK .
* If you are using JConsole from versions earlier than 6
then you will need to set this variable in Java:
-Dcom.sun.management.jmxremote (java -Dcom.sun.management.
jmxremote)
* You should be aware that the information gathered by
JConsole is session based, so when the connection is closed
all the gathered information will be lost.
Setup the Jruby/JavaTM process
Now that JConsole is running, you will need to connect
to a process so that you can monitor it. With JMX you can
connect to any local process without any change to it*. Simply
click on the process and click connect (see image). Once connected you will be shown information that is being collected
in real time. The overview tab gives several top level graphs of
the current system resource usage (Memory, CPU, etc). The
Memory, Threads, Classes, and VM Summary tabs all provide
more information about each respective topic. The MBeans
tab is special as it shows you the raw output received from
20
20
or for JRuby use:
jruby -J-Dcom.sun.management.jmxremote
Monitoring local processes is not all that exciting. Much
more interesting and useful is monitoring processes on re-