1
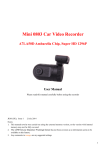
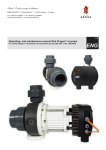
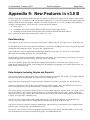
(C) Performance Trends Inc 2007
Port Flow Analyzer
Appendicies
Appendix 9: New Features in v3.5 B
Port Flow Analyzer has had many updates since this user manual was written for the original v3.0 for Windows. These include
3.0 A through v3.0 E, v3.5 and now v3.5 B. For the features added to the v3.5, refer to the Readme.doc file (click on Help, then
Display Readme.doc File) in the program. Listed here are features introduced in v3.5 B. Also, v3.5 B has a more advanced
version we call “Head Porter”. So now there are 3 versions of Port Flow Analyzer:
•
Basic Version
•
Professional (Pro) Version (includes all Basic features and more advanced Pro features)
•
Head Porter Version (includes all Professional features and more advanced Head Porter features)
Here is a listing of the major enhancements and new features for v3.5 B.
Data Recording:
In Test Options, you can now select to record port velocity data at 3 depths in the port. See Figure A41, 47. Head Porter only.
Several enhancements to Port Velocity Report for Head Porter version have been added, to allow more averaging for all possible
combinations of recording port velocity. See Figure A42. Head Porter only.
A new Preference to allow for English units of CFM, Deg F, inches of water pressure, etc. but mm valve, lift and engine
dimensions has been added. See Figure A43. Head Porter only.
The Electronics or FlowCom screen has been enlarged in its default setting. You can still enlarge to most any size you want by
turning on the appropriate Preference setting. See Figure A43-B. All versions.
You can now include a “gauge” (bar graph) for some readings on the Electronics or FlowCom screen. This gives you a
graphical representation of the stability of the readings and if the readings are going higher or lower than expected values. See
Figure A43-B. Head Porter only.
Data Analysis (including Graphs and Reports):
You can create custom, user defined graphs, where you choose what data gets included. For example, you can graph CFM and
Swirl and % Exh/Int on the same graph. See Figure A44, A45. Head Porter only.
Program now allows for graphing Flow results corrected to 2 different test pressures. See Figure A46. Head Porter only.
You have several options to allow for more options for doing Port Velocity Graphs. This is an extension to the feature to be
able to record Port Velocity for many more data points. See Figure A47. Head Porter only.
You can now specify if you want the Test Piece picture to be drawn smaller in printouts in portrait mode. (See “Other” category
for Test Piece picture.) This can allow for more printed text to be included with the graph on 1 page. NOTE: In landscape
mode, the Test Piece picture is always drawn small on the same line as the test title. The Test Piece picture can also be printed
in reports. See Figure A48. Head Porter only.
You can now select a single cylinder to make graphs which require a valve lift profile, like Flow Area and Pseudo Flow
Velocity. In previous versions, only the Average Flow for the entire head was used. Head Porter only.
You can now request the graph to be printed in a smaller height. This can allow for more printed text to be included with the
graph on 1 page. See Figure A49. Pro and Head Porter only.
You can now select a Preference to have the graph NOT autoscale when you first open it. This can be handy if you are using
some pre-defined scales and want to keep them for all graphs. Pro and Head Porter only.
(C) Performance Trends Inc 2007
Port Flow Analyzer
Appendicies
Added a graph line thickness between Thin and Thick, called Thin 'Plus'. See Figure A50. All versions.
The graph line styles in the drop down menu of line thicknesses are listed together, with the appropriate check mark by the type
currently used. See Figure A50. All versions.
You can now select larger legends (labels) in the graph screen. See Figure A50. Pro and Head Porter only.
Added label to better explain what cylinder or that Average of All Cylinders will be used for Flow Area and Pseudo Flow
Velocity graphs. Pro and Head Porter only.
The graph screen now should more completely fill the available screen in most all situations. All versions.
Improved appearance of some printed graphs, especially in Landscape orientation. Previously the graphs had a border drawn
around them. On the left side, the border could be broken. On the right side the legend (labels) could also be distorted. Now
the border is not drawn in those locations. See Figure A49. All versions.
The graph choices have been simplified by eliminating many of the Int, Exh, and Int & Exh choices into just 1 choice. Now the
program looks to a separate input of "Port to Graph" for this setting Int, Exh, and Int & Exh choices. See Figure A45. All
versions.
Fixed bug where the Port Velocity Map was not being graphed correctly. Pro and Head Porter only.
Made Overlap Graphs go to zero at start and beginning of graph to look more correct. Pro and Head Porter only.
Fixed bug where graphs for % Exh/Int only showed the first cylinder on the head even though you requested all cylinders to be
graphed. Pro and Head Porter only.
Added menu command 'Edit Printed Comments & Data Output' under the File option on the Graph screen in the printing options
section. Pro and Head Porter only.
Program now includes more example cam files, the same files included in the new Engine Analyzer v3.4. See Figure A51. Pro
and Head Porter only.
Hardware:
Pro version now allows for Performance Trends’ motor controller to be used. See Figure A52. Pro and Head Porter only.
Program now allows for a USB switch to be used for starting to record data. This option does not present conflicts with some
features of the SuperFlow Flowcom. This is done buy purchasing the proper switch from Performance Trends, then going into
FlowCom or Electronics screen, clicking on Options at the top, then select the USB Switch Option. You must also set the
proper Com Port for the USB Switch under this option also. See Figure A53. All versions.
In the Bench Specs screen, the program now allows for Valve Opener for any Pro version.
Pro and Head Porter only.
Added Hot Wire (hot wire anemometer mass air flow sensor) as a Custom Bench Type. See Figure A54. All versions.
Other:
The program now lets you "Filter" tests in the library for finding tests of a certain date, certain file name, etc. Pro and Head
Porter only.
(C) Performance Trends Inc 2007
Port Flow Analyzer
Appendicies
When quitting program and you select 'Cancel' for Saving Changes to current test file, now the program keeps program open.
Before v3.5B, it continued shutting down. All versions.
The option for using a 2 pulse swirl meter, to be read directly with a FlowCom (no Performance Trends electronics) has been
added. In addition, a special calibration factor for this 2 Blade Swirl meter is also possible. Pro and Head Porter only.
Fixed bug where reports may be requested for intake and exhaust ports, but only intake ports were reported. All versions.
Fixed bug where the cylinders you may "Pick" for a report were not being shown clearly (another input was in front of it). All
versions.
Fixed bug where FlowCom/Electronics screen could be off screen too high or too far to left.
All versions.
Fixed bug where Test Comments were not being shown in the Preview when opening some older Port Flow files. All versions.
Updated a text file to more accurately show Mass Flow correctly for gm/sec and lb/min, and correct for proper air density specs.
Pro and Head Porter only.
Program now hides the 'Range' column for bench types which have only 1 range, like EZ Flow, JKM, new Hot Wire, and LFE.
See Figure A55. All versions.
Program now shows the Company Logo graphic on the main screen. See Figure A55. Pro and Head Porter only.
Added option to include a Test Piece Pic with your data file. This could be of the head, carb, etc. It is displayed on the main
screen and in printouts if you choose to included it from the "Print Options" list (graphs and reports). See Figure A55. Head
Porter only.
Program no longer 'nags' as much about using the CFM at 0 lift as Leakage. All versions.
New Example Flow Files have been added to show new features.
(C) Performance Trends Inc 2007
Port Flow Analyzer
Appendicies
Figure A41 More Port Velocity Options
Click on Test Options at Main Screen
New choice for Type of Port
Velocity data: Record 9
points across the port (3
rows of 3 positions) at all lift
data points.
New option of “Depths in
Port” to allow you to record
data at different depths in
the port, 1 depth (the only
choice in previous versions
and in the current Pro
version), 2 and 3.
Different depths marked as
“A”, “B” and “C”.
Labels let you know which data
points are being graphed.
Arrow shows you flow direction.
Slide slide bar left to
see all the entry points
for port velocity.
Click on Graph
button (shown
here as “Layout”
because Graph is
being shown) and
with more than 1
depth you have 2
options. Front
View (as done
before) or new
Side View (as
shown here. The
depth in Front
View (A, B, or C)
or the depth in
Side View is
determined by
which cell is
currently
highlighted in the
grid. In this case,
it is side depth 3
(farthest from
viewer).
(C) Performance Trends Inc 2007
Port Flow Analyzer
Figure A42 Port Velocity Reports
Last columns
of report
First columns
of report
No letter
indicates depth
Choose this
Report Type
Bottom rows of report.
Averages for all valve
lifts at each position
and depth across all
t
“C” for depth C
Averages for
depths A
(blank), B and C
Appendicies
(C) Performance Trends Inc 2007
Port Flow Analyzer
Appendicies
Figure A43 English Units but Using Millimeters for Lift and Dimensions
New choice in
Preferences
Lift in mm
Flow in CFM
Engine dimensions
also in mm
(C) Performance Trends Inc 2007
Port Flow Analyzer
Appendicies
Figure A43-B Bar Gauges for Selected Readings.
Gauge Options
This option lets program pick
the scales for the gauges.
Choose options to change the
settings for each particular gauge,
the high and low value of the bar
graph, and any limits to be flagged
out in either red or yellow color
(warnings or cautions).
Click this and program will
generate “reasonable” scales
for the gauges. This is useful
when first turning on “Use User
Defined Settings” because
these will all be blank.
Bar gauge with real time updates.
This one shown in red because
reading went above user defined
limit of 29.5. See screen to right for
setting scales and limits.
(C) Performance Trends Inc 2007
Port Flow Analyzer
Appendicies
Figure A44 Custom, User Defined Graphs
Check here to get these Custom Options
Choose what data you want graphed.
If you choose data types
which are graphed vs
different parameters (like
in this case lift and crank
degrees) a warning is
given here and only one
data type will be graphed.
Graphs of Intake Corr. CFM and
Calc. Valve Vel. corrected to 28”
water for all intake ports.
(C) Performance Trends Inc 2007
Figure A45 Custom, User Defined Graphs
Port Flow Analyzer
Appendicies
Check here to get these Custom Options
Pick your graph data
types
Which Cylinder(s)
Which Ports
(C) Performance Trends Inc 2007
Port Flow Analyzer
Appendicies
Figure A46 Custom Graph at 2 Test Pressures
Choose Corr. CFM vs Lift ONLY. Note,
correcting to 2 test pressures only works
for this data type.
Set this to Yes.
Select the Second Test Pressure you
want the data corrected to. Note: The
First Test Pressure is set as “New Int Test
Pres, ‘’water” on the left side.
(C) Performance Trends Inc 2007
Port Flow Analyzer
Appendicies
Figure A47 Custom Port Velocity Graphs
Pick Port Velocity
Pick View and what lifts
and cylinders to graph
Pick Lift or Cylinder
for graphing, which
ever needed
The breakdown of
the scales for
various port
velocities can be
set here. This was
true in versions
prior to V3.5B.
The color choices here can be set in
Preferences. This was true in
versions prior to V3.5B.
(C) Performance Trends Inc 2007
Port Flow Analyzer
Appendicies
Figure A48 Smaller Test Piece Picture in Portrait Mode Printer Orientation
Choose to include Test
Piece Picture in printout
Click here for
screen to right. This
feature is also listed
under Format.
You can choose to make the
picture smaller, which can
give you more room on a
printed page.
Picture Smaller. This only applies
to Portrait page orientation.
Landscape always does this.
Smaller NOT
selected, picture
is larger.
No room on
this page for
Data Table.
Room for Data Table
on a single sheet.
(C) Performance Trends Inc 2007
Port Flow Analyzer
Appendicies
Figure A49 Smaller Graph Fits All Results on 1 Printed Sheet
Choose a % to reduce the
height of the printed graph.
This option works in both
Portrait and Landscape
printer orientations.
Printed graphs no longer have a
border on the left and right sides
around the graph. This border
often had a slight “jog” in it
depending on printer, screen
resolution, etc. Now without a
border, there is no “jog”.
The graph can be printed to
include the Data Table even
though the Test Piece picture is
printed large.
(C) Performance Trends Inc 2007
Port Flow Analyzer
Figure A50 New Graph Features: Line Thickness and Larger Legends
Various combinations of line thickness and Legend Size
If the legend is too large to
fit on the screen, “more”
buttons appear at top and
or bottom. You can click on
these buttons to scroll
through the labels.
Appendicies
(C) Performance Trends Inc 2007
Port Flow Analyzer
Figure A51 More Example Cams for Engine Specs Screen
Choose Pick
an Example
Choose a Category of
Cam from a much larger
list than in earlier versions.
Pick the particular cam from a
large list of cams, almost double
from what was in earlier versions.
Appendicies
(C) Performance Trends Inc 2007
Port Flow Analyzer
Figure A52 Motor Controller to Control Test Pressure
Appendicies
AC power in
Controlled AC
power to bench
Motor controller
options. Current
design only works
with special Black
Box IIs.
Control lines from special
Black Box II
Figure A53 USB Recording Switch
Foot Switch
w USB
connector
Hand Switch
w USB
connector
Under Options, click on USB Switch to see options.
First, click on Set USB Switch Com Port and set that to one of the available Com Ports shown
by the program when you click on this.
Then click on Use USB Switch to tell program to look for this switch input for recording data.
F1 keystroke will still work also.
(C) Performance Trends Inc 2007
Port Flow Analyzer
Appendicies
Figure A54 New Bench Type: Hot Wire Anemometer
Choose Custom Bench Type
Choose Hot Wire
Enter the 3rd order coefficients for a curve
of flow vs voltage. Most likely you will have
to obtain this from Performance Trends
after you run a calibration on your bench.
Figure A55 Main Screen: No Range Column for Certain Benches and Logo Picture
Company Logo shown
on Main Screen
Click on File
button for options
for the Test
Piece picture.
No Range column for this
Hot Wire type of bench.