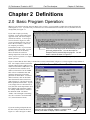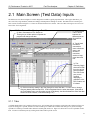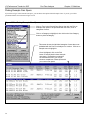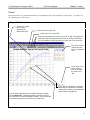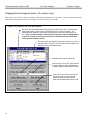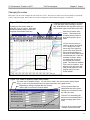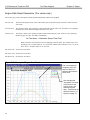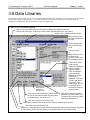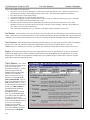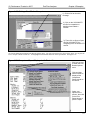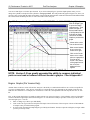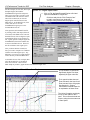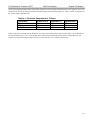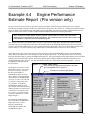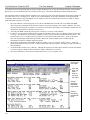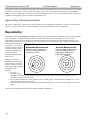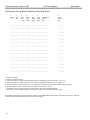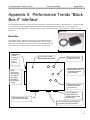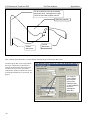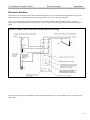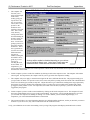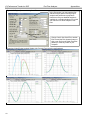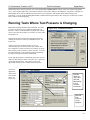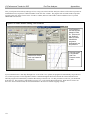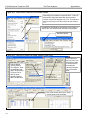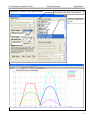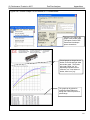
1
Port Flow Analyzer
v3.0, 3.5, 3.5B
User’s Manual
Performance Trends, Inc.
Box 530164 Livonia, MI 48152
248-473-9230 Fax 248-442-7750
Website: www.performancetrends.com
Email: [email protected]
2
Performance Trends, Inc. PO Box 530164, Livonia, MI 48153
Tech Assistance for Registered Owners (248) 473-9230 Fax: 248-442-7750 Email: [email protected]
Website (tips, correspond with other users, download demos, update schedule, etc.) www.performancetrends.com
Copyright Notice
Copyright (C) 2013 PERFORMANCE TRENDS, INC.
All Rights Reserved
These software programs and user's manual are reserved by PERFORMANCE TRENDS, INC. and are intended for the use
of the original owner only. Copying or duplicating these products except for the personal use of the original owner is a
violation of U. S. Copyright Law and is hereby expressly forbidden.
Portions Copyright (C) Microsoft Corp. 1982-2013
All Rights Reserved
International Business Machines Corp. makes no warranties, either expressed or implied, regarding the enclosed computer
package, its merchantability or its fitness for any particular purpose.
IBM PC, XT, and AT are registered trademarks of International Business Machines Corp.
Windows is a registered trademark of Microsoft Corp.
Cam Dr is a trademark of Quadrant Scientific.
Competition Cams is a trademark of Competition Cams Inc.
Blue Racer is a trademark of Wolverine / Blue Racer
Lunati is a trademark of Lunati Cams Inc.
Super Flow and FlowCom are trademarks of Super Flow Corporation.
Saenz is a trademark of Saenz Corp.
DISCLAIMER Of WARRANTIES:
THE SOFTWARE PROVIDED HEREUNDER IS LICENSED "AS IS" WITHOUT ANY WARRANTIES, EXPRESS OR
IMPLIED, INCLUDING BUT NOT LIMITED TO, ANY WARRANTIES FOR MERCHANTABILITY OR FITNESS FOR
A PARTICULAR PURPOSE. NO ORAL OR WRITTEN STATEMENTS, REPRESENTATIONS OR OTHER
AFFIRMATION Of FACT, INCLUDING BUT NOT LIMITED TO STATEMENTS REGARDING CAPABILITY,
CAPACITY, SUITABILITY FOR USE OR PERFORMANCE Of SOFTWARE SHALL BE RELIED UPON BY USER OR
BE DEEMED TO BE A WARRANTY OR REPRESENTATION BY PERFORMANCE TRENDS, INC. FOR ANY
PURPOSE, OR GIVE RISE TO ANY LIABILITY Of OBLIGATION Of PERFORMANCE TRENDS, INC.
WHATSOEVER. USER ACCEPTS ALL RESPONSIBILITY FOR SELECTING THE SOFTWARE TO MEET USER
NEEDS OR SPECIFIC PURPOSES. PERFORMANCE TRENDS INC. IS UNDER NO OBLIGATION TO FURNISH
USER UPDATES OR ENHANCEMENTS EVEN IF FURNISHED TO OTHER
USERS.
LIMITATION Of LIABILITY:
If at the time of delivery to the original User only there are any defects in the media on which the Software is provided,
User's sole and exclusive remedy shall be the replacement of any media returned to Performance Trends, Inc. within 90 days
of the receipt of the Software by User, or at Performance Trends Inc.'s sole option, a refund of the License fees paid to
Performance Trends, Inc. by User.
IN NO EVENT SHALL PERFORMANCE TRENDS, INC. OR THIRD PARTIES WHO HAVE RIGHTS IN THE
SOFTWARE BE LIABLE TO USER FOR LOSS Of PROFITS, INDIRECT, SPECIAL, INCIDENTAL OR
CONSEQUENTIAL DAMAGES EVEN IF PERFORMANCE TRENDS, INC. IS AWARE Of THE POSSIBILITY Of
SUCH DAMAGES.
Continued on next page.
3
IN THE EVENT ANY REMEDY HEREUNDER FAILS Of ITS ESSENTIAL PURPOSE, OR IN ANY OTHER EVENT,
PERFORMANCE TRENDS INC.'S LIABILITY HEREUNDER SHALL NOT EXCEED ANY AMOUNTS PAID BY
USER TO PERFORMANCE TRENDS, INC. UNDER THIS AGREEMENT.
Some states do not allow the limitation or exclusion of liability for incidental or consequential damages and some states do
not allow the exclusion of implied warranties, so the above limitations or exclusions may not apply to you.
No action, regardless of form, arising out of any claimed breach of this agreement or performance under this agreement may
be brought by either party more than one year after the affected party learns of the cause of action.
Refer to diskette envelope for full license agreement.
******************************************* W A R N I N G ******************************************
The Port Flow Analyzer makes calculations based on equations and data found in various published and heretofore reliable
documents. The program is designed for use by skilled professionals experienced with engines and Tests. The following
processes are hazardous, particularly if done by an unskilled or inexperienced user:
-
Obtaining data to input to the program
Interpreting the program's results
Before making measurements of or modifications to any Test, engine or driving situation, DO NOT FAIL TO:
-
4
Regard the safety consequences
Consult with a skilled and cautious professional
Read the entire user's manual
Obey all federal, state & local laws
Respect the rights and safety of others
Table of Contents
Chapter 1 Introduction
1.1 Overview of Features
1.2 Before You Start
1.3 A Word of Caution
1.4 Getting Started (Installation)
1.5 Example to Get You Going
Chapter 2 Definitions
2.0 Basic Program Operation
2.1 Main Screen (test data input)
2.2 Preferences
2.3 Test Options
2.4 Cyl. Head Specs
2.5 Head Details (Pro version only)
2.6 Flow Bench Specs
2.7 Engine Specs (Pro version only)
2.8 Calculation Menus (Pro version only)
2.9 New Test Screen
2.10 Test Correction Factor
2.11 Electronics Screen (FlowCom or Performance
Trends Electronic Interface)
Chapter 3 Output
3.1 Reports
3.2 ASCII Data Files (Pro version only)
3.4 Graphs
3.5 Printer Output
3.6 Data Libraries
3.7 Filter Test Files (Pro version only)
3.8 History Log (Pro version only)
1
1
2
3
4
6
9
9
13
25
29
33
37
41
45
51
55
57
59
63
65
83
85
97
101
105
107
5
Table of Contents, cont
Chapter 4 Examples
109
Example 4.1 Flow Test On a New Type of Head
Using a SuperFlow 600* Flow Bench
without Electronics
111
Example 4.2 Running Flow Test On Type of Head
Which Has Been Flowed Before, Using
FlowCom
119
Example 4.3 Analyzing Cylinder Head Performance
129
Example 4.4 Engine Performance Estimate Report
(Pro version only)
139
Appendix 1:
Accuracy and Assumptions
145
Appendix 2:
Calibration of a Custom Flow Bench
147
Appendix 3:
Tips for Accurate Flow Testing
151
Appendix 4:
Backing Up Data
155
Appendix 5:
Performance Trends Electronic
Interface
159
Appendix 6:
New Features in v3.0 E
163
Appendix 7:
New Features in v3.5
173
Appendix 8:
Appendix 8: Sharing Data Files
on a Hub (network)
187
New Features in v3.5 B
189
Appendix 9:
Index
6
207
(C) Performance Trends Inc 2007
Port Flow Analyzer
Chapter 1 Introduction
Chapter 1 Introduction
1.1 Overview of Features
The Port Flow Analyzer v3.0 program by Performance Trends, Inc is a software system to help head porters, engine builders,
and other flow bench users "streamline" their flow bench testing. The program offers options to record, calculate, save, graph,
organize, retrieve, report and analyze flow bench test data. In the Pro version, flow data can be combined with camshaft and
engine specifications to make engine horsepower and torque estimates, and intake runner recommendations. The Port Flow
Analyzer v3.0 is a unique program which will save test time and improve the analysis of cylinder head flow test data.
Basic Features:
•
•
•
•
•
•
•
Capability to tailor the program to work with standard SuperFlow benches, or custom flow benches
Reads data directly from SuperFlow FlowCom (tm) or Performance Trends’ Electronic Interface.
User friendly, Windows interface, compatible with Windows 3.1, 95, 98 and NT.
Can print results using most any Windows compatible printer, many times in color.
Save nearly unlimited number of tests for recall, comparison and analysis in the future.
Allows several reporting, averaging and graphing options for analysis.
Allows you to record at 1 test pressure, but graph and report results at another test pressure.
Added Features for Pro Version
•
•
•
•
•
•
You can also record:
• Additional flow data like CFM variation (useful for identifying "unstable" ports), Swirl and Swirl variation, Tumble
and Tumble variation, Port velocities from Pitot tube readings, Barometer, Temperature (even if its not needed for
corrections), and Humidity.
• More Head specs like Intake and Exhaust stem diameter, throat diameter, port shape, seat angle, port volume and more.
• Over 60 head details like valve spring specs and part #s, valve specs and part #s, seat cutter descriptions, lock
descriptions, retainer descriptions, and much more.
Combine your flow data with simple cam and engine specs for more detailed analysis and engine performance estimates.
Customize printed reports and especially graphs. You can include comments for each head graphed and tables of the actual
data graphed.
Write ASCII files for importing data into other computer programs.
Filter (find) past tests based on certain criteria, like Max Int CFM over a certain amount, certain Customer name, etc.
"History Log", keeps a running log of tests you have recently started new, run, graphed or reported.
Please read Sections 1.2 "Before You Start" and 1.3 "A Word of Caution" before you turn on the computer. Then try running
the program following the guidelines in 1.4 "Getting Started" and 1.5 "Example to Get You Going". When you feel a little
familiar with the program, take time to read this entire manual. It will show you all the things you can do with this powerful
tool.
* SuperFlow and FlowCom are registered trademarks of SuperFlow Corporation.
See Appendix 7 & 9 for several new features added in version 3.5 & 3.5B.
1
(C) Performance Trends Inc 2007
Port Flow Analyzer
Chapter 1 Introduction
1.2 Before You Start
What you will need:
•
•
Windows 98, Me, XP, Vista, Windows 7, Windows 8 computer.
Printer (optional).
Many terms used by the Port Flow Analyzer and this user's manual are similar to terms used by other publications, i.e. Valve
Flow Coef, Valve Area, etc. However, these terms may have different definitions. Therefore, read Chapter 2 to see what these
terms mean to the Port Flow Analyzer.
Occasionally it will be necessary to identify "typos" in the manual, known "bugs" and their "fixes", etc. which were not known
at the time of publication. These will be identified in a file called README.DOC in the Port Flow Analyzer directory or folder.
To read this file, use Windows Explorer to find the Port Flow Analyzer directory, usually PFA30 under
PERFTRNS.PTI. Then double click on README.DOC. Wordpad will display the contents.
You can also read this file by clicking on Help (top of main screen), then Display Readme.doc file.
Unlocking Program Options:
The Port Flow Analyzer is equipped with copy protection. This ensures the legitimate users do not have to cover the costs for
unauthorized distribution of the program. When you first receive the program, it is in demo mode. All features work in Demo
mode. In demo mode you can try either the Basic version, or the full Professional version for ten days. Sometime during those
10 days, you must call Performance Trends to obtain an “Unlocking Code”. This Unlocking Code will be for either the Basic
version or the Pro Version, which every you have purchased.
Before you call Performance Trends, you should get your registered code number and computer hardware number. These are
available by clicking on file in the upper left hand corner of the Main Screen, then clicking on Unlocking Program Options. A
screen will appear as shown in Figure 1.1.
Figure 1.1 Menu to Unlock Program Options
Performance Trends will provide you an
unlocking code number. Type in the unlocking
code number and click on OK. If you typed in
the number correctly, you will be given a
message that the program is permanently
unlocked to either the Basic or Pro mode. The
program will only run on this one computer.
If you want to run the program on another
computer, you must install it, obtain the
computer hardware number and registered code
number as shown in Figure 1.1, and call Performance Trends for a new Unlocking Code for that computer. There may be a
charge for additional computers.
2
(C) Performance Trends Inc 2007
Port Flow Analyzer
Chapter 1 Introduction
1.3 A Word of Caution
First, before switching from hand recording to computer recording test data, you should be very familiar with the Port Flow
Analyzer v3.5 program and your computer in general. See the precautions in Section 2.0 and Example 4.1.
Second, a powerful feature of the Port Flow Analyzer Pro version is its ability to combine flow data and general cam and engine
data to make performance projections and recommendations. These projections can be used to judge head/cam combinations,
cylinder head modifications, etc.
An engine is a very complex system, which makes exact calculations of all details impossible. Therefore, simplifying
assumptions are made to reduce the calculations to a manageable level. See the Assumptions in Appendix 1 and Example 4.4.
The user must recognize:
The software cannot predict the safety of an engine modification or running condition. Please read and follow any safety
precautions as described in this manual. Also, get "expert" opinions before running your engine at an RPM or torque level
higher than what it was originally designed for.
The software cannot make exact predictions of torque and horsepower because:
• Much of the input data to the software are estimated.
• Even if the input data were exactly correct, the simplifying assumptions will limit the accuracy.
• Environmental and engine conditions, fuel, the driving situation, etc. are never constant and repeatable.
The software should be used as a guide to:
• Help understand how cylinder heads interact with other engine components; what parameters are important and what
are the tradeoffs.
• Provide general direction for making modifications. This direction should be verified by other sources like known
authorities, engine tests, books, etc. Never trust one "single source" if it does not make sense.
• Make you think, not think for you. If unexpected results are obtained, take a minute to:
• Double check all input data.
• Refer back to this manual.
• Ask someone else skilled and experienced in the particular area.
• Give the retailer or Performance Trends Inc's. Tech Help Line a call for an explanation. (Also, programs are
written by people so it's always possible there may be an error in the calculations. Your call may help us correct
it.)
Please also read the Warranty and Warning at the beginning of this manual and on the diskette envelope.
3
(C) Performance Trends Inc 2007
Port Flow Analyzer
Chapter 1 Introduction
1.4 Getting Started (Installation)
You must install the Port Flow Analyzer from the distribution disks (a CD in version 3.0 E or newer, floppy disks in older
versions) to a hard drive before it will run. To do this from a CD, simply install the CD in your CDRom drive and the
Performance Trends Installation Wizard should automatically start, allowing you to install the Port Flow Analyzer and demos of
any of our other products.
If the CD does not auto-run, then click on Start, then Run, then Browse and find your CD drive. Then look for SETUP.EXE on
the CD and run it to run the Installation Wizard. If you want to bypass the wizard, go into the Programs folder and run the PFA32.EXE file.
Figure 1.1 B Installation Wizard or Bypassing Installation Wizard
The Installation Wizard will
Auto-Start when you insert
the program CD. Here’s the
Port Flow Analyzer button to
install this program. You can
also install any or all of the
other demo programs on the
CD. Click on the Brochure
button by a particular product
for a description with
illustrations (a brochure) of
that program to be displayed.
To bypass the Installation Wizard, click on Start,
then Run, then Browse from the Run screen
shown below to find the CDRom, then the
Programs folder on the CD, then the PFA32.exe file in the Programs folder.
4
(C) Performance Trends Inc 2007
Port Flow Analyzer
Chapter 1 Introduction
Entering Registered Owner's Name:
The first time you run the Port Flow Analyzer, you will be asked to enter your name as the Registered Owner. During this first
session, you can modify it until you are satisfied. Once you accept the name, the computer will generate a Registered Code #
based on the name. To be eligible for Tech Help, you will need both your registered name and code #, and to have sent in your
registration card. The name you enter should be very similar to the name you enter on the registration card.
Click on Help, then About Port Flow Analyzer at the Main Screen to review your name and code # .
Unlocking Program Options:
The Port Flow Analyzer is equipped with copy protection. This ensures that legitimate users do not have to cover the costs for
unauthorized distribution of the program. When you first receive the program, it is in demo mode. In demo mode you can try
either the Basic version, or the full Professional version for ten days. All features are working in demo mode.
Sometime during those 10 days, you must call Performance Trends to obtain an “Unlocking Code”. This Unlocking Code will
be for either the Basic version or the Pro
Figure 1.2 Menu to Unlock Program Options
Version, whichever you have purchased.
Before you call Performance Trends, you should
get your registered code number and computer
hardware number. These are available by
clicking on file in the upper left hand corner of
the Main Screen, then clicking on Unlocking
Program Options. A screen will appear as
shown in Figure 1.2.
Performance trends will provide you with an
unlocking code number. Type in the unlocking
code number and click on OK. If you typed in a
number correctly you will be given a message that the program is permanently unlocked to either the Basic or Pro mode. The
program will only run on this one computer.
If you want to run the program on another computer, you must install it, obtain the computer hardware number and registered
code number as shown in Figure 1.2, and call Performance Trends for a new Unlocking Code for that computer. There may be a
charge for additional computers.
5
(C) Performance Trends Inc 2007
Port Flow Analyzer
Chapter 1 Introduction
1.5 Example to Get You Going
To start the Port Flow Analyzer, double click on the desktop Icon called Port Flow Analyzer v3.5. If you don’t see a desktop
icon, click on Start, then Programs, then Performance Trends, and then Port Flow Analyzer. During startup of the program, you
will be given some introductory tips.
One of these “Tips” will ask if the “last test you were
running should be loaded”. If you have just received
the program, this test will be an example test which
was loaded at the factory. If you have run the Port
Flow Analyzer before, this will be the last test you
were working with. If you are just learning the
program, it is recommended you answer yes to this
question so you have some example data to work
with to understand how the program works.
Figure 1.3 Introductory Question
After these brief introduction screens and questions, you will be left at the Main Screen shown below:
Figure 1.4 Main Screen (Pro Version)
Name of
current test
you are
working with
Menu
Commands
Click on File,
then choose
from different
Save or Open
options
Click on
Unlock
Program
Options to
obtain codes to
give to
Performance
Trends to
permanently
unlock the
program (take
out of the 10
day demo
d )
6
(C) Performance Trends Inc 2007
Port Flow Analyzer
Figure 1.5 Graph Options Menu
From this Main Screen, you can:
•
•
•
•
•
•
•
•
Chapter 1 Introduction
Choose to review your options by clicking on the menu items at the top
of the screen.
Open or save a file of test results and specs by clicking on File in the
upper left corner, and then the Open or Save commands.
Add, edit or review flow data or test comments for the file you are
currently working with.
Graph or report the test for the file you are currently working with.
Change the Preferences options to somewhat customize the program for
your needs.
Click on File, then Unlock Program Options to obtain codes to give to
Performance Trends to permanently unlock the program (take out of the
10 day demo mode). See Section 1.4.
Get HELP to explain these options by clicking on Help or pressing
<F1>.
Quit the program by clicking on File, then Exit.
Select this Type by clicking here
All these options are explained in detail in Chapters 2 and 3.
In the Main Screen’s blue title bar you will notice the name of the current
test is contained in square brackets [ ] (if you did load in a Flow Test at program startup or opened a file by clicking on File,
then Open). The program has several examples of tests saved in the Test Libraries’ Example folder right from the factory.
To get started, let's try a couple of
Menu commands. Click on the
Graph menu command to open up
the graph options menu shown in
Figure 1.5. That Graph Type
shown in Figure 1. 5 is for intake
and exhaust corrected CFM. If
this is not the graph type you see
on your computer screen, click on
the down arrow to select “Corr Int
& Exh CFM”.
Figure 1.6 Graph from Options Selected in Figure 1.5
Click on the Make Graph button to
produce the graph shown in Figure
1.6. At the graph screen you have
several other options available for
changing the graph. These options
are available by clicking on the
commands in the menu bar or on
the buttons at the top of the screen,
including the Help command. The
Help command at this screen (and
most screens) provide a good
background on what the various
options are. For now, just click on
Back at the upper left to return to the Main Screen.
Click on
Help for an
overview of
your
options for
this
screen.
Click on
Back to
return to
the Main
Screen
A Test File is made up of the flow data (test pressure, temperatures, valve lifts, etc) and other data like Head Specs, Flow Bench
Specs, etc. This is explained in Section 3.6 "Data Libraries". Click on the Head command to obtain a menu as shown in Figure
1.7.
7
(C) Performance Trends Inc 2007
These head specs
are used for
calculating certain
outputs (like valve
area, port velocity,
etc), and they are
useful descriptions
to remind you of
what this head was
in the future.
Port Flow Analyzer
Chapter 1 Introduction
Figure 1.7 Head Specs Menu (Pro version)
Many of the input
specifications you
see in the various
menus may not be
familiar to you. For
a brief definition of
the inputs, simply
click on the
specification name.
The definition will
appear in the Help
frame with a page #
in this manual for
more info.
Click on
most any
spec or
spec
name, and
a brief
Help
description
is given
here in the
Help
Frame,
with a
page # in
this
manual for
additional
info.
In the Pro version,
some engine specs have “Clc” buttons. One example is Compression Ratio. “Clc” stands for "calculate". For example, if you
want to calculate compression ratio from chamber volume, deck height, etc., simply click on the Clc button. The program will
display a new menu listing the inputs and the Calc Compression Ratio from these inputs. For further explanation, click on the
Help buttons in these menus. To use the Calc Compression Ratio calculated from these inputs, click on the Use Calc Value
button. Otherwise click on Cancel to return to the Engine Specs menu with no change to Compression Ratio. Section 2.8,
Calculation Menus explains all these calculations.
Once you feel comfortable
changing specifications in the
various menus and making
various performance calculations,
read Section 3.6 of this manual
called Data Libraries to learn how
to save a set of flow data or
component specifications or recall
information which has been
previously saved. Then you will
know all the basic commands to
operate the program. For a more
in-depth knowledge of using
these commands and an
explanation of the results, read
this entire manual.
8
Figure 1.8 Pro Version’s Engine Specs Menu Showing Clc Button
Clc button
calculates
the value
of these
specs
based on
other
inputs.
(C) Performance Trends Inc 2007
Port Flow Analyzer
Chapter 2 Definitions
Chapter 2 Definitions
2.0 Basic Program Operation:
Whenever you start the Port Flow Analyzer (Basic or Pro versions), you are brought to a Main Screen which will look like
either Figure 2.1 or 2.3. If you have not yet selected a test to work with and have not started a new test, the Main Screen is
mostly blank, like Figure 2.1.
Figure 2.1 Main Screen Before Opening a Test File
If you want to Open a previously
saved test, you can click on File in the
upper left corner, then click on Open
(from all saved tests). You will get a
screen as shown in Figure 2.2 where
you are presented with a list of saved
tests in the Test Library. Some tests
are examples provided by
Performance Trends. As you run tests
Click on File, then Open (from all saved tests) to open a
yourself and save the results, you will
previously saved test file. You can also open an
add many more tests to the library.
Example Test file provided with the program. You will
These saved files are useful for
obtain a screen as shown in Figure 2.2.
making comparisons in the future, and
can be used as test patterns (or templates) for new tests (saving you considerable time by not having to type in specs which
match a past test).
Figure 2.2 shows that the Test Library is divided into sections (called Folders in Figure 2.2) to help organize a large number of
tests. For example, all flow tests for the
Figure 2.2 Main Screen With a Current Test File
company ABC Engines could be saved
under a section name of ABC-ENG. All
4 cylinder Ford tests could be saved
under a section name of 4CYL-FORD.
This will save considerable time and
confusion when trying to located a
particular test in the future. To look in
different sections, click on the Folder
name from the list shown at the lower
right of Figure 2.2. The list of tests will
then be updated for that Folder. To pick
a test, simply click on it from the list of
tests, then click on the Open button. (For
those familiar with computers, Folders
are actually subdirectories or folders in
the PFADAT folder. The Name
“Folder” can be changed to something
else, like “Customer” used in the DOS
v2.1, in the Preferences menu.)
If you are working with particular test,
the data will be presented as shown in
Figure 2.3. Notice in Figure 2.3 that a
Click here to pick a different catagory or group of tests
(Folder) from which to display a list of Test Files.
9
(C) Performance Trends Inc 2007
Port Flow Analyzer
Figure 2.3 Main Screen After Opening a Test File
Menu Commands of File, Graph, etc. These
give you all the options to operate the program
and change test data.
Chapter 2 Definitions
Name of Current Test File
Click on these
tabs to switch
between the
different ports on
this particular
head.
Enter most any
test comments
here to keep
notes about this
head or test.
Move the mouse
over an area on
the screen, and
a Help
description of
that item is given
here
This summary
graph shows
how CFM from
the various ports
compares. The
CFM for the port
you are currently
displaying is
graphed in color,
blue if intake, red
if exhaust.
Click on Slide Bars to display more Test Data, which
may not be able to fit on the screen.
Click on most any setting in the Test Data grid to enter flow data. You can enter or change most
any data by hand except CFM. CFM is calculated from the other data inputs. (Note that in the
Test Options menu you can select to enter CFM directly, but this eliminates the other flow data
entries like Flow Pressure, Flow Bench Range, etc.)
Click either in the first column (Point column) or top row (with titles of the columns) to open up an Edit
menu to insert a row, delete a row, copy down a column, etc.
A summary of critical test settings is given here. Click on a setting to change it (in the case of
Leakage air flow for each port), or to bring up the menu where it can be changed.
current test name is listed at the top in square brackets [ ]. This is the file of cylinder head data, flow data and flow bench specs
which are currently saved in the Flow Test Library, and are the data and specs you are currently working with. If you change
the flow data or specs, make a graph or report, it is for this test file.
If you click on one of the Menu Commands at the top of the Main Screen, you can be presented with screen of specs, as shown
in Figure 2.4. Figure 2.4 discusses some of the commands to enter or change settings at this menu.
10
(C) Performance Trends Inc 2007
Port Flow Analyzer
Chapter 2 Definitions
Figure 2.4, Explanation of Sections of Typical Menu (Engine Specs menu shown which is
only available in the Pro version)
Names of component specs. Click on them for a description in the Help frame in the
lower left corner.
Name of component file displayed in this menu (Pro version only).
Standard text entry box where you can type in a number for a spec.
Drop down combo box. For some specs
(like Total Cam Advance in these Engine
Specs) you can either type something in the
box, or click on the arrow button to select a
pre-programmed selection. For most others
you can only select from a list pre preprogrammed choices.
Comment text
frame to enter a
comment to
describe these
component specs.
These comments
are saved with the
specs in the
Component
Library, in the
case shown here,
the Engine
Library.
Some specs have
a Clc (calculate)
button, where you
can either enter the
specs directly (in
this case the
compression ratio)
or click on the Clc
button to calculate
it from other inputs.
Standard menu commands which provide the options for closing this menu (Back),
saving or open files of these individuals specs (click on File, then Save or Open),
erasing a set of specs (click File, then New, printing this screen (click on File, then
Print), etc. See the sections later in this chapter for more details on individual
menus.
11
(C) Performance Trends Inc 2007
Port Flow Analyzer
Chapter 2 Definitions
Before Running Your First Flow Test:
It is recommend you becoming very familiar with the Port Flow Analyzer before starting "real" tests. Points to consider include:
• Unlike paper Test Data grids, computer data from past tests can be lost if back up copies on floppy disks are not made.
Printing paper reports of a test is another method of "backing up" data. See Appendix 4, Backing Up Data.
• Data for a test can also be lost if the Save command is not used to save data to the Flow Test Library.
• Perform some "parallel" tests using both the computer and recording data by hand. The results should agree within a
couple of CFM. If not, the Port Flow Analyzer might not be set up correctly for your flow bench. Also, check the hand
calculations to be sure they are being performed in the way the Port Flow Analyzer calculates results. Resolve any
problems before switching over to the computer. Note: Port Flow Analyzer is doing all recommended corrections,
which you may not currently be doing by hand. This is a possible reason the Port Flow Analyzer’s CFM numbers may
not match your hand calculations.
Flow Bench Terminology:
A flow bench is a device which flows air through a test piece at a measured pressure drop and air flow rate. By knowing the
pressure drop and air flow rate, the test piece can be rated for flow efficiency and compared with other similar test pieces. For
engine components, the higher the flow efficiency, the higher the horsepower potential.
The pressure drop across the test piece is called the test pressure and is abbreviated as Test Pres in this manual and program.
Test Pressure is usually measured with a vertical manometer calibrated in inches of water.
The air flow is generally measured by
monitoring the pressure drop across
one or more flow orifices of known
sizes. The pressure drop across these
orifices is abbreviated as Flow Pres for
flow pressure. Flow Pres is usually
measured with an inclined manometer
calibrated in % Flow.
The Port Flow Analyzer assumes the
test pieces are cylinder heads either
with or without other components
attached (manifolds, headers, etc).
The program can be used for testing
other components, however a notation
system for organizing the data will
have to be developed by the user.
Figure 2.5
Blower Center Bench
(like SF60, 110, 120)
Orifice Center Bench
(like SF 300, 600, 1020)
Air M easurem ent
O rifice
Test Piece
Test Piece
Air M easurem ent
O rifice
Section 2.6 on Bench Specs goes into
Blower
more detail on specific flow bench
features. Be familiar with the Flow
Bench Specs before taking data. The
flow bench specs must match those of the particular flow bench being used for the test data to be accurate.
Blower
There are 2 basic types of flow benches the Flow Bench Analyzer supports, "blower center" and "orifice center". See Figure
2.5. These types can be either standard as available from a manufacturer like SuperFlow *, or "custom". The various types of
benches are described in more detail in Section 2.6, Bench Specs.
* SuperFlow, SF 60, SF 110, SF 120, SF 300, SF 600 and SF 1020 are registered trademarks of SuperFlow Corp.
12
(C) Performance Trends Inc 2007
Port Flow Analyzer
Chapter 2 Definitions
2.1 Main Screen (Test Data) Inputs
The Main Screen is shown in Figure 2.6 and is designed to resemble a typical paper data sheet. Like a paper data sheet, you
enter valve lifts, range numbers, manometer readings, and temperature readings as needed. The Main Screen is made up of 5
basic sections as shown in Figure 2.6. These are discussed in the next 5 sections. The rest of this section gives an overview of
how a Flow Test is organized.
Figure 2.6 Main Screen After Opening a Test File
5) Menu Commands of File, Graph, etc.
These give you all the options to operate the
program and change test data.
1) Click on these
Tabs to switch
between the
different ports on
this particular
head.
2) Test & Head
Conditions
summarizes
some critical test
specs, and
includes a
comments
section to keep
notes about this
test.
3) This
Summary Graph
shows how CFM
from the various
ports compares.
The CFM for the
port you are
currently
displaying is
graphed in color,
blue if intake, red
if exhaust.
4) Click on most any setting in the Test Data grid to enter flow data. You can enter or change
most any data by hand except CFM. CFM is calculated from the other data inputs. (Note that in
the Test Options menu you can select to enter CFM directly, but this eliminates the other flow data
entries like Flow Pressure, Flow Bench Range, etc.)
2.1.1 Tabs
A cylinder head's Flow Test is made up of between 2 to 16 Test Data grids for each port, each with a tab as shown in Figure 2.6.
If you are testing just 1 cylinder, the flow test will be made up of 1 intake and 1 exhaust Test Data grid. If you are flowing 2
cylinders it is made up of 2 intake and 2 exhaust Test Data grids, and so on. Figure 2.6 shows how a test for 4 cylinders would
look. You move to different ports by clicking on the Tabs at the top of the screen.
13
(C) Performance Trends Inc 2007
Port Flow Analyzer
Chapter 2 Definitions
You set the Number of Cylinders to test and the pattern for the cylinder numbering in the Head Specs menu. You can open the
Head Specs menu by clicking on the Head menu command at the top of the Main Screen. See Section 2.4.
2.1.2 Head and Test Options
Valve Description
Describes the number of valves and valve diameter for the port being displayed. Click on this item to display the Head Specs
menu where this data is contained.
Test Time and Date
This records the time and date at the start of the flow test. When a flow test is started with the New Test command (click on
File, then click on New Test at the Main Screen), the computer's current time and date are saved as the test time and date. The
test time and date can also be changed by clicking on it here at the Main Screen. Only one test time and date is saved for the
Flow Test file. If, for example, a note is needed to show some ports were tested on a different day, that must be recorded in the
test comments.
Test Correction Factor
The SuperFlow 110 and 120 bench recommends a calibration test be performed periodically. This is done by flowing a standard
size orifice where the head is mounted. By comparing the flow of this orifice with the expected flow, a correction factor is
calculated and displayed here. See the Test Correction Factor command in Section 2.10, page 57 and Example 4.2. For other
benches, the Test Correction Factor is automatically set to 1.000 (no correction) and is not displayed.
Bore Adapter
Describes the Bore Adapter diameter used for this test. The Bore Adapter is the cylinder mounted between the head and the
flow bench, simulating the engine’s bore. The size of bore adapter can have a large effect on the CFM flow. Click on this item
to display the Test Options menu where this data is contained.
Test Pressure
Air flow through the port will vary as the Test Pressure (vertical manometer pressure) changes. For most flow tests, it is best if
the Test Pressure is kept constant, however, this is not always easy. For example, you may want to hold 28 inches, but the true
reading may be 27.8, or 28.1. Fortunately it is easy to mathematically correct the air flow to a constant Test Pressure. This spec
identifies the standard Test Pressure you are trying to maintain on the vertical manometer. CFM will be corrected to this Test
Pressure for the current port being displayed. Intake and exhaust ports can be set to different Test Pressures. Click on this item
to display the Test Options menu where this data is contained.
Leakage
This is the leakage flow through the bench with the valve closed in the port being flowed. Because this flow is not passing
through the valve, the Leakage CFM value is subtracted from the calculated flow for each test point. See Examples 4.1 and 4.2
for recording Leakage and how it corrects data. The Leakage CFM can be different for each port. Click on this item for each
port to type it in directly. Press <enter> when you are done typing. Although many head porters do not check or record
leakage, it is a good practice to develop.
14
(C) Performance Trends Inc 2007
Port Flow Analyzer
Chapter 2 Definitions
Figure 2.7 Operator Name Menu
Test Operator
This is the name of the operator who ran the test. Click on this item for the
menu of Figure 2.7 to be displayed, where you can type in a new operator name,
or choose from one you have previously entered. It is always recommended
you first check the list of existing operators, so you do not end up with several
names for the same operator. For example, Bob, Bobby and Robert may all be
for the same guy. When you go to look for tests run by Bobby in the future, the
search (Filter option) will not show up the tests run by Bob or Robert.
To pick an existing operator name, pick No for Enter a New Operator, then pick
from the Operator list. To enter an New Operator name, pick Yes for Enter a
New Operator, then type in a New Operator name, which will be added to the
list of operator names.
Test Comments
Test comments are for making most any notes about the test, unusual observations, customer requirements, etc. In the Pro
version, you can search the Comments for various words. For example, you could search for all the tests which had the word
“unstable” or “titanium” in the Test Comments.
Help
The help frame will describe what ever portion of the screen the mouse has passed over or clicked on. For example, click on a
location in the Test Data grid, and a description of what data can be entered in that particular column is given.
2.1.3 Summary Graph
The summary graph shows CFM graphed versus valve lift for all the ports on this particular head (Figure 2.6). This is an
excellent way to show if the data between the different ports is agreeing well. It does take some time to graph all ports. On
slower computers you may want to change the Preference “Main Screen, Other Cyl. Graphs” to No. This will result in faster
updating of the Main Screen but graph only the data for the port you are working on.
Figure 2.8 Summary Graph for Port Velocity Data (Pro version only)
Port Velocity Layout
Port Velocity Graph
15
(C) Performance Trends Inc 2007
Port Flow Analyzer
Chapter 2 Definitions
In the Pro version, if you are working with (clicked on) a column for entering Port Velocity it will show a graph of Port Velocity
or a layout diagram so you know where different port points are located. See Figure 2.8.
If you click on the Summary Graph, the Graph Options menu pops up to provide many more graphing options.
2.1.4 Test Data Grid
Figure 2.9 Row Editing
Options
Point
The point column simply numbers the rows of data, and is used by the program to identify a
row of data for messages. Another feature is if you click on a Point #, the Edit Test Data
menu shown in Figure 2.9 pops up, letting you edit the row you clicked on. A similar
editing menu is available by clicking on the top row, for editing columns.
Lift
This is the valve lift in inches from its seated position. If you have asked for L/D to be
displayed (selectable in the Test Options menu), a new L/D value is calculated as each valve lift is entered or changed.
L/D
This is the ratio of valve lift divided by valve diameter. For example, if the particular port is an intake port, the valve diameter is
specified in the Head Specs menu under Intake Port Specs. As each valve L/D is entered or changed, a new valve lift is
calculated. You can ask for this column not to be displayed by selecting the appropriate option in the Test Options menu.
Range
This identifies the range number currently being used for measuring the air flow, a number between 1 and 9. The number
identifies the Full Scale Flow entered in the Flow Bench Specs menu. For SF 1020 benches, the actual Full Scale Flow in CFM
is entered in this column.
Note: If you were using a previous DOS version of Port Flow Analyzer with a “blower centered bench” like a SF 110, this spec
has changed. You no longer can enter the numbers of the holes which are open. When your old DOS files are read into this
new version, the Range # and possibly the Flow Pres data will be changed to match the new data format, but giving the same
CFM as before.
Test Pressure
This is the pressure drop measured across the head (port and valve) on the vertical manometer in inches of water, called "test
pressure". This value should be kept within .5" of the Test Pressure specified in the Test Options menu and as shown in the Test
Notes section.
Flow Pressure
This is the pressure drop across the air flow orifices, generally measured with an inclined manometer. For custom benches, the
Port Flow Analyzer allows you to use various types of inclined manometer readings. See Inclined Flow Manometer under
Bench Specs in Section 2.6 and Appendix 2.
16
(C) Performance Trends Inc 2007
Port Flow Analyzer
Chapter 2 Definitions
Test Temp
If Use Temp Correction is set to Yes under Bench Specs (Custom Blower Center bench or SF 60, SF 110, SF 120), this data is
the temperature of the air passing through the head in degrees F. For intake flow it is measured after the port. For exhaust it is
measured before the port.
If Use Temp Correction is set to No under Bench Specs (Custom Orifice Center bench or SF 300, SF 600, SF 1200, SF 1020),
this column will not be present in the Test Data grid unless you specifically request recording temperature in the Test Options.
Flow Temp
If Use Temp Correction is set to Yes under Bench Specs (Custom Blower Center bench or SF 60, SF 110, SF 120), this column
is made available. It is the temperature of the air passing through the air measurement orifices in degrees F. For intake flow it is
measured before the orifices. For exhaust it is measured after the orifices.
If Use Temp Correction is set to No under Bench Specs (Custom Orifice Center bench or SF 300, SF 600, SF 1200, SF 1020),
this column will not be present in the Test Data grid.
CFM
Is the air flow in CFM which has been corrected for temperature, leakage and the difference between actual Test Pressure
recorded and Standard Test Pressure. This is the only data that you can NOT enter directly or modify by clicking on it and
typing in a new value (unless you specify “Enter CFM Directly” in the Test Options menu). It is based on the calculations from
data in the other columns.
The general sequence of events for the CFM calculation is given below:
1.
2.
3.
4.
5.
6.
7.
8.
After each new value is entered, the program checks to see if enough data has been entered to calculate CFM for that row.
If enough information is present, the Full Intake Flow or Full Exhaust Flow for the range # identified under Range is
determined.
The correct fraction of the total flow for the appropriate range is based on Flow Pressure and the Inclined Flow Manometer
specs in the Bench Specs menu.
If Use Temp Correction is set to No (SF-300, SF-600, etc.), a correction is made for intake and exhaust flow due to any
difference between actual Test Pressure and Orifice Std Pres spec in the Bench Specs (typically a very small correction).
If Use Temp Correction is Yes (SF-110, SF-60), a correction is made due to temperature differences at the measurement
orifices (Flow Temp) and the test piece (Test Temp).
A correction is then made for any difference between actual Test Pressure and the Desired Test Pressure shown in the Test
Notes and set in the Test Options menu.
For the SF 110 bench only, the resultant CFM at this point is multiplied by the Test Correction Factor. See Section 2.10.
The Leakage CFM is then subtracted from the previously calculated CFM. This is the value printed in the data column for
CFM. It is assumed that the Leakage CFM has already been corrected for the factors mentioned in steps 2-4. See Examples
4.1 and 4.2.
Stblty +/- % (Pro version only)
This is a measure of the stability of the Test Pressure for this data point. Many head porters talk about a stable versus an unstable
port. This can be based on sound or the “bounce” they see in the test pressure manometer. The Port Flow Analyzer’s definition
of Stblty is the percent of Test Pressure “bounce” compared to the total Test Pressure. For example, if you see a 1” bounce in
test pressure when you are trying to set 10”, this would be 10% (1/10 x 100% = 10%). If you only saw 0.1” of bounce, this
would only be 1% Stblty.
This column is only available if you have selected “Calc from Entries, Include Stability” option for CFM Flow in the Test
Options menu. Although you can enter Stblty by hand, it was meant to be recorded electronically with SuperFlow’s FlowCom
or Performance Trends’ Electronic Interface. In the Flow Bench Specs menu you can specify from 5 to 50 data points to be
17
(C) Performance Trends Inc 2007
Port Flow Analyzer
Chapter 2 Definitions
recorded and averaged together for a CFM reading. During these readings, the program calculates some statistics on the
stability of the Test Pressure readings. It tries to be as accurate at estimating stability if only 5 readings are taken, but it should
be obvious to the user that the accuracy and repeatability of the Stability readings improves as you ask for more readings to be
taken. Performance Trends recommends you always take at least 10 readings if you are recording Stblty +/- %.
Swirl (Pro version only)
Swirl is a measure of the motion
of the intake air in the cylinder.
Figure 2.10 Performance Trends Swirl Meter
The correct amount of intake air
motion improves combustion
and improves burn rate, both of
which improve performance. It
can be measured on a flow
bench using Performance
Trends RPM based Swirl Meter.
See Figure 2.10. Performance
Trends definition of swirl
direction is: Clockwise rotation
when viewed from the top of the
cylinder is positive (+) swirl, counterclockwise is negative (-). See Figure 2.10.
+ Swirl
Direction
View of Cylinder Bore from Top
If you have asked to record swirl in the Test Options, this column is made available, but only on the Intake ports (exhaust swirl
is meaningless). Record swirl RPM from the Performance Trends Swirl Meter or a swirl reading from a different type of meter.
Enter a negative (-) number if the swirl is counterclockwise as viewed from the top of the cylinder.
Swirl +/-% (Pro version only)
This data is very similar to the Stblty +/- % discussed previously, and is the % variation (“bounce” discussed earlier) in the Swirl
reading compared to the average Swirl Reading. If the variation from Max to Min over 10 seconds was 300 RPM and the
average Swirl was 3000 RPM, this would be 10%.
This column is only available if you have selected “Record Avg Swirl and Range %” option for Record Swirl in the Test
Options menu. Although you can enter Swirl +/- % by hand, it was meant to be recorded electronically with SuperFlow’s
FlowCom or Performance Trends’ Electronic Interface. In the Flow Bench Specs menu you can specify from 5 to 50 data points
to be recorded and averaged together for a CFM reading. During these readings, the program calculates some statistics on the
Swirl readings. It tries to be as accurate at estimating Swirl +/- % if only 5 readings are taken, but it should be obvious to the
user that the accuracy and repeatability of the Swirl +/- % readings improves as you ask for more readings to be taken.
Performance Trends recommends you always take at least 10 readings if you are recording Swirl +/- %.
Baro Pres (Pro version only)
If you have asked to record Barometer in the Test Options, this column is made available. Record Barometer in inches of
Mercury. (This entry is for information only and is not used in the CFM calculation.) If you are using the SuperFlow
FlowCom, this reading is provided by the FlowCom.
Background: There are 2 basic types of Barometric Pressure readings:
Corrected Barometer: This reading is what you will hear from most any TV or radio weather report. It is the true barometric
pressure corrected to sea level. This means, with the current barometric pressure, what would a barometer read as sea level.
18
(C) Performance Trends Inc 2007
Port Flow Analyzer
Chapter 2 Definitions
Observed (true) Barometer: This is the actual Barometric Pressure at the barometer instrument, measuring the actual air
pressure at the barometer. This reading will read approximately .1 inches of mercury less than the corrected barometric
pressure you will hear from a TV or radio weather report for each 100 feet of elevation.
For this reason, the barometer you see on TV or hear on the radio should be about .1” higher for each 100 feet of elevation at the
FlowCom’s barometer or the barometer instrument at your shop. It is not important to the program which barometer you record
because it is for your information only. However, to avoid confusion on your part you should be consistent from test to test.
Reltv Hum or Dew Point (Pro version only)
If you have asked to record Humidity in the Test Options, this column is made available. The title depends on your choice of
Relative Humidity or Dew Point in Test Options. Note that this entry is for information only and is not used in the CFM
calculation.
Tumble (Pro version only)
Figure 2.11 Performance Trends Tumble Fixture
Intake Port
+ Positive
Tumble
Direction
Tumble is a measure of the motion of the intake air in the cylinder. The correct amount of intake air motion improves
combustion and improves burn rate, both of which improve performance. It can be measured on a flow bench using Performance
Trends RPM based Tumble Meter. Performance Trends’ convention is a negative tumble means the tumble direction is opposite
of the direction the intake port would induce. See Figure 2.11.
If you have asked to record Tumble in the Test Options, this column is made available, but only on the Intake ports (exhaust
Tumble is meaningless). Record Tumble RPM from the Performance Trends Tumble Meter or a Tumble reading from a
different type of meter.
Tumble +/-% (Pro version only)
This data is very similar to the Stblty +/- % discussed previously, and is the % variation (“bounce” discussed earlier) in the
Tumble reading compared to the average Tumble Reading. If the variation from Max to Min over 10 seconds was 300 RPM and
the average Tumble was 3000 RPM, this would be 10%.
This column is only available if you have selected “Record Avg Tumble and Range %” option for Record Tumble in the Test
Options menu. Although you can enter Tumble +/- % by hand, it was meant to be recorded electronically with SuperFlow’s
19
(C) Performance Trends Inc 2007
Port Flow Analyzer
Chapter 2 Definitions
FlowCom or Performance Trends’ Electronic Interface. In the Flow Bench Specs menu you can specify from 5 to 50 data points
to be recorded and averaged together for a CFM reading. During these readings, the program calculates some statistics on the
Tumble readings. It tries to be as accurate at estimating Tumble +/- % if only 5 readings are taken, but it should be obvious to
the user that the accuracy and repeatability of the Tumble +/- % readings improves as you ask for more readings to be taken.
Performance Trends recommends you always take at least 10 readings if you are recording Tumble +/- %.
Vel (Port Velocity) (Pro version only)
These columns are for entering port velocity measurements made with a Pitot (pronounced "pee-toe") tube. These columns are
displayed only if you have requested Port Velocity measurements in the Test Options menu. In addition, port velocity
measurements are only entered in 1 or 2 rows, rows with lifts specified in the Test Options screen. You must have entered one
of these lifts before you can enter port velocity data.
You can enter velocity data either as:
• Pressure in inches of water and have the program convert it to velocity in Ft/Sec. This is probably the most common
method if your Pitot tube is connected to a water manometer scaled, for example, from 0 to 30 inches. Note that the data
in the table stays in inches of water pressure and is only converted to Ft/Sec when a graph or report is made.
• Velocity in Ft/Sec directly.
Figure 2.12 File Menu
Command Options
2.1.5 Main Screen Commands
The next section discusses some of the commands available at the top of the Main Screen.
Most will not be discussed here in detail, as they are discussed in other sections of this
manual.
File (see Figure 2.12 for File Options)
New (start new test)
Click on File, then New to start a new test. This process will “walk you through” some critical steps to start with a blank Test
Data grid, or to keep certain data from the previous test. Keeping data can save you considerable time since you don’t have to
type in information which may be the same as the current test. The New Test command is discussed in full detail in Section 2.9.
Open (from all saved tests)
This option presents the Open Test File menu discussed in Section 3.6, Data Libraries. From there you have several options to
open a previously saved test file from any place in the Test Library, or from most any place on the computer, including the
floppy disk drive.
Open (from History Log)
(Pro version only)
This option presents the History Log, a chronological list of test files you have been working with as discussed in Section 3.8.
From there you can review a summary of the last 25 to 100 tests, and pick one to open. This method can make it easier to find a
file you have just worked with lately, say in the last couple of weeks.
20
(C) Performance Trends Inc 2007
Port Flow Analyzer
Chapter 2 Definitions
Save
Select Save if you want to save the current test and any recent changes to the same name as you are currently working with.
This is the file name shown in square bracket [ ] at the top of the Main Screen.
Save As
Select Save As if you want to save the current test and any recent changes to a new name or new folder. You will be presented
with the menu discussed in Section 3.6 where you can change the test name, change the folder you are saving it to, or add a new
folder name.
Open from Floppy Drive
This command provides a simple 1 click command to open a standard Windows “File Open” menu displaying the contents of
the disk in the Floppy Drive. This provides a convenient method for copying files from one computer to another.
Save to Floppy Drive
This command provides a simple 1 click command to save the current test file to the disk in the Floppy Drive to the same name
as is currently being used. This provides a convenient method for copying files from one computer to another.
Edit (copy/swap/erase ports) (Pro version only)
Figure 2.13 Menu to Edit Ports
This command will display the menu shown in Figure 2.13. This menu lets you
modify Flow Data for an entire port. This can be useful should you find you
have mistakenly recorded data for the wrong port, for filling in a new blank port
with data from a previously tested port, or completely erasing a port. The
process consists of:
• First select the type of 'Edit Action' you want to do.
• Then select which port or ports you want to perform the action on.
• Then select which data (Intake, Exhaust or Intake + Exhaust) you want to
edit.
• Then Click on the 'Do Edit' button to perform the edit.
Swapping and Copying are also handy if you want to make a 'stand alone' test of
a particular port. Say you were doing several modifications to a particular port.
Each modification you simply called a different Cylinder by setting the 'Number
of Cylinders to Test' spec in the Head Specs menu to the # of modifications. For
example, Cyl #1 could be 'Baseline', Cyl #2 could be '3 angle valve job', etc. Say
that the 5th modification was one you wanted to do more analysis on. You could
first Save all your modifications as a Test File, like 'ALL-MODS' for future
reference.
Then you could 'swap' Cyl #5 with Cyl #1, so Cylinder #5's data (the 5th modification) is in Cylinder #1's location. In Head
Specs you could then set 'Number of Cylinders to Test' to just 1, which effectively erases all cylinders higher than the first.
Now you could Save THIS file under a new name, like 'BEST-MOD'. This 'BEST-MOD' file of just 1 cylinder can now be
combined with Engine Specs for analysis, graphed with other Test Files, etc., just as if the entire head was like the 1 cylinder,
the 5th or best modification.
21
(C) Performance Trends Inc 2007
Port Flow Analyzer
Chapter 2 Definitions
Print Main Screen
Print Blank Worksheet
Windows Printer Setup
The Print Main Screen and Print Blank Worksheet commands simply give you instructions how to do each. These commands
were placed under File as many users will look under File to find these print options. The Windows Printer Setup lets you
change your Windows default printer, paper orientation, etc for printing reports or graphs in other areas of the program.
Unlock Program Options
The Port Flow Analyzer is equipped with copy protection. This ensures that legitimate users do not have to cover the costs for
unauthorized distribution of the program. When you first receive the program, it is in demo mode. In demo mode you can try
either the Basic version, or the full Professional version for ten days. All features are working in demo mode.
Sometime during those 10 days, you must call Performance Trends to obtain an “Unlocking Code”. This Unlocking Code will
be for either the Basic version or the Pro Version, whichever you have purchased.
Before you call Performance Trends, you should get your registered code number and computer hardware number. These are
available by clicking on File in the upper left hand
Figure 2.14 Menu to Unlock Program Options
corner of the Main Screen, then clicking on Unlocking
Program Options. A screen will appear as shown in
Figure 2.14.
Performance Trends will provide you with an unlocking
code number. Type in the unlocking number and click
on OK. If you typed in a number correctly you will be
given a message that the program is permanently
unlocked to either the Basic or Pro mode. The program
will only run on this one computer.
If you want to run the program on another computer, you
must install it, obtain the computer hardware number and registered code number as shown in Figure 2.14, and call Performance
Trends for a new Unlocking Code for that computer. There may be a charge for additional computers.
Graph
The Graph command lets you graph several different types of data from the current test, either by itself or with data from other
tests for comparisons. The Graph options are discussed in detail is Section 3.4, page 85.
Report
The Report command lets you create reports of several different types of data from the current test, either by itself or with data
from other tests (Pro version only) for comparisons. The Report options are discussed in detail is Section 3.1, page 65.
Test Options
The Test Options command opens up the Test Options menu. There you tell the program what data you want to record (swirl,
port velocity, barometer, etc) and other details about the test (like test pressure, bore adapter diameter, etc.). Test Options are
discussed in detail in Section 2.3, page 29.
22
(C) Performance Trends Inc 2007
Port Flow Analyzer
Chapter 2 Definitions
Head
The Head command opens up the Head Specs menu. There you can describe the head you are testing, like valve size, port
volume, etc. In the Pro version, you can also open up the Head Details menu. There you can record over 60 other specs about
the head, like valve/spring/locks/retainers details, material type, chamber CCs, etc. Head Specs are discussed in detail in Section
2.4, page 33.
Flow Bench
The Flow Bench command opens up the Flow Bench Specs menu, where you can describe the Flow Bench you are using.
The specs in the Flow Bench menu are critical for accurate results. Be sure
to read and understand the Flow Bench Specs as discussed in detail in
Section 2.6, page 41.
Engine (Pro version only)
In the Pro version, the Engine command opens up the Engine Specs menu. There you can briefly describe engine specs to
combine with your head flow data for more detailed analysis. Engine Specs are discussed in detail in Section 2.7, page 45.
Preferences
Preferences let you customize the program for your needs and for your computer and printer. See Section 2.2, page 25.
Help
Click on Help for several options to help describe your options at the Main Screen, and for other information to help you
understand how this program works.
23
(C) Performance Trends Inc 2007
24
Port Flow Analyzer
Chapter 2 Definitions
(C) Performance Trends Inc 2007
Port Flow Analyzer
Chapter 2 Definitions
2.2 Preferences
Figure 2.15 a Preferences Menu
Click on the Preferences
item in the menu bar at the
top of the Main Screen to
bring up the Preferences
menu shown in Figure
2.15 a. Here you can
adjust some program items
to personalize the program
for your needs.
Preferences may also save
time by eliminating steps
you don't require.
Program Title
Comments
Enter most any text here
for the First and Second
lines. These 2 lines will
appear at the top of
printouts and printed
graphs. This is a good
place for your business
name or your personal name. You can change these entries as often as you wish.
Standard Engine Analyzer Examples (Pro version only)
These specs let you have access to the same Libraries of simple Cam example specs that come with our standard Engine
Analyzer program, v3.0 or later. If you choose 'My Engine Analyzer' as the Engine Analyzer to use, you must provide the Path
location to your Engine Analyzer. Otherwise, the Port Flow Analyzer uses the library of standard Engine Analyzer examples
provided with the Port Flow Analyzer. The major advantage to using examples from your standard Engine Analyzer is you can
load specs from additional examples you have added and saved.
Use Alternate Location for Files (Pro version only)
Some users (typically those on a network) may need to store their data files in a location other that in the PFA30 folder (the
folder containg the actual Port Flow Analyzer program). For example, you may want to put the files on the E drive so other
computers can access them. If so, choose Yes and then the spec Path to Files will be enabled.
In most all situations (except for network users) it is STRONGLY recommended you keep this marked No.
It is also STRONGLY recommended that if you do choose Yes, that you do NOT keep changing this back and
forth from No to Yes. This will produce possible errors when saving or opening files. This will be due mostly
to saving them in one location and then looking for them in another location.
25
(C) Performance Trends Inc 2007
Port Flow Analyzer
Path to Files (Pro version only)
Chapter 2 Definitions
Figure 2.15 b Alternate Path in Windows
Explorer
If you set the previously described Use Alternate Location for Files
spec to Yes, this spec becomes enabled. Enter the full path to the
new location for the Port Flow Analyzer data files. For example, if
you want to store the files on the E drive, enter the path:
E:\PFAFILES
Either before you make this change in the Preferences menu, or
immediately after that change, you must copy all Port Flow
Analyzer data folders (directories) and data files to the new
location. These folders include:
Test Library (the PFADAT folder and all subfolders)
Head Library (HEAD and XHEAD folders)
Engine Library (ENGINE and XENGINE folders)
Assuming you used the path E:\PFAFILES, you must copy the
ENGINE, HEAD, PFADAT, XHEAD, XENGINE folders (and
their contents, the data files) to the PFAFILES folder on the E
drive. See Figure 2.15 b.
Create the new
folder for the
data files.
Then copy all
the folders
using Windows
copy
commands to
this new
location.
You must copy all 5 folders listed above and their contents (files) to the new location to avoid errors.
It is also STRONGLY recommended that you do NOT keep changing the path. Once you set it, do NOT
change it. Constantly changing it will produce possible errors when saving or opening files. This will be due
mostly to saving them in one location and then looking for them in another location.
If this process seems complicated or you are not familiar with Windows copy commands or folders, DO NOT
use this option. Keep the spec Use Alternate Location for Data Files set to No.
Default Floppy Disk Drive
Choose the letter of the floppy disk drive on your computer, usually A . This is the disk drive which will be first opened when
using the Save to Floppy Disk or Open from Floppy Disk File commands at the Main Screen.
Main Screen, Other Cyl. Graphs
Choose Yes to graph all cylinders for the data entered on the Main Screen. This provides an instant review that all data is
consistent from point-to-point and cylinder-to-cylinder. Choose No to only graph the data from the current cylinder you are
working with. The only real advantage of choosing No is to save time refreshing the Main Screen on slower computers.
26
(C) Performance Trends Inc 2007
Port Flow Analyzer
Chapter 2 Definitions
When Changing Head Specs Port Length (Pro version only)
In the Head Specs menu, entries are possible for Port CCs, average Port Diameter and Port Length. As one spec is changed,
another is updated to make the 3 specs consistent. Your choice here tells the program which spec, CCs or Diameter, to change
when Port Length is changed.
Test Pres. for History Mx CFM (Pro version only)
The program keeps track of the maximum intake and exhaust CFM for each test. This Max CFM is shown in the History Log,
test Preview when Opening Test Files, and can be searched for in the Filter options. Your choice here determines to what Test
Pressure to correct this CFM to for reporting. For example, a SuperFlow 110 user may prefer 10" where a SuperFlow 600 user
may prefer 25" or 28".
Show Std EA Exmp Comparison (Pro version only)
Choose Yes and the current specs are shown with the new Example cam specs side by side if you are picking Example cam
specs from the Std Engine Analyzer library. This comparison can be useful in preventing mistakes, but some users may want to
eliminate this extra step.
Printer Fonts
Choose which basic type of font to use for printouts. You may not get your choice if your printer does not support that
particular font.
Enter Cam File Directly (Pro version only)
Choose Yes if you want to be able to type in a Cam File path and file name directly (recommended for advanced users only). If
1 character is wrong in the path, you will get error messages. At the time printing, this option was not activated in this version
yet.
# Tests Kept in History Log (Pro version only)
Pick the number of tests which you want the History Log to hold, from 25 to 100.
Printed Graph Width, % of Page (Pro version only)
Due to the endless combinations of computers, Windows setups and printers, some printed graphs may not fill the page, some
may extend off the page. This option lets you expand (% greater than 100) or shrink (% less than 100) the printed graph to
better fit the page.
Main Screen Graph Lines (Pro version only)
This option lets you choose the line thickness of the summary graph of CFM vs valve lift for all the ports on the Main Screen.
27
(C) Performance Trends Inc 2007
Port Flow Analyzer
Chapter 2 Definitions
SF Cal. Test Pres. Corr.
SuperFlow 300, 600, 1200 and 1020 benches have an additional, minor correction factor if you flow heads at a different test
pressure than what the bench was actually calibrated for at the factory. The FlowCom does not include this correction factor.
Select 'Do Correction' if you want your data corrected for this effect (should be more accurate). Select 'None (match FlowCom)'
if you want the program to match your FlowCom CFM calculations.
Graph Dot Matrix Printer Adjustment
Choose Yes if you are getting breaks in the border around printed graphs (usually happens with dot matrix printers).
Test Folder Name in Program
The Port Flow Analyzer saves tests under different folders (directories) under the main folder PFADAT. Some users may prefer
to have the 'Folder' be called 'EngFamily' or 'Customer', depending how they choose to organize their tests. Your entry here of
most any text up to 9 characters is what the program will use to call the different folders where test files are stored.
Note: In the DOS version 2.1, these folders were called “customers”. If you want to match the wording used in the DOS
version 2.1, change this word to Customer.
Use Seat Angle to Calc Vlv Area (Pro version only)
Select Yes and the Vlv Area in the reports and graphs is calculated based on valve outside diameter, stem diameter, valve seat
angle and valve throat diameter. This is a more detailed and accurate way to calculate true geometric valve opening area. Select
No and the Vlv Area in the reports and graphs is calculated based on valve outside diameter only. This method is like the
method used in Performance Trends’ Engine Analyzer programs. Vlv Area is also used to calculate Valve Vel and Flow Coef,
and therefore also affects these results. See Figures 3.6, 3.7 and 3.8 in Section 3.1 for more information.
See Appendix 7 & 9 for several new Preferences added in version 3.5 & 3.5B.
28
(C) Performance Trends Inc 2007
Port Flow Analyzer
Chapter 2 Definitions
2.3 Test Options
The Test Options determine what data is recorded for a flow test and what test equipment was used which can effect CFM flow.
Test Pressure,
"water
Figure 2.16 Test Options Menu
Click on File, then Print or Windows Printer Setup to print this screen.
Enter the desired test pressure
for flowing all ports. This is
the pressure you will try to set
on the vertical manometer.
Typical numbers are 10, 25
and 28 "water. Note that you
can convert to other pressures
in graphs and reports later.
Exhaust Test
Pressure, "water
Enter the desired test pressure
for flowing all exhaust ports.
This is the pressure you will
try to set on the vertical
manometer. Typical numbers
are 10, 25 and 28 "water. Note
that you can convert to other
pressures in graphs and reports
later. Most head porters use the same pressure here as picked for the Intake Test Pressure.
Number of Rows of Data
Enter the total number of data points you think you will record for the test, usually the number of valve lift settings. (Tip: Enter
a number 3 to 5 higher than you think you will need so you can easily add points if you want. There is no problem with having
extra blank rows.)
Bore Adapter Diameter, in
Enter the diameter of the Bore adapter used for the Flow Test, in inches. The diameter of the Bore Adapter you use can
significantly affect CFM flow, and potentially stability, swirl and tumble.
Intake Adapter
Enter a description of the intake adapter, something like None, Radiused Inlet #2, Clay, Dual Plane + Holley 350, etc, or click
on the Down Arrow button to pick a standard choice. If you are using Port Flow Analyzer CFM data in our Engine Analyzer
programs for head data (not manifold data), it is recommended you use a radiused inlet adapter or clay.
29
(C) Performance Trends Inc 2007
Port Flow Analyzer
Chapter 2 Definitions
Exhaust Adapter
Enter a description of the exhaust adapter, something like None, 6" Stub Stack, 1 5/8" header, etc, or click on the Down Arrow
button to pick a standard choice. If you are using Port Flow Analyzer CFM data in our Engine Analyzer programs for head data
(not exhaust manifold or header data), it is recommended you use a short section of pipe, 6-12 inches long.
CFM Flow
Click on down arrow button to set the method for entering or measuring CFM flow. This choice together with the Type of Flow
Bench specified in the Flow Bench Specs has a large impact on what columns are displayed on the Test Data grid. The option
of Entering CFM Directly provides an easy way to create reports and graphs for tests run on other types of flow benches.
Temperature (Pro version only)
Click on down arrow button if you want to record air temperature, even if it is not required for CFM calculations. This will add
a Temp column to the Test Data grid.
Barometer (Pro version only)
Click on down arrow button if you want to record actual (not corrected like a TV weather report) Barometric Pressure, even if it
is not required for CFM calculations. This will add a Baro column to the Test Data grid.
Humidity (Pro version only)
Click on down arrow button if you want to record humidity, even if it is not required for CFM calculations. This will add a Dew
Point or Reltv Hum% column to the Test Data grid.
Swirl (Pro version only)
Click on down arrow button if you want to record Swirl. This will add a 1 or 2 columns to the Test Data grid.
Tumble (Pro version only)
Click on down arrow button if you want to record Tumble. This will add 1 or 2 columns to the Test Data grid, depending of the
Tumble Settings entered. (This may expand to include the Tumble Settings in future versions.)
Tumble Settings, From - To (Pro version only)
Enter the starting number for the first tumble setting. For example, if you are recording 4 tumble readings from 0 to 270 degrees
of rotation (0, 90, 180 and 270), enter 0 for the 'From' setting. For the To setting, set the final degrees of rotation. In the
example of 0, 90, 180, 270 this would be 270. At the time of printing this manual, these options were not yet activated.
30
(C) Performance Trends Inc 2007
Port Flow Analyzer
Chapter 2 Definitions
Type
Click on down arrow button to set the method for determining valve lift setting for the flow test. Note that most people use
valve lift in inches, not L/D.
Step Size
Enter the difference between subsequent lifts. The units will be in either Inches or L/D depending on the Type chosen above. If
you want to record flow at every tenth of an inch, choose a Type of Inches and enter a Step Size of .1 .
Max Setting
Enter the highest valve Lift in inches or L/D you want recorded. The units will be in either Inches or L/D depending on the
Type chosen above.
Include a Zero Lift (.000) Point ?
Click on down arrow button to select to include a zero (0) lift point in the data set. Including 0 can be a convenient way to
measure and record Leakage at each port.
Type
Click on down arrow button to set the method for measuring Port Velocities. This will add several columns to the Test Data
grid.
Data
Click on down arrow button to select the type of velocity data and related data you are entering. If you select ''Water, then these
pressure readings are recorded and will be converted to velocity in Ft/Sec when graphed or reported.
First Lift to Record Velocity
If you chose a Type above to record port velocities, you can enter the first or lowest valve lift in Inches at which to allow port
velocities to be recorded. At the time of printing this manual, you could not specify this Lift as an L/D.
Second Lift to Record Velocity
If you chose a Type above to record port velocities at 2 valve lifts, you can enter the second valve lift in Inches at which to allow
port velocities to be recorded. At the time of printing this manual, you could not specify this Lift as an L/D.
See Appendix 7 & 9 for several new features added in version 3.5 & 3.5B.
31
(C) Performance Trends Inc 2007
32
Port Flow Analyzer
Chapter 2 Definitions
(C) Performance Trends Inc 2007
Port Flow Analyzer
Chapter 2 Definitions
2.4 Cylinder Head(s)
The cylinder Head Specs describe the port geometry and cylinder numbering. In the Basic version, many of the specs shown in
Figure 2.17a are not available to keep the program easier to operate.
Figure 2.17a Cylinder Head(s) Menu
Intake Port Specs:
# Valves/Ports
Identifies if there are 1, 2 or 3
intake valves per cylinder and
how many ports there are for
this number of intake valves. If
2 or 3 valves are specified, both
valves are assumed to be equal
size and opened exactly the
same. If 2 or 3 ports are
specified, the program also
assumes all these ports are the
same volume and length. If you
have 2 or 3 valves per cylinder,
and the ports from these valves
siamese (run into each other) in
the head, specify the number of
ports as 1.
Click on File, then:
• New to blank out this menu.
• Open Example to pick an example head provided with the
program.
• Save to save these head specs to a name of your
choosing.
• Print or Windows Printer Setup to print this screen.
Name of current set of Head Specs (SB-FORD). You give
the specs a name when you save them (Pro version only).
Details opens up a new menu for storing more head info.
Head Comments (different than Test Comments)
lets you describe the head itself (Pro version only).
Valve Diameter, in
Identifies the outside (largest)
diameter of the head of the
intake valve(s) in inches.
Stem Diameter, in
(Pro version only)
The diameter of the stem of the
intake valve(s) present in the
port in inches.
Seat Inside Diameter, in (Pro version only)
The smallest diameter of the port in the valve seat area. Usually this is the inside diameter of the valve seat. This spec is used to
more accurately calculate the true valve opening area. This area is used to calculate and report VlvArea and FlowCoef if Use
Seat Angle to Calc Vlv Area is set to Yes in the Preferences menu. See Section 3.1 and Example 4.3.
33
(C) Performance Trends Inc 2007
Port Flow Analyzer
Chapter 2 Definitions
Seat Angle, deg (Pro version only)
The overall angle of the valve seat. For most valves (even multi-angle valve jobs) this is 45 degrees. For multi-angle valve jobs,
enter the angle for the middle angle. Some race valves have 30 degree seats which improve low lift flow. This spec is used to
more accurately calculate the true valve opening area. This area is used to calculate and report VlvArea and FlowCoef if Use
Seat Angle to Calc Vlv Area is set to Yes in the Preferences menu. See Section 3.1 and Example 4.3.
Port Shape (Pro version only)
The setting of this specs determines if the Port Dimensions in this menu are either Diameter or Width & Height. This spec is
also used to draw the port when Pitot tube port velocity readings are being recorded or graphed.
Avg Port Diameter, in (Pro version only)
Identifies the average inside diameter of the intake port(s) over their entire length in the cylinder head. Usually this can be
measured at the end of the port which mates to the intake manifold. A more precise way is to calculate the diameter by
measuring the port volume and port length. If you know port CCs, enter it in the spec below, first making sure the Port Length
is accurate. If you set the number of ports to 2 or 3, this is the diameter of only 1 of these ports. These ports are assumed to be
the same length and diameter.
As you enter Port Diameter (or Port Width and Port Height), or Port CCs, or Port Length, the other related
specs are instantly updated to keep all values consistent with each other. The spec “When Changing Head
Specs Port Length” in the Preferences menu lets you have some control over what specs get changed and
which specs stay constant when changes are made.
Avg Port Width, in (Pro version only)
Avg Port Height, in (Pro version only)
If you have set the Port Shape as Rectangular (not circular), these specs are displayed instead of the single specs of Avg Port
Diameter.
Port Volume, CCs (Pro version only)
Is the volume of the intake port in CCs (cubic centimeters). This value can be input directly (then the Avg Port Diameter
changes to match this volume and the Port Length spec). Also, if you enter or change the Avg Port Diameter, this value will be
calculated based on that diameter and the current Port Length spec. If you set the number of ports to 2 or 3, this is the Volume
of only 1 of these ports. These ports are assumed to be the same length and Volume.
Port Length, in (Pro version only)
Is the length of the intake port (down the center of the port) from the intake valve to the end of the head port (the start of the
intake manifold runner). For many common heads, 4.5"-6" is a typical length. If you change Port Length, either the Port
Volume or the Port Diameter (or Width and Height) are updated so these dimensions are all consistent. The Preferences menu’s
spec When Changing Head Specs Port Length (Section 3.2) lets you select if you rather have the dimension specs or the volume
specs changed when Port Length is changed.
34
(C) Performance Trends Inc 2007
Port Flow Analyzer
Chapter 2 Definitions
Exhaust Port Specs:
The definitions of the Exhaust Port Specs are identical to those of the Intake Port Specs.
Cylinder Numbering
These specs are used for cylinder numbering of the cylinder head.
Number of Cylinders in Test
This identifies the number of cylinders on the head which will be tested. For example, a cylinder head on a V-6 would have
three cylinders per head, and an in-line 4 cylinder would have four cylinders per head. The Port Flow Analyzer v3.0 allows up
to eight cylinders per head. If you are only going to test 1 cylinder on a head with 4 cylinders, this spec would be set to 1, not 4.
Starting #
The first or lowest cylinder # for the head.
Step Size
The difference in cylinder numbers between adjacent cylinders on the same head. For example, for a Chevy V-8 with cylinder
numbering of 1, 3, 5, 7 this would be 2. For a Ford V-8 with cylinder numbering of 1, 2, 3, 4 this would be 1.
Tip: Often users may want to run several tests on a single port, with various stages of port modifications.
Rather than making several different test files, you can call each modification a separate cylinder. In the Test
Comments you can specify that, for example, Cylinder #1 is the Baseline, Cylinder #2 is with a 3 angle valve
job, etc.
Menu Commands
The menu bar at the top provides for several command options, some which are fairly self explanatory:
• Back (ok) returns you to the Main Screen.
• File opens up several typical Windows options, many only available in the Pro version. In the Pro version, you can open
and save these Head specs as separate files. This allows you to easily change these specs to match a different head with
only a couple of clicks. See Section 3.6, Data Libraries.
• New will blank out all the Head Specs, Head Comments; and the Head File name will be called “Untitled”.
• Open Example Head File will open a typical Port Flow Analyzer “File Open” menu, where you can pick a set of
example Head Specs loaded by Performance Trends.
• Open Saved Head File will open a typical Port Flow Analyzer “File Open” menu, where you can pick a set of Head
Specs which you have saved, using the Save command in this menu.
35
(C) Performance Trends Inc 2007
Port Flow Analyzer
Chapter 2 Definitions
•
•
•
Save Head File will open a typical Port Flow Analyzer “File Save” menu, where you can save the current set of Head
Specs and Head Comments under a name of your choosing. This name then appears at the top of the Head Specs
menu. This name should not be confused with the Test File Name which appears at the top of the Main Screen. The
Test File includes all the Head Specs and Flow Data, and therefore includes the Head Name.
• Print lets you print this screen.
• Windows Printer Setup lets you change printer selection, paper orientation, etc.
Head Details (Pro version only) brings up a new menu for you to enter many more detailed head specs. See Section 2.5.
Help brings up a series of help screens on the Head Specs menu.
Figure 2.17 b Head # Menu
Head # (Pro version only)
Head #s can be critical for shops flowing many heads a year. The program
keeps track of #s so you don't assign duplicates or skip #s. Consistency of Head
# pattern also makes it easy to find heads in the Test Library. If you click on
the Head # spec, the menu of Figure 2.17 b is displayed. This menu lets you
pick a new head # 3 different ways.
1.
2.
3.
You can start a new Head # format if you select Yes for Enter a New
Number Format. For example, say you currently are using 'Johnson0012'
as a Head # for 1 customer Johnson. Now you have a new customer Smith
and you want to start with #s like 'Smith0000'.
You can simple use the last Head # used, incremented up by 1 you select
No for Enter a New Number Format.
Select No for Enter a New Number Format, then select some other Head #
(not the latest Head #) from the Numbers list, and a new Head # will be
created from it. This new # will be, either the exact # you picked (typical if
you are flowing a head which you have already flowed), or incremented up
by 1 if you request it (typical if you are working with a new head but with
the same Head # format). This is a list of the last 100 Head #s you have
assigned.
For Advanced Users: To delete or change #s in this list, use Wordpad or
Notepad and edit the 'Headnum.pti' file in the PFA30 folder, but keep a backup
in case you make a mistake.
Customer (Pro version only)
Click on the down arrow of Customer to be presented with a list of customers you have previously used. You can pick one of
these customers, or type in a new one. New ones are saved by the program and added to the list.
For Advanced Users: To delete or change customer names in this list, use Wordpad or Notepad and edit the 'Customer.pti' file
in the PFA30 folder, but keep a backup in case you make a mistake.
Comments (Pro version only)
Type in comments to help describe these cylinder head specs, and the head details if you want. These comments are saved with
the Test File, with the Head File if you save the Head File, and can be printed out with the Head Specs when reports are printed.
36
(C) Performance Trends Inc 2007
Port Flow Analyzer
Chapter 2 Definitions
2.5 Cyl. Head Details (Pro version only)
The cylinder Head Details have no effect on any calculations or analysis. They are only saved for information to help describe
this head and associated parts. You may want to fill in some, all or none of these specs. You can print out these details with
reports and you can search (Filter) test files for specific Head Details. For example, you can filter test files for all tests which
had Valve Spring Open Pressure (a Head Detail) greater than 400 pounds. See Section 3.7 on Filtering tests.
Valve Description
Figure 2.18 Head Details Menu
Enter a part # and/or
description of the valve, 30
characters max.
Valve Length, in
Length of the valve in
inches
Installed Height,
in
Height of the valve stem
above the valve guide once
the valve and springs are
installed, or some other
reference point that you
use, in inches.
Lock Groove, in
Distance down from the valve tip to the top of the first lock groove, in inches.
Valve Weight, gms
The weight of 1 valve, in grams.
Stem to Guide, in
The clearance between the valve stem and the valve guide, in inches.
Face Width, in
The width of the valve face, in inches.
37
(C) Performance Trends Inc 2007
Port Flow Analyzer
Margin Width, in
Chapter 2 Definitions
Side View of Valve
The width of the valve margin, in inches.
Margin
Spring Description
Enter a part # and/or description of the valve spring, 30 characters max.
Note: For the specs Spring Description, Seated Pressure, Installed Height, Free Height, Spring Rate, Max
Valve Lift and Pres at Mx V Lft, if you change one of these specs, it is likely that one or more of these
other specs may be updated to keep all these specs consistent.
Seated Pressure, lbs
The force exerted by the valve spring when compressed to its installed height, in pounds.
Installed Height, in
The height of the spring once installed in the head with the retainer and locks, with the valve closed on the seat, in inches.
Coil Bind Height, in
The height of the spring compressed so there is no space between coils, in inches. Note that this spec is compared to the Max
Valve Lift and Installed Height specs. If coil bind is occuring, the Pres at Mx V Lft is calculated and displayed as 99999,
indicating a problem.
Free Height, in
The height of the spring with no weight or load on it, in inches.
Spring Rate, lb/in
The rate of the spring in pounds per inch (lb/in). This will be calculated from the specs above, or if you enter the spring rate
here, the Seated Pressure will be calculated.
Weight, gms
The weight of the spring(s), in grams.
Max Valve Lift, in
The maximum lift the anticipated cam and rocker arm ratio will lift the valve, in inches. This will be calculated from the Spring
Rate if you enter Pres at Mx V Lft below.
38
(C) Performance Trends Inc 2007
Port Flow Analyzer
Chapter 2 Definitions
Pres at Mx V Lft, lbs
The force in pounds (lbs) of the valve spring at the Max Valve Lift entered above. This will be calculated from the Spring Rate
if you enter Max Valve Lift above.
If coil bind is detected based on the other input specs, this value is reported as 99999, indicating a problem. The only way to
change this from 99999 is by changing the specs which affect coil bind: Coil Bind Height, Installed Height and Max Valve Lift.
Seat Width, in
The width of the valve seat, in inches.
Top Cutter #
Enter a part # and/or description (angle, width, etc) of the valve seat cutter for the top of the valve seat, 30 characters max.
Seat Cutter #
Enter a part # and/or description (angle, width, etc) of the valve seat cutter for the main part of the valve seat, 30 characters max.
Bottom Cutter #
Enter a part # and/or description (angle, width, etc) of the valve seat cutter for the bottom of the valve seat, 30 characters max.
Locks
Enter a part # and/or description of the valve locks or keepers, 30 characters max.
Retainers
Enter a part # and/or description of the valve retainer, 30 characters max.
Spring Cups/Locators
Enter a part # and/or description of the valve spring cups or locators, 30 characters max.
Valve Seals
Enter a part # and/or description of the valve seals, 30 characters max.
39
(C) Performance Trends Inc 2007
Port Flow Analyzer
Chapter 2 Definitions
Chamber CCs
Enter the CCs of the combustion chamber in cubic centimeters, CCs.
Ht
Enter the height of the minimum cross-sectional area of the intake port. Area will be calculated based on Port Shape specified in
Head Specs. This spec could be Dia if the Port Shape is Round.
Wd
Enter the width of the minimum cross-sectional area of the intake port. Area will be calculated based on Port Shape specified in
Head Specs. This spec will not be shown if the Port Shape is Round.
Area
Enter the minimum cross-sectional area in sq inches of the intake port. Wd and Ht will be calculated based on proportions of the
Port Ht & Wd in Head Specs.
Material
Click on the down arrow button to choose between Cast Iron, Aluminum and Other for the material of the head.
40
(C) Performance Trends Inc 2007
Port Flow Analyzer
Chapter 2 Definitions
2.6 Flow Bench Specs
The Flow Bench Specs describe the flow bench you are using, and any required specs concerning the electronics which my be
recording the data. Flow Bench Specs are critical to accurate data. Therefore, be sure these specs are correct for each test.
Master Bench Specs
A critical concept for Flow Bench Specs is the idea of the Master Bench Specs. When you run a flow test, you are using a
particular flow bench, with certain Flow Bench Specs.
When you save the flow test, the program saves a copy of Figure 2.19 Typical Note on Master Bench Specs
the Flow Bench Specs with the test. Lets call this test
“Test110” and assume it was run with a SuperFlow 110
flow bench.
Lets say several months later that you buy a new SF 600
type of bench. (Or you could have changed any Flow
Bench spec: different bench, different electronics,
different calibrations, etc.) Your current bench specs do
not match the specs for “Test110”. If you open
“Test110”, the program installs the SuperFlow 110 bench
specs which you used when you ran the test. This lets
you accurately calculate CFM and
other data just as you did when you Figure 2.20 Illustration of Master Bench Specs
first ran the test.
A Test File contains the raw flow data and other
specs to calculate CFM and analyze results.
If you go into the Flow Bench
Specs menu, you will likely get a
message shown in Figure 2.19,
saying that the Bench Specs for
Test110 do not match your Master
Bench Specs, the specs for your
current SF 600 bench. You may
ask ”What are Master Bench
Specs?”
The program keeps track of any
changes to Flow Bench Specs,
asking you if these changes should
only apply to the Flow Bench
Specs for a particular flow test, or
if these changes represent your
actual flow bench, the Master Flow
Bench specs. Whenever, you start
a new test, either based on a
previous test or starting completely
blank, the Master Flow Bench
Specs are used. Whenever you
open an old test file, the bench
specs used for that particular test
are used.
Test File “Test110”
Flow Data:
Lift
Range Flow ...
Pres
.100
2
10.03” ...
.200
3
9.99
...
Head Specs:
# Int Valves = 1
Int Valve Dia = 2.02 ...
Flow Bench Specs:
Bench Type = SF110
Electronics = PTI Elc Int ...
The program keeps
separate records of your
Master Bench Specs, the
specs describing the bench
you are currently using.
These Master Bench Specs
are used whenever you
start a New Test.
Master Flow Bench Specs:
Bench Type = SF600
Electronics = PTI Elc Int ...
Etc
Note that the Flow Bench Specs for a particular test may not match
the bench you are currently using, the Master Bench Specs
41
(C) Performance Trends Inc 2007
Port Flow Analyzer
Chapter 2 Definitions
Figure 2.21 Flow Bench Specs Menu
General Bench
Specs
Type
Click on File, then:
• Save as My Master Bench Specs
• Open Master Bench Specs
• Load Typical Flow Ranges (for SF 300 or SF 600 benches)
• Print or Windows Printer Setup to print this screen.
Click on the down arrow button
to select the type of flow bench
you are using. You choice here
will affect which specs are
enabled or disabled in this menu.
Use Temperature
Correction
Click on the down arrow button
to select whether the CFM flow
readings must be corrected for
the temperature difference
between the cylinder head and
the measurement orifices. For
custom 'Blower Center' type
benches like a SF 110, choose
Yes. (For standard SuperFlow
benches, this spec is disabled and
set to the appropriate setting for
that particular bench.)
Rated Test Pressure,
"water
Note how several inputs in this menu, especially for
standare SuperFlow benches can be disabled (printed in
gray and they can not be changed). Many of these inputs
are enabled (printed in black and allowed to be changed)
only for Custom benches.
Enter the test pressure at which
the measurement flow orifices
have been calibrated for. For
Click here to bring up the Calibration Window for Electronics,
example, for an SF 600 this
discussed in Appendix 5.
would be 25", for an SF 1020
this would be 50”. (For standard
SuperFlow benches, this spec is disabled and set to the appropriate setting for that particular bench.)
Inclined Flow Manometer
Full Scale Reading
The highest reading # on the inclined manometer. Usually this is 100%, but could be something different if the manometer is
custom or calibrated in "water. (For standard SuperFlow benches, this spec is disabled and set to the appropriate setting for that
particular bench.)
42
(C) Performance Trends Inc 2007
Port Flow Analyzer
Chapter 2 Definitions
Full Scale Pressure, "water
The actual pressure in inches of water at the Full Scale Reading entered above. (For standard SuperFlow benches, this spec is
disabled and set to the appropriate setting for that particular bench.)
Linear Scale (like a ruler)
Click on the down arrow button to select the type of scale used to mark the inclined manometer. Select Yes if the scale is linear
like a standard ruler. Select No if the scale is non linear like a SuperFlow % Flow manometer. (For standard SuperFlow
benches, this spec is disabled and set to the appropriate setting for that particular bench.)
Electronics
Type
Click on the down arrow button to select the type of electronics you are using to record flow bench readings. You choice here
will affect which specs are enabled or disabled in this section.
Com Port
Click on the down arrow button to select computer's COM (serial) port # you are using to 'talk' to the electronics. It is most
reliable for you to click on the Find button to the right of this entry to have the program automatically check all possible COM
ports to find your type of electronics. If it can not be found, you may want to go into the Electronics or FlowCom screen, click
on Help, then Troubleshoot and try some of the Troubleshoot options. You can also check the Frequently Asked Questions
(FAQ) section of our website under “Support” for the latest info on finding a working COM port on your computer.
Also check Appendix 7 & 9 for additional new features added in version 3.5 & 3.5B.
# Readings to Average
Enter the number of readings you want to be averaged together for a CFM, Swirl and/or Tumble reading. If you enter a lower
number the test will be completed faster. A larger number (10 or higher) usually produces more repeatable results, especially if
you are recording Test Stability, Swirl +/-% and Tumble +/-%.
Other Data
Click on the down arrow button to select the type of other data which can be read through the electronics. Click on 'See Details'
button to calibrate these sensors (and the flow sensors for non-SuperFlow FlowCom electronics) to the program. See Appendix
5 for more details.
See Details (calibrations) Button
This button becomes enabled if you have selected the Performance Trends EI for the Type of Electronics, or selected something
other than None for Other Data. See Appendix 5 for more details.
43
(C) Performance Trends Inc 2007
Port Flow Analyzer
Chapter 2 Definitions
Last Updated
Time/Date
The time and date when these Flow Bench Specs were last modified. An old date is not necessarily a bad thing. It just means
you have been using the same bench for a long time, usually a good thing.
Flow Ranges
Range #1-7
Enter the Full Scale flow for Ranges 1 through 7, intake and exhaust. This is the CFM Flow when the inclined flow manometer
is at its highest reading, usually 100% Flow. For many types of SuperFlow flow benches, these specs are preloaded by the
program and are disabled for you to change. For SuperFlow 300, 600 or 1200, or custom benches, you just enter the CFM
values which came with your bench from the factory.
44
(C) Performance Trends Inc 2007
Port Flow Analyzer
Chapter 2 Definitions
2.7 Engine Specs (Pro version only)
The Engine specs describe the
engine's size, compression ratio,
cam and valve train. These
specs are combined with flow
data to do more detailed analysis
of a head and its performance
potential.
Figure 2.22, Engine Specs Menu
Cam and valve train
specifications are critical to
engine performance; therefore
reliable information is
necessary. It is recommended
that you use specifications given
by the cam grinder or engine
manufacturer. Actual
measurements of cam and valve
train specifications can be done,
however this can be tricky and
therefore is recommended to
have someone experienced
perform them. Guides for
making these measurements are
also available from cam grinders
and manufacturers of valve train
components and are beyond the
scope of this User's Manual.
Figure 2.23 Port Flow Analyzer Cam Profile Definitions
Typical Exhaust Lobe
Important: The Engine Specs
menu’s Cam specs update as you
change other cam specs. For
example, if you change a
centerline, the Total Cam
Advance number changes to
reflect the new centerline.
Max Lobe Lift
Lobe Separation
is Cam Degrees
from this Lobe
Centerline to
Intake Centerline
Base Circle
Lobe Centerline
Opening
Events
* Lash at Tappet
Closing
Events
.050” Tappet Lift
.040” Tappet Lift
Intake
Centerline, deg ATDC
Is the location of the maximum lift point on the
cam profile. If you are using the program’s
Adv. Dur.
Dur. at .040”
Dur. at .050”
* Lash at Tappet is Lash at Valve divided by Rocker Arm Ratio. Lash at Tappet is
shown only to illustrate lash in general. Lash at Tappet is not used in program or
engine builders because it is difficult to measure.
45
(C) Performance Trends Inc 2007
Port Flow Analyzer
Chapter 2 Definitions
standard cam profiles, this is also exactly half way between the open and closing point because the program assumes the same
opening and closing profile (a symetric lobe).
Duration @ xxx
Is the number of crank degrees where the tappet is lifted to the tappet lift specified as the Lift for Rating Events in the General
Cam Specs section above base circle.
Opening @ xxx
Identifies crankshaft degrees before top dead center where the tappet has been lifted to the Lift for Rating Events above base
circle Base Circle on the opening ramp. (Lift for Rating Events is specified in the General Cam Specs section.) This value is
generally available on your "cam card" or in cam catalogs. If this event occurs after top dead center, enter a negative value. For
example, if it is reported as 4 degrees after top dead center, enter -4.
Closing @ xxx
Identifies crankshaft degrees before top dead center where the tappet has been lowered to the Lift for Rating Events above base
circle Base Circle on the closing ramp. (Lift for Rating Events is specified in the General Cam Specs section.) This value is
generally available on your "cam card" or in cam catalogs. It is highly unlikely, but if this event occurs before bottom dead
center, enter a negative value. For example, if it is reported as 4 degrees before bottom dead center, enter -4.
Max Lobe Lift, in
Identifies how high the cam lobe lifts the tappet above Base Circle in inches. If you are given "gross valve lift" by the cam
grinder, divide by the rocker arm ratio assumed by the cam grinder to obtain gross or maximum tappet lift. This can also be
done by clicking on the Clc button to open up a Calculation Menu. See Section 2.8.2.
Actual Lash @ Valve, in
Identifies the lash or clearance in inches between the valve tip and its actuator, generally the rocker arm. If you have specified a
hydraulic Lifter (profile) Type, this spec is disabled.
Notes: This spec works with the Designed Valve Lash spec. If you specify an Actual Valve Lash nearly the same as the
Designed Valve Lash, the valve will be opened as the cam profile was designed. If you specify a smaller Actual Valve Lash
than the Designed Valve Lash, the valve will be opened longer and higher than what the cam was designed for. And vice versa,
if you specify a larger Actual Valve
Figure 2.24, Valve Train Designs & Estimated Rocker Arm Ratios
Lash than the Designed Valve Lash,
the valve will be opened less time
and less lift than what the cam was
designed for.
Rocker Arm Ratio
Identifies the ratio between tappet
lift and valve lift. Generally rocker
arm ratios vary between 1.3 to 2.0.
For valve trains with no rocker
arms, for example overhead cam
46
(C) Performance Trends Inc 2007
Port Flow Analyzer
Chapter 2 Definitions
systems with directing acting tappets, enter 1. See Figure 2.24. The Port Flow Analyzer assumes the ratio is constant although
actual rocker arm ratios vary slightly with valve lift.
Gross Intake Valve Lift, in
Is the maximum lift of the valve with NO valve lash (even if it is a mechanical cam with valve lash). Mathematically it is Max
Lobe Lift multiplied by rocker arm ratio. This is the standard way most cam grinders rate their cams for valve lift, sometimes
called Advertised Lift. This number is calculated from other specs in this menu and can not be entered directly.
Note: If you are not using (specifying in the program) the same Rocker Arm Ratios as what the cam
grinder is assuming, this number will not match the cam grinder’s catalog or advertised lift.
Use Cam File
Click on the down arrow to pick Yes or No. In this version of the program, No is the only option. Future versions will allow
you to read in Cam Files describing the cam profile, degree by degree.
Exhaust
Centerline, deg ATDC
Duration @ .050”
Max Lobe Lift, in
Actual Lash @ Valve, in
Rocker Arm Ratio
Gross Valve Lift
Use Cam File
Definitions for these specs are the same as for the Intake cam described previously.
General Cam Specs
Type
This combo box lets you describe the source of the specs used in this menu:
• You can select the Use Specs in this Menu and enter in most any combination of Cam or Valve Train specs.
• You can pick the Pick an Example option to be presented with a list of Example Cam Specs See Picking Example Cam
Specs at the end of this section. It will then display the name of the Example Cam specs you have picked
The Type you choose has a large effect on how this menu looks. If you choose Use Specs Below, all specs will be printed in
black, and you can change them to most any number you want. If you have chosen an example, the specs which relate directly
to the example will be displayed in blue.
Should you choose to change any of these blue specs, a notice is given that changing any spec related to the example will
change the Type from the example name to the general name of Use Specs Below. The example name is a handy reminder of
what the specs in this menu represent, so you may not want to change any of these blue spec settings.
47
(C) Performance Trends Inc 2007
Port Flow Analyzer
Chapter 2 Definitions
Lift for Rating Events
You can pick the lift from base circle at which cam events are rated from the following:
• .050" which was the method used by all our previous Port Flow Analyzers, and is the way used by most cam grinders
for American aftermarket and racing cams.
• .040" or 1 mm which is a common metric method used for motorcycles and foreign cams.
• Seat Timing which is commonly used for Advertised Duration by American cam grinders.
Be sure you are using the correct one, as this will create large errors in the results if you are not.
Total Cam Advance
This combo box lets you either pick an advance, retard or “straight up” cam timing by clicking on the arrow key, or you can type
in an advance or retard in degrees directly. If you just enter a number, a number with a + sign (ex. +4) or a number followed by
the letters “adv”, the program assumes it is number of degrees of cam advance. If you just enter a number with a - sign (ex. -4)
or a number followed by the letters “ret”, the program assumes it is number of degrees of cam retard.
Total cam advance is based on the current Intake and Exhaust Centerlines. If the centerlines are equal, Total Advance is set to 0
or straight up by the program. This is a major change from the previous DOS versions of Port Flow Analyzer where the spec
Additional Cam Advance was used. In those versions you could specify opening and closing events which would produce a
Total Cam Advance of say 4 degrees, but the Additional Cam Advance could be set to 0. This was confusing to users. This
new method of using Total Cam Advance should match cam specs used by most cam grinders.
To change cam timing from how it was ground by the cam grinder you will need special set of timing gears or an offset timing
pin, key or bushing. In general, advancing the cam will give more lower end torque while giving up some top end HP; and
retarding will give up low end torque to gain top end HP.
Designed Valve Lash, in
Is the valve lash the cam grinder recommends you use, or what the cam was ground for. If the cam grinder recommends a
different lash for the exhaust than the intake, use the intake lash. Also see Actual Lash @ Valve a couple pages back.
Lifter (profile) Type
This combo box lets you pick the type of lifter and the “steepness” or “aggressiveness” of the cam’s profiles. The combinations
consist of:
Hyd vs Solid
Flat vs Roller
Mild vs Agr
Invrtd
Hydraulic vs Solid lash adjustment
Aggressiveness or steepness of the profile (Roller being more aggressive)
Aggressiveness or steepness of the profile (Agr being more aggressive)
The most aggressive or steep profile (being more aggressive than Mild or Agr)
The choice of Hydraulic vs Solid is the most important as this dictates the use of a lash setting and whether hydraulic lifter pump
up is possible in the Engine Performance Estimate report. The other choices simply determine differences in the steepness of the
profile for the same Max Lobe Lift.. Most truly aggressive cams or roller cams have more Max Lobe Lift for a given duration,
and milder or hydraulic cams have less Max Lobe Lift.
48
(C) Performance Trends Inc 2007
Port Flow Analyzer
Chapter 2 Definitions
Lobe Separation, cam deg
Is the separation between the intake and exhaust centerlines in cam (not crankshaft) degrees, and is the standard method used by
most cam grinders. This number is calculated from other specs in this menu and can not be entered directly.
Engine Specs
Bore, inches
The diameter of the cylinder measured in inches.
Stroke, inches
The distance the piston travels from TDC (top dead center) to BDC (bottom dead center) measured in inches.
# Of Cylinders
Figure 2.25a Illustration of Rod Length, in
The number of cylinders for the engine.
For example, for a V-8 this number is 8,
for a single cylinder engine this number
would be 1.
Rod Length, in
The distance from the center of the wrist
pin bore to the center of the crank journal
bore measured in inches.
C.R. (compression ratio)
The engine's compression ratio based on cylinder clearance volume and total cylinder swept volume (sometimes called static
compression ratio). Do not use compression ratios which are corrected for cam timing, weather or supercharger boost.
Compression Ratio = Clearance Volume + Swept Volume
Clearance Volume
Clearance Volume and Swept Volume must be in the same units, both either CCs or cubic inches. Multiply CCs by
.061 to obtain cubic inches, multiply cubic inches by 16.39 to obtain CCs.
Since C. R. has a Clc button, see Section 2.8.1 for calculating Compression Ratio from clearance volume, piston dome volume,
deck height and gasket thickness.
49
(C) Performance Trends Inc 2007
Port Flow Analyzer
Chapter 2 Definitions
Picking Example Cam Specs
If you click on Type in the General Cam Specs, you can choose the Option of Pick Example Cam. If you do, you will be
presented with the screens shown in Figure 2.25 b.
Figure 2.25 b Picking Example Cam Specs
Click on Type in the General Cam Specs, then pick the Pick an
Example Cam option to be presented with this menu, a list of
catagories of cams.
Click on a Catagory to highlight it, then click on the Use Catagory
button to pick that catagory.
This screen shows the individual examples of cams that come
preloaded with the Port Flow Analyzer Pro version. Click on an
example cam to highlight it.
Once highlighted, click on the Pick
button to actually load in these example
cam specs. Depending on settings in
the Preferences menu, you may be
shown a comparison of these specs with
your current cam specs.
50
(C) Performance Trends Inc 2007
Port Flow Analyzer
Chapter 2 Definitions
2.8 Calculation Menus (Pro version only)
The following section explains the user input for engine specs listed with Clc buttons. These specs are ones where you can
simply enter a value, or click on the Clc button and the program will present a menu of inputs which will calculate that particular
parameter. These menus are like computer “scratch pads” for calculating specs like Compression Ratio and Max Tappet Lift
from other inputs.
Notes:
The starting values in each calculation menu are always blanked out. Once enough specs have been entered, the calculated
value(s) at the top of the menu will be displayed. This calculated value(s) will now be updated each time you change a spec. If
you want to use this calculated value,
Figure 2.26 Typical Calculation Menu
click on Use Calc Value. If the
calculated value is within expected
Click on Clc button to bring up Calculation Menu
limits, it will be loaded into the
original menu. If you click on Cancel,
you will be returned to the original
menu with the original value
unchanged. If you click on Help, you
will be given a general explanation of
calculation menus, and a page # in
this section for more info about the
particular menu you are using.
The input values or calculated values
in any calculation menu have NO
affect on calculated performance
unless you load the Calculated value
into the original menu. If you already
know a spec in the form required by
the program, then you have no need
to use the calculation menu. For
example, if you know the
Compression Ratio is 10.3, you have
no need to use a calculation menu to
calculate Compression Ratio based on
Gasket Thickness, Piston Dome CCs,
etc.
2.8.1 Calc Compression Ratio
Is the Compression Ratio calculated from the following specs and the current cylinder volume (based on the current Bore and
Stroke in the Engine menu). Compression Ratio is defined on page 49 under Engine specs. See page 51 for general notes on
Calculation Menus and for an example of their use.
The equation for Compression Ratio depends on the cylinder displacement. This displacement is based on the current Bore and
Stroke in the Engine menu and is displayed in the Notes section at the bottom of this menu. Make sure these specs match the
engine for which you are calculating Compression Ratio before using this menu.
51
(C) Performance Trends Inc 2007
Port Flow Analyzer
Chapter 2 Definitions
Chamber Specs
Chamber CCs in Head
Is the combustion chamber volume in the cylinder head, measured in cubic centimeters. This is the value obtained if the heads
are "cc'd".
If you know the entire clearance volume of the cylinder, but do not know Piston Dome CCs, Gasket Thickness or Deck Height
Clearance, enter that volume here as Chamber CCs in Head. Then enter 0 for Piston Dome CCs, Gasket Thickness and Deck
Height Clearance. The program will calculate compression ratio based on the equation below where Clearance Volume is the
Chamber CCs in Head.
Compression Ratio = Clearance Volume + Swept Volume
Clearance Volume
Piston Dome CCs
Is the volume of the "pop up" in the piston measured in cubic centimeters. The "pop up" is the volume of piston material added
to the top of a flat top piston. If the piston has a "dish" (depression), enter the dish volume as a negative (-) number.
Gasket Thickness, in
Is the thickness of the head gasket in inches after it has been "crushed". "Crushed" thickness is after the head bolts have been
torqued to spec.
Gasket Bore Diameter, in
Is the diameter of the bore in the head gasket. A good approximation is to use the same as the Bore in the Engine menu, and this
value is loaded in when you first open up this menu. You can change it to most any value you want. (In actual use, gasket bores
are usually .030-.100” larger than the cylinder bore.)
Deck Height Clearance, in
Deck Height Clearance is the distance in inches from the top of the piston to the top of the cylinder block when the piston is at
TDC. The top of the cylinder is the deck, or surface to which the head bolts. If the outer edge of the piston travels above the
deck, this is called negative deck height and you must enter a negative (-) number.
52
(C) Performance Trends Inc 2007
Port Flow Analyzer
2.8.2 Calc Max Lobe Lift
Chapter 2 Definitions
Figure 2.27 Calc Max Lobe Lift
Is the maximum lobe or tappet lift for the cam. Max Lobe Lift is
defined on page 46 in the Engine specs. See page 51 for general notes
on Calculation Menus and for an example of their use.
Advertised Valve Lift, in
The valve lift you see in the cam grinder’s ads, catalog or cam card in
inches, also called Gross Valve Lift.
Assumed Rocker Arm Ratio
The Rocker Arm Ratio assumed by the cam grinder for the particular
engine. This should be stated somewhere in the catalog or on the card.
Note that this assumed rocker arm ratio may be different than what you
are actually using on the engine. The Notes section displays typical
Assumed Rocker Arm Ratios for popular American V-8s.
53
(C) Performance Trends Inc 2007
54
Port Flow Analyzer
Chapter 2 Definitions
(C) Performance Trends Inc 2007
Port Flow Analyzer
Chapter 2 Definitions
2.9 New Test Menu:
The New Test command is available by clicking on File at the top, left of the Main Screen, then selecting New Test. You will
then be presented with the screen shown in Figure 2.28. Getting a new test started right is probably the most important step in
running a flow test. (Also see Example 4.1 and 4.2 for more details on the New Test menu.)
When starting a New Test, it is
usually best to first Open a
previous test which is similar to
the New Test you will be
running (similar head specs,
similar test lifts, similar data to
record, etc.) This previous test
will then be the 'pattern' or
'template' for the New Test and
will save you from having to
type in many specs to describe
this New Test. This also
ensures consistency between
your tests and reduces the
possibility of errors.
If the current test is not a good
'pattern' for this new test (or if
there currently is no test
displayed), you can abort
starting this new test by clicking
on 'Cancel (don't start new test)'
at the top of the New Test
screen. Then click on 'File' at
the top, left of the Main Screen
and select one of the 'Open'
options to open a past test to
serve as a pattern.
Figure 2.28 New Test Menu
4 Critical specs for the new test are listed here at the top.
Click here to start a New Test based on these settings.
A summary of the current settings is given here.
Click on these buttons to see the current settings.
See Figure 2.29 for an example of Keeping the Test Pattern.
If you must start with a blank
Click here to Check or Uncheck these options. Checking means you
test (which may be the case
want to keep these specs for the new test. Once the new test is started
when you first get this
you can then make modifications to these specs if you want.
program), or want to modify
some specs from the previous
test, click on the 'See Specs' buttons for each category of specs. Click on Help
at these menus for more info on how to enter these specs.
Figure 2.29 Test Pattern Data
When you close out these menus, you are brought back to the New Test screen.
Be sure to check the check box at the left for all specs you want to use for your
new test. All Categories not checked will be blanked out. Blank specs may
cause problems with more detailed analysis, and won't allow you to keep track
of important details about the head you are testing.
Most specs in these categories can be changed once the test has started with no
problems. This includes specs which simply describe the test and head and do
not affect any calculations or what is recorded, like Head Details, Test
Comments, etc.
Keeping the
Test Pattern
keeps Valve
Lifts, L/Ds and
Ranges from
Previous Test.
55
(C) Performance Trends Inc 2007
Port Flow Analyzer
Chapter 2 Definitions
However, specs which DO affect calculations like the Flow Bench Specs, most Test Options specs, Valve Diameters in Head
Specs (if L/Ds are being used) are critical to have correct for even the first data point.
Four other critical specs are listed separately at the top:
1. File Name for New Test is the file name the program will create for saving the Flow Data for the new test you are starting.
The program fills in a default name of the current test name, but incrementing the last digit in the name by 1. You can
change this name to most anything you like. The program will warn you if the name entered is not valid and show you what
is wrong.
2. Operator for New Test is the name of the operator for this test. Click on Pick to pick an operator name already used or to
enter a new name. The program defaults to the operator of the current test.
3. Head # for New Test is critical for shops who use a head numbering system. Click on Assign to create a new Head # based
on the last Head # assigned (incremented up by 1) or to start with a new type of Head #.
4. Folder Name for New Test is the folder in the PFADAT folder where the test will be saved. The program may not be using
the name 'folder' for this spec, but whatever word you have assigned in the Preferences menu at the Main Screen. The
folder name 'Examples' is reserved for Performance Trends example tests supplied with the program, and can NOT be used
for your tests.
When you are ready to start the new test, click on 'Start New Test' at the top of the screen. If some critical specs has not been
entered, the program will warn you and ask you for it at that time. The program will fill in the Test Time and Date based on the
computer's time and date. This can be changed later by clicking on the Test Time/Date at the Main Screen.
Tip: If you are making several small changes to a port, and are not starting with a new head, you might want to
simply call every new port modification a new 'Cylinder'. This is done by increasing the 'Number of Cylinders
to Test' in the Head Specs menu to as high as 8 if needed.
You can keep track of modifications in the Test Comments, like "Cyl 1 = Baseline, Cyl 2 = 3 angle valve job".
This will save considerable time not having to start new tests, and avoids filling the test library with possibly
meaningless tests.
However, there are limitations with this method in that you are limited in how you can report, graph or analyze a
single cylinder's data.
For modifications which you want to treat seperately, you can either:
• Use the Port Edit command (Pro version only) as discussed on page 21 to copy the port to the first
position (for example, Cylinder #1). Then change the ‘Number of Cylinders to Test’ in the Head Specs to
1. This effectively erases all other ports. Then save this single port to a new name.
• Or, perform a completely separate flow test.
See Appendix 7 for using the new, easy “EZ Start Wizard” feature added in
version 3.5.
56
(C) Performance Trends Inc 2007
Port Flow Analyzer
Chapter 2 Definitions
2.10 Test Correction Factor Menu
This screen lets you calculate a test correction for a SF 110 style of flow bench. The Test Correction can be entered 2 different
ways (chosen by 'Data Type').
1.
2.
You can enter a number directly, like '1.002'. The number 1.000 will give No correction (uses the Factory calibration).
You can install the standard orifice provided with your bench
Figure 2.30 Test Correction Menu
(where the head normally goes) and flow it. Then knowing what
the orifice is rated for (usually 153.2 CFM at 10") and what it
actually flowed, the program will calculate a new Test Correction.
The procedure for option 2 would be:
1. Open some recent test that you ran on this flow bench, from the
Test Library, or start a New Test (as in Example 4.2). This test will
be used as a scratch pad to calculate Corr CFM.
2. Install the Std Orifice plate with the 2 holes, one small and one
large.
3. Plug the large orifice and check that you are getting from 35 to 55
% Flow reading on the Range 1 (from 3.5 to 5.5 CFM flow on
SF110/120) assuming 0 leakage.
4. Open both the Std Orifices and flow them at 10" Test Pressure.
Record all the data to calculate CFM, including Range (usually the
highest range), Test Pres, Flow Pres, Test Temp and Flow Temp.
Valve Lift is not required. You can do this manually or with the
FlowCom and record the data in some blank row in the Flow Data
grid. Note the Corr CFM obtained.
5. Click on the Test Corr display at the Main Screen and bring up the
Test Correction menu (Figure 2.30).
6. Choose Calculate from CFM Flow as the Data Type. Then enter
the Corr CFM recorded and the Std Orifice Flow (usually 153.2
CFM). The program will display the new Test Corr. (Note that the
New Test Corr is based on the fact that the Measured CFM had the
Current Test Corr factored into it. Meas Flow WO Test Corr is
displayed also so you can more easily see how the Test Corr is
calculated.)
7. If the New Test Corr is close to the Current Test Corr (within 1%
or .01), it is recommended you do not use the new one, but keep the
old one.
See Example 4.2 for more details.
See Appendix 7 & 9 for several new features added in version 3.5 & 3.5B.
57
(C) Performance Trends Inc 2007
58
Port Flow Analyzer
Chapter 2 Definitions
(C) Performance Trends Inc 2007
Port Flow Analyzer
Chapter 2 Definitions
2.11 Recording Data Electronically with
SuperFlow FlowCom (tm) or
Performance Trends Black Box II:
This screen shows you the readings from the electronic recording device currently connected to your computer, either the
SuperFlow FlowCom (tm) or Performance Trends Black Box II . Either of these systems let you automatically record these
readings and load them in the Test Data grid. This feature saves considerable time, ensures consistency of readings and
improves accuracy. (Also see Example 4.2 for more details.)
Figure 2.31 Screen for Reading Electronics, SF FlowCom or Perf. Trends Black Box II
Menu
commands and
options are
explained later
in this section.
The layout and
data displayed
on this screen
depends on
your setup in
the Test
Options menu
for data you
want to record,
and Flow
Bench specs
for what data is
needed to
calculate CFM
and what
additional
sensors you
What data is displayed here and can be recorded is determined by settings in the Flow Bench and Test Options screens, and
somewhat by available space on the screen. Click on 'Flow Bench' and 'Test Options' at the top of the Main Screen to see these
options.
To avoid communications problems with the electronics, you can't type on the Test Data grid when this screen is open.
Therefore, you must use commands on this screen to select or change 'Data Points' (which row in the Test Data grid you are
recording for), Range, and Valve Lift. Also, you can only close this screen by clicking on 'Close' at the top left corner.
FlowCom is a computer itself, and can calculate and display CFM based on pressures, temperatures, leakage, range, etc. The
Port Flow Analyzer reads the pressures, temperatures, barometer (and optional swirl or tumble inputs), but not the FlowCom’s
calculated CFM. The Port Flow Analyzer program calculates its own CFM based on these raw measurements.
59
(C) Performance Trends Inc 2007
Port Flow Analyzer
Chapter 2 Definitions
If the Port Flow Analyzer's Leakage, Set (desired) Test Pressure, Flow Range and Flow Direction match the FlowCom's, both
will calculate and display the same CFM. If they are NOT the same, but the Port Flow Analyzer's Leakage, Set Test Pressure,
Flow Range and Flow Direction are correct, the CFM calculated by the Port Flow Analyzer is correct. (A note is displayed at
the bottom of the FlowCom screen if these specs don't match.)
This is important because it means you do not have to keep adjusting the FlowCom's leakage, range or test pressure to match the
flow bench. Just be sure the Port Flow Analyzer screen does match the settings on the flow bench and the Port Flow Analyzer's
CFM readings will be correct.
Note: Check the Preference spec SF Cal. Test Pres. Corr. on page 27 for a setting which may produce an additional small
difference between the Port Flow Analyzer’s calculated CFM and the FlowCom’s.
The Performance Trends Black Box II does not calculate CFM. Therefore, there are no concerns about the leakage, flow range
values, etc matching the Port Flow Analyzer program because the Black Box II does not store any of these values.
The most critical thing for accurate readings is to check that the manometers and dial thermometers on your
flow bench are matching the readings on this screen. If they do not, the electronics may need recalibration.
See Appendix 5.
When taking a reading, the Port Flow Analyzer takes several readings to average together to produce a good, repeatable reading.
This is shown in the upper left corner as the 'Set Test Pres' frame changes to 'Reading' x of xx and is displayed in blue. At the
same time, it watches the stability of Test Pressure (vertical manometer) and Swirl or Tumble if they are being recorded. The
number of readings to average is set in the Flow Bench Specs, from 5 to 50.
When done taking a reading, the data is written to the Test Data grid on the Main Screen and the Test Summary graph is
updated. The 'Data Point' indicator and corresponding highlighted bar for the current Row automatically advance by 1.
Therefore, try to start recording data at the top of the Test Data grid (Data Point 1) and let the Data Point indicator and current
row advance automatically down the grid as you record data.
If you have selected to record Port Velocity (selected in the Test Options) screen, a 'Port Velocity' option is available at the top
of the screen. Here you can select to Start or Stop recording Port Velocities.
You can click on the blue bar at the top of this screen and drag this screen to any location on your computer screen and the
program will keep it there.
Menu Commands
Close
Click this option to close this menu and return to the Main Screen.
Record (F1)
Click this option or press the <F1> key to start recording data.
60
(C) Performance Trends Inc 2007
Port Flow Analyzer
Chapter 2 Definitions
Port Velocity
Click this option to select either to start recording Port Velocity (somewhat rearranges this screen) or to stop recording Port
Velocity (returns the screen to recording CFM). This is only displayed when you have requested Port Velocities to be recorded
in the Test Options menu.
Options
Freeze
Freezes the current readings in this screen.
Continuous Update
“Un-freezes” the current readings in this screen and returns to continuous updating.
Re-Zero Pressure Readings
Electronics are prone to minor changes (or drift) over time or through temperature changes, etc. This is most obvious when you
have the flow bench turned off, but the updating pressure readings are not reading exactly 0.0. Rather than doing a complete
calibration of the system, you can simply re-zero the Performance Trends Electronic Interface by clicking on this option. The
program will tell you to turn Off the flow bench and wait for all pressures (manometers) to go to zero. Then click a button and
the program will reset the zero pressure reading on all 3 pressure sensors. (This command is not available with the SuperFlow
FlowCom.)
Note: Because the pressure transducers are so sensitive, the updating display will never read a constant 0 when the flow bench
is turned off. However, when they are correctly zeroed, you should see about the same amount of negative readings as positive
readings. (Note: The SuperFlow FlowCom is designed to never read negative #s, so this does not apply to it.)
Eliminate Re-Zero Correction
Click on this option if you want to eliminate any Re-Zeroing effect. The program will now convert voltage from the
Performance Trends Electronic Interface exactly as you calibrated it. (This command is not available with the SuperFlow
FlowCom.)
Display ...
These “Display” commands are of little value to the user. There are used primarily by Performance Trends technicians to
troubleshoot communications problems.
Help
Brings up “on screen” help.
61
(C) Performance Trends Inc 2007
Port Flow Analyzer
Chapter 2 Definitions
Definition of Data Types Recorded
Set Test Pres is the desired reading on the vertical manometer, the pressure drop across the valve and port. This is set in
the Test Options menu. When recording data, this changes to 'Reading' x of xx and is displayed in blue.
Act. Test Pres is the electronics’ current reading of the vertical manometer, the pressure drop across the valve and port.
Range is the Flow Bench range #. Click on the down arrow key to select from the current valid ranges for this flow bench
(set in the Flow Bench menu). For SuperFlow 1020 benches, this is displayed as the full CFM for the current range.
Data Point is the current row in the Test Data grid you are working with. This row will be highlighted in blue. Click on the
down arrow key to select the row to work with. The total number of rows is set in the Test Options menu.
Valve Lift is the current Valve Lift for the row you are working with. Type in a different valve lift to change it.
Flow Reading is the electronic’s current reading of the inclined manometer, the pressure drop across the flow measurement
orifices in the flow bench.
Test Temp (T1) is the air temperature by the head, the lower temperature location on SuperFlow 110 or 120 benches.
Flow Temp (T2) is the air temperature by the flow measurement orifices, the upper temperature location on SuperFlow 110
or 120 benches.
Barometer is the actual barometric pressure in Inches of Mercury and is available only with the FlowCom. The “corrected”
barometric pressure, as reported by radio or TV weather reports, will be higher due to elevation.
Corr. CFM Flow is the CFM calculated by the Port Flow Analyzer based on all its current settings. This should match the
FlowCom's CFM if all FlowCom and Port Flow Analyzer settings match.
Port Velocity for a FlowCom is the reading from the 3rd FlowCom pressure input, usually hooked to a Pitot tube for
measuring Port Velocity. The reading can be in Feet/Second or inches of water pressure depending on the 'Port Velocity Data'
setting in the Test Options menu. For the Performance Trends Electronic Interface, you must select inches of water pressure for
the 'Port Velocity Data' setting in the Test Options menu.
Swirl for a FlowCom is the reading from the J1 connection on the FlowCom, usually connected to a Swirl Meter or Tumble
Meter. This is only displayed if the 'Swirl' setting in the Test Options menu is set to one of the Record Swirl settings. For the
Performance Trends Electronic Interface, this is the signal entering the Auxiliary 0-5 volt jack, if so equipped.
Tumble for a Flow is the reading from the J1 connection on the FlowCom, usually connected to a Swirl Meter or Tumble
Meter. This is only displayed if the 'Tumble' setting in the Test Options menu is set to one of the Record Tumble settings. For
the Performance Trends Electronic Interface, this is the signal entering the Auxiliary 0-5 volt jack, if so equipped.
62
(C) Performance Trends Inc 2007
Port Flow Analyzer
Chapter 3 Output
Chapter 3 Output
The Port Flow Analyzer provides several ways to view and output the test results, including:
• Reports of tabular data displayed on the screen
• ASCII files for importing results to other software packages (Pro version only)
• High resolution graphs
• Printer output of reports or graphs
• History Log (Pro version only)
• Data Libraries for recording flow test data (or sets of head or engine specs in the Pro version) for later use.
All these topics will be covered in this chapter. Figure 3.1 shows how to reach all these various features.
See Appendix 7 & 9 for several new Report features added in version 3.5 & 3.5B.
Figure 3.1 Various Output Options from the Test Results Screen
Click on File to display several options to Save test files, Open test files which were previously
saved, display the History Log, or print information.
Click on Graph to display several Graph Options and produce a high resolution graph.
Click on Report to display several Report Options and produce a tabular report. Once a report
is displayed, it can be output as an ASCII file, or printed.
Open from Pro version’s
Name of current Test File
History Log displays a
chronological log of test
files you have recently
worked with (started
new, opened, made
graphs or reports of,
etc.) Section 3.8.
Saving options to Save
a test file are discussed
in Section 3.6.
Opening options to
open a previously
saved test file are
discussed in Section
3.6.
Although Print options
are limited on the Main
Screen, most menus
have a Print button to
print that menu, or a
File command which
lists Print options
under it. See Section
35
63
(C) Performance Trends Inc 2007
64
Port Flow Analyzer
Chapter 3 Output
(C) Performance Trends Inc 2007
Port Flow Analyzer
3.1 Reports
Chapter 3 Output
Figure 3.2 Report Options Menu
Click on the Report menu command at the Main Screen to be presented
with the Report Options Menu shown in Figure 3.2. The inputs in this
menu are described below.
Type
Several types of reports can be picked by clicking on the down arrow key
of this combo box. Depending on your choice, several options in this
menu may be enabled or disabled.
Correct to New Test Pressure
Pick Yes and the report data will be corrected to the test pressures
identified by the next one or two specs, New Int Test Pres, '' Water and
New Exh Test Pres, '' Water. Pick No and the data is corrected to the test pressure identified in the test's Test Options menu
under Test Pressure. (Note that in the Pro version, the Port Velocities, Swirl and Tumble are corrected in addition to CFM.
However, these corrections have not been well proven with years of experience as has the CFM correction.)
For several Report Types, like Engine Performance report, no correction is possible or required and this spec is disabled (printed
in gray and you are not allowed to change it).
New Int Test Pres, '' Water
The pressure the intake flow or velocity data is corrected to if the previous spec, Correct to New Test Pressure is set to Yes.
Note that if you flow a head at 10” and correct to say 28” you may get different results than if you had actually flowed the head
at 28”. This can be especially true of data other than CFM, like Swirl, Tumble, Stability, and Port Velocity readings.
New Exh Test Pres, '' Water
The pressure the exhaust flow or velocity data is corrected to if the previous spec, Correct to New Test Pressure is set to Yes.
Note that if you flow a head at 10” and correct to say 28” you may get different results than if you had actually flowed the head
at 28”. This can be especially true of data other than CFM, like Swirl, Tumble, Stability, and Port Velocity readings.
Which Cylinder(s)
Click on the down arrow key of this combo box. to pick from reporting on:
• All Cylinders tested
• Average of all cylinders tested
• Pick Individual Cylinders (new feature added in version 3.5. See Appendix 7)
• Individual cylinders, which can be picked by the order they were recorded.
If the test file was only for 1 cylinder, or for some reports which require average data like Engine Performance Estimate, this
spec will be disabled.
65
(C) Performance Trends Inc 2007
Port Flow Analyzer
Chapter 3 Output
Notes:
• If you pick Average, the average is based on all cylinders with data which is not 0. For example, for 3 cylinders, if
cylinder 1 is 20 CFM and cylinder 2 is 24 CFM and cylinder 3 is 0 CFM, the average is 22 CFM ((20+24)/2), not 14.7
CFM ((20+24+0)/3).
• If the cylinders are numbered 2, 4, 6 and 8 on the head, and you ask for the 4th cylinder, the report will be for cylinder
#8, not cylinder #4.
Report Types
Int & Exh Raw Flow Data
This report simply restates the raw data recorded on the Flow Test Data grid for each and every port. See Figure 3.3. If you
select this report all specs in the Reports menu are disabled.
Generally, raw data is only useful for finding errors in data which occurred during the flow test. For example, during analysis of
data, one data point looks "out of line" from the others. By examining the raw data, you may discover that a Test Temp of 15
was entered when it should have been 115.
You can now go into the Flow Test Data grid screen and change that particular point to 115. Use the Save command to save this
corrected data to the Flow Test Library . This ensures that if you open the file again, it will have the correct 115 value, not 15.
Now when you make reports or graphs, the Port Flow Analyzer will calculate all results based on the new, correct 115 Test
Temp.
See Section 2.1 describing the Main Screen Test Data grid for definitions of the items reported here.
Figure 3.3 Portion of Raw Int & Exh Data Report
Summary of
Critical specs for
this test and
head.
Click on Report
Types to bring
up the Reports
Option menu
again to
change a
report option.
Select either
Print option to
print this
report.
66
(C) Performance Trends Inc 2007
Port Flow Analyzer
Chapter 3 Output
Int & Exh Cyl-Cyl Comparisn
This report type compares the average CFM for each port on the head you tested with the average for the entire head. If the
same lift point is tested more than once on an individual cylinder, say 2 times, an *2 will be include with the CFM for that
cylinder. See Figure 3.4. (See Appendix 7 & 7 for several new features added in version 3.5 & 3.5B.)
Figure 3.4 Int & Exh Cyl-Cyl Comparisn Report
Column of Average Data
Columns for Individual Cylinders
Cylinder #3
had 2 CFM
readings at
.101” (.050
L/D) valve lift.
Note that
average is
reported and
data is listed
even if all
cylinders did
not contribute
to the average.
Int & Exh Calculated Data
This report contains very little data from the Flow Test Data grid. However, it does contain several calculated parameters which
will help to rate ports for their design and porting.
Port
This column identifies the port type (Int or Exh) and the cylinder # for each data point.
If the report is for an Average of all cylinders across the head, the number listed with “Int” or “Exh” is the number of points
averaged together on this head. Only ports with identical lift values are averaged together. For example, if all four intake ports
have a lift value of .400", the identifier would be “Int (4)”. If only one intake port has a lift value of .403", it would be identified
as “Int (1)”.
Note: During averaging, the program will warn that a port has a very low but not exactly 0.0 Corr CFM flow with a lift which is
greater than 0, or 0 lift and has significantly different than zero Corr CFM. To continue with averaging at this point, would cause
unusual data to be averaged in with the other cylinder's flow, giving unexpected average data. It is best to do a report or graph
of all cylinder's data before a report of Average data to check for this. (If a port has exactly 0.0 CFM or is blank, the program
assumes the port has not yet been tested and the data is not averaged with other data.)
67
(C) Performance Trends Inc 2007
Port Flow Analyzer
Figure 3.5 Portion of Int & Exh Calculated Data Report
Chapter 3 Output
Note that
Flow Coef
can be
greater than
1.0. This
report uses
Seat Angle
and Throat
Diameter to
calculate
Valve Area
(selectable
in the
Preferences
menu.).
Swirl only
recorded on
Intake side.
Lift
Valve Lift in inches.
L/D
The ratio of valve lift divided by valve diameter.
Corr CFM
Air flow in CFM corrected to the test pressure specified. If the spec Corrected to New Test Pres in the Report Options menu is
set to No, flow is corrected to the Intake or Exhaust Test Pressure set in the Test Option menu. If the spec Corrected to New
Test Pres is set to Yes, flow is corrected to the specs New Int Test Pressure and New Exh Test Pressure in the Report Options
menu.
Vlv Area
This is the geometric valve opening area in square inches.
There are 2 ways to calculate geometric valve area:
1. Simple method using the outside diameter of the
valve and valve lift, sometimes called the “curtain
area". This is the method usually used for port flow
analysis because it only requires valve diameter and
lift to be calculated. It is also used in the our
Engine Analyzer programs and the Basic version of
Port Flow Analyzer.
2. A more accurate way is to use the valve seat angle,
valve stem diameter and inside throat diameter to
calculate area. This area is smaller than the simple
"curtain area". See Figures 3.6, 3.7 and 3.8.
68
Figure 3.6 Side View of Valve & Seat Showing
Different Opening Areas
(C) Performance Trends Inc 2007
Port Flow Analyzer
Chapter 3 Output
Figure 3.7 Illustration of Using Seat Angle Area vs Standard Curtain Area to Calc. Valve Area
Figure 3.8 Graph of the 2 Valve Area Calculations vs Valve Lift, and 2 Different Seat Angles
69
(C) Performance Trends Inc 2007
Port Flow Analyzer
Chapter 3 Output
In the Pro version, you can select the method used to calculate Valve Area. This is selectable in the Preferences menu (Section
2.2) by the spec “Use Seat Angle to Calc Vlv Area”, either Yes or No. Since Valve Area is also used to calculate other outputs
like Valve Velocity, CFM/sq in and Flow Coef, this setting also affects these outputs.
CFM/sq in
Is the Corr CFM divided by the Vlv Area. This can give an idea of how efficiently the port is flowing for a valve of this size at
this lift. However, if a port is flowing 50 CFM/sq in at 10” test pressure, it will flow 84 CFM/sq in at 28”. See Flow Coef
below for a measure of flow efficiency which does not depend on test pressure. With the Pro version, also see Vlv Area to
understand the options for calculating Vlv Area, which will affect CFM/sq in.
FlwArea
This is the opening area of the valve in square inches “as far as the air is concerned”. For example, the geometric valve opening
area (Vlv Area) may be 2.5 square inches but due to poor design, the air restriction is more like a hole (FlwArea) of 1.5 square
inches.
This is really what you are measuring with a flow test. CFM only has meaning when you know what Test Pressure was used. A
head that flows 100 CFM at 10" flows 167 CFM at 28". However, the Port Flow Analyzer reports the FlwArea of 1.15 sq in for
either 10" or 28" of test pressure.
The difference between Vlv Area and FlwArea is a useful measure of how well a port is flowing for its size. Note that at low
lifts, it is possible for the FlwArea to actually be larger than Vlv Area. This is especially true if you have set Use Throat Dia to
Calc Vlv Area to Yes in the Preferences Menu. That is because that method calculates a smaller Vlv Area for the same valve
lift.
Flow Coef
The flow coefficient is simply the ratio of FlwArea to Vlv Area. For very well designed ports it will be close to 1.0 or higher at
low lifts and 0.7 to 0.8 at high lifts, especially if you set Use Seat Angle to Calc Vlv Area to Yes in the Preferences Menu.
The advantage of using Flow Coef is that it does not change significantly with different test pressures. A well designed
valve/port will have a flow coefficient of .8 for any valve size or pressure drop. Flow Coefs over 0.8 are highly unlikely at high
valve lift. Good valve designs will have Flow Coefs of .6 to .8 at max lift.
Generally, there are higher flow coefficients at low valve lifts because here the valve and seat are the only major restrictions. In
addition, the valve and valve seat with a multi-angle valve job closely resembles a free-flowing venturi shape. At higher lifts
and air flows, the valve seat and the entire port combine their restrictions, and the Flow Coef drops.
Flow Coef calculated with accurate port dimensions for Throat Area and Seat Angle is the best number to rate the design of a
port. You must also set Use Seat Angle to Calc Vlv Area to Yes in the Preferences menu. The best you can hope to achieve for
either case is listed in Table 3.1.
Table 3.1
Valve Lift
Low Lift (L/D less than .15)
Mid Lift (L/D from .15 to .25)
High Lift (L/D over .25)
70
Best Flow Coef with Use Seat
Angle to Calc Vlv Area = Yes
1.20
.95
1.00
Best Flow Coef with Use Seat
Angle to Calc Vlv Area = No
1.00
.80
.90
(C) Performance Trends Inc 2007
Port Flow Analyzer
Chapter 3 Output
Valve Vel
The valve velocity is the average air speed flowing through the valve opening in feet/sec. Like CFM, the Valve Vel will
increase with increasing test pressure. Therefore, only compare Valve Vel between heads with equal corrected test pressures.
Valve Vel can be used to compare valve air flow with port air flow. Generally, port design is most critical where air velocity is
high. Thus, at low lift where Valve Vel is high compared to Port Vel, valve and valve seat design is critical. Valve Vel can also
be used to compare Pitot Tube air velocity measurements. See Port Vel.
Port Vel
The port velocity is the average air speed flowing through a port area defined by the Avg Port Diameter (or Avg Port Height and
Width) entered in the Head Specs menu. The units are measured in feet/sec. Like Valve Vel, the Port Vel will change with
different corrected test pressures. See Valve Vel.
The Port Vel can be used to compare the inertia tuning potential of different port designs. Air at high velocity contains
significant inertia; the higher the velocity, the higher the inertia. This inertia can be used to pack more air into the cylinder after
the piston has passed BDC but before the intake valve has closed. The same principle applies for scavenging on the exhaust
side.
If two ports flow the same CFM for the same test pressure, the one with the higher Port Vel will generally produce more torque
(with proper length of runner for tuning). HP potential will depend on cam specs and the designed RPM range of the engine.
Swirl
The swirl reading you entered, usually in RPM. Performance Trends’ convention is a negative swirl means the swirl direction is
counter-clockwise when viewed from the top of the bore. This column is only displayed if you selected to record swirl in the
Test Options menu.
Important: Swirl is corrected for any difference in test pressure when swirl was recorded and the test
pressure for the report, the same as CFM. Although this correction is approximately correct, its accuracy
has not yet been proven over years of experience, like the CFM correction.
Tumble
The tumble reading you entered, usually in RPM. Performance Trends’
convention is a negative tumble means the tumble direction is opposite of the
direction the intake port would induce. See Figure 3.9. This column is only
displayed if you selected to record tumble in the Test Options menu.
Important: Tumble is corrected for any difference in test
pressure when swirl was recorded and the test pressure for
the report, the same as CFM. Although this correction is
approximately correct, its accuracy has not yet been proven
over years of experience, like the CFM correction.
.
Figure 3.9 Tumble Direction
Intake Port
+ Positive
Tumble
Direction
71
(C) Performance Trends Inc 2007
Port Flow Analyzer
Chapter 3 Output
% Exh/Int
This is the percent ratio of the exhaust flow to the intake flow at equal Inches lift or L/D depending on the Valve Lift Settings
(Inches or L/D) in the Test Options menu. For example:
Inches are being used for Valve Lift Settings
Int #3 = 121 CrCFM @ .2 inches
Exh #3 = 88 CrCFM @ .2 inches
Exh #3 % Exh/Int = 72.7 @ .2 inches
"Rules of thumb" state the exhaust should flow 75% of the intake flow for “non boosted” engines. For supercharged and nitrous
oxide engines, the desired percent increases to 85%.. The % Exh/Int Flow Area in the Eng Performance Estimate report gives a
better indication of this relationship because it also takes the cam profile into account.
Int & Exh Other Calc Data (Pro version only)
This report contains Lift, L/D and Corr CFM, and information recorded only with the Pro version and not found in other reports.
This data includes stability, swirl and swirl stability, and tumble and tumble stability.
Definitions for this data are found in the previous section describing the Int & Exh Calculated Data report, and the definitions
for test Stability, swirl stability and tumble stability described in Section 2.1. Note that test Stability, swirl stability and tumble
stability are not affected by any correction factor for test pressure. If test stability was 1.5% at 10” it is assumed to be 1.5% at
28”. This may not be the case in some situations. Many head porters say a port which is stable at 10” can be very unstable at
28”.
Figure 3.10 Portion of Int & Exh Other Calc Data Report
72
(C) Performance Trends Inc 2007
Port Flow Analyzer
Chapter 3 Output
Eng. Performance Estimate (Pro version only)
This report will display several calculated parameters describing how the current head's flow data would perform with a given
engine. They are based on the flow data for the current Flow Test file and specifications in the current Engine Specs file.
Figure 3.11 Engine Performance Estimate Report
Performance Potential At Est Tq Peak: 5300 RPM
The program estimates performance at 2 RPMs, the estimated torque and HP peak RPMs. For example, in the line above, the
program estimates the torque peak to occur at 5300 RPM.
The performance calculations are similar to our standard version Engine Analyzer program. However, since there are so few
inputs about the engine, the program must make many assumptions. In general, these assumptions assume race engine
conditions, like race intake manifold, headers, low friction from accessories, no nitrous oxide, no supercharger, etc. Therefore,
performance estimates will be "best case" for non-supercharged gas engines. Your actual performance will likely be less,
especially for more street orientated combinations.
73
(C) Performance Trends Inc 2007
Port Flow Analyzer
Chapter 3 Output
Torque, Ft Lbs
Horsepower
The brake torque and HP at the flywheel for these RPMs, corrected to 29.92 and 60 degrees of dry air.
Safety Precaution: Even though the engine may be able to flow air and make HP at high RPM, its connecting
rods, crank pins, pistons, etc may not be able to withstand the severe stress. The RPMs estimated for the torque
and HP peak are based mainly on air flow capabilities only, not stress limits or the possibility of parts breakage.
You must judge this limit based on your experience, parts manufacturer's advise and other sources.
Air Flow CFM
The estimated air flow through the engine for this RPM in standard CFM.
Volumetric Eff, %
The estimated volumetric efficiency for this RPM. Volumetric Efficiency is basically the percent of air which the engine flows
compared to how much it could under “perfect”, non-supercharged conditions. Naturally aspirated engines with good tuning
will achieve volumetric efficiencies well in excess of 100%. See Table 3.2 for typical values.
Table 3.2 Typical Values for Volumetric Efficiency, %
Engine Description
Volumetric Eff, %
Non-performance American design of the 70s
Modern production, American and foreign
"Muscle Car" era performance design, production
Full race design, naturally aspirated
50-70
70-85
75-85
100-130
Fuel Flow, lb/hr
Fuel Flow assuming gasoline in lb/hr. Multiply this value by .171 to obtain gallons per hour.
Piston Speed, Ft/Min
This is the calculated piston speed in feet per minute at this RPM. Piston speed is used as a comparison of engine speed
between engine's with different displacements. See Table 3.3.
Table 3.3 Piston Speeds for Various Types of Engines
Engine Type
Basic Street Automobile
Performance
Race
Piston Speed,
ft/min at Max HP
2500-3000
3000-4000
3500-6000
Engines of different displacements with equal quality and strength reciprocating parts can generally safely rev to the same
pistons speed, which may be very different RPMs. For example, for a small, short stroke engine, 3000 ft/min piston speed may
come at 7000 RPM. But on a large V-8 with a long stroke, 3000 ft/min may come at 5000 RPM. With equal quality and
strength parts, the small engine would not be stressing its rods, pistons, etc at 7000 RPM any more than the larger V-8 at 5000
RPM.
74
(C) Performance Trends Inc 2007
Port Flow Analyzer
Chapter 3 Output
Runners Used to Est Perf (may not be optimum, 1 int & 1 exh rnnr/cyl):
This section tells you the program's assumptions for typical runners for an engine with these heads and general engine specs.
Depending on the RPM you want to tune for, better performance may be obtained with different runner sizes.
If you set # Valves/Cyl to 2 or 3 in the Head Specs Port Layout spec, there are 2 or 3 of these runners per cylinder. If you want
to see the size of 1 runner which would feed the 2 valves or 3 valves and give approximately the same performance, multiply the
area by 2 and the diameter by 1.414 for 2 valves, and 3 and 1.73 for 3 valves. The length will not change.
Intake Runner Length, in
Is the length of the intake runner from the valve seat to the first abrupt opening or enlargement. This abrupt opening could be a
plenum or an opening to atmosphere. This is always assumed to be 10" in the Port Flow Analyzer.
Intake Runner Avg Area,sqin
Is the average cross sectional area of the intake runner over its entire length in square inches.
This area is taken from the Intake Port Spec Avg Port Dia (or Width and Height) in the Head Specs menu.
By changing this spec, you will likely see a significant effect on the engine performance estimate.
Intake Runner Avg Dia, in
Is the average diameter of the intake runner over its entire length in inches. See Intake Runner Avg Area,sq in above.
Exh Header Pri Len, in
Is the length of the exhaust runner from the valve seat to the first abrupt opening or enlargement. The program assumes headers
are used and this is the length from the valve seat to the collector. The program estimates length based on the anticipated RPM
range of the engine to give good tuning.
Exh Header O.D., in
Is the outside diameter of the header tubes to the nearest 1/8 inch for 18 gauge tubing (approximately .050" wall). The program
estimates O.D. based on the anticipated RPM range of the engine to give good tuning. The I.D. will be approximately .100”
smaller than this O.D.
Intake Port Volume in CCs (for 1 port, 4.5 inches long):
This section tells you the program's assumption for the port volume used to estimate performance, and suggests a port volume
for good velocity and tuning. Both volumes are in CCs or cubic centimeters.
For these volumes to be accurate, it is critical that the Port Length spec in the Head Specs menu be correct.
This length is reported here in the example line above as 4.5".
75
(C) Performance Trends Inc 2007
Port Flow Analyzer
Chapter 3 Output
If you set # Valves/Cyl to 2 or 3 in the Head Specs’ Port Layout spec, there are 2 or 3 of these ports per cylinder and the
volumes are for each of these ports. If you want to see the size of 1 port which would feed the 2 or 3 valves and give
approximately the same performance, multiply the volumes by 2 or 3.
Vol Used to Est Perf
Is the volume in CCs calculated from the Head specs of Avg Port Length and Avg Port Dia, in.
Suggested Port Volume
Is the volume in CCs the program would recommend for good tuning at the estimated HP peak, also assuming a 10" runner
length. If the actual engine would peak higher or your would use a longer intake runner, this volume would increase somewhat.
For a lower RPM or shorter runner this volume would decrease.
This recommendation is very general, and much is assumed about other engine specifications.
Figure 3.12, Definition of Lobe Area
Calculated Results:
Int Valve Lift, in
Exh Valve Lift, in
Int Duration @ .050''
Exh Duration @ .050''
Int Lobe Center
Exh Lobe Center
The calculations are simply restating the Calculated Specs from the Engine Specs menu, discussed in Section 2.7.
Int Lobe Area, Deg*In
Exh Lobe Area, Deg*In
Is the estimated area of the cam lift profile measured in tappet lift x cam degrees. See Figure 3.12.
This measurement is usually obtained with computerized cam checkers or when a cam is measured with Performance Trends’
Cam Analyzer. This spec lets you see how closely the Port Flow Analyzer's cam profile matches a measured cam profile. See
Figure 3.12.
76
(C) Performance Trends Inc 2007
Port Flow Analyzer
Chapter 3 Output
Figure 3.13, Illustration of Flow Area Calculation
Int Flow Area, Deg*SqIn
Exh Flow Area, Deg*SqIn
Is the valve opening flow area in units of degree-square inches. These units can be illustrated using the example below.
Example: If the Int Flow Area was 200, it could mean that:
• An effective valve flow area of 2 square inches was open for 100 degree of crank rotation. This would be a great
flowing head with a very short duration cam.
• An effective valve flow area of 1 square inches was open for 200 degree of crank rotation. This would be a typical
head with a typical cam.
• An effective valve flow area of .5 square inches was open for 400 degree of crank rotation. This would be a bad
flowing head with a very long duration cam.
• Or any other combination of Flow Area at a particular valve lift x the # degrees at that valve which gives 200.
This value represents the total effective flow area available for the intake and exhaust valves while they are open. It is
calculated from the estimated valve lift curve and the measured valve flow curve. See Figure 3.13.
The Flow Area is the most useful measurement for comparing port & cam combinations for air flow
capability. Generally: the higher the flow area, the higher the HP capability.
Lobe Separation
Lifter Type
Again, these "calculations" are simply restating specs from the Engine Specs menu, discussed in Section 2.7.
Ovlp Flow Area, DegSqIn
Is the same as the Int Flow Area and Exh Flow Area explained earlier, except it is calculating the size hole available for the
exhaust to leak into the intake runner. Cams with high overlap and heads with good low-lift flow increase this number.
77
(C) Performance Trends Inc 2007
Port Flow Analyzer
Chapter 3 Output
For race engines, overlap is generally needed for two reasons. First, it provides lower cam acceleration rates to attain the high
lifts required for high RPM HP. Second, overlap can also improve performance by allowing for efficient purging of residual
exhaust out of the clearance volume during overlap with proper intake and exhaust tuning.
However, at "untuned" RPMs, overlap can increase the potential for
intake reversion (reverse air flow up the intake runner from the
cylinder) and poor scavenging. High overlap area can also lead to
poor fuel economy through "short circuiting" (where intake charge
passes through the combustion chamber out the exhaust system
without being used).
Figure 3.14 Overlap Flow Area
Overlap Flow Area
Since turbocharged engines operate with high pressure and high
temperature exhaust, Ovlp Flow Area is best kept to a minimum for
turbocharged engines. This is both to reduce reversion (when high
pressure exhaust flows backward into the intake) and exhaust
temperatures (when "short circuited" fresh charge burns in the
exhaust). Generally, cams for supercharged engines are also ground
with less Ovlp Flow Area, for similar reasons as turbo cams.
The Ovlp Flow Area is given here to compare overlap areas between different cam profiles, lash settings, and cylinder head flow
curves.
Ovlp Lobe Area, Deg*In
Is similar to the Int or Exh Lobe Area, but is just measured during the overlap period. It is similar to the Ovlp Flow Area shown
in Figure 3.14, but the graph would be of the cam profile instead of Flow Area.
Est Cranking Comp. PSI
Is the estimated cranking compression pressure in pounds per square inch based on compression ratio, estimated intake cam
profile and lash. The calculation assumes some heat losses and cylinder leakage. Your actual cranking compression (100-200
RPM) will likely be less due primarily to leakage and heat losses. Higher RPM compression (1000 RPM or higher) would more
closely match this value. Est Cranking Comp is reported here simply to show trends.
Est Idle Vacuum, ''Hg
Is the estimated idle vacuum at 1500 RPM, with no load on the engine (no torque converter). The program assumes a constant
barometric pressure of 29.92, a low amount of accessory loads, good spark advance and good fuel distribution and mixing.
Actual engines will likely develop less vacuum, especially if over-carbureted for example. Use this calculation only for
predicting trends between different combinations.
% Exh/Int Flow Area
This is the percentage ratio of total exhaust flow area to intake flow area. It is calculated as:
Exh Flow Area, Deg*SqIn
% Exh/Int Flow Area =
Int Flow Area, Deg*SqIn
78
(C) Performance Trends Inc 2007
Port Flow Analyzer
Chapter 3 Output
"Rules of thumb" state that the exhaust port does not produce significant power losses until the exhaust flow potential falls
below 75% of the intake flow potential. For supercharged or nitrous oxide engines this percent should increase to
approximately 85%. This number is a more accurate determination of %Exh/Int than the %Exh/Int calculated in the Int & Exh
Calc Data report discussed several pages earlier in this section.
Engine Disp., cu in
Is the engine size (total swept volume) in cubic inches.
Engine Disp., liters
Is the engine size (total swept volume) in liters. To obtain displacement in CCs, multiply this displacement in liters by 1000.
For example a 1.23 liter engine is 1230 CCs.
Compression Ratio
Again, this "calculation" simply restates this spec from the Engine Specs menu, discussed in Section 2.7.
Clearance Volume, CCs
Is the total clearance volume (chamber volume in head, gasket volume, piston dome or dish, etc) for this engine displacement, #
of Cylinders and Compression Ratio.
Meas Int & Exh VelData (Pro version only)
This report displays all the port velocity readings (measured with a Pitot tube in the port) with averages. See Figure 3.15.
These readings are corrected for any difference between the test pressure during the test and the requested
test pressure for the report. However, the variation if port velocity across a port is likely to be different, say
if you measure at 10” and correct to 28” than if you actually measured port velocities at 28”.
The lifts you record port velocity at is determined by settings in the Test Options menu.
79
(C) Performance Trends Inc 2007
Port Flow Analyzer
Chapter 3 Output
Figure 3.15 Meas Int & Exh VelData Report
This is the
average of
all velocity
readings on
Intake #1 at
.300 lift (this
row).
These
bottom rows
are the
average of
all cylinders,
Int or Exh,
for the
particular lift.
These
numbers are
the average
of all
cylinders at
all positions,
Int or Exh, for
the particular
lift.
Compare Heads- CrCFM @ Lift (Pro version only)
The Port Flow Analyzer offers several report types to compare test results between 2 different heads. These comparisons can be
at relatively equal valve Lifts or L/Ds. The report title Compare Heads- CrCFM @ Lift will compare Corrected CFMs between
2 heads at approximately the same valve lifts.
The 2 tests or heads which are compared are:
1. The current head.
2. A head or flow test which you will be asked to pick from the Flow Test Library.
There are several "Compare Tests" report types available, some making comparisons at equal valve Lifts and some at equal L/D.
(Actually, the Lifts or L/Ds do not have to be exactly equal, but within 5% of each other.)
Only average data for a test is used for comparison. The data from both heads is corrected to the Test Pressure, '' Water spec in
the Make Reports menu. This ensures you are making comparisons at the same test pressure.
The report is made up of 2 basic sections:
1. The Flow Test Description and Heads Specs. This section lists the folder name, Test Name, date, time, and important head
specs for both tests.
2. The actual data with a difference calculation. This is the section with the actual comparison. The data for each head
consists of 3 columns:
80
(C) Performance Trends Inc 2007
Port Flow Analyzer
Chapter 3 Output
# Pnts
Is the number of data points which made up the average data. For example, if the test had 4 ports
flowed and each port had 1 reading at .300" lift, # Pnts would be 4.
Lift
L/D
Is the valve lift or L/D for the data points.
Avg xxx
Is the average data being reported (CrCFM, Vlv Area, etc). Definitions for possible data
comparisons is given in the Calculated Data report section on page 65.
--Difference-CFM,
Etc,
%
Is the difference between the 2 tests or heads. A negative number means the 2nd head had less
CFM, Vlv Area in SqIn, etc. A difference is only calculated when the Lift or L/D between the 2
heads is within 5% of each other.
Is the difference between the 2 tests or heads in percent. A negative number means the 2nd head
had less CFM, Vlv Area in SqIn, etc.
Figure 3.16 Portion of Compare Heads- CrCFM @ Lift Report
Note that the
2 heads
being
compared do
not need to
have the
same valve
lifts or the
same # of lift
points. In
this example,
one head
was tested at
even Lift
increments
and the other
at even L/D
increments.
See Appendix 7 & 9 for several new Report features added in version 3.5 &
3.5 B.
81
(C) Performance Trends Inc 2007
82
Port Flow Analyzer
Chapter 3 Output
(C) Performance Trends Inc 2007
Port Flow Analyzer
Chapter 3 Output
3.2 ASCII Data Files (Pro version only)
Figure 3.17 ASCII Files Options Menu
You may want to use the results from the
Port Flow Analyzer in other software
packages. This could be for additional
graph capabilities, statistical analysis, data
basing, etc. Once you have created a
report (as shown in Section 3.1), click on
File to write the results to an ASCII file
with a name of your choosing. The ASCII
File command is possible any time a report
is displayed on the screen.
Click on File from Report Screen for ASCII File menu
You can only save the results currently
displayed on the Report screen. If you
want to write an ASCII file of a test file
you have previously run, you must open
that test file first, then create a report for
that test file.
ASCII File Options
Comma Separated
Select this option to insert commas
between data points. Leave this unchecked
for data to be arranged in evenly spaced columns.
Include Text
Select this option to strip out all titles and letters, leaving only numbers.
Convert to Columns
If you do not select this option, data will be written to the file much like it is displayed in the report on the screen. Select this
option to have the report turned on its side, that is, the rows will become columns and the columns will become rows.
File Name
Enter a file name for saving this ASCII file. Checks are made to ensure what you enter is a valid file name and that you are not
overwriting an existing file. By default, the file is written to the Port Flow Analyzer folder (directory), the folder which contains
the PFA.EXE program file. However, version 3.5 lets you enter the entire path to write this to most any folder or drive on your
computer.
83
(C) Performance Trends Inc 2007
•
•
Port Flow Analyzer
Chapter 3 Output
There are certain limitations for file names, like they can not contain certain characters like / \ “ : *. The program will
warn you if you use an illegal character.
The name should not be VERY long (like over 40 characters) or the program may shorten it for you.
See Section 3.6 for more details on file names
See Appendix 7 & 9 for several new Report features added in version 3.5 &
3.5 B.
84
(C) Performance Trends Inc 2007
Port Flow Analyzer
Chapter 3 Output
3.4 Graphs
Graphs are obtained by clicking on the Graph menu command at the top of the Main Screen or clicking on the Summary Graph
at the Main Screen. Figure 3.18 shows a typical graph and descriptions of some of the basic graph screen items.
Appendix 9 describes the greatly expanded Graph features in the new Head Porter version.
Figure 3.18 Primary Graph Screen Items
Command buttons. Some commands can only be done through these buttons, some of these
buttons just provide a graphical button for performing action of some menu items.
Menu bar provides for several graph commands and options.
Graph Title, which can be changed by clicking on Format, then Edit Titles/Legend (Pro version).
Name of current Test File containing all flow data and specs
Graph Legend, which
describes the data
graphed. This includes
Name of the Test Results
file, Type of Data, which
data goes with which file,
if any multiplier is applied
to the data. You can
also click on Data Type
names and the
corresponding data line
will flash. This is useful
to find a particular line
when several are
graphed. In the Pro
version, names in the
Legend can be changed
by clicking on Format,
then Edit Titles/Legend.
Horizontal X axis. The scaling of this axis can be easily changed as
described in this section.
Grid lines. The style or elimination of grid lines can be changed by clicking on
Format, then Grid Style (Pro version only).
Data graph lines. The style and thickness of these lines can be changed by clicking on
Format, then Line Style.
Vertical Y axis. The scaling of this axis can be easily changed as described in this section.
85
(C) Performance Trends Inc 2007
Port Flow Analyzer
There are 3 basic types of test data which can be graphed:
• Flow Data like CFM, Swirl, Instability, etc. vs valve lift or L/D.
• Engine Data like Valve Lift, Valve Flow Area, etc. vs crank degrees
(Pro Version Only).
• Port Velocity Maps of port velocity data measured with a Pitot Tube
(Pro Version Only).
Chapter 3 Output
Figure 3.19 Graph Options Menu
You determine which type of data you graph by the Graph Type in the Graph
Options menu. See Figure 3.19.
Graph Type
Several types of graphs can be picked by clicking on the down arrow key of this
combo box. Depending on your choice, several options in this menu may be
enabled or disabled. Table 3.4 lists these various Graph Types.
Table 3.4 Data Types
Corr Int & Exh CFM
Corr Exh CFM
Calc Exh Velocities
Int Swirl Stab
Int Tumble Stab
Int Flow Coef
% Exh/Int
Exh Stability
Int & Exh Flow+Valve Area
Exh Flow + Valve Area
Int Flow Area + Valve Lift
Overlap Flow + Valve Area
Meas Int Vel (port map)
Corr Int CFM
Calc Int Velocities
Intake Swirl
Intake Tumble
Int & Exh Flow Coef
Exh Flow Coef
Int Stability
Int & Exh Stability
Int Flow + Valve Area
Int & Exh Flow Area+VlvLift
Exh Flow Area + Valve Lift
Overlap Flow + Valve Lift
Meas Exh Vel (port map)
Correct to New Test Pressure
Pick Yes and the graph data will be corrected to the test pressures identified by the next one or two specs, New Int Test Pres, ''
Water and New Exh Test Pres, '' Water. Pick No and the data is corrected to the test pressure identified in the test's Test Options
menu under Test Pressure.
For several Graph Types, like Flow Area, or Flow Coef, no correction is possible or required and this spec is disabled (printed in
gray and you are not allowed to change it).
New Int Test Pres, '' Water
The pressure the intake flow or velocity data is corrected to if the previous spec, Correct to New Test Pressure is set to Yes.
Note that if you flow a head at 10” and correct to say 28” you may get different results than if you had actually flowed the head
at 28”. This can be especially true of data other than CFM, like Swirl, Tumble, Stability, and Port Velocity readings.
86
(C) Performance Trends Inc 2007
Port Flow Analyzer
Chapter 3 Output
New Exh Test Pres, '' Water
The pressure the exhaust flow or velocity data is corrected to if the previous spec, Correct to New Test Pressure is set to Yes.
Note that if you flow a head at 10” and correct to say 28” you may get different results than if you had actually flowed the head
at 28”. This can be especially true of data other than CFM, like Swirl, Tumble, Stability, and Port Velocity readings.
Which Cylinder(s)
Click on the down arrow key of this combo box. to pick from Graphing:
• All Cylinders tested
• Average of all cylinders tested
• Individual cylinders, which can be picked by the order they were recorded.
If the test file was only for 1 cylinder, or for some graphs which require average data like Flow Area, this spec will be disabled.
Notes:
• If you pick Average, the average is based on all cylinders with data which is not 0. For example, for 3 cylinders, it
cylinder 1 is 20 CFM and cylinder 2 is 24 CFM and cylinder 3 is 0 CFM, the average is 22 CFM ((20+24)/2), not 14.7
CFM ((20+24+0)/3).
• If the cylinders are numbered 2, 4, 6 and 8 on the head, and you ask for the 4th cylinder, the graph will be for cylinder
#8, not cylinder #4.
• At this time, there is no way to graph the 3rd cylinder from the current test with the 1st cylinder of another test. All
cylinders (if you are graphing individual cylinders) must be in the same position.
Tip: Although, there is no way to graph the 1st cylinder from the current test with the 3rd cylinder of another test, you
can be “creative”. If you use the Edit command at the Main Screen on the current test, you can swap, say the 1st and
3rd cylinders. Then you can graph the 1st cylinder from the current test (actually the 3rd cylinder) with the 1st
cylinder of another test for comparison. Just be sure to swap the 1st and 3rd cylinder back when you are done!
Graphs Comparing More Than 1 Test (Basic Version)
There are 3 basic types of tests which can be graphed in the Basic version:
• Current test results. These are the test results of the test file which you are working with on the Main Screen.
• Last test results graphed. These are the test results which you previously included in the graph for comparison. This
allows you a way to easily refer back to one particular test for comparison.
• Add Test lets you pick any test from the Test Library to compare to the Current test results. This test now becomes the
Last test results graphed.
In the Basic version, you can only
compare 1 additional test to the
Current Test. If an additional test is
graphed for comparison, the Add Test
command changes to Remove Test.
You must first click on Remove Test
before the Add Test command
reapears so you can add a different
test.
Figure 3.20 Graphing Multiple Tests, Basic Version
Choose Add New Test
to open up the entire
Test Library from which
to choose a New Test.
Choose Add Last Test to add the
last test you had added to the graph
for comparison. (Test Folder and
File name are shown for your info.)
87
(C) Performance Trends Inc 2007
Port Flow Analyzer
Chapter 3 Output
Graphs Comparing More Than 1 Test (Pro Version)
There are 3 basic types of tests which can be graphed in the Pro version:
• Current test results. These are the test results of the test file which you are working with on the Main Screen.
• Tests marked in the History Log. These are the test results which you previously graphed, started new, opened, etc.
which you have marked “Yes” to graph in the History Log (see Section 3.8).
• Add Test lets you pick any test from the Test Library to add to the top of the History Log, and mark as a test you want
to graph. Since it is at the top of the History Log, it should definitely be included in the next graph.
In the Pro version, you can compare data from up to 6 tests, as long as there is room for the Legends (labels) for each graph on
the right side of the graph. Usually this ends up being about 24 graph lines, which could be 6 tests with 4 graph lines (for
example, Int only for 4 cylinders), or 3 tests with 8 graph lines (for example, Int & Exh for 4 cylinders), etc.
Figure 3.21 History Log (Pro version only See Section 3.8 for more details.)
Click on the History Button or the History menu item to display the History Log.
Click on Single Test to graph only the Current Test.
Click on Add
Test to pick a
new test to add
the graph to
the History Log
from the entire
Test Library.
Choose a ‘Graph’
option from the
menu bar to
close the Histroy
Log and graph
the tests
identified by the
menu option you
pick.
Click in this column
to show Yes or
remove Yes. Tests
marked Yes will be
graphed, if there is
room (typically not
more than 24 graph
lines total).
88
This column shows the
Standard name the program will
display in graph Legend for this
test. Click on the name to
change it. Alternate names are
possible by clicking on Format,
then Edit Titles.
Click and drag slide bar to
display entire History Log.
Some tests marked Yes
may be at the bottom of the
Log and not be visible now.
(C) Performance Trends Inc 2007
Port Flow Analyzer
Chapter 3 Output
Other Graphing Features
The graph screen has several other features, including:
• Printing
• Cursor to pinpoint the value of a particular point on the graph
• Changing titles and legend names
• Changing the scales
These are discussed in this next section.
Printing
Figure 3.22 shows the options for printing graphs and how to access these options. Figure 3.23 shows the screen for changing
the Windows Printer Setup. Figure 3.24 shows how you can add information to a graph printout by clicking on Format, then
Edit Printed Comments and Data Output.
Figure 3.22 Printing Graphs
Clicking on the Printer button is the same as clicking on File and then Print Color.
Click on File to display the 3
print menu options
Click here to print the graph in
color (solid lines).
Click here to print the graph in
black & white (various styles of
dashed and solid lines).
Click here change the printer
or printer driver, page
orientation, etc.
Figure 3.23 Standard Windows Printer Options
89
(C) Performance Trends Inc 2007
Port Flow Analyzer
Chapter 3 Output
Figure 3.24 Adding Information to a Graph Printout . (Most of these options have no effect on
the graph on the screen, only the graph that is printed.)
Click on these #s to change which Data Set’s (test file’s) comments and title you are working with.
Click here to change the Test
Comments (comments which
appear on the Main Screen).
Changes to Data Set 1’s
comments (the current test) are
permanent. Changes to other
Data Set’s comments are
temporary.
This one comment is printed
directly under the graph.
The Titles to Use options give
you a way to reach the Menu in
Figure 3.26 to change the Titles
and Legends of the graph.
Check or uncheck these 4 options to determine what gets printed, and what options are enabled
and disabled on this screen.
Bottom
Section of
Printed
Graph
Graph
Comment
Test
Summary
Test
Comment
Data Table
Appendix 9 describes the greatly expanded Graph Print features in the v3.5 B version.
90
(C) Performance Trends Inc 2007
Port Flow Analyzer
Chapter 3 Output
Cursor
The cursor feature is very useful for determining or comparing the value of the graph lines at various places. See Figure 3.25
for explaining the use of the cursor.
Figure 3.25 Cursor Features and Commands
Cursor line, usually
pink or green,
depending on
background color.
Click here to turn cursor ON.
Click here to turn cursor OFF.
Click on these buttons to move the cursor left or right. Hold down the
<shift key> while clicking these buttons and the cursor moves faster.
You can enable the cursor by clicking on View, then Turn Cursor On.
The value of each
graph line at the
cursor is displayed
here.
The X value of the
cursor is shown
here, in this case
the Valve Lift of
.320 “ .
If you click on a graph line in between
data points, the cursor will not appear.
A data point is where you see a definite
point or bend in a graph line.
You can also enable the cursor by single clicking on a graph
line at a data point. This also provides a quick way to move
the cursor from 1 area of the graph to another. (Do not drag the
mouse while clicking or you will zoom in on that area.)
91
(C) Performance Trends Inc 2007
Port Flow Analyzer
Chapter 3 Output
Changing titles and legend names (Pro version only)
Many times you may want to customize a graph by displaying and printing labels of your choice. Click on Format and then Edit
Titles/Legend to bring up the menu shown in Figure 3.26 which will allow you to do this.
Figure 3.26 Menu to Edit Title and Legend
This is the list of Standard names the program uses unless you click on the Use New
Titles button below. Select (click on) a Standard name you want to change. The
Standard Name appears in the edit box, along with the current New name if there is
one. Once you have selected a name from this list (that row will be highlighted) it
is easier to use the up and down arrow keys to select the next item to edit than
clicking the item with the mouse.
This is the list of New names the program will use if you click on
Use New Titles. If a title in the List of New Names is blank, the
program will use the Standard name.
Standard name from row selected.
New name for you to edit. Other options
include clicking on the Copy Std Name
to New or Blank Out New Name buttons.
Click here to close this menu and use
the New names you have entered.
Where New names have been left
blank, the Standard name will be used.
92
(C) Performance Trends Inc 2007
Port Flow Analyzer
Chapter 3 Output
Changing the scales
Many times you may want to change the scale of the X or Y axis. This may be to show an area in more detail or to match the
scales of a previous graph. The Pro has several ways to change the scales as shown in Figures 3.27 and 3.28.
Figure 3.27 Changing Scales for the X or Y Axis
Clicking on these buttons shifts the
graph left, right, up or down. Hold down
the shift key while clicking on them and
the graph moves farther each step.
Clicking on these buttons zooms in or zooms
out on the graph, either vertically or horizontally Hold down the shift key while clicking on
them and the graph moves farther each step.
Click here to restore “autoscaling”. That is where the
computer picks the scale to
show all the graph in good
detail.
You can use the mouse to
outline an area to be zoomed
in on. Simply click on the
mouse key in the upper left
corner of the area, then hold
the key down and drag the
mouse to the lower right corner
of the desired area. A box will
be drawn as shown. When
you release the mouse key,
this area will fill the whole
graph. This feature is disabled
if the cursor is turned on. Also,
start the upper left corner well
away from a graph line or the
program may turn on the
cursor instead.
Figure 3.28 Menu to Specify Graph Axes Scales
This menu can be obtained 2 ways. You can click on View in the menu bar then Specify Scales
(axes), or click on the Set Scales button, the right most button on the graph screen.
Depending on the type of graph data you currently
The current scale limits are
working with, one of these 3 sections will be
loaded when this menu opens.
Change any or all these to most
any value you want.
Click the Turn Autoscaling Off
button to turn Autoscaling Off to
enable changing specs in this
menu.
Click on OK to have the graph
redrawn to these new scale
93
(C) Performance Trends Inc 2007
Port Flow Analyzer
Chapter 3 Output
Engine Data Graph Parameters (Pro version only)
This section gives a brief description of all the possible Engine Data which can be graphed.
Int Valve Lift
The theoretical position of the valve as directed by the cam profile in inches (cam lift x rocker arm ratio valve lash).
Int Valve Area
The geometric intake valve opening in square inches based on Int Valve Lift. Geometric valve opening is
the actual area, and is defined on pages 68 and 69 as Vlv Area.
Int Flow Area
The effective intake valve opening in square inches based on Int Valve Lift. Effective valve opening is
defined on page 70 as Flw Area and is calculated by:
Int Flow Area = Geometric Area x Flow Coef
Where Geometric Area and Flow Coef are changing at each lift point. For example, if the valve
opening area is 1.5 square inches at .35" of valve lift, and the flow coefficient at .35" is .5, the In
Flow Area is .75 square inches at .35" valve lift.
Exh Valve Lift
See Int Valve Lift above.
Exh Valve Area See Int Valve Area above.
Exh Flow Area
See Int Flow Area above.
Figure 3.29 Example of Engine Data Graph
This is an example of
comparing Valve Lift
and Flow Area for 2
different cams with the
same head.
Note that the total
“integrated” Flow Area,
Valve Area or Lobe
Area is given in the
Standard Legend
titles. These areas are
defined in Section 3.1
Reports on page 76.
94
(C) Performance Trends Inc 2007
Port Flow Analyzer
Chapter 3 Output
Port Velocity Maps (Pro Version only)
Port Velocity Maps are a very special type of graph, and should be discussed separately from the other graph types and features
for those graphs. Port Velocity Maps are constructed from the port velocity readings recorded with a Pitot Tube. With Port
Velocity Maps, the color indicates the velocity at that particular portion of the port cross section. The velocity indicated by the
color is given in the Key in the lower right corner of the graph.
Figure 3.30 Port Velocity Graphs
By adjusting
Scales (see
Figure 3.28),
you change
which colors
represent
which
velocities. This
can let you
match another
graph for a
different head
for
comparison.
Summary of
Test Specs
and Test Data
graphed.
Key to interpret
which colors
represent
which
velocities.
Appendix 9 describes the greatly expanded Port Velocity Graph features in the new Head Porter
version.
95
(C) Performance Trends Inc 2007
96
Port Flow Analyzer
Chapter 3 Output
(C) Performance Trends Inc 2007
Port Flow Analyzer
Chapter 3 Output
3.5 Printer Output
The Port Flow Analyzer can print the tabular test results of a report for a permanent hardcopy by clicking on Print in the menu
bar or the Printer icon. The menu of options shown in Figure 3.31 will appear. Check the options you want to use for the
printout by clicking on any or all of the Option boxes. All options and buttons are discussed in this section.
Appendix 9 describes the expanded Print features in the version 3.5 B.
Figure 3.31 Printer Button and Print Menu Command Options - Report Screen
Click on Print or the Printer button
(shown hidden here) for the Printout
Options menu shown to the right.
This options lets you choose the
printer or printer driver being used by
Windows and also page orientation.
Check or uncheck these options, then click on this button to print the current
report with these options.
Check or uncheck these
options, then click on this
button to print a blank
paper worksheet. This
worksheet can be useful
for recording data when
your flow bench can not
be next to your computer.
Test Results Report Options
Include Test Options
Include Head Specs
Include Head Details Specs (Pro Version Only)
Include Flow Bench Specs
Include Engine Specs (Pro Version Only)
97
(C) Performance Trends Inc 2007
Port Flow Analyzer
Chapter 3 Output
Select these options if you want all the specs from these menus printed with the report. This will add 1-2 pages to the printed
report. Note that only a few of the Test Options are printed which could affect the test results, not all specs from the Test
Options menu.
Include Test Comments
Select this option if you want all the comments for the Test File printed with the results.
Request Report Comment
Select this option if you want to be asked for a comment for each particular report you send to the printer. These "report
comments" are useful to identify important points for future reference, like modifications, engine results, etc.
Larger Font (Print Size)
Check this option if your particular printer is printing the results with a small print font. This option will increase the font size
for some parts of some reports. Also see Preferences for Selecting Printer Fonts, page 26.
Worksheet Options
These options let you print a blank paper worksheet. This worksheet can be useful for recording data when your
flow bench can not be next to your computer.
Use Standard Lifts
Check this option to produce a worksheet where the valve lifts (or L/Ds) requested match the specs in the Test Options menu. A
summary of these lifts or L/Ds is given below this option. Uncheck this option, and the worksheet will include all lifts (or L/Ds)
for the current test file. This also means that the order of the lifts, any extra lift points in some or all ports, etc. will be included
in the worksheet.
Larger Space Between Lines
Select this option if you want more space between lines, so you can write your numbers larger.
Ask for Worksheet Comment
Select this option if you want to be asked for a comment for to be printed at the top of your worksheet.
Include Head Specs, etc.
Select this option if you want all the specs from the Test Options Menu, Head Menu, Head Details Menu and Engine Specs
menu printed with the report with a blank next to them. This will add 1-2 pages to the printed report.
98
(C) Performance Trends Inc 2007
Port Flow Analyzer
Chapter 3 Output
Other Print Options
Other menus have print menu commands or print buttons as shown in Figures 3.32 and 3.33.
Figure 3.32 Print Commands under File Options (Pro Version Only)
Click on File in either
the Head Specs or
Engine Specs menus
to display these Print
Options.
Figure 3.33 Print Button
Many screens and
menus have a Print
button. Click on it to
print that particular
screen or menu.
99
(C) Performance Trends Inc 2007
100
Port Flow Analyzer
Chapter 3 Output
(C) Performance Trends Inc 2007
Port Flow Analyzer
Chapter 3 Output
3.6 Data Libraries
The Port Flow Analyzer allows you to save a set of Flow Data and related specs (Head Specs, Test Options, etc) to the Test File
Library under a name of your choosing. You can then open these test files out of the Test File Library in the future for
comparison or modification. The Open window is below with explanations.
Figure 3.34 Test Library Options
Click on File, then Open (from all saved tests) to display Test Library shown here.
Click on File, then Save or Save As to save current test and specs to the Test Library.
Total # Tests in Library under this Folder
Name of chosen Test
(currently highlighted in
Test List)
Click and drag slide
bar to view all Tests
in list
Preview of Test
h
Single click on a Test
to choose it for
preview. Double click
to immediately open it.
Click here to
delete the
chosen Test.
Click here to bring up the Filter Options menu
where you can select to show only tests which
fit certain criteria. See Section 3.7.
Tests can be saved
under various
catagories (folders) to
help you organize
large #s of tests.
Click on a different
name here and a
different list of Test
Files will be
displayed. The name
“Folder” was called
“Customer” in the
DOS version, but can
be changed in the
Preferences menu to
most any word.
Click here to bring up standard
Windows File Open screen, to let
you open a file in most any folder
(directory) and disk drive.
Click here to bring up “on screen” help.
Click here to close the Test Library with No changes (without opening a test)
Click here to open the chosen Test
Select one of these options to list the test files alphabetically, either by test file name, or by head
#. This option can save you time looking for a particular test file. (Pro Version Only)
101
(C) Performance Trends Inc 2007
Port Flow Analyzer
Chapter 3 Output
Open a Test File
To open a test file saved in the Test Library, click on File at the upper left corner of the Main Screen, then on the Open (from all
saved tests). In the Pro version you have an additional option of “Open (from History Log)” which will be discussed in Section
3.8.
You will obtain the window shown on the previous page. Single click on one of the tests in the list, or click and drag the slide
button on the right side of the list to display more tests. Once you single click on a test, it is now the Chosen Test File and a
preview of the test is given in the Preview section. If the file you chose was not a valid Port Flow Analyzer file (either
Windows v3.0 or the older v2.1 for DOS), the program will tell you and you can not choose it.
Once a test has been chosen, you can delete it by clicking on the Delete button, or Open it by clicking on the Open button in this
window. You can also click on a different test to Preview it or close this window and return to the Main Screen without
choosing a new test file.
If you are sure of the test you want to open, you can simply double click on it from the Test List. This opens the test without a
preview and closes this menu.
Note for Pro Version: You can also save sets of Head or Engine specs to their own separate libraries. This is done very
similarly as with the Test Files, except you click on File, then Open from the individual Head or Engine menus. See Figure
3.35.
Figure 3.35 Head (or Engine) File Options (Pro version only)
Current Head File Name
Click on File in the Head or Engine menus to Open a set of
saved specs, or to save the current set of specs in just that
screen. This allows you to build libraries of Heads and
Engines for easily creating new tests in the future.
• New blanks out the current specs and comments.
• Open Example opens a library of example specs
provided by Performance Trends.
• Open Saved opens a library of specs you have saved.
• Save saves the current specs to the same name as
these specs are currently called.
• Save As saves the current specs to a new name that
you will enter.
Save a Test File
Before you discuss saving a test file, it is important for you to understand how the program opens and uses test files. When you
open a test from the Test Library, you are only using a copy of the test. The original test file is kept in the library.
As you make changes to the test, they are only made to this copy. The original file is not changed. If you want to delete your
changes, you can simply open a fresh, unchanged copy of the original test file from the Library. If you want to keep your
changes, you must save them. This can be done by clicking on File, then Save. You are also asked if you want to save your
changes whenever you open a new test, and the program has detected you have made changes to the current file.
102
(C) Performance Trends Inc 2007
Port Flow Analyzer
Chapter 3 Output
Figure 3.36 Saving Test File Options
Click on File then Save As to bring up this Save menu.
Click here to save specs to New Test name shown
New name to save test data to. Leave unchanged
and click OK to save to the current test name. (This
would be the same as clicking on File, then Save.)
Click on name in the box to change it, then click OK
to save it to the new name.
Name of current test file you are
working with.
Click on the down arrow button to pick a
different flolder to save this test to.
Note that the top choice in this list is
“Add New Folder”. Pick this option and
then you can type in a new folder name,
This new folder name will be added to
the list so that you can save the test file
to that folder if you wish. The word
“folder” can be changed to most any
word in the Preferences menu. In the
previous DOS version, this was the
“Customer” name.
Type in a New Folder Name here if you
select “Add New Folder” as the Folder
Name.
Click here to bring up standard Windows
File Save screen, to let you save a file in
most any folder (directory) and disk drive,
and to most any file name (Pro version
only). Note that files saved this way are
not found in the standard Test Library and
are not “searchable” using the Filter
options discussed in Section 3.7.
To save a Test File, you will be presented with the Save Window as shown above. The program suggests a new test name
which is the same as the current test name shown at the top of the Main Screen. If you want to save your changes to the same
name, simply click on OK. This will update the current test file with your latest changes.
If you want to save the current set of test specs with your changes to a new name (and leave the current test file in the Library
unchanged), then click on the suggested file name and modify it as you want. For example, in the window shown above, you
may want to add -2 to the current name PORTVEL.PTI to create PORTVEL.P-2 to indicate this is the 2nd revision of
PORTVEL.PTI. This is the safest way to make changes, because you can always return to an earlier version and see what you
had done.
Certain file names are not acceptable, like names which include the characters: / \ : | < > “ * ? The program will also
shorted file names that are VERY long, like over 40 characters.
Test files are saved to folders (directories) you have created in the PFADAT folder (directory) in the PFA30 folder (directory)
under Program Files\Performance Trends\Port Flow Analyzer v3.5 folder (directory). You can copy Windows Port Flow
103
(C) Performance Trends Inc 2007
Port Flow Analyzer
Chapter 3 Output
Analyzer files from programs on other computers to this folder (directory) and they will be found by the program. The
Windows Version 3.5 will read files produced with the older DOS v2.1 and Windows v3.0. Just copy them into a folder under
the PFADAT folder (other than the Examples folder).
The method of saving Head and Engine files is exactly the same as complete Test Files, except that you access the Save menu
by clicking on File at the top of these individual menus, as shown in Figure 3.34. These files are saved to the HEAD and
ENGINE folders (subdirectories).
104
(C) Performance Trends Inc 2007
Port Flow Analyzer
Chapter 3 Output
3.7 Filter Test Files (Pro Version Only)
The Port Flow Analyzer has a powerful way to search for tests in the Test Library called the Filter Option. Click on the Filter
button in the Open Test File menu (Figure 3.34, page 101) to be presented with the screen shown in Figure 3.37 below.
Figure 3.37 Filter Files Menu
Click on the down arrow button to pick the spec or comment to
check for a certain condition “Has this relationship”.
Click on the down arrow button to pick the contion to
look for. These change depending on the spec or
comment you have chosen.
Type in (or pick
from a list for
some specs)
the condition to
look for. The
program treats
UPPER and
lower case
letters the
same (bowtie =
BOWTIE =
BowTie).
Check here to
include a 2nd
condition. This
enables specs in
this section.
Click on this button to return to
the File Open menu which will
now show all test files.
Click here to produce a report of all files meeting the
Filter conditions IN ALL FOLDERS in the PFADAT
folder (the entire Test Library). This way you can avoid
looking in each folder separately and can save time.
Click on this button to return to the File Open menu which will now only show files which fit
the Filter Conditions.
Select And and the Test Files displayed must fit both conditions specified. Select Or and the Test
Files displayed can fit either of the conditions specified.
The settings in this screen will display all test files with the word BowTie (or bowtie or
BOWTIE) somewhere in the test comments and with the word Johnson (or johnson or
JOHNSON) somewhere in the Customer description (a spec in the Head Specs menu).
The Filter Feature is very useful for finding a specific test or to find all the tests which meet a certain set of conditions. For
example, say you want to find a test that Operator “Jack” ran for Customer “Smith” on a “Big Block Chevy” head. Or, say you
are having problems with a certain brand of intake valve seal, where the part # starts with "NAP". Or perhaps you want to find
all Small Block Chevy heads that flowed over 200 CFM on the exhaust. In all these cases, the filtering specs would allow you
to find the test files.
105
(C) Performance Trends Inc 2007
Port Flow Analyzer
Chapter 3 Output
First you must select the condition you want to look for by clicking on the down arrow button on the 'This comment or spec'
box. Your choice of this spec will determine what the 'Has this relationship' options are, and what specs can be entered in the
'To what I enter here' spec.
You can select up to 3 conditions to look for. For the Operator “Jack”, Customer “Johnson”, “Big Block Chevy” example
above, you would need to search for 3 conditions. For the valve seal example, you could just search for 1 condition. You add
conditions by checking the 'Include this condition also' box. This enables the other specs for each condition.
If more than 1 condition is being used for the search, you must determine if you want the search to include tests which fit ANY
of the conditions (Or) or must match ALL conditions (And). For example, if you are looking for tests run by either Operator
Jack or Operator Joe, you would select “Or”. If you want Tests which flowed more than 300 CFM on Intake and were done
since Jan 1999 (the tests must match both conditions), you would select “And”.
The 3 command buttons will do the following:
Show Files Only Fitting These Conditions will return you to the Open Test File screen. Only files fitting these
conditions will be displayed (which may be no files in some situations). You can click on various folders (or whatever name
you have given to folders in the Preferences menu at the Main Screen) to see if there are any matches in other folders.
Turn Off Filtering (show all files) will return you to the Open Test File screen and now all files will be displayed.
Print List of All Files Fitting These Conditions will search through the entire Test Library (all folders in the
PFADAT folder) for files matching these conditions and display them in a new screen. From this screen, you can also print the
list. This is the quickest way to see which folders may contain test files matching your conditions.
Tip: When looking for a word, the program doesn’t care if it is in CAPITAL (upper case) or small (lower case)
letters. In Figure 3.37 above you are looking for the word BowTie in the test comments. The program will display
all files which have the word “BowTie” or the word “BOWTIE” or the word “bowtie” or the word “BowTIE”
anywhere in the comments. The program will not find files with the words “Bow Tie” (with a space between Bow
and Tie) . Therefore, it may be smarter to just look for the word “bow” to avoid this problem. Note, however, that
if you do this, the program will also find tests with the word “elbow” or “crossbow” , for example, in the test
comments.
106
(C) Performance Trends Inc 2007
Port Flow Analyzer
Chapter 3 Output
3.8 History Log (Pro Version Only)
Click on File, then Open form History Log at the Main Screen to obtain the History Log shown below in Figure 3.38. This
screen shows a summary of the results for the last 25-100 tests you have worked with (started new, opened, graphed, etc.) The
number of tests in the log (25-100) is selectable in the 'Preferences' menu at the Main Screen. When you work with a new test, it
is added to the top of the History Log, and (if the Log is full) the last run drops off the bottom of the list. In the Pro Version, the
History Log is an alternate way to Open tests which have been saved to the Test Library. The advantage of the History Log is it
lists the tests you most recently worked with at the top.
See Appendix 7 & 9 for some new features added in version 3.5 & 3.5B.
Figure 3.38 History Log and Options
Click on File, then Open from History Log
Click on Test Title to Open that Test File.
Click in the Save
column to enter a
Yes or erase a
Yes. All tests
move to the
bottom of the
History Log and
eventually fall off
the list as you
work with new
tests. However,
Tests marked Yes
do not fall off the
list.
Click and move
slide bar down to
display all 25-100
tests in the
History Log.
Click and move
slide bar right to
display more
columns of test
results.
From this screen you can Open a test file by clicking on the 'Test File and Path' column (first column on the left). If the test file
was saved to a standard folder (directory, or whatever you have chosen to call folders in the Preferences menu), the folder name
is given first, followed by the test file name.
If a test file has been Opened from or Saved to a non-standard folder (a folder not in the PFADAT folder) using the 'Advanced'
function, the entire path is given. If the 'Path and File Name' won't fit, it is shortened and preceded by '...'.
You can choose to Save certain results you believe are special and you may want to recall or graph in the future by clicking on
the Save column to insert a Yes there. Tests marked Yes to Save eventually move to the bottom of the History Log, but
are never dropped off the list or erased until you again click on the Yes to make it blank.
Note that just the Test File Name stays in the History Log. Should you delete the file using the Open (from
all saved tests) command, the test file will be deleted. When you try to open it or graph if from the History
Log, you will get note saying the file can not be found.
107
(C) Performance Trends Inc 2007
Port Flow Analyzer
Chapter 3 Output
You can print the History Log on a printer by clicking on the 'Print' menu command. Note that the History Log will be most
readable when the Page Orientation is in Landscape setting.
The Max CFMs listed are corrected to whatever test pressure have specified in the 'Preferences' menu. Max CFMs and Valve
Diameters are handy to remind you what a test was, and for comparing different tests.
History Log at Graph Screen
At the Graph Screen, several options are available to graph selected tests from the History Log, and change the Graph Titles.
You can obtain the History Log by clicking on the menu command History Log at the top of the Graph Screen. The History Log
is how you graph different tests together for comparison. From this screen you can:
•
•
•
•
Choose to Graph certain Test Results by clicking on the Graph column to insert a Yes there. Tests marked Yes to
Graph will be graphed when you click on the 'Graph Tests Marked 'Yes' '. The first test (usually the current Flow Test
you are working with) is always graphed even with no Yes marked. The number of tests actually graphed are limited
by available space, usually a limit of about 24 graph lines total.
Graph only the current test results (the test file at the top of the Log) by clicking on 'Graph Current Test Only'.
Click on 'Graph Title' to change the Standard Title for this test. The program defaults to putting in the Head # unless it
is blank, when it then puts in the test file name. (You can also specify 'Alternate' titles and legend names by clicking on
'Format' at the top of the Graph Screen, then 'Edit Titles/Legends'.)
Choose to Save certain results you believe are special and you may want to recall or graph in the future. See the Save
explanation of the previous page.
Figure 3.39 History Log at Graph Screen
108
(C) Performance Trends Inc 2007
Port Flow Analyzer
Chapter 4 Examples
Chapter 4 Examples
Each example in this chapter becomes progressively more complex, assuming you have performed and understand the preceding
example. Section 1.5's example is somewhat more basic than Example 4.1, so it may be a better place to start if Example 4.1
looks complicated.
The results shown in these examples may be
somewhat different than what you obtain with
your particular version of the program That
is due to minor upgrades in the calculations
in later versions.
109
(C) Performance Trends Inc 2007
110
Port Flow Analyzer
Chapter 4 Examples
(C) Performance Trends Inc 2007
Port Flow Analyzer
Chapter 4 Examples
Example 4.1 Flow Test On a New Type
of Head Using a SuperFlow 600* Flow
Bench without Electronics
See Appendix 7 for using the easy “EZ Start Wizard”, added in version 3.5.
This example demonstrates the basic steps for running a flow test. You will use a 2 cylinder Yamaha head and assume that no
similar head has been flowed before. Therefore, no similar Test Files are available from the Flow Test Library from which a
New Test could be developed. You will be “starting from scratch”.
The Port Flow Analyzer has several options for filling in head data on the Test Data grid. The particular steps given below are
not the only way to run this flow test.
Start the program by clicking on Start, then Programs,
then Perf Trends, then Port Flow Analyzer v3.5, or just
double clicking on the desktop Icon. When you enter
the Port Flow Analyzer, you may see the question in
Figure 4.1. If you answer No, you will start with a
blank screen. If you answer Yes, the program will put
you back to precisely where you were when you last
quit the program. Even though you are starting a New
Test, click on Yes to bring up the last test you were
working with.
Figure 4.1 Introduction Question
Click on File (upper left corner), then New Test to bring up the New Test screen, which will likely show a Tip message. See
Figure 4.2. As the Tip in
Figure 4.2 The New Test Screen with Tip
Figure 4.2 says, it is always
Click on File, then New Test to bring up the New Test Screen.
easiest to start with a Flow
Test file that is as close as
possible to the flow test to
be performed. This
prevents us from having to
make major changes to test
information like the Head
Specs, Test Options, etc.
However, since you have
not flowed a head like this
one, you can start this test
with whatever the Current
Test is.
111
(C) Performance Trends Inc 2007
The New Test
screen appears as in
Figure 4.3. There
are 4 critical specs
at the top which
must be filled out
or picked.
Figure 4.3
Port Flow Analyzer
Chapter 4 Examples
4 Critical specs for the new test are listed here at the top.
Click here to start a New Test based on these settings.
If this is the first
time you have
started a New
Test and you
haven’t set up
any Master Flow
Bench specs,
the preview will
say no Master
Bench Specs.
You will have to
fill out the Bench
Specs menu
before you can
start the New
Test.
If this is the first
New Test you have
run (you just got
the program), you
will be given notice
that you must also
fill out the Master
Flow Bench Specs
before starting a
New Test. To
correctly
understand the
Flow Bench Specs
and what the
Master Flow Bench
Specs are, you will
need a little
background.
A summary of the current settings is given here.
Click on these buttons to see the current settings.
Click here to Check or Uncheck these options. Checking means you want to keep
these specs for the new test. Once the new test is started you can then make
modifications to these specs if you want.
Setting Up Flow Bench Specs for a New Program
A flow test is made up of 4 major parts (6 with Pro version):
Flow Bench Specs (see Section 2.6)
Head Specs
(see Section 2.4)
Test Options
(see Section 2.3)
Actual Flow Data (see Section 2.1)
Head Details (see Section 2.5) (Pro Version Only)
Engine Specs (see Section 2.7) (Pro Version Only)
Of these, the Flow Bench Specs and the Actual Flow Data are the most important for accurate data. The Actual Flow Data you
enter into the Flow Test Data grid are the pressures from the manometers (and temperatures for certain benches). These are
obvious to the user since no CFM is calculated without these being entered.
The Flow Bench Specs are stored in a separate menu, but have as much effect on the CFM accuracy as the manometer readings.
Once you have set the Bench Specs to match your bench, you will not change them unless the bench or recording electronics
change. However, you must initially set them to match your bench.
At the New Test screen, you can open up the Flow Bench Specs menu by clicking on the See Specs button next to the Flow
Bench option. When you open up the Flow Bench Specs from the New Test screen, the program displays the Master Bench
Specs, Figure 4.4.
112
(C) Performance Trends Inc 2007
Port Flow Analyzer
Chapter 4 Examples
If the Master Bench Specs are blank:
1. The program will give you tips to first, choose your type of Flow Bench
2. Then depending on the type of bench you picked, it will ask if there are any electronics used for recording data.
3. Then depending on the type of bench you picked, it will ask you to enter in the CFM for the Flow Ranges for your bench.
For a SF 600 you are using in this example, this would be the 6 Intake and 6 Exhaust CFMs you got on a calibration card
from SuperFlow with your bench.
With the Master Bench Specs filled out, click on Back (OK) at the top left of the Bench Specs screen to return to the New Test
Screen.
Figure 4.4 Filling Out Master Bench Specs for First Time
1 Tip messages will first instruct you to
pick the general Type of Flow Bench. For
this example, we picked a SuperFlow 600.
2 A tip message will instruct you to pick
the type of electronics you will be using
with the Flow Bench. For this example,
we picked None.
3 For a SuperFlow 600 bench, you
should fill in the full scale CFM flows for
each of the 6 ranges, intake and
exhaust.
Filling Out Other Specs to Start a New Test
If you start with a blank test, or want to modify some specs from the previous test, click on the 'See Specs' buttons for each
category of specs. Click on Help at these menus for more info on how to enter these specs.
Since you have not run a Yamaha head before, the head specs currently loaded are probably quite different than the Yamaha you
will run. Therefore, you will uncheck the Head Specs option to leave Head Specs blank (for now) with this new test. The same
could be said about all other categories of specs. Therefore, you will uncheck all categories except the Flow Bench.
Most specs in these categories can be changed once the test has started with no problems, which is what you will do in this
example. However, there are four other critical specs listed separately at the top. These must be filled out before you can start
the new test:
1. File Name for New Test is the file name the program will create for saving the Flow Data for the new test you are starting.
The program fills in a default name of the current test name, but incrementing the last digit in the name by 1. You can
change this name to most anything you like. The program will warn you if the name entered is not valid and show you what
is wrong. For this example, type in the name: 600CC-4VLV for this 4 valve Yamaha head.
113
(C) Performance Trends Inc 2007
2.
3.
4.
Operator for New Test is the name of the
operator for this test. Click on Pick to
pick an operator name already used or to
enter a new name. The program defaults
to the operator of the current test.
Through the Operator Menu discussed
in Section 2.1, you enter a new
Operator name of Jack.
Head # for New Test is critical for shops
who use a head numbering system. Click
on Assign to create a new Head # based
on the last Head # assigned (incremented
up by 1) or to start with a new type of
Head #. Through the Head # Menu
discussed in Section 2.4, you enter a
new Head # of TCPerf-0002.
Folder Name for New Test is the folder in
the PFADAT folder where the test will be
saved. The program may not be using the
name 'folder' for spec, but whatever word
you have assigned in the Preferences
menu at the Main Screen. The folder
name 'Examples' is reserved for
Performance Trends example tests
supplied with the program, and can not be
used for your tests. By clicking on Add
New, you use the new folder of
YAMAHA.
Port Flow Analyzer
Chapter 4 Examples
Figure 4.5 New Test Menu for Starting This New Test
Click Here to Start the New Test
Figure 4.6 Main Screen and Tip after Starting New Test
Click on Test Options to define specs to generate valve lifts.
Click on Head to define how many cylinders to test.
The New Test screen should
now look like Figure 4.5.
When you are ready to start the
New Test, click on 'Start New
Test' at the top of the screen.
If some critical specs have not
been entered, the program will
warn you and ask you for it at
that time. These include Intake
Valve Diameter, Exhaust
Valve Diameter and Test
Pressure. The program will fill
in the Test Time and Date
based on the computer's time
and date. This can be changed
later by clicking on the Test
Time/Date at the Main Screen.
Figure 4.6 shows the Main Screen you get from starting with most menus of options and specs blank. First, there are no valve
lifts generated, which Tip message is stating because the specs used to automatically generate lifts in the Test Options menu are
blank. Second, you notice that only 1 intake and 1 exhaust tab are shown, but you want to test 2 cylinders. The specs stating
how many cylinders to test are contained in the Head Specs menu.
114
(C) Performance Trends Inc 2007
Port Flow Analyzer
Chapter 4 Examples
Click on Test Options at the top of the Main Screen to open the Test Options menu (Figure 4.7) There you can fill out any or all
the specs which pertain to this test. Click on Head at the top of the Main Screen to open the Head Specs menu (Figure 4.7) to
enter specs about this head you are flowing.
Figure 4.7 Filling Test Options and Head Specs Menus
These specs determine what
valve lifts are automatically
generated by the program.
Note the preview shows the
pattern of the lifts. The head
porter in this example
typically tests .025, .050,
.100, .150, .200, .250, .300
inches valve lift (not L/D) and
then double checks .150
again. The .000 point is also
tested to check leakage.
Select None for Port
Velocities because we are
not recording port velocities
with a Pitot Tube.
Select “Calculate from data
entries” for recording CFM
Flow. For this simple test,
you select to only record
CFM, so other data types are
set to “Don’t Record”.
This is not mandatory, but
when all specs and Head
Comments are filled in, click on
File, then Save As and save
these Head Specs to the Head
Library with the Head Name
“YAM600-4VLV” (Pro version
only). This would let you Open
a file of these Yamaha head
specs some time in the future,
saving you from typing them
again.
Select the Port Layout, which
for this head is 2 intake and 2
exhaust valves, each valve
having its own individual port.
Fill in other head specs for
more advanced analysis and
for documenting this heads
specs.
Set this spec to 2 to tell the
program you are going to test
2 cylinders on this head.
115
(C) Performance Trends Inc 2007
Port Flow Analyzer
Chapter 4 Examples
Figure 4.8 Inserting .025” Lift Point
After filling out the Test Options and Head Specs as shown in
Figure 4.7, the Main Screen looks more like you are ready to test.
Valve lifts and L/Ds are filled in as specified in the Test Options
menu. However, the .025 and the recheck of .150 valve lift points
are not filled in. You can manually insert a blank row in ahead of
the .050 valve lift row as shown in Figure 4.8. Then you can type
in the .025” and .150” recheck points.
Click on Row #2 (.050) lift to bring up the
Edit menu. Click on Insert Blank Row to
make room for the .025” row. Type in
.025 for the valve lift in this new row.
At the Main Screen, you can also start typing in test comments.
For the first comment, you can enter something descriptive like:
Ed's 600 cc Yamaha 4 valve - before porting
Now the Main Screen looks similar to Figure 4.9, so now you can
start recording actual flow data.
Recording Flow Data
Set up the bench and head to flow Cylinder #1's intake port. It is necessary to first measure the amount of CFM leakage.
(Before checking leakage, be sure that the Leakage value at the Main Screen is set to 0. See Figure 4.9.)
With the intake valve closed and the intake port sealed with tape, start the bench and set approximately 28" water Test Pres.
Select the lowest flow range on the bench to measure leakage: Range #1. Enter 1 for Range, and the actual pressures you
observe of Test Pres = 27.4" and Flow Pres = 7% as shown in Figure 4.9.
Figure 4.9 Recording Flow at .000 Lift to Determine Leakage
1 Be sure this leakage
value is set to 0 before
trying to measure
Leakage CFM.
Set up the flow bench
to record CFM flow at
.000 valve lift on the
most sensitive range
(#1). Type in the
Range, Test Pres
(vertical manometer)
and Flow Pres
(inclined manometer
%) and the program
calculates CFM flow of
2 5 CFM
Type in 2.5 CFM as
the Leakage #. CFM
for point 1 (.000 lift)
now drops to 0 CFM.
This is as it should be,
because the 2.5 CFM
was not going through
the valve because the
valve was closed.
116
(C) Performance Trends Inc 2007
This data calculates a
leakage of 2.5 CFM. (Note
that an accurate leakage
CFM can only be calculated
when Leakage is set to 0
shown in Figure 4.9. Enter
leakage by clicking on
Leakage and typing in 2.5.
You will notice that the
CFM for Point #1 is now 0.
This shows the leakage
correction is working
properly to correct for the
2.5 CFM coming from other
sources (not the valve).
Port Flow Analyzer
Figure 4.10 Completed Intake Port
Chapter 4 Examples
Click on File, then Save to save these
test results to the Test File Library.
Click Exh #1 tab to go to next port.
Note that the Summary Graph automatically updates as you enter data.
Start recording actual flow
data at this time. Open the
intake valve to .025" as
indicated in the Lift column
for row 2. Adjust flow to
obtain 28" of Test Pres on
the vertical manometer.
Wait a few seconds to let the
Test Pres and Flow Pres on
the inclined manometer
stabilize.
Enter both Test Pres and
Flow Pres as accurately as
can be read on the
manometer. Although a
setting of 28.0" of Test Pres was desired, it may actually settle out at 28.15". The inclined manometer gives a reading of 48%.
Enter these values and the program will calculate a CFM value of 14.7 CFM, which is corrected for leakage and to 28.0" Test
Pres. Also note that Point 2 has been graphed on the Summary Graph. See Figure 4.10. Continue setting valve lifts as indicted
in the Lift column. For each lift, select the proper flow range and enter the Range, Test Pres and Flow Pres as done before, until
there are readings for all Lift points. See Figure 4.10.
Flow Exhaust Port
With one intake port completed, you can now flow this cylinder's exhaust port. Set up the head and flow bench to flow the
exhaust port of #1 cylinder. Advance to the
Figure 4.11 Recovering Data at Startup
Exh Port Test Data grid for cylinder #1 by
clicking on the Tab at the top. See Figure 4.10.
You may notice a short message saying “Saving
to Temporary File” appear for about a second.
Whenever you change ports, or return from a
menu like Head Specs, the program saves a
temporary copy of the flow test. Should you
loose power, or should the program “bomb”,
most of your data will be saved. If this
happens, when you restart the program the
117
(C) Performance Trends Inc 2007
Port Flow Analyzer
Chapter 4 Examples
program will give the message shown in Figure 4.11. If you answer Yes, the program will restore your data up to the point the
program last saved it. For added insurance, you can periodically click on File, then Save to permanently save your latest
changes to the Test Library while running the flow test.
At the Exhaust Screen, most valve lifts will be generated, but not the .025 and the .150 you added manually for the Intake Port.
Add these lift points as done for the Intake Port.
With the exhaust valve closed, the exhaust port sealed with tape, and 0 Leak CFM entered for this port, measure leakage. Enter
the 3.0 CFM leakage by clicking on Leakage and typing in 3. Record flow data for the exhaust port by following the steps done
on the Intake Port. Generally exhaust ports do not flow as well as intake ports because they are smaller.
With Cylinder #1 completed, you interrupt the flow test for 3 hours for lunch and to do some office paperwork. When you
return you make a note of the 3 hr interruption in the by typing in the Comments section something like “Cylinder #2 flowed
after 3 hour delay.”
Tests are now completed for the intake and exhaust ports for cylinder #1, so set up to flow the intake port of cylinder #2.
Advance to the intake port Test Data grid for cylinder #2 by clicking on the Int #2 tab. The Test Data grid is now blank except
for the standard valve lifts and the Range #. Once cylinder #1 has been flowed, the program assumes the other ports will flow
somewhat similar to cylinder #1, and are therefore likely to use the same flow range at the same lifts. You still must manually
insert the .025 and .150 valve lifts and run the leakage test.
Follow the same procedure for flowing cylinder #2, Intake and Exhaust as for Cylinder #1. When you are done and the entire
cylinder head has been tested, be sure to save the data by clicking on File, the Save. Reports and graphs as shown in Examples
4.3 and 4.4 are now possible.
Note: There are many alternate ways to perform this flow test. For example, flow all the intake ports and then all the exhaust
ports. This example is only one suggested method used to illustrate the Port Flow Analyzer's commands and options.
118
(C) Performance Trends Inc 2007
Port Flow Analyzer
Chapter 4 Examples
Example 4.2 Running Flow Test On
Type of Head Which Has Been Flowed
Before, Using FlowCom
This example is similar to Example 4.1. Therefore, only major differences between the two examples will be discussed in detail.
Note, file XFRD185.PTI has been changed to “Example SB Ford SF 110 w Port Velocity” in version 3.5.
This example will demonstrate the basic steps for running a flow test when there is a Test File saved which is similar to the test
to be performed. You will be testing a small block Ford 302 head, similar to the XFRD185.PTI file saved in the Examples
folder of the Flow Test Library. You will flow the head on a SuperFlow 110 bench, using SuperFlow’s FlowCom electronics
for recording data. The Port Flow Analyzer has several options for filling out the Test Data grid. The particular steps given
below are not the only way to run this flow test.
Note: Do not install the head on the
bench yet, so you can do a bench
calibration. This is discussed later in this
chapter.
Figure 4.12 Open a Previous, Similar Test File
Second, find the test file and click on it. A preview
(summary) of the file is shown to the right.
Starting a New Test
First, open a Flow Test file which is very
similar to the head, flow bench specs and
Test Options for this New Test. This can
be done by clicking on File, then Open
(from all saved tests) at the Main Screen.
The Flow Test Library is shown in
Figure 4.12 will be displayed.
You may first have to switch to the
EXAMPLES folder by clicking on
EXAMPLES in the list of folders if it
was not already highlighted. Then find
and click on the XFRD185.PTI test file
to obtain the preview. This file contains
example flow data from a Ford 302 on a
SuperFlow 110 flow bench. Click on the
Open button and a copy of this file will
be opened to use as the pattern
(template) for this New Test.
Third, click on Open to open this test file
as the pattern for the New Test. This test
file now becomes the current test, the
same as if you had simply wanted to look
at it, edit it or make a report of it.
First, click on the
folder where the
test file we will
use as a pattern
is stored.
At the Main Screen, click on File, then
New Test to obtain the screen shown in
Figure 4.17. You may notice a Tip
message when you open the New Test
Screen saying it is best to pattern the New Test after some previous test (Figure 4.13). Since the XFRD185.PTI test file is a
good pattern (that’s why we opened it), simple click on OK to close this Tip message window.
119
(C) Performance Trends Inc 2007
Port Flow Analyzer
At the New Test screen, think about the New Test and the head
you are going to flow. Then you must decide how much of the
XFRD185.PTI test file you can keep for this new test.
Chapter 4 Examples
Figure 4.13
Flow Bench: If you were actually doing this example in your
shop, your Master Flow Bench specs should already be for a
SuperFlow 110.
(If you are simply following this example by going through these
steps, your Master Flow Bench may not be a SuperFlow 110. If
this is the case, and you want the Master Flow Bench specs to
match those of the XFRD185.PTI test, click on ‘Cancel (don’t
start a new test’ at the top of the New Test screen. Then click on
Flow Bench at the top of the Main Screen. You should get a message which says the current Flow Bench Specs for
XFRD185.PTI does not match your Master Flow Bench specs, which you already know. Click on OK to clear this message,
then click on File, then Save as My Master Bench Specs. This will save the Bench Specs for Test File XFRD185.PTI as the
Master Bench Specs. Then click on Back (ok) to close the Flow Bench menu. Then click on File, then New Test to return to the
New Test screen.)
To tell the program you are using a FlowCom to record the data, select “FlowCom” as the Type in the Electronics section of the
Flow Bench specs menu (shown in Figure 4.14). When you are using the FlowCom, it is also critical to have the FlowCom
accurately reading the temperatures and pressures. The process of checking and adjusting the electronics to match the
manometers and thermometers is called calibration. Use the process outlined in the FlowCom instructions from SuperFlow to
calibrate the FlowCom. While running the test, you can check the calibration of the FlowCom, which will be discussed later in
this example. (If you were using Performance Trends Electronic Interface, you would calibrate the Port Flow Analyzer program
following the procedures in Appendix 5.)
Figure 4.14 Flow Bench Specs
For a SuperFlow 110, the
settings are quite simple.
Simply select Std SuperFlow
110 as the Type and most
other specs are disabled
because the program knows
what the settings should be.
Select SuperFlow FlowCom
for the Type of Electronics.
Set # Readings to 10, which is
a good compromise between
accuracy and program speed.
If you select to also record test
“Stablility”, you may want to
increase this # to 15 to 25
readings for a better reading of
“Unstbl +/-%”. See Figure
4.16.
Head: Since the head being tested is so similar to the head you are starting with, changes to the Head Specs should be few if
any. Click on the See Specs button by Head Specs. The cylinder head you will flow is a Ford small block V-8 head with 1.84"
120
(C) Performance Trends Inc 2007
diameter intake valves and 1.54"
diameter exhaust valves. Stem
diameters are 5/16" (.343").
Cylinder numbering is 1 2 3 4 and all
cylinders will be tested.
Port Flow Analyzer
Chapter 4 Examples
Figure 4.15 Head Specs for the New Test
Intake port dimensions are
approximately 4.5" long and 162
CCs. Exhaust port dimensions are
1.2" wide x 1.4" high by about 3” in
length. You estimate both ports to
be rectangular in shape. For these
port specs, when you type in a Port
CCs, Width, Height or Length, one
or more of the other specs are
recalculated to keep these specs
consistent with each other. All you
need to do is type in the specs you
know, and the other specs are
calculated for you.
Fill in other head specs you know,
like Head #, Customer name, and
any comments which are particular
to this head. Completely filling out these specs will make your past tests a valuable reference in the future. Your Head specs
menu should now look like Figure 4.15.
Head Details: For users of the Pro version, click on the See Specs button by Head Details. Check if any of these entries
match the parts or components used for this new head. Lets say in this case, very few entries match the new head. Click on
Back (ok) to return to the New
Figure 4.16 Test Options for the New Test
Test screen. Keep the Head
Most specs can be used “as is” from the XFRD 185 PTI test
Details option unchecked,
which will blank out all Head
Select to
Details once you start the New
record port
Test.
velocities
at .600”
Note that specs for any
lift. Also,
category which is uncheck
select to
(indicating the specs will be
have
blanked out) will not be
velocity
blanked out until you actually
corrected
start the New Test. This way
for the
you can view the specs with the
barometer
See Specs button and decide if
reading,
you want to keep them or blank
standard
them out.
with the
FlowCom.
Test Options: Click on
the See Specs button by Test
Options. Since the test to be
run is so similar to the test data
you are starting with, changes
should be few if any. Figure
4.16 shows a Test Options
The CFM Flow options include recording test Stability, (Unstbl
+/-%) which is useful, especially when using the FlowCom.
Select to record Barometer also, since the port
velocities will be corrected for Barometer.
121
(C) Performance Trends Inc 2007
Port Flow Analyzer
Chapter 4 Examples
menu for the conditions described below:
• These flow tests are run at lift increments of .000 .050 .100 .200 .300 .400 .500 .600 . (All these lift points will be
generated by the settings in the Test Options menu, except .050”. This will be discussed under Test Pattern.)
• The .000 Lift point is used to check leakage.
• Test pressure is held to 10" water for intake and exhaust.
• You are recording port velocities with a Pitot tube at .600" lift only, so set the Port Velocity spec Type to “Record 9
points at 1 lift” and First Lift to Record Velocity to .600.
• The FlowCom has a barometer sensor which reads pressure directly, not pressure corrected to sea level. This
barometric pressure can be used to improve the accuracy of the port velocity readings. Therefore, for the Data spec,
pick “Enter Vel (corr for Baro if FlowCom)”.
• Also, select to Record Barometer so you will know in the future what the barometric pressure was.
Test Pattern: The Test Pattern is the valve lifts and/or L/Ds, the order of the valve lifts and any repeats, and the flow bench
ranges. Check this box to keep the same pattern. For this example, checking Test Pattern will add the .050” lift point (all others
would have been created by the Test Options Valve Lift specs), and keep the Flow Bench Ranges from the XFRD185.PTI test.
Test Comment: If the XFRD185.PTI test had many detailed comments, you may want to keep them if they also applied to
this New Test. Then you could always make minor adjustments to them once the test started. However, since the
XFRD185.PTI test’s comments are very brief, you uncheck Test Comments to blank them out when you start the New Test.
Engine: The Engine Specs will provide necessary engine dimensions for more detailed analysis. It may be convenient to
keep the same Engine Specs so a direct comparison can be made between the XFRD185.PTI test and this New Test. If the
Engine Specs are the same, the only difference should be due to the cylinder head specs and flow data. Therefore, keep the
Engine Specs checked to keep them the same.
Top 4 Specs:
Now, fill out
the 4 critical specs listed at the top
of the New Test Screen as
described in Example 4.1. For File
Name, the program took the
XFRD185.PTI and changed the
last letter I to the number 1.
However, this name is not very
descriptive, so you type in the
name to MOD-FORD. Click on
Pick to pick the Operator name of
Jack used in Example 4.1. Pick a
new Head # pattern as discussed in
Section 2.4 of SBFord-0034. If
the XFRD185.PTI file had not
been opened from the
EXAMPLES folder, but instead
from, say, the SB-FORD folder,
you could use that same folder for
this new test. However, the
program does not let you save New
Tests to the EXAMPLES folder (to
prevent you from changing
example tests provided by
Performance Trends). Therefore,
click on the Add button and enter
the folder name of SB-FORD.
122
Figure 4.17 New Test Screen for Starting This New Test
(C) Performance Trends Inc 2007
Port Flow Analyzer
Chapter 4 Examples
Now, the New Test screen should look like Figure 4.17. Click on 'Start New Test' at the top of the screen. The program will fill
in the Test Time and Date based on the computer's time and date. (If your computer clock is not correct, or for most any other
reason, this time and date can be changed later by clicking on the Test Time/Date at the Main Screen.) You will be returned to
the Main Screen, which should now look like Figure 4.18.
Figure 4.18 Main Screen for Starting New Test
Click on FlowCom to
bring up FlowCom
screen showing
FlowCom readings.
Notice that Test
Comments have been
blanked out.
Click here to bring up
the Test Correction
Menu.
Keeping the Test
Pattern keeps Valve
Lift and L/D, and
Range.
Recording Data
SuperFlow recommends calculating a Test Correction for the SF 110 bench occasionally, as discussed in Section 2.10, on page
57. The start of a new test is a good time to do it. Install the test orifice supplied by SuperFlow on the bench with just the small
hole open (plug the big hole). SuperFlow says you should get from 3.5 to 5.5 CFM with just the small hole open.
Start the bench and set the Flow Bench Range to 1 and the flow direction to Intake. Follow the exact procedure as described on
page 57. Set the Leakage value on the Main Screen to 0.
You will use this New Test’s Test Data screen to calculate flow for the orifice plate. Once you have
calculated a new Test Correction Factor, you will erase any data you recorded. You are simply using the
Test Data screen as a “scratch pad”.
To record data accurately, click on FlowCom at the top of the Main Screen to open up the FlowCom screen. When the bench is
reading about 10” Test Pres and with the Range set to Range 1 on the flow bench and on the FlowCom screen, click on Record
or press <F1> to record CFM flow. The FlowCom will take the 10 readings as you have directed in the Flow Bench Specs, fill
in the 1st row in the Test Data grid with the readings, and calculate 4.8 CFM. Since this is within the 3.5 to 5.5 CFM range,
you can go to the next step. Nothing is done with this 4.8 CFM reading. See Figure 4.19.
123
(C) Performance Trends Inc 2007
Port Flow Analyzer
Chapter 4 Examples
Figure 4.19 Obtaining Test Correction Factor Data with FlowCom
Determine Flow with Small Orifice Open
Set Leakage to 0
Set 10” test pressure
on vertical manometer
with Range #1. (Note
that this FlowCom
screen shows
readings for 2nd row.
The FlowCom screen
automatically
advances to the next
row after recording
data.
47.3
4.8
Click on Record or
press <F1> to record
CFM with the small
orfice open.
4.8 CFM recorded for
the small hole only.
This verifies there
are few if any leaks
as 4.5 CFM is the
number you should
get for the small hole.
Determine Flow with Both Orifice Holes Open
Set a higher range
to record about 150
CFM flow
0
Adjust Test Pressure
to get about 10”
Click on Record or
press <F1> to
record 151.6 CFM
fl
Click on Close to
return to Main
Screen.
124
(C) Performance Trends Inc 2007
Port Flow Analyzer
Chapter 4 Examples
Now you need to obtain the flow reading with both holes of the orifice open. Open both the big and small holes of the orifice
plate. Set the Range to Range 9 on both the flow bench and on the FlowCom screen. When readings have stabilized, record the
flow reading.
The old Test Correction was 1.021. For the new test, you obtained 151.6 CFM with the test orifices which SuperFlow rates at
153.2 CFM. Close the FlowCom screen and click on the Test Corr box to bring up the Test Correction calculation screen shown
in Figure 4.20. Type in your results of 151.6 with a standard orifice plate rated at 153.2. This gives a new Test Correction of
1.032. This means the program will increase all CFM data 3.2% because the bench appears to be reading about 3.2% too low.
Note that the math here is not straightforward, because the 151.6 CFM reading was calculated using a Test Correction of 1.021.
Without this correction, the CFM flow would have been 148.5 CFM (153.2/148.5 = 1.032). See Figure 4.20.
Click on the Use Calc Value at the bottom of the Test Correction menu to load in this Test Correction. The program asks if
1.032 should be saved as the Test Correction for the Master Flow Bench specs also. Answer Yes, which means for all New
Tests, 1.032 will be used until you go through the procedure again. Notice that the 151.6 CFM you recorded changes to 153.2
CFM with the new Test Correction of 1.032. This shows the Test Correction is working correctly because 153.2 CFM is what
SuperFlow says the orifice should flow.
The Test Correction should always be between .900 and 1.100 and should not change much from time to time.
If it was unusually high or low, or very different from the previous Test Correction, the program would warn
you to check for errors. Performance Trends suggests not to overdo recalculating the Test Correction factor.
Checking the Test Correction every 5 to 10 tests is about right. If the Test Corr stays pretty constant, you have a
good flow bench and are probably doing things correctly. If the Test Correction changes a lot from check to
check, you probably have a problem with the bench (intermittent leaks), are misunderstanding the procedure, or
a not doing things the same from check to check.
Figure 4.20 Calculating Test Correction Factor
Click on Test Corr box
to open Calc Test
Correction menu.
Select this option to
type in CFM readings
0
Type in the CFM flow
you obtained with the
orifice plate.
Click on Use Calc
Value button to use
the new Test
Correction.
Click on Yes to keep
this Test Correction
with the Master Bench
Specs.
125
(C) Performance Trends Inc 2007
Port Flow Analyzer
Chapter 4 Examples
Now remove the orifice plate and install the head on the bench with the correct bore adapter to flow Cylinder #1's intake port.
(Be sure to record the bore adapter diameter in the Test Options menu.) It is necessary to first measure the CFM leakage.
Perform the check just as done for the orifice plate: set leakage to zero, close the valve and close off the port with tape, record
flow with the FlowCom at Range 1, close FlowCom screen and type in the Leakage flow recorded of 2.2 CFM. As in Example
4.1, after entering 2.2 CFM Leakage, the CFM for Row 1 goes to zero. This shows the leakage correction factor is working
properly.
Remove the tape from the port and open the FlowCom screen again. Since the first row at .000 valve lift has been filled in with
the Leakage data, select Data Point #2 from the FlowCom screen. Notice that row #2 is now highlighted in the Test Data grid
and the valve lift and Range from row #2 are filled in on the FlowCom screen. All you have to do is set the valve lift, set the
Range and readjust flow control to maintain approximately 10" Test Pres. When this has been done, click on the Record
command or press <F1>. The program will take 10 readings, average them, calculate CFM and fill the results in the Test Data
grid, and advance to the next row. If the head being tested flows significantly different than the old head, you may need to
change the Range on the FlowCom screen as needed.
Figure 4.21 Recording Data with FlowCom
After reopening the
FlowCom screen after
entering the Leakage #,
click on Data Point #2
to advance to Row #2,
.050” valve lift.
Note that Valve Lift &
Range #s are loaded
from the data already
entered for this row in
the Test Data grid.
All you need to do is
set Test Pressure to
about 10”, set the
range on the flow
bench, and then press
<F1> to record data.
The program points
out settings not the
same between the
Port Flow Analyzer
and FlowCom. These
differences may not
be important. See
Tips on this page.
Tips using FlowCom:
The FlowCom can also calculate CFM based on readings which you must “type” into it. Typing into the FlowCom (basically
pressing buttons like a hand calculator) is cumbersome and really is not even necessary. The Port Flow Analyzer is really only
using the FlowCom to read pressures, temperatures, barometer and possibly swirl or tumble. It does not use the FlowCom’s
Range settings, leakage #, test pressure or flow direction (except for SF 1020 benches). Therefore, you do not need to make any
changes to the FlowCom during the running of a test. The program is notifying you of difference between the FlowCom
settings and the program settings mostly to explain why the FlowCom’s CFM may not match what the program is calculating. If
the program’s entries and flow bench specs are correct, then the CFM recorded by the program is correct.
126
(C) Performance Trends Inc 2007
Port Flow Analyzer
Chapter 4 Examples
Tips using FlowCom, cont:
Although many FlowCom settings are not critical, the calibrations of the pressure and temperature sensors are critical.
Whenever you are recording data, double check that the manometers and dial thermometers are agreeing with the readings in the
Port Flow Analyzer program. Pressures are more critical and should agree within 0.2 “ for Test Pressure and within 1% for
Flow Pressure. Temperatures should agree within 3-5 degrees. If you are noticing difference greater than this, recalibrate your
FlowCom following SuperFlow’s recommendations.
Figure 4.22 Port Velocity Question after Recording Flow Data at .600 Lift
Recording Port
Velocity Data
After you have
recorded CFM data at
.600 Lift, the program
will ask “Record Pitot
Tube Velocities for
.600 Valve Lift?”
(Figure 4.22) because
you selected to record
Port Velocities at just
.600 valve lift in the
Test Options menu.
Click on Yes and the
FlowCom screen and
the Main Screen will
Figure 4.23 Recording Port Velocity (Pitot Tube) Data with FlowCom
Select which Velocity
Point (Port Locations 19) here. When
recording, this
advances automatically.
Click here to start or
stop recording port
velocity readings.
Press <F1> to record
port velocity when you
have the pitot tube in
the proper port location.
Port Velocity displayed
in black, CFM in gray
when recording port
velocity.
Port Locations 1-9
shown in Port Layout
diagram and at top of
each column.
Velocities are entered
automatically into the
Test Data grid.
127
(C) Performance Trends Inc 2007
Port Flow Analyzer
Chapter 4 Examples
be somewhat rearranged to record Port Velocity readings. See Figure 4.23.
Position your Pitot tube in each of the 9 port locations indicated on the screen. While holding the Pitot Tube, press the <F1>
key (easier than clicking on RecordVel). The computer will take 3 readings to average together as the port velocity for that port
location. The average velocity will be loaded into the Test Data grid, and the data point will be advanced to the next location.
When all 9 points have been recorded, the FlowCom screen will be converted back to that used for recording CFM flow.
Remaining Ports
Now set up the head and flow bench to flow the exhaust port of #1 cylinder. Advance to Exhaust Port #1 in the program by
closing the FlowCom screen and clicking on the “Exh #1” tab at the top of the Main Screen. The exhaust data pattern remaining
from the XFRD185.PTI file is shown. Measure leakage and then record data with the FlowCom as done for the intake port.
When you have set and recorded CFM data for .600" lift, then record Pitot tube velocities as done with the intake port.
Continue flowing the remaining ports using the old data from the XFRD185.PTI file as the pattern.
After flowing the entire cylinder head, be sure to save your test file by clicking on File at the top, left of the Main Screen, then
clicking on Save. Reports and graphs as shown in Examples 4.3 and 4.4 are now possible.
Note: There are many alternate ways to perform this flow test. For example, flow all the intake ports and then all the exhaust
ports. This example is only one method used to illustrate the Port Flow Analyzer's commands and options.
128
(C) Performance Trends Inc 2007
Port Flow Analyzer
Chapter 4 Examples
Example 4.3 Analyzing
Cylinder Head Performance
The Port Flow Analyzer provides the user with a number of methods for comparing cylinder head performance, especially the
Pro version. Cylinder heads designed to operate on the same engine can be compared as well as cylinder heads from different
engine designs. This example assumes the user has already input the data and two Test Files exist, XCHV600.PTI and
XCHVSTK.PTI which come with the Port Flow Analyzer program in the Examples folder.
Note: Files XCHV600.PTI and XCHVSTK.PTI have been changed to “Example SB Chevy on SF 600” and “Example SB
Chevy Stock” in version 3.5.
XCHVSTK.PTI is a basically stock head with 1.94/1.50 valves, flowed at 20" test pressure (before porting). XCHV600.PTI is a
test of the same head with major porting and 2.02/1.60 valves installed, flowed at 25" test pressure (after porting).
At the Main Screen, click on File, then Open (from all saved tests) to open the Flow Test Library. Open a copy of the
XCHVSTK.PTI data from the Examples folder. The program will return you to the Main Screen.
Calculated Data Reports
Select Reports from the Main Screen to obtain the Reports Options
menu. Click on the down arrow key for “Types” of reports to open a
list of Report Types. Before you do comparisons, it may be best to look
at a report of Calculated results for 1 head. Select the Report Type of
Int & Exh Calculated Results. Set the other report options as shown in
Figure 4.24. These settings will produce a report of Intake and Exhaust
Calculated Data, averaging all ports together, where the intake and
exhaust results are both corrected to a test pressure of 25 “.
Figure 4.24 Report Options Menu
Trends to look for in calculated results, in reference to Figure 4.25
include:
• Corr CFM increases as valve Lift increases.
• VlvArea (valve area) increases with valve lift up to a point,
then "tops out" at an L/D of .25 (valve lift equal to 1/4 of the
valve's diameter). That is because now the limiting area is the
valve throat area which does not increase with valve Lift.
• FlwArea (flow area) increases as CrCFM increases. The better
flowing the head, the higher the FlwArea.
• Flow Coef or Flow Coefficient is an efficiency rating of the
port and valve at each lift. The higher the Flow Coefficient, the higher the flow for the size of the valve or Vlv Area.
A Flow Coef of 1.000 indicates the valve and port are very well designed for the size of the valve. A Flow Coef of .4
to .5 indicates the port and valve have a good amount of untapped potential. See Section 3.1 on Reports.
Note: As mentioned in Section 3.1, the setting of Use Seat Angle to Calc Vlv Area in the Preferences menu
has a large effect on the VlvArea and Flow Coef calculation. In these examples, this spec is set to No to be
consistent with the Basic version of Port Flow Analyzer and our Engine Analyzer programs.
129
(C) Performance Trends Inc 2007
Port Flow Analyzer
Chapter 4 Examples
Figure 4.25 Report of Int & Exh Calculated Results Averaged Across All Ports
The Port Type (Int vs Exh) and the number of data points averaged together are shown here.
Click on Report Types to open up the Reports Options menu.
This section shows a summary of critical specs for this head and test.
•
•
•
Flow Coef for most all ports is generally highest at low lifts and steadily drops as lift increases to an L/D of .25. At
L/D greater than .25 Flow Coef may start to increase again. (Occasionally, Flow Coef may drop at very low lifts, L/D
less than .05.)
Since these heads are stock, the somewhat poor Flow Coefs being in the range of .4 to .6 is to be expected and does
indicated that there is potential for a large improvement with porting.
The %E/I should generally be between 60% and 90% for most all lifts. This head shows a range from 55% to 65%
which is somewhat lower than expected. However, remember that this simple calculation does not consider the cam
profile, which has a lot to do with what the engine actually “sees”. See the more accurate % Exh/Int calculation based
on cam profile discussed in Section 3.1, page 78 and in Example 4.4.
Comparison Reports (Pro version only)
Click on the Report Types menu command shown in Figure 4.25. to open the
Report Options menu to select a new Report Type. This time select Compare
Tests - CrCFM @Lift. This report will compare the CFM of the Current Test
XCHVSTK.PTI with the CFM of another test you can pick from the library
at approximately equal valve Lifts (Figure 4.26).
At the Report Options menu, notice that the Which Cylinders spec is
disabled. That’s because comparison reports always compare the Average
data for all cylinders. Intake and Exhaust Test Pressure are being used in the
menu for making the report, because all comparison reports correct the data
to this Test Pressure to ensure you are making valid comparisons. In this
example, one test was recorded at 20" and one was recorded at 25". Both
tests will be corrected to 25" for the comparison report as shown in Figure
4.26.
130
Figure 4.26 Report Options Menu
(C) Performance Trends Inc 2007
Port Flow Analyzer
Chapter 4 Examples
Figure 4.27 Picking a Test File for Comparison
1) Click on OK to clear this
message.
2) Click on the XCHV600.PTI
test file for comparison to
highlight it and obtain a
Preview.
3) Then click on Open to Open
this file XCHV600.PTI for
comparing to the XCHVSTK.PTI
test file.
Click on the Make Report button in the Report Options menu. You will be shown the Flow Test Library where you can pick the
test to compare with the current test. You highlight XCHV600.PTI and click on the Open button. See Figure 4.27.
Figure 4.28 Comparison Report Displayed with Printer Menu
Click here or here
to obtain the Print
Results Options
menu.
Click and drag
slide bar down to
display all the
Comparison
Report results on
the screen.
Select your
options for the
printout, then click
on the Print
Report button to
print the report.
131
(C) Performance Trends Inc 2007
Port Flow Analyzer
Chapter 4 Examples
When the report is completed, you are presented with a screen similar to Figure 4.28. Figure 4.28 also shows the Printer menu,
which is obtained by clicking on the Printer menu command or the Printer button.. With options selected in the Printer menu,
you will obtain the printed report shown in Figure 4.29.
Figure 4.29 Printout of the Compare Tests - CrCFM @ Lift Report
NOTE: Version 3.5 has greatly expanded the ability to compare individual
ports on one head or between different heads in reports. Check “Cyl-Cyl
Comparison Reports” in Appendix 7.
V3.5 B also has advanced Head Porter graph features. See Appendix 9.
132
(C) Performance Trends Inc 2007
Port Flow Analyzer
Graphs
Chapter 4 Examples
Figure 4.30 Graph Options Menu
One way to check data for possible testing errors or port flow problems is
to graph all cylinder's flow data together. This is done in the small
Summary Graph at the Main Screen. You can also produce a larger
version of this graph by clicking on Graph at the top of the Main Screen.
You will open the Graph Options menu shown in Figure 4.30. Select the
Graph Type of Corr Int & Exh CFM, Correct to New Test Pres to No,
Which Cylinders to All Cylinders, and Horizontal X Axis to Lift, inches.
You should obtain a graph as shown in Figure 4.31.
Figure 4.31 points out a couple of things:
• Most all port's flow curves are relatively smooth and show CFM
always increasing with increasing lift. This indicates no major errors
in entering the data.
• Cylinder #1's intake flows much better than the others intakes, which
may be indicating some type of test error.
• First, examine the raw data from cylinder #1. For example,
perhaps an incorrect Leak CFM was entered for this cylinder.
• You may want to repeat this test on cylinder #1. Perhaps a leak
developed during the test, after Leak CFM was measured.
• If you then believe cylinder #1 flows significantly better than the
other cylinders, examine #1 intake port. You may see what makes it better and incorporate that characteristic into the
other ports.
• Cylinder #7's exhaust has a sharp bend at .300" Lift, again indicating a possible test error. You may want to double check
this point.
Figure 4.31 Graph of Intake and Exhaust CFM for All Cylinders
Note that Cylinder
#1’s Intake flow is
significantly higher
than the other
cylinders at most all
points.
Note the sharp bend
in the Exhaust flow
curve for Cylinder #7
at .300 lift.
133
(C) Performance Trends Inc 2007
Port Flow Analyzer
Figure 4.32 Adding a Test to the Graph for Comparison
Chapter 4 Examples
Click on Add Test to
open the Open Test
File screen to add
another test to the
graph.
Find the test you
want to include in the
graph and click on it
to highlight it. You
may need to search
in different Folders.
After you have clicked
on (highlighted) a
test, click on the
Open button to add it
to the graph.
The Port Flow Analyzer also provides the user with the option of graphing data from 2 different heads on the same graph, called
Multiple Tests graphs. From the Graph Screen, click on Add Graph to obtain the File Open screen for the entire Flow Test
Library. Find the XCHV600.PTI test file in the Examples folder and click on it. This will add this test to the graph. (In the Pro
version, you may also get some additional tests added, which were in the History Log and marked “Yes” to graph. If this is the
case, click on History Log at the top of the Graph screen, and “un-mark” all tests other than XCHV600.PTI and the current test
XCHVSTK.PTI for graphing.)
Figure 4.33 Comparison Graph of Current Test XCHVSTK.PTI with XCHV600.PTI, All Cylinders
Because you
did not ask to
correct to a
new test
pressure, all
tests are
corrected to
the test
pressure of the
Current Test.
Notice that all
the cylinders
for the added
test are now
included in the
Legend.
The graph can
appear quite
cluttered,
especially in
black & white.
134
(C) Performance Trends Inc 2007
Port Flow Analyzer
Chapter 4 Examples
You can see that Figure 4.33 looks quite cluttered. If you click on Graph Type to open the Graph Options menu, you can
change the Cylinders to Graph from All Cylinders to Average for Head. This will produce the graph of Figure 4.34, where you
can more easily see that both the intake and exhaust of the XCHV600.PTI head flow much better than the XCHVSTK.PTI head.
The exhaust on the modified port flows as well as the intake on the stock port.
Fig 4.34 Comparison Graph of Current Test XCHVSTK.PTI with XCHV600.PTI, Avg Cylinders
Click on Graph Type
to open the Graph
Options menu. Then
select Average for
Entire Head instead
of All Cylinders for the
Cylinders to Graph.
Then click on Make
Graph to produce this
graph.
Values at the cursor
line are shown here.
Other cursor buttons
let you move the
cursor left or right.
Click on the Cursor
button or on a data
point on a graph line
to bring up the
cursor. The values
of the graph lines at
the cursor are
displayed in the
legend.
NOTE: Version 3.5 has greatly expanded the ability to compare individual
ports on one head or between different heads in graphs. Check Appendix 7.
Engine Graphs (Pro Version Only)
Another feature in the Pro version of Port Flow Analyzer is the ability to combine the head's flow curve with a cam profile for
even more in-depth analysis. After all, how a head flows at a particular lift is only important for the amount of time the cam
holds the valve at that lift. For example, how a head flows at .700" lift is not important if the cam only lifts the valve to .550"
lift.
First, set the current Engine Specs to match an engine and cam you want to investigate. Click on Engine at the top of the Main
Screen to obtain the Engine Specs menu shown in Figure 4.35. The Port Flow Analyzer provides several ways to fill in these
cam and engine specs. You can:
• Enter or change any of these specs individually
• Click on the Cam Type combo box and pick an Example Cam to fill in most of the cam specs with one of the hundreds
of example cams provided with the program
• Or click on File, then Open Example Engine (provided by Performance Trends) or Open Saved Engine (an engine which
you have previously saved).
135
(C) Performance Trends Inc 2007
For this example, click on File, then Open
Example Engine, then find the
X350MOD.PTI engine file and open it.
These specs represent a 350 Chevy with
230 duration cam with 105 lobe centers.
Then click on Back (ok) to close the
Engine Specs menu and return to the
Main Screen. At the Main Screen, click
on File, then Save to save the
X350MOD.PTI engine specs to the
XCHVSTK.PTI test file.
Port Flow Analyzer
Chapter 4 Examples
Figure 4.35 Engine Specs Menu
Click on File, the Open Example Engine to find and
open the X350MOD.PTI engine file.
Click here and pick the “Pick Example Cam”
to load in cam specs from hundreds of
example cams provided with the program.
Next, Open the XCHV600.PTI test file
by clicking on File, then Open (from all
saved tests) at the Main Screen. Back at
the Main Screen, click on Engine to open
up the Engine Specs screen for this test
file. Again, open the example engine file
X350MOD.PTI, then click on Back (ok)
to return to the Main Screen. Then save
this file with these same engine specs.
Now you know that the 2 heads (test
files) you want to compare are combined
with the exact same engine specs. Any
difference you see now in engine analysis
will be due only to the head differences.
At the Main Screen, click on Graph, then
select the Graph Type of “Int & Exh
Flow Area+VlvLift”. Then click on
Make Graph to produce a graph similar to that shown in Figure 4.36.
Figure 4.36 Valve Lift and Flow Area Graphs
The XCHV600.PTI test shows
significantly higher Flow Area,
especially at higher valve lifts.
The Legend includes the total
Flow Area and Lobe Area for all
Flow Area and Valve Lift graphs.
See Section 3.1, Engine
Performance Estimate report for
an explanation of these areas.
The Valve Lift graphs are directly
on top of each other for the 2
tests. This confirms the both test
files are using the exact same set
of Cam Specs.
136
(C) Performance Trends Inc 2007
Port Flow Analyzer
Chapter 4 Examples
Notice in the graph legend the numbers labeled IFAr and EFAr. This is the Intake and Exhaust Flow Areas graphed. These will
match the flow areas given in Eng. Performance Estimate reports as discussed in Example 4.4. Table 4.1 shows a comparison of
the 2 heads with this particular cam.
Table 4.1 Flow Area Comparison of 2 Heads
Test (head)
XCHVSTK.PTI XCHV600.PTI
IFAr
224
296
EF Ar
155
210
% Exh/Int
69%
71%
Improvement
32%
35%
2%
Table 4.1 shows that with this cam, the heads flow 32% better on the intake and 35% better on the exhaust. The % Exh/Int has
also increased from 69% to 71%. If you did this same comparison with a different cam, the results would be different. For
example, if you specified a larger exhaust cam lobe or rocker arm ratio, the % Exh/Int would increase.
137
(C) Performance Trends Inc 2007
138
Port Flow Analyzer
Chapter 4 Examples
(C) Performance Trends Inc 2007
Port Flow Analyzer
Chapter 4 Examples
Example 4.4 Engine Performance
Estimate Report (Pro version only)
The Pro version of Port Flow Analyzer provides an engine performance prediction function allowing the user to compare
cylinder head, camshaft, and other variables on predicted torque, horsepower, idle vacuum, etc. The Eng. Performance Estimate
reports are made at the estimated torque peak and horsepower peak RPMs. The following example will demonstrate how this
predictive feature can be used to evaluate cylinder head and camshaft modifications on engine performance.
Note: Performance Trends Engine Analyzer programs (standard and Pro versions) can do much more
detailed and accurate estimates of engine performance. The calculations done in the Port Flow Analyzer are
rather simplistic compared to these more detailed programs.
This example will assume your customer has a 350 Chevy (750 CFM carb, single plane manifold with a mild cam) which sees
some drag strip use, but is primarily for the street. His current heads are the XCHVSTK.PTI heads in the Flow Test Library.
You have just finished installing 2.02/1.60 valves, porting and flowing these heads. These are the XCHV600.PTI heads in the
Test File Library. You want to estimate a HP potential improvement and determine if the current cam is sufficient.
At the Main Screen, click on File, then Open (from all saved tests) to open the XCHVSTK.PTI test file from the Examples
folder. Back at the Main Screen, click on Engine to open the Engine Specs menu. At the Engine Specs menu, click on File,
then Open Example Engine to open the X350MLD.PTI engine file. The program displays the Example Engine Library provided
with the program by Performance Trends. These files represent different engine/camshaft combinations which have been
created with the Port Flow Analyzer. You can also add other combos to a similar library called Saved Engines. Click on
X350MLD.PTI and then click on
the Open button.
Figure 4.37 Engine Specs Menu
Click on File, the Open Example Engine to find and
The program will return you to the
open the X350MLD.PTI engine file.
Engine Specs menu so you can see
File Name of current Engine Specs
the specs for this file. Also note
that the Current Engine is
X350MLD.PTI at the top of this
menu. While reviewing the Engine
Specs data file for X350MLD.PTI,
you see it is a 4.00 x 3.48 350 CID
V-8 with 9.3 compression, and a
very mild cam. (The MLD in
X350MLD.PTI stands for mild
cam.) Return to the Main Screen by
clicking on Back (ok) at the top left
of the menu or pressing the <Exc>
key. (This is very similar to what
was done in Example 4.3 to make
Engine Graphs.)
By opening the XCHVSTK.PTI
Flow Test and the X350MLD.PTI
Engine Specs file, you have
basically "installed" the
XCHVSTK.PTI heads on the
X350MLD.PTI engine.
139
(C) Performance Trends Inc 2007
Port Flow Analyzer
Chapter 4 Examples
At the Main Screen, select the Make Reports option, and pick the Report Type of Eng. Performance Estimate. All other Make
Reports specs are now disabled as they have no affect on the report. Click on the Make Report button to make the report.
The calculated results are displayed on the computer screen, and you can click on the slide bar buttons on the right to display all
the results on the screen. See Figure 4.38. Figure 4.39 is a printed hardcopy of this report obtained by clicking on the Print
command or Printer button at top of the Reports screen. Important values are summarized in Table 4.2 in Column A. Major
points illustrated by Figure 4.39 include:
•
•
•
•
•
•
The report indicates a stock torque peak of 376 ft lbs at 3600 RPM and a stock HP peak of 285 HP at 4600 RPM.
(These figures may look high, but the Port Flow Analyzer is basically assuming a "race engine" condition. This is the
engine's potential with open race headers, race intake, 29.92 barometer and 60 deg F correction factor, high octane fuel
and optimum spark advance, minimum accessories, etc.)
At the HP peak RPM of 4600, the piston speed is a relatively “low stress” 2668 ft/minute.
For this low revving engine combination, the program used an intake runner with 1.79" diameter runners on the intake
(10" long). This diameter is not necessarily optimum, but is the Avg Port Dia in the XCHVSTK.PTI head specs. The
program chose to use 1.5" headers with 52.2" primaries (as measured from the intake valve). These are the runner
specs which produced the estimated torque and HP. Much more detailed simulations are available with the
Performance Trends line of Engine Analyzer programs.
The program recommends a much smaller intake port volume of 137 CCs versus the existing 186 CCs. (This will
change with a different selection of cam, or different intake than what the program is assuming, or heads with different
flow capabilities.)
An estimated idle vacuum of 14.6 " Mercury. Although his engine may actually idle at a different vacuum, this number
is useful to judge any change in idle vacuum from changes in head flow or cam specs.
The total % Exh/Int Flow Area for these heads with this cam is a very acceptable 75.8 %.
Figure 4.38 Engine Performance Estimate Report
Click here to
print report.
Click and
slide this
button
down to
see all of
the report.
Section
describing
estimated
torque peak.
Section
describing
estimate HP
peak.
140
(C) Performance Trends Inc 2007
Port Flow Analyzer
Chapter 4 Examples
Figure 4.39 Printout of Eng. Perf. Estimate Report (original XCHVSTK.PTI heads, mild cam)
141
(C) Performance Trends Inc 2007
Port Flow Analyzer
Chapter 4 Examples
Figure 4.40 Printout of Eng. Perf. Estimate Report (ported XCHV600.PTI heads, mild cam)
142
(C) Performance Trends Inc 2007
Port Flow Analyzer
Chapter 4 Examples
Return to the Main Screen by clicking on Back (ok) and open the XCHV600.PTI flow test file. Go into the Engine Specs and
open the X350MLD.PTI engine file, then click on Back (ok) to return to the Main Screen. Click on Reports and make another
Eng. Performance Estimate report. These calculations will be for the same short block (Engine Specs) with the new ported
heads with larger valves. A summary of important parameters is given in Table 4.2 in Column B.
Table 4.2 shows a torque increase of 16 ft lb, and a HP increase of nearly 100 HP. Although you (the head porter) think this is
quite good, the customer seems disappointed. So you run another report, this time with a bigger cam.
You return to the Main Screen and go into the Engine Specs menu and open the X350MOD.PTI Example engine file. This has a
much larger, solid cam and slightly higher compression ratio. You make another Eng. Performance Estimate report, which is
summarized in column C in Table 4.2.
With the cam and compression change, you show the customer the heads have the potential of nearly 500 HP at 6500 RPM.
However, you caution him that revving the engine to 6500 increases the stress on the rods and pistons. Piston speed has
increased from the stock 2668 at the HP peak to 3770 ft/min. If he were to rev this new, proposed engine to 6500 or beyond,
he will need "race engine" quality internal engine parts.
Table 4.2 Comparison of Performance Potential of Different Combos
Heads
Cam/Eng
Peak Torque
Peak Tq RPM
Peak HP
Peak HP RPM
Piston Speed
Rec Int Port CCs
Idle Vac
% Exh/Int
XCHVSTK.PTI
(A)
XCHVMLD.PTI
376
3600
285
4600
2668
137
14.6
75.8
XCHV600.PTI
(B)
XCHVMLD.PTI
392
4600
378
5400
3132
161
13.0
78.8
XCHV600.PTI
(C)
XCHVMOD.PTI
430
5100
486
6500
3770
193
14.1
71.0
Additional points shown in Table 4.2 include:
•
•
•
The recommended Intake Port Volume increased with an increase in head flow potential and cam size. The higher the
engine's operating RPM range, the larger the required port volume.
Idle vacuum dropped about 1.5" with the better flowing XCHV600.PTI heads with larger valves. However, the
X350MOD.PTI engine with higher compression and wider lobe centerlines increased the idle vacuum back to about
14".
The % Exh/Int flow area remained in an acceptable range of around 75% for all combinations. The last combo showed
only 71.0% which is slightly less than recommended “rule of thumb” 75%. The X350MOD.PTI cam may require a
couple degrees more exhaust duration or higher exhaust rocker arm ratio to obtain the desired 75%. (If this engine was
going to use nitrous oxide or be supercharged, you would want to shoot for 85% Exh/Int.)
143
(C) Performance Trends Inc 2007
144
Port Flow Analyzer
Appendicies
(C) Performance Trends Inc 2007
Port Flow Analyzer
Appendicies
Appendix 1: Accuracy and Assumptions
Assumptions:
The following paragraphs list some of the major assumptions made by the Port Flow Analyzer. These assumptions will help you
understand the calculations and limitations of the program. Other assumptions are listed in this manual and can be located
through the Index under Assumptions:
Measurement orifices for custom benches are "sharp edged" orifices whose flow is proportional to the square of the
pressure drop (Flow Pressure).
The flow through the cylinder head's port and valve is proportional to the square of the pressure drop (Test Pressure),
similar to a "sharp edged" orifice.
Eng. Performance Estimates in the Pro version are based on numerous assumptions and should be only used for
comparisons. Your actual engine performance may differ significantly. The Port Flow Analyzer assumes "race engine"
conditions, so its estimates may be higher than your engine. Performance Trends’ Engine Analyzer programs can provide
more accurate estimates of engine performance. See Example 4.4.
Accuracy:
There are many types of calculations being performed by the Port Flow Analyzer. The accuracy of two major types is discussed
below.
CFM Measurements:
CFM measurements are based on the process for calculating CFM outlined on page 17 under CFM. Since the computer’s
calculations are the same as calculations done by hand, you may be surprised to find that the Port Flow Analyzer will probably
improve CFM measurements calculated by hand. These accuracy improvements come from:
•
•
•
•
Correcting for small errors in maintaining Test Pressure.
Reducing "round off" errors.
Ensuring that all calculations are performed exactly the same way and proper way for each data point.
Recording data electronically with SuperFlow’s FlowCom (tm) or Performance Trends Electronic Interface can
significantly improve accuracy and repeatability (and save time). One reason is because the Port Flow Analyzer takes
several readings to average together for the final, recorded reading. This improves accuracy, especially for reading
“bouncing” manometers. The electronics also have greater reading resolution, where they can read the difference
between 70.1% vs 70.2% Flow Pressure. The human eye can not see differences that small.
Although, the procedures listed above (except for those concerning electronics) can all be done with hand calculations, by
making these steps automatic and easy, they are more likely to actually happen all the time.
Any errors in Flow Bench Specs, and Flow Pressure, Test Pressure, Flow Temperature, Test Temperature, Leak CFM
measurements (or Test Correction Factor for SF 110 benches) entered into the program will result in errors in CFM calculations.
All measurements have small measurement errors associated with them. The more measurements which enter into a calculation,
the more likely chance for significant errors. However, some measurements are more important than others. For example, a 5
degree error in temperature is not as important as a 5% error in Flow Pressure.
145
(C) Performance Trends Inc 2007
Port Flow Analyzer
Appendicies
In general, the accuracy of production flow benches (with "flowed" measurement orifices) near their maximum flow rate should
be within 3% of true CFM. At low flow rates, the accuracy will be worse. Custom flow benches can give very repeatable
numbers. However, unless they are calibrated carefully, their accuracy is likely to be worse than production flow benches. See
Appendix 2 and Appendix 3 for tips to minimize measurement errors.
Report of Eng. Performance Potential:
This report is meant only as a guide to show general trends for various combinations of head flow, cam specs and engine specs.
Section 1.3 A Word of Caution, 3.1 Reports and Example 4.4 describe the limitations of these calculations.
Repeatability:
The difference between repeatability and accuracy is a concept few people understand. Graphically, accuracy and repeatability
is shown in Figure A.1. Think of the flow bench as an "archer" which is trying to hit the "bulls eye" or the true CFM
measurement. Let's say the true CFM was 150 CFM, but one flow bench always comes up with values between 142 to 143
CFM. This flow bench is not very accurate, but is very repeatable (only a 1 CFM spread in data). Another flow bench comes
up with measurements which
Figure A1
vary from 145 to 155 CFM,
Repeatable Measurements
Accurate Measurements
which average out to the true
150 CFM. This flow bench
produce the same readings, test
produce a reading which is close
after test, but the reading may
to the true reading, which is a
with the 10 CFM spread in
not be the true CFM.
reading other accurate flow
data is not nearly as
bench testers would get.
repeatable as the first, but is
more accurate.
Ideally, you want both a
repeatable and accurate flow
bench, but this is not always
possible. When are accurate
measurements and repeatable
measurements most
desirable?
• If you very
accurately want to
determine if a modification (for example, changing the "short side radius" of a port) has improved the flow, the
repeatable flow bench is the one to use.
• If you want flow numbers to use in a magazine article, for other people to compare their flow numbers with, you are
better off with the accurate flow bench.
• If you want flow numbers to use in an engine simulation computer program, you are better off with the accurate flow
bench.
The concepts of repeatability and accuracy are further examined in Appendix 3.
146
(C) Performance Trends Inc 2007
Port Flow Analyzer
Appendicies
Appendix 2: Calibrating a Custom Flow
Bench
The Port Flow Analyzer can be configured to work with custom flow benches. The program works best if the bench measures
air flow by measuring the pressure drop across an orifice, like typical SuperFlow benches. The custom bench can be either
Orifice Center like a SuperFlow 300 or 600, of Blower Center like a SuperFlow 110. See Section 2.0, page 12, for Orifice
Center vs Blower Center flow bench definitions.
You can also use an air measurement which reads in CFM directly and set the Test Option of CFM Flow to "Enter CFM
Directly". For other types of benches (Pitot tube, laminar air flow, etc), contact Performance Trends for details.
Manometers
The manometers to measure pressure are critical for accurate air flow measurements. Dwyer Instruments (Michigan City,
Indiana at 219-879-8000) is a good source if you purchase manometers. This appendix also discusses "home made"
manometers.
Vertical manometer to measure Test Pressure
Purchased vertical manometers are usually calibrated in inches of water and can be used directly. Home made vertical
manometers are easy to construct as shown in Figure A.2. You can use a standard ruler or yardstick if the fluid is water. Other
fluids require different scales.
Note: Home made manometers are easy to over-pressure and blow the water out, requiring refilling. Also, the water can get
into your bench causing problems.
Figure A.2 Calibration of Custom Vertical Manometer
147
(C) Performance Trends Inc 2007
Port Flow Analyzer
Appendicies
Inclined manometer to measure Flow Pressure
The inclined manometer is not as simple. Because it is on an angle, you can not use a standard ruler for the scale without some
modification.
You can use a standard Dwyer #244 or #246 manometer calibrated in inches of water. In the Flow Bench Specs menu, first
specify the bench Type is Custom. Then set up the 3 Bench Specs in the program as follows:
Dwyer Part #
Flow Bench Specs for Inclined
Flow Manometer:
Full Scale Reading
Full Scale Pressure
Linear Scale (like a ruler)
#244 (0-4")
#246 (0-6")
4
4
I
6
6
I
If you are using a home made inclined manometer, you must calibrate it as shown in Figure A.3.
Figure A.3 Calibration of Custom Inclined Manometer
148
(C) Performance Trends Inc 2007
Port Flow Analyzer
Appendicies
Calibrate Custom Bench's Flow Ranges:
To calibrate the bench, you must make some calibration, sharp-edged orifice plates. These will be installed where the head is
usually installed. Ideally you will make 1 plate close to 85% of the maximum flow for each range, however you may get by
with 1 orifice to cover 2 ranges. Use Table A.1 for estimating the size of the orifice needed for each range:
Table A1: Calibration Orifice Diameter to give about 85% of Full Scale Flow at Specified CFM
Full Scale CFM
50
100
150
200
300
400
500
600
800
1000
1500
2” water
1.5
2.125
2.625
3
3.625
4.25
4.75
5.25
6
6.75
8.25
4” water
1.125
1.75
2.25
2.5
3.125
3.625
4
4.375
5
5.625
6.875
6” water
1.125
1.625
2
2.25
2.75
3.25
3.625
4
4.625
5.125
6.25
8” water
1.125
1.5
1.875
2.125
2.625
3
3.375
3.625
4.25
4.75
5.875
10” water
1
1.375
1.75
2
2.5
2.875
3.125
3.5
4
4.5
5.5
12” water
1
1.375
1.625
1.875
2.375
2.75
3
3.375
3.875
4.25
5.25
14” water
.875
1.25
1.625
1.875
2.25
2.625
2.875
3.25
3.75
4.125
5.125
For example, assume:
• Your inclined manometer for reading Flow Pres has a Full Scale of 6".
• You estimate that Range #3 will flow 300 CFM at your desired test pressure of 28".
Table A.1 says you should make a 2.75" diameter orifice plate to calibrate Range 3.
The process of calibrating each range consists of:
1. Install the orifice plate where the head is installed.
2. Select the range on the bench you want to calibrate and for flow in the Intake direction.
3. Set the test pressure you will set for most of your flow tests, like 28". This will be recorded on the vertical manometer
and is the pressure across the test orifice installed where the head is normally installed.
4. Exactly record all data requested on the following Calibration Test Data sheet.
5. Repeat steps 2-4 for the exhaust direction.
6. Repeat steps 1-5 for all flow ranges on the bench.
Send the Test Data sheets to Performance Trends with $20 and Performance Trends will return a Calibration sheet with
information to load into the Port Flow Analyzer's Bench Specs menu.
NOTE: Version 3.5 has built in Calibration feature to automatically calibrate
custom flow benches and Performance Trends’ EZ Flow system. Check
Appendix 7.
149
(C) Performance Trends Inc 2007
Port Flow Analyzer
Appendicies
Performance Trends' Bench Calibration Test Data Sheet:
1
Range
#
1
2
3
4
5
6
7
8
2
Int/
Exh
3
Test
Pres
"H2O
4
Flow
Pres
"H2O
5
Test
Temp
degF
6
Flow
Temp
degF
7
Calibration
Orifice,
dia "
8
Flow
Orifice,
dia "
______ _____
______ ______ ______ ______ ________
________
______ _____
______ ______ ______ ______ ________
________
______ _____
______ ______ ______ ______ ________
________
______ _____
______ ______ ______ ______ ________
________
______ _____
______ ______ ______ ______ ________
________
______ _____
______ ______ ______ ______ ________
________
______ _____
______ ______ ______ ______ ________
________
______ _____
______ ______ ______ ______ ________
________
______ _____
______ ______ ______ ______ ________
________
______ _____
______ ______ ______ ______ ________
________
______ _____
______ ______ ______ ______ ________
________
______ _____
______ ______ ______ ______ ________
________
______ _____
______ ______ ______ ______ ________
________
______ _____
______ ______ ______ ______ ________
________
Bench flow range #
Intake or exhaust direction
Vertical manometer reading (reading should be close to standard test pressure, like 28", 25" or 10")
Inclined manometer reading. This must be accurately calibrated in inches of water. See Figure A.3.
Record for Blower Center benches only. Air temperature at calibration orifice where head is usually installed.
Record for Blower Center benches only. Air temperature at air flow orifices.
The diameter of the Calibration Orifice installed where the head is normally installed.
If possible, give the number and diameter of the flow orifice(s) inside the bench for this range.
Send data to Performance Trends with $20 for analysis and Calibrated Full Scale CFM for each range of the bench. These #s
can then be entered into the Bench Specs menu of your program.
150
(C) Performance Trends Inc 2007
Port Flow Analyzer
Appendicies
Appendix 3: Tips for Accurate Flow
Testing
The following notes give tips for improving the accuracy and repeatability of your flow test results:
CFM measurements from "sharp edged" orifices are not accurate at low flow pressures (Flow Pres). For example, for a
flow manometer calibrated in "Flow %", an eighth inch distance at low flows may be the difference between 20 and 25%
Flow. However, at the high end of the scale, an eighth of an inch is the difference between 98 and 98.5% Flow. An eighth
inch reading error at the low end may result in 5/20 = 25% error. However at the high end this same reading error would
only be .5/98 = 0.5% error. When possible, select a flow range to keep the Flow Pres at the high end of the manometer
scale.
Since the Leak CFM is usually small, the Flow Pres may be very low on the Flow (inclined) manometer. Therefore, the
Leak CFM measured may not be accurate, and may actually contribute more to an error than neglecting it. For example,
the leakage is actually 2 CFM, but you measure it incorrectly as 5 CFM. Using 5 as Leak CFM will cause more error in
the final CFM calculation than using 0 for Leak CFM. To accurately measure Leak CFM, first minimize all leaks for all
your flow tests, but continue to measure Leak CFM. A Leak CFM which varies more than 2 CFM from port to port may
indicate this problem. If this is the case, you may be better off to always check leakage only to find a major problem, but
use the same Leak CFM for all tests.
Leaks in the pressure lines to the manometers (and electronics) can cause significant errors. See Figure A.4 for a simple
leak check method.
Temperature readouts on SuperFlow 60, 110 and 120 benches can be checked by noting that the 2 temperatures agree
within a couple degrees when the bench has been off for more than 1 hour.
Figure A.4 Leak Checking Manometers
151
(C) Performance Trends Inc 2007
Port Flow Analyzer
Appendicies
Weather Corrections:
Weather significantly affects engine power so it seems natural that one should correct port flow for weather changes.
However, engine power depends on the mass of air which flows through it, like lbs/minute. Weather dramatically affects
air density, which affects mass flow. Head flow in CFM is a volume flow, which does not depend on density.
Minor weather correction, for factors other than air density, have been developed for flow bench results. Performance
Trends is still investigating the reliability of these corrections.
Notes:
The reason flow benches with air flow measurement orifices require only minor weather corrections, is the cylinder head
behaves much like a measurement orifice. If humidity goes up, both the cylinder head and measurement orifice "see" air
with more humidity. Both restrictions react in the same way to the increased humidity, so measurement errors tend to
cancel out. However, when the air passing through the test piece is not the same as that passing through the measurement
orifices, errors can occur. That is why a temperature correction is needed for blower center benches like a SuperFlow 110
bench.
If an air measurement system other than an orifice is used (laminar air flow element, hot wire anemometer, etc), weather
corrections become important. That is because the air measurement system will not react to weather changes in the same
way as the head restriction.
Performance Trends basically agrees with SuperFlow's analysis of flow bench data, which states that weather corrections
are not required for most situations.
Flow Bench Calibration:
The best check of a flow bench's accuracy and repeatability is to flow one or more calibration orifices of a certain size. For
example, perform a flow test at 10" Test Pressure on a thin steel plate with a 1.5" hole, rather than a cylinder head. Use the Port
Flow Analyzer to obtain an intake and exhaust CFM. Make all measurements as done for a port, including Leak CFM.
Now you want to compare the measured flow to what you should obtain. One way to estimate what CFM you should measure is
to flow the orifice plate on a known, accurate flow bench. Another is to calculate what theoretically should flow through the
plate, as shown with the equation below:
The equation to estimate flow through a sharp edged orifice is:
CFM flow = 13.29 x Diameter
2
x
Test Pressure, " water
For the example above, with 10" test pressure across a 1.5" hole:
CFM flow = 13.29 x 1.5
2
x
10 = 95 CFM
If the bench is operating properly, you should measure very close to 95 CFM. Some difference between the intake and exhaust
CFM should be expected. However, large differences (15% or more, like the Intake direction measures 90 CFM and the
Exhaust direction measures 120 CFM), double check the Flow Bench Specs in the program. Other possible problems include:
152
(C) Performance Trends Inc 2007
•
•
•
Port Flow Analyzer
Appendicies
Leaks in the manometer pressure lines
Leaks within the flow bench not accurately accounted for when you measure the Leak CFM
A calibration orifice with a sharp edge on one side and rounded edge on the other. If you flip the orifice over, and the
difference between intake and exhaust reverses, make both edges of the calibration orifice the same.
Some flow bench manufacturers recommend to use this check to obtain a correction factor for the bench. For example, if the
bench above would measure 90 CFM instead of the expected 95 CFM, you should increase all measurements by 5/90 * 100% or
5.5%. See Section 2.10, page 57 on the Test Correction Factor for correcting Blower Center benches like the SF 110.
Performance Trends believes that you should not make a significant correction like this based on only one measurement at one
flow. Performance Trends does recommend keeping a record of these calibration checks and perhaps using more than one size
of orifice. Only after a long history shows the bench to be consistently off, for example low by 5.5%, should a correction factor
be used.
This version of the Port Flow Analyzer allows for a Test Correction Factor on the SuperFlow 110 and 120 benches only. To
make a correction you must changes the CFM flow ratings of all orifices in the Flow Bench Specs. Also see Appendix 2.
Here is an Example showing correcting Full Intake Flow, CFM for calibration test data:
If a good history says the bench reads 135 CFM when it should read 129 CFM, the correction factor would be:
True CFM
Measured CFM
x Full Scale CFM = Corrected Full Scale CFM
Where:
• True CFM is what you calculate should pass through the calibration orifice
• Measured CFM is a good average over many calibration tests of the CFM the bench actually measures
• Full Scale CFM are the Full Intake or Full Exhaust Flow, both intake and exhaust, currently in the Flow Bench
Specs for all orifices used
• Corrected Full Scale CFM are the new flows to enter which should make your calibration tests match the
orifices calibration flow, and your flow tests more accurate
For example, Full Intake Flow for Range #3 is 150 CFM. Your calibration tests consistently read 135 CFM for a
calibration orifice which should flow 129 CFM:
129
135
x 150 CFM = 143.3
Change Full Intake Flow for Range #3 to 143.3 in the Bench Specs menu. Use the same calculation technique to
correct all orifice flows in the Flow Bench Specs, both intake and exhaust.
To check that you have performed the calculations correctly, perform the calibration test again. You now measure 130
CFM, which is very close to the "True CFM" of 129. Therefore, you did the calculation correctly.
153
(C) Performance Trends Inc 2007
154
Port Flow Analyzer
Appendicies
(C) Performance Trends Inc 2007
Port Flow Analyzer
Appendicies
Appendix 4 Backing Up Data
Backing up data means to make more than one copy of the data which can be used or referred to at a later date. This may be
needed in the event one copy becomes lost or erased, or you need room in the Flow Test Library. Backing up data can take 2
basic forms:
Paper Reports
Copying files with Windows copy commands
Other than making Paper Reports, backing up data requires knowledge of Windows File Manager (3.1) or Windows Explorer
(95, 98, NT) commands. Unless you are experienced with Windows commands, have someone experienced with Windows
assist you to prevent losing data.
Paper Reports:
If you already keep written copies of all flow tests you perform, you already understand this form of backing up data. When you
finish a flow test, simply print out an Int & Exh Raw Flow Data report. In the Print options menu, be sure to check Include
Bench Specs, Include Test Options, Include Head Specs, and (Pro version only) Include Head Details. This paper report
contains nearly all the data you need to reproduce this test in the future. Simply store this paper report in a safe place.
Disadvantage of Paper Back Ups:
For example, say you have accidentally erased a Flow Test File but have a paper report of that data. If you now want to
recalculate that data, correct the data to a new Test Pressure, compare new data to this old data, etc, you must re-enter all
that RAW data by hand as if you were running a flow test.
Copying data to disk with Windows commands:
This method is the preferred method. If you are not familiar with Windows commands, have someone help you the first couple
of times. However, this is the most reliable and most efficient way to back up your data.
Note: Unless stated otherwise, all mouse clicks are with the normal, left button on the mouse.
To copy Entire PFADAT Folder using Windows 95, 98 or NT, which contains all folders and test files in the Test Library:
Click on Start, then Programs, then Windows Explorer (usually at the bottom of the list of programs). You will obtain the
Windows Explorer screen shown in Figure A5.
Locate the PERFTRNS.PTI folder (may not be printed in capital letters) on the left side of the Windows Explorer screen,
usually on the C drive. Click on the [+] sign to the left of it to display the contents of the PERFTRNS.PTI folder.
You should now see the PFA30 folder. Click on the [+] sign to the left of it to display the contents of the PFA30 folder.
You should now see the PFADAT folder. Right click on the yellow PFADAT folder icon to display the menu of options.
Click on the Copy command to copy this entire folder (all test files in the standard Test File Library).
NOTE: Version 3.5 has added 1 step Backup and Restore Commands. Check
Appendix 7.
155
(C) Performance Trends Inc 2007
Port Flow Analyzer
Appendicies
Figure A5 Copying Files with Windows 95, 98 or NT Windows Explorer
Find the PFA30 folder under the PERFTRNS.PTI folder, usually on the C drive.
Click on the [ +] box to the left of a folder to show its contents (folders).
Click and drag
the slide bar
button to move
up and down
the list of
folders.
The contents
of the open
(clicked on)
folder on the
left is shown
here, including
both folders
and files.
Right click
(with the right
mouse button)
on the
PFADAT folder
(not seen here)
to open a
menu of
options
Click on Copy
to copy the
entire contents
of the PFADAT
folder (the
entire test file
library). DO
NOT click on
Cut.
Drag slide
bar to the
top of the
list to find
your
Floppy disk
drive
(usually A)
156
Right click on
the Floppy
drive icon.
Then click on
Paste to paste
whatever you
copied (in this
example, the
entire PFADAT
folder) to the
disk in the
Floppy drive.
(C) Performance Trends Inc 2007
Port Flow Analyzer
Appendicies
Now you must tell the computer where you want to copy the files to. Click and drag the slide bar for the left section of the
Windows Explorer screen to the top. (You can also click on the up or down arrow buttons on the slide bar.) Look for the
Floppy Drive icon, usually the “A” drive. Put a new, formatted disk in the floppy drive. Then right click on the Floppy
Drive icon, and select Paste from the list of options. You will see the floppy drive light come on as the entire PFADAT
folder and all its contents are copied to the floppy disk. Label this disk with something like “PFADAT folder, xx/xx/xx”
with a name and date.
Notes:
If you have so many tests in the Test Library, they may not all fit onto 1 floppy disk. Windows Explorer will tell you this and
ask you to insert another new, formatted disk. If this happens, be sure to label all disks with a name, date and sequential #s, and
keep the entire disk set together. A suggestion for novice computer users is to make each folder under PFADAT a separate
floppy disk. This may require more floppy disks, but will make it easier to understand restoring just certain folders in the future.
You may just want to back up one particular folder in the test library (in the PFADAT folder) or just 1 particular test. You
would do this the same as with copying the entire PFADAT folder, just click on the [+] by the PFADAT folder to display the
folders under PFADAT. Then right click on the folder you want to Copy. To find individual test files, click on the yellow
folder icon containing the test file and the contents of the folder will be shown on the right side of the Windows Explorer screen.
Then right click on the test file name and select Copy.
You can also copy individual test files to the floppy drive inside the Port Flow Analyzer program. Open the file you want to
copy so it is the current test file. Then click on File at the top of the Main Screen, then select Copy to Floppy Disk.
More experienced computer users may want to use the “Backup” features built into Windows 95 and 98 (click on Start,
Programs, Accessories, System Tools, Backup). This compresses test files so it takes fewer floppy disks. However you need to
use the Backup program to restore test files, which can be more confusing to novice computer users.
Restoring Data
Be very careful when restoring data, as you may overwrite Test Files with old, erroneous
information. Read all the information below before restoring data. If you are not familiar with
Windows Explorer, have someone more experienced help you.
The ONLY reason to restore data is if you have lost test files. This could be because you
mistakenly erased it, you had a major computer failure, or you are moving the program to
another computer. Do NOT restore data unless you have one of these problems, as you could
possible create many more problems than you are trying to fix.
When restoring test files and folders, you pretty much reverse the procedure for backing up. First you put your backed up
floppy disk in the floppy drive. Then open Windows Explorer, find the Floppy drive icon and click on it to display its contents.
Right click on the folder you want to restore and select Copy.
Now find the PFADAT folder under PFA30 under PERFTRNS.PTI, usually on the C: drive. Right click on the folder
1 level up from the folder you are restoring. For example, if you are restoring the test file folder CHEV which was in the
PFADAT folder, you must click on the PFADAT folder. If you are restoring the entire Test Library folder PFADAT, you must
click on the PFA30 folder. If you are restoring the test file 194-150 which was in the CHEV folder under the PFADAT folder,
you must click on the CHEV folder.
157
(C) Performance Trends Inc 2007
Port Flow Analyzer
Appendicies
During the restoring (copying) process, Windows Explorer checks to see if it is overwriting an existing file (Figure A6). If it is,
it will ask you if the existing file or folder should be overwritten. Be very careful when overwriting files, as you may overwrite
a new test file with data from an old test file of the same name.
Before restoring test files, it is good practice to back up all test files first. Then if you make a
mistake, and overwrite test files you didn’t mean to, you have your backup copies to restore
the test files from.
Figure A6 Windows Explorer Warnings when Overwriting Test Files
Overwriting a Test File
Overwriting an Entire Folder (several files)
Be very careful selecting
this option, as several files
may be overwritten at once.
NOTE: Version 3.5 has added 1 step Backup and Restore Commands. Check
Appendix 7.
158
(C) Performance Trends Inc 2007
Port Flow Analyzer
Appendicies
Appendix 5: Performance Trends “Black
Box II” Interface
For information on SuperFlow’s FlowCom refer to SuperFlow’s instructions, Section 2.11 and Example 4.2. This section does
cover calibrating a Swirl or Tumble Meter which can be read through SuperFlow’s FlowCom. If you are using either
Performance Trends’ “Black Box” (released in 2002) or earlier “Electronic Interface”, also take a look at Section 2.11 and
Example 4.2.
Black Box
Black Box
Performance Trends’ “Black Box” data logger will record data from your
flow bench to greatly enhance your flow bench testing. The two figures
below give an explanation of the various connections to the Black Box, and
how it hooks up to a typical SF 600 or 300 or custom style flow bench.
Power
Jack (12
volt DC,
300
mAmp)
DB25
connector to
communicate
to computer.
Use cable
provided by
Performance
Trends.
DB9 connector for swirl
input and/or switch input.
Power light indicator
High Pressure side
of Pitot Tube sensor
High Pressure side of
Inclined Manometer
(flow pressure)
High Pressure side of
Vertical Manometer
(test pressure)
Test Temperature
(temperature of air
passing through head
or test piece)
Flow Temperature (temperature of
air passing through flow orifices)
159
(C) Performance Trends Inc 2007
Port Flow Analyzer
Appendicies
For all connections, tee into the existing
manometer lines. See Appendix 5, page
159 in the Port Flow Analyzer manual.
Black Box Interface
Vertical
Manometer
Inclined
Manometer
After you hook up the Black Box, you must calibrate following the procedure later in this section.
You must specify that you are using a Black
Box Type of Electronics in the Port Flow
Analyzer as shown in the menu to the right.
You must also click on the “See Details
(calibrations)” button to calibrate the sensors
to match the manometers on your bench. See
Page 41.
Flow Bench Specs menu in Port Flow Analyzer (page 41)
You must set
Type to Black
Box and then
click on See
Details to open
up the Calibration
screen to
calibrate the
Black Box.
160
(C) Performance Trends Inc 2007
Port Flow Analyzer
Appendicies
Electronic Interface
The front panel of Performance Trends Electronic Interface has only a power switch and power light indicator in the switch.
When the interface is communicating correctly with the computer, you will see the power light flash.
Figure A.7 shows the back panel of the Electronic Interface with its connectors, options and hose routing. Section 2.11
discusses the commands and options for the interface. Section 2.6 discusses the settings for the interface in the Bench Specs
menu.
Figure A.7 Back Panel of Electronic Interface and Hose Routing
Figure A.8 shows the routing and installation of the optional thermocouples (T/Cs) used for Blower Center (SuperFlow 110)
flow benches.
161
(C) Performance Trends Inc 2007
Port Flow Analyzer
Appendicies
Figure A.8 Thermocouple (T/C) Routing and Installation
Sensor Calibration:
For accurate readings, the Electronic Interface must first be calibrated to match your bench's sensors. Calibration consists of
applying known pressures, temperatures, etc to the sensors and telling the computer what the known pressures, temperatures, etc
are.
To run the calibration procedure, you first must have the interface installed and operating, and the Flow Bench Specs set
correctly. Then click on the See Details button at the bottom of the Flow Bench Specs menu. See Figure A9. You will bring up
the Calibrations screen shown in Figure A10.
There are 2 basic ways to calibrate a sensor:
1.
You can type in calibration settings (Offset and Factor) that you have gotten from Performance Trends or from previous
settings you have written down.
2.
You can go through the calibration procedure.
Most of the time you will go through an actual calibration procedure. To calibrate, first select which sensor you wish to
calibrate, and click on the Calibrate Offset & Factor button. The program will bring up the Electronics Data screen discussed in
Section 2.11. After a slight pause, start following the instructions given in the program. The instructions will follow the
following basic procedure:
162
(C) Performance Trends Inc 2007
1.
Port Flow Analyzer
Appendicies
Figure A10 Calibration Settings Screen
The computer will
first asks you to
apply a known input
to the sensor,
usually giving you
tips on how to do
this. For pressure
sensors, this is zero
pressure to the
manometer and
interface at the same
time. This is most
easily done by
turning off the flow
bench and letting all
pressures settle out
for 30 seconds or
more. You are now
getting 0 pressure to
the sensors and the
manometer. This is
also a good time to
reset the zero on the
fluid manometer.
For Swirl or
Tumble, turning the
bench Off is also a
good way to set 0.
Sections will be enabled or disabled depending on your choices
Verify 0 by
in the Flow Bench Specs menu. Notice here Tumble specs are
watching the swirl
disabled because Tumble was not selected for Other Data.
meter readout. For
temperatures, you
will set some known temperature, like room temperature with the bench off, and read the exact temperature off the dial
thermometers on the bench.
2.
Tell the computer you have set this first condition by clicking on OK on the computer screen. The computer will read the
sensor signal. For temperatures, the computer will ask you to type in this first temperature reading.
3.
The computer asks you to apply a constant known signal to the sensor, different than the first. The program usually gives
you tips on how to do this. For pressure sensors, this is most easily done by turning on the flow bench with a head installed
with a valve lift which gives smooth, steady flow. Adjust the bench to give a manometer reading in the range requested by
the program. For Swirl or Tumble, this method also works if you have the swirl or tumble meter installed with a head
giving good, steady tumble or swirl. For temperature, the bench will create heat, especially if you flow in the direction
suggested by the program.
4.
Tell the computer you have set this second condition by clicking on OK on the computer screen. The computer will read
the sensor signal and then ask you to type in this second reading. For pressures, you will read the manometers as well as
you can while the computer was making its readings. For swirl or tumble, you will read the digital display. For
temperature, you will read the dial thermometers on the bench.
5.
The program will show you some information about the new calibration Offset and Factor, and let you decide if you want to
use them. If you answer Yes, they will be loaded back into the Calibrations menu.
Verify your calibrations are accurate when running a test by seeing if the program’s data display match the bench’s sensors.
163
(C) Performance Trends Inc 2007
Port Flow Analyzer
Appendicies
Pressure sensors can drift somewhat with time or temperature changes. If the program’s pressure readings
do not read 0.0 when the bench is off, you may be able to use the “Re-zero” command instead of completely
recalibrating. See Section 2.11 for details.
164
(C) Performance Trends Inc 2007
Port Flow Analyzer
Appendicies
Appendix 6: New Features in V 3.0 E
During the 3 years version 3.0 has been available, several minor bugs have been fixed and several new features added. Listed
below are some of the main new features in Version 3.0 E. Minor bug fixes are not listed, but are available in the more detailed
Readme.doc file available from inside the program.
•
•
•
•
•
•
•
•
•
•
•
•
•
•
•
•
•
•
•
•
•
•
•
You can now jump got the Performance Trends website directly from the program under Help at the main screen.
You can now view the User’s Manual directly from the program under Help at the main screen.
Program now reads Performance Trends’ new, very affordable Black Box electronic data logger (interface). Black box
can read flow pressure, test pressure, pitot tube port velocity, test temp, flow temp, swirl, flow direction and an input
from a switch to record data. See Appendix 5.
Several new Edit options are available. Now you can click on the top of the Lift or L/D column on the main screen to
generate valve Lifts or L/Ds based on the settings in the Test Options screen. See details below.
Using a new comp hardware number for unlocking the program, to hopefully be more stable. NOTE that this version
will require a different unlock # than previous versions.
Added feature to increment test pressure instead of valve lift This is a method used for testing devices without various
valve lifts, like mufflers, air cleaners, air meters, turbo components, etc. Pro version only. See details below.
Added several features to allow program to direct FlowCom to set the Test Pressure for tests which vary test pressure
(not valve lift). Three new Preferences allow you to 1) allow varying test pressure, 2) have the program set Test
Pressure at each new point, and 3) have the program automatically increment through all test pressures, basically
automating the test after you manually record data for the first point. Pro version only. See details below.
Added several features to allow you to rename, add, delete and copy folders from the Open menu.
Now allow calibration pressure input for 1020 benches (typically 25 or 50 inches of water). Previously it was assumed
50” for all SF 1020 benches.
Fixed a bug where the FlowCom’s barometer could be read incorrectly by the program as a small, negative number.
Added features to check and allow for Com Port #s up to 6.
Added F5, F6, F8, F9 “hot keys” to the main screen and FlowCom screen so you can navigate easier through many
screens:
• F5 Go to FlowCom or Electronics screen when at main screen.
• F6 Go to Comments section when at main screen.
• F8 go down one port, for example from Intake on Cyl #3 to Exhaust on Cyl #2. This can be done at the main
screen or from the FlowCom or Electronics screen.
• F9 go up one port, for example from Intake on Cyl #3 to Exhaust on Cyl #3. This can be done at the main screen
or from the FlowCom or Electronics screen.
• Esc key to close the FlowCom or Electronics screen and return to main screen.
Now allow up to 50 lines of printed comments. This was previously limited to 20 lines of comments.
Greatly enhanced the ability of the program to read SuperFlow FlowComs with a wide variety of different computers
and different generations of FlowComs.
Added a Browse button to the network folder option in Preferences menu. See Appendix 8 for details.
Added Tabs to preferences screen to better organize preferences.
Improved print quality of most all screens and printed reports.
Add preference for using either Head # (original version) or now File Name for the default Graph Title.
Added Swirl Analysis report to calculated Estimated swirl torque in Tq, oz in and Newton mm. Pro version only.
Allow Raw Report to be corrected to different Test Pressures.
Allow Importing of Flow Pro FP and FP3 files, and some Winflow files, files from other types of flow bench programs.
Pro version only.
Added explanation of what Temperature is recorded in a 1020 bench. (It is not air flow temperature unless you have
made provisions to record air temperature in your 1020.)
Program is now 32 bit, which means:
It can use long file names.
It should be more compatible with USB printers.
165
(C) Performance Trends Inc 2007
•
•
•
•
•
•
•
•
•
•
•
•
•
•
•
•
•
•
•
•
•
•
•
•
•
•
•
•
•
•
•
•
•
•
•
•
166
Port Flow Analyzer
Appendicies
Program now uses a faster method of reading the FlowCom. This method also proved more reliable on the new, very
fast computers.
Replaced the graph option of Swirl Stab with Swirl (abs) to graph absolute value of swirl. This graphs all swirl
numbers as a positive number so you can see RPM, but not direction. Pro version only.
Corrected a problem where data other than CFM (like swirl) would not always be graphed or reported correctly if the
valve lifts were not in order or similar for different ports.
Correct problem where opening 'Tip' would always show again, even if you selected to not see it again.
Added Mass Flow calculations to graphs and reports for English units. Pro version only. See details below.
Added Option in FlowCom screen to ReZero Swirl/Tumble.
Allowed Foot or Hand Switch to signal to record data. The user must 'double click' the switch in the current version.
Fixed a bug where the air temperature recorded by a 1020 bench was not being reported correctly in Reports.
Added a Note Tip that the air temperature recorded by a 1020 bench is "motor box" temperature and not true air temp
of the air flow stream.
Fixed a bug where printouts for head comparison reports were not complete if you requested a comparison of
individual cylinders. Pro version only.
Fixed several things to calculate Velocities, Gs, Piston Pos, FlowCoef, etc for Metric Units.
Added ability from the File menu (upper left corner of main screen) to Save To or Open From a floppy disk. This
makes it easier to copy files from one computer to another.
Added ability to read Cam Files in Engine Specs. Now you can combine detailed Cam Dr, Cam Pro Plus, S96,
Andrews, etc cam files with flow bench data for more detailed analysis. Pro version only. See details below.
Added several engine analysis graphs like Psuedo Flow Velocity, Piston Velocity, Piston Acceleration and Piston
Position. Pro version only. See details below.
Main and graph screen now fills screen for larger resolution screens like 600x800 and larger.
Data tables included with graph were not using 'Alternate Names' which you had entered manually. Pro version only.
Added feature to allow comparison reports between individual cylinders of different heads in the Pro version. In the
Reports Options screen, pick one of the Compare Report Types. Then select one of the individual cylinders for Which
Cylinder. Then when you pick the test from the library for comparison, you are also asked which cylinder to compare
to the cylinder of the first (current) test.
Fixed bug where Filter feature did not correctly find Test Dates. Pro version only.
Fixed bug where Filtering Files = On did not allow head and engine files to be displayed in the Open File screen. Pro
version only.
Added ability to allow L/D increments to be graphed'and reported for port velocity measurements. Pro version only.
Added ability to run JKM style flow bench..
Fixed bug where arrow keys in Test Options erased Int and Exh port adapters if they were entered by hand.
Fixed bug where basic version could print Head Details and Engine specs in report printouts.
Put User Name at top of Report Printouts, moved Perf.Trends (C) to 3rd line.
Now allow 32 graph lines to be graphed at 1 time, which allows 2 8 cyl heads or 4 4 cyl heads to be graphed at once.
When Entering CFM Directly, the Test Pres Column has been eliminated. The test pressure for the CFM data is now
set as the Test Pressure in the Test Options menu. This change eliminates a possible problem when Test Options Test
Pres does not match Test Pres in the Data Grid column.
Fixed a problem in that not all the CFM data was being requested when you printed a Blank Worksheet.
Added a Preference to not require a Head # for a New Test. Pro version only.
Now prints cursor line on graphs when printed.
Added a Preference to hide barometer in FlowCom screen.
Added 9 new report options for Pro version, mostly either asking for Int only or Exh only, and new Cyl-Cyl
Comparison with cylinder CFM averages included. Pro version only. See details below.
Added option to 'Hide' individual graph lines by right clicking on their name in the Legend on the right side of the
graph. Pro version only. See details below.
Added new button in Preferences called 'Set Graph Colors' where you can manually set the colors of individual graph
lines.
Program now reads some types of WinFlow files (mostly SF 600). Just 'click on' them (either the .PWD, .DAT or .FTD
files) in the 'Open Test File' screen and follow the program directions. Pro version only.
Added a Preference to disable valve spring specs from being automatically updated (calculated) from other valve spring
inputs. Pro version only.
Fixed bug where Head # was not always updated after being changed in the Head Specs menu. Pro version only.
(C) Performance Trends Inc 2007
Port Flow Analyzer
Appendicies
Complete List of Types of Reports, Many Are New
Int & Exh Raw Flow Data
Int & Exh Other Calc Data
Compare Heads - CrCFM @Lift
Compare Heads – FlCf @ Lift
Compare Heads - CrCFM @ L/D
Compare Heads – FlCf @ L/D
Int Raw Flow Data
Int Other Calc Data
Exh Calculated Data
Int Mass Flow
Calc. Int Swirl Analysis
Int & Exh Cyl-Cyl Comparisn
Eng. Performance Estimate
Compare Heads - VArea @Lift
Compare Heads - VVel @ Lift
Compare Heads - VArea @ L/D
Compare Heads - VVel @ L/D
Int Cyl-Cyl Comparisn
Exh Raw Flow Data
Exh Other Calc Data
Exh Mass Flow
Int & Exh Calculated Data
Meas Int & Exh VelData
Compare Heads - FArea @Lift
Compare Heads - PVel @ Lift
Compare Heads - FArea @ L/D
Compare Heads - PVel @ L/D
Int Calculated Data
Exh Cyl-Cyl Comparisn
Int & Exh Cyl-Cyl Comp +Avg
Int & Exh Mass Flow
Complete List of Types of Graphs, Many Are New
Corr Int & Exh CFM
Calc Int Velocities
Int Swirl (abs)
Int & Exh Flow Coef
% Exh/Int
Int & Exh Stablty
Exh Flow + Valve Area
Exh Flow Area + Valve Lift
Meas Int Vel (port map)
Psuedo Flow Velocity, Mach#
Piston Acceleration, Gs
Int STP Mass Flow Lb/Min
Int & Exh Mass Flow Lb/Min
Int STP Mass Flow Gm/sec
Int & Exh Mass Flow Gm/sec
Corr Int CFM
Calc Exh Velocities
Intake Tumble
Int Flow Coef
Int Stablty
Int & Exh Flow+Valve Area
Int & Exh Flow Area+VlvLift
Overlap Flow + Valve Area
Meas Exh Vel (port map)
Piston Velocity, ft/sec
Piston Depth from TDC, in
Exh Mass Flow Lb/Min
Int & Exh STP MsFlw Lb/Min
Exh Mass Flow Gm/sec
Int & Exh STP MsFlw Gm/sec
Corr Exh CFM
Intake Swirl
Int Tumble Stab
Exh Flow Coef
Exh Stablty
Int Flow + Valve Area
Int Flow Area + Valve Lift
Overlap Flow + Valve Lift
Psuedo Flow Velocity,ft/sec
Piston Velocity, ft/min
Int Mass Flow Lb/Min
Exh STP Mass Flow Lb/Min
Int Mass Flow Gm/sec
Exh STP Mass Flow Gm/sec
167
(C) Performance Trends Inc 2007
Port Flow Analyzer
Figure A11 New Help Options and Preference Menu
Click on Preference for
Preference menu to right
Many new Help Options
Note inputs for Mass
Flow calculations.
New “tabbed” layout
of Preferences.
Figure A.12 New File Commands
Several new Open,
Find, Import, Edit, Find
and Save options.
Many new Edit options for folders available
by right clicking in Folders List. Note: You
must highlight the folder you want to work
with first, then right click.
Note larger Open Test File screen to accommodate
longer file names both for tests and folders.
168
Appendicies
(C) Performance Trends Inc 2007
Figure A13 Edit Options
Port Flow Analyzer
Appendicies
Click on File at top, left of main screen, then Edit for this
menu of options to appear.
Click on the top of
the Lift or L/D
column (or Set Pres
if you are varying
test pressure) for
this new Edit option
Hot Keys for Data Recording (see figure A14 below):
• F5 Go to FlowCom or Electronics screen when at main screen.
• F6 Go to Comments section when at main screen.
• F8 go down one port, for example from Intake on Cyl #3 to Exhaust on Cyl #2. This can be done at the main screen or
from the FlowCom or Electronics screen.
• F9 go up one port, for example from Intake on Cyl #3 to Exhaust on Cyl #3. This can be done at the main screen or
from the FlowCom or Electronics screen.
• Esc key to close the FlowCom or Electronics screen and return to main screen.
Figure A14 Using “Hot Keys” to Navigate Through Data Recording Screen
F5 from the main
screen brings up
the FlowCom or
Electronics data
recording screen.
F8 and F9 step
forward or back
between the
different ports
without having to
leave the
FlowCom or
Electronics
screen.
Esc key closes
this data recording
screen.
F6 at the main
screen puts the
cursor in the
comments section.
169
(C) Performance Trends Inc 2007
Figure A15 Engine Specs and Using Cam Files
Port Flow Analyzer
Appendicies
In the Pro version, you can combine flow
data with engine specs for doing engine
analysis and performance projections.
Note that much more detailed analysis is
available in our Engine Analyzer Pro, which
can read the Port Flow Analyzer’s flow
files.
Choose Yes for Use Cam File to enable
Exh File and the Pick (browse) button to
pick a cam file from the folder CamFiles
(default) or most any folder on your
computer.
Examples of New Engine Analysis Graphs (only Pseudo Flow Velocity uses flow data)
170
(C) Performance Trends Inc 2007
Port Flow Analyzer
Appendicies
Psuedo (false) Flow Velocity in Figure A15 is the calculated INCOMPRESSIBLE velocity of the air as it passes through the
valve. Some engine builders like to look at these numbers as they make changes to the head flow, cam profile, rod length, etc.
HOWEVER, this is NOT the TRUE air speed, because air can compresses and expand, and its density changes with
temperature. True air speed and tuning details ARE calculated in the Engine Analyzer Pro, which gives a much more realistic
idea of what is actually happening.
Running Tests Where Test Pressure is Changing
Rather that recording CFM flow data at different valve lifts,
you can now choose to test a component at different Test
Pressures. This is a method used for testing devices without
various valve lifts, like mufflers, air cleaners, air meters, turbo
components, etc.
Figure A16 Preferences Menu
Setup the Preferences menu for the appropriate options by
clicking on Preferences at the top of the Main Screen. See
Figure A16.
Allow Test Pressure Set Points must be set to Yes.
Automatically Set Test Pressure means you want the Port
Flow Analyzer to set the test pressure for each new set point.
This will only work if you have a motor controller. You may
want this turned off if you encounter problems with having
the program setting Test Pressure automatically.
If you want the program to automatically step to the next row
with a Set Test Pressure, Choose one of the “Yes” options for
“Auto Step Through Test”. These also let you set the
approximate amount of time to stabilize between points.
Choose the
appropriate
option in the
Test Options
menu. See
Figure A17.
Figure A17 Test Options
Pick this
Valve Lift
Type, Step
Size and
Max Setting
in Test
Pressure
increments.
Note that
Test
Pressure
is now
disabled
171
(C) Performance Trends Inc 2007
Port Flow Analyzer
Appendicies
Now you will proceed as with any other type of test, except you (or the Port Flow Analyzer software) will set the test pressure at
each different row (test point) to a different number in the “Set Pres” column. The program will record the actual test pressure
(typically quite close to the Set Pres in the “Test Pres” column, and correct the CFM to what it would have been if you had
obtained the exact Set Pres.
Figure A18 Main Screen Setting Test Pressure
Test Pressure is
now the set point
instead of valve
lift. This box will
say “Setting x”
when you have
selected the
program to
automatically set
test pressure.
Different Set Pres for
each row instead of
Valve Lift
Summary graph
is now shows
with Test
Pressure as the
X axis.
If you set the Preference “Auto Step Through Test” to one of the “Yes” options, the program will automatically step to the next
row, set the test pressure via the SuperFlow’s Motor Controller through the FlowCom and wait the selected amount of time.
Then the program will automatically record the data and step to the next row. For this procedure to work best, you should start
at the first row. The sequence is started when you press <F1> or click on the Record menu item. When all rows with a “Set
Pres” have been set and recorded, the focus should return to the first row and auto-stepping will stop.
172
(C) Performance Trends Inc 2007
Port Flow Analyzer
Appendicies
Appendix 7: New Features in V 3.5
Port Flow Analyzer has had many updates since this user manual was written for the original v3.0 for Windows. These include
3.0 A through v3.0 E and now v3.5. Here is a brief listing of some of the features new since v3.0 E was released, including
Version 3.5. Unless stated, most all of these new features apply Only to the Pro Version of the software:
New Features:
•
The program now has an “EZ Start Wizard” to walk beginners through the steps of starting a new test. (Fig A20) This
feature is in the Basic version also.
•
Program will automatically look for old v3.0 files and copy them over to this new v3.5. This feature is in the Basic version
also.
•
Added several features for emailing graphs, files and PDF reports (if you have the full Adobe Acrobat ™). (Fig A21)
•
Program now has a 'Website' button in the About screen for jumping to www.performancetrends.com website.
•
New Preference for Blue and Red text colors in data entry grid on main screen, to better remind user of Intake versus
Exhaust data. This feature is in the Basic version also.
•
Increased the number of possible data points (rows of data) up to 55. This feature is in the Basic version also..
•
Program now has added a new 'Edit' menu with several Edit options for the Main Screen. (Fig A22) This feature is in the
Basic version also..
•
Program now has added Backup and Restore commands under File at the main screen. (Fig A22) This feature is in the
Basic version also..
•
Program now has added ability to read WinFlow files from SF 1020 bench, in addition to an SF 600.
•
You can now resize the Electronics and FlowCom Recording screen to display these readouts to fill the entire screen, if
needed. (Fig A33) This feature is in the Basic version also..
•
The program now warns if you pick an Alternate Folder for Saving in Preferences if the path includes "\PFADAT". You
should be picking the folder which contains the folder "\PFADAT".
•
In Head Details screen, the program would not correctly calculating Area or Width and Height for an Oval port. The
program assumes Oval if the Width and Height are not the same and "Round" is the port shape described in the Head specs.
•
The main screen now displays better for screen resolutions greater than 600 x 800. This feature is in the Basic version also.
•
The screen colors are now more compatible with Windows XP. This feature is in the Basic version also.
•
Added a new Port Velocity mode in test options, where you can record 1 pitot tube pressure at every test point. A new
Preference called "Prompt for Recording Single Vel. Pt." was also added to let the program Prompt you for recording a
single Pitot Tube velocity reading after you record the CFM readings. Set this to No and the program records all data AND
Pitot Tube velocity at the same time. Set this to Yes, and the program records all CFM data EXCEPT velocity, then
displays a message "Now Record Velocity with <F1>" for about about 1 second, then when you press <F1> again, just the
velocity reading is taken. This data is contained in a data column called “Vel #1”. This data is graphed vs Lift or L/D if
you select to graph a Port Velocity Map, and is included in Report Types of “Raw Data” and “Calculated Data”. (Fig A23)
•
You can save a picture file (like a jpg file) at each lift point, like recording flow patterns with wet flow benches. (Fig A23)
•
You can now search (Filter tests) for certain characters or phrases in the test File Name, in addition to comments, spec
settings flow results as available in v3.0.
•
Now when you click on a graphed point on the main screen, the row for that data point gets highlighted in the table of
results. This feature is in the Basic version also.
•
Program now better remembers the printer type and printer page orientation when you make changes to the Windows
Printer Setup. This feature is in the Basic version also.
•
Program now has new preference to let you pick a Company Logo graphics file to appear in your printouts. The logo prints
out in Graph printouts also. (Fig A25)
173
(C) Performance Trends Inc 2007
•
Port Flow Analyzer
Appendicies
Updated the routine to locate an appropriate version of Adobe Acrobat ™ to view the PDF files for the user manual. This
feature is in the Basic version also.
New Outputs (Features for Graphs and Reports):
•
Added several new features for doing Cylinder to Cylinder comparison reports. (Fig A24) When you choose a 'Cyl-Cyl'
report type, three new options appear:
1.
Whether to include additional Tests or Heads in the report. This allows you to compare cylinders from different tests
or heads on the same report.
2.
Whether to include a difference column to show the difference in the first Column of CFM to all the rest. This first
column could be a single cylinder or the average for the first head.
3.
Whether to include averages of the columns at the bottom of each column. This would be like the average CFM flow at
all lifts for each cylinder.
•
Program now has added ability to specify which Ports to Graph and/or Report with a new 'Pick' option for Which Cylinders
in the 'Graph' and 'Report' Options screens. (Fig A24)
•
Columns in History Log have been slightly rearranged, and columns now include Which Cylinders, which are the cylinders
to Report or Graph if you choose the 'Pick' option. (Fig A24)
•
New Format option to Open/Save/Edit a particular graph format. This allows you to save the graph type, test pressure
corrections, graph scales, etc to a particular name. Then you can easily Open these saved formats to reproduce a graph
format in the future. This is available by clicking on Format, then Open/Save/Edit Graph Format. (Fig A26)
•
User Specified Colors now include colors for Port Velocity Maps. Click on Preferences, then Set Graph Colors on the right
side, then at the bottom right of the Graph Colors screen are the color choices for the Port Velocity Maps.
•
Made several changes so Port Velocity maps would show up better on various computer screen resolutions.
•
Added several new features for writing ASCII files from reports. (Fig A29)
1.
Report names can now include the path.
2.
Now you can browse to find or create a file name and path for writing the ASCII file.
3.
ASCII reports can now include comments and all test specifications in the output.
4.
Program now remembers ASCII file settings.
•
Program now has added several additional graph styles under format, then Line Style. These include bar graphs, 3D bar
graphs, area graphs, etc. (Fig A27)
•
Program now has added "3D-Graphs.clc" calc screen to let user change view and other specs about 3D graphs. (Fig A28)
•
When opening a WinFlow data file, the program now lets you pick the Comments file for this WinFlow file, so those
comments can be imported also.
•
The Preference which allows you to choose a default Floppy/CD drive has been expanded to include letter drives from A to
Z. This feature is in the Basic version also.
•
Changed Preference for Dot Matrix Graph Printer Adjustment to "Graph Printer Adjustment For..." and now have
"Acrobat" as a choice. This feature is in the Basic version also.
•
Put in checks for blank choices in Graph and Report menus. Blank entries are automatically set to the first choice in the
'Drop Down'. This feature is in the Basic version also.
•
Made graph line flash rate independent of computer speed (.2 second flash rate). This feature is in the Basic version also.
•
Print B&W now draws graph as B&W on screen for better printing on color printers when B&W has been requested. This
feature is in the Basic version also.
•
Program now prints headers of graphs and reports the same, and modifies the spacing to better ensure that long test file
names are printed completely. As mentioned earlier, you can also include a company logo graphic image.
•
A new option has been added so reports can be printed WITHOUT the Flow Data. This allows you to print, for example,
just the Head Specs and Head Details with nothing else. This feature is in the Basic version also.
174
(C) Performance Trends Inc 2007
Port Flow Analyzer
Appendicies
New Features for Various Flow Benches and Electronics:
•
Added some new Flow Bench types and/or features to be more compatible with the following types of Flow Benches. This
feature is in the Basic version also.
• Performance Trends’ EZ Flow system. (Fig A32)
• SuperFlow
• FMA Flow Benches from Australia
• Saenz Flow Bench
• Performance Flow and JKM style benches (using Pitot Tubes to record CFM flow)
• Several styles of custom or “do it yourself” flow benches.
•
Program now will control Performance Trends’ automatic Valve Opener. Note: You will be given a new unlock number
for your program to open up the Valve Opener menu option in the Flow Bench specs. (Fig A30)
•
Program is compatible with SuperFlow's ™ new USB FlowCom. This feature is in the Basic version also.
•
Added 3 new Preferences for Pro version only, which allows for there to be both an Intake and Exhaust Test Correction.
A Test Correction is obtained by flowing a known orifice where the head would go on your flow bench. Knowing the
difference between what IS measured and what SHOULD BE measured, a correction is obtained, to put your bench back
in Calibration. Now you can do this both in the standard Intake direction AND exhaust direction. The Preferences menu
now contains places for you to enter the expected flow for both the intake and exhaust direction. Previously, the program
used the Superflow SF110 bench standard of 153.2 CFM.
•
Program now has added ability to permanently save some debugging settings in the 'Flow Com' or 'Electronics' screen if
these debugging settings are fixing a problem. Click on Options, then the 'Save..' or 'Unsave...' options.
•
Program now has added option if FlowCom screen to force FlowCom to change the range of the flow bench.
•
If requested Range in Bench Specs is blank, the program now assigns range 1 both in the FlowCom Screen and in the
Main Screen grid (spreadsheet).
•
Added Calibrate Range screen in Bench Specs for Custom Bench or Performance Trends’ EZ Flow Type flow bench. By
installing and flowing known sharp edged orifices, you can calibrate your bench to match the CFM results of other
production flow benches, like a SuperFLow ™ bench. (Fig A31)
•
Program now does more extensive of valid com ports for communicating to a FlowCom or Performance Trends Black Box
and Black Box II. It checks up to Com Port 20, and gives better suggestions at valid ports. There is also a “Find” button
in the Flow Bench specs screen to find your electronics by checking all available Com Ports. This feature is in the Basic
version also.
•
Expanded some allowable ranges for SF300 and SF600 to cover ranges requested by some customers. Opened up
acceptable limits for flow ranges for Custom Bench to 10-5000 CFM. This feature is in the Basic version also.
•
New Preference allows you to increase the allowable test and flow pressure inputs up to 1000 each.
•
Program now allows printing of Calibrations screen. This feature is in the Basic version also.
•
Rearranged Troubleshooting options in FlowCom/Electronics screen to be under Help. This allows more room for features
to be listed under Options. This feature is in the Basic version also.
New Features Specific to the Black Box II:
•
Program now has added option for Recording Switch for Black Box II. Click on Options in the Electronics screen, then
Foot Switch Enabled to turn on this option. Then click on Options in the Electronics screen again, BB2 Foot Switch, then
pick which Temperature channel to have the switch come in on. The Black Box II can read both temperature and the foot
switch from the 4 pin analog inputs on its side. This feature is in the Basic version also.
•
Added 2 new Troubleshooting Options, of Test Com Ports and Check Boot Message. This feature is in the Basic version
also.
•
Made major change to EZ Flow flow bench calibration to work with new Black Box II. (Fig A32) This feature is in the
Basic version also.
175
(C) Performance Trends Inc 2007
Port Flow Analyzer
Appendicies
•
Program now does better checks for bad data from Black Box II. This feature is in the Basic version also.
•
Added new option for Preference of 'Black Box Reads +/- Pressure' but the program does no checks to see if the direction of
the flow is correct for the type of port, intake and exhaust. Setting “Black Box Reads +/- Pressure” means a custom bench
does not need valves to maintain the high pressure side of the manometer to remain the high pressure side of the manometer
when you switch from the Intake to the Exhaust flow direction. This greatly simplifies the design of “do it yourself” and
custom benches.
•
Fixed bug where if the program is set to 'Black Box Reads +/- Pressure', CFM was being displayed even if the Vertical
Manometer reading was less than 2" water. This feature is in the Basic version also.
•
Added Preference for Barometer sensor in Black Box II. To get Barometer reading with Black Box II, you must turn on the
Preference "Black Box II has Baro Sensor" and also ask to record Barometer in the Test Conditions screen. You can also
adjust the Barometer reading slightly with the Weather Calibration section in the Calibrations screen available by clicking
on the Calibrations button at the lower left corner of the Flow Bench Specs screen. The Barometer input in this screen will
offset the Black Box's barometer reading. For example, enter -.25 and the Black Box's Barometer will be reduced by .25
inches of Mercury.
•
Program now has added checks for Black Box or EZ Flow systems to watch for over-ranging the pressure sensors,
producing inaccurate data. For example, if a pressure sensor is “maxed out”, the program tells you this, rather than letting
you think this data point is accurate. This feature is in the Basic version also.
•
Fixed a bug where the Black Box could read test pressure incorrectly for certain faster computers. This feature is in the
Basic version also.
•
Added a Preference to Eliminate program looking for Black Box set up for + or – pressure.
New Engine Performance Report Features (Pro Version Only):
•
Program now comes with almost 1000 more example cam profiles built in, including almost the entire Crane catalog.
•
Program now offers to fill in blank Engine Specs.
•
Program now allows for Rocker Arm Ratios of less than 1, down to .7
•
Fixed a bug where if you chose a different Cam Advance in the Engine Specs screen, it would blank out and revert back to
straight up.
•
Fixed a bug where if you chose something other that .050" events in the Engine Specs screen (.040" or seat timing), the
program would always open up the Engine Specs screen with .050" as the labels for cam events.
•
Fixed bug where VERY high runner velocities (small ports) could erroneously produce good HP.
•
Engine Performance Estimate report now uses Metric Units if Metric units are chosen in Preferences.
176
(C) Performance Trends Inc 2007
Port Flow Analyzer
Appendicies
Fig A20 Starting a New Test Using the EZ Start Wizard
Click on File, the EZ
Start Wizard to start a
new flow test using the
“Wizard”
You will be
presented with a
series of screens
with questions,
explanations and
possible settings, to
make starting a new
test as easy as
possible. “Back”
button at bottom lets
you easily back up to
previous steps.
Figure A 21 Emailing Options
Set email options in Preferences. Click on Help
button on right for explanation of these features.
Email options in Graph
screen. The Email 16 Color
Graph requires you to find MS
Paint utility on your computer
and will create a smaller file
for emailing with very little loss
in picture quality.
Email as PDF File in the Print
Options in the Report Screen.
Email a Test File from the
Main Screen, so someone
else with Port Flow
Analyzer can view it.
177
(C) Performance Trends Inc 2007
Port Flow Analyzer
Appendicies
Figure A22 Some New Features on the Main Screen
New Import Commands to import WinFlow ™ files (SF
600 and SF 1020) and import files from an earlier
version of Port Flow Analyzer, like v3.0. This makes it
easy to pull all your v3.0 files over to the new version
3.5.
New Backup and Restore Commands let you backup or
restore ALL your test files with a couple of keystrokes.
New Edit Options
Figure A23 Options to Record a Single Velocity Data Point
Choose Single
Velocity Point in
Test Options. Note
the additional new
option of Recording
a Picture File for
each lift point,
typically used for
Wet Flow Benches.
This Preference
lets you pick if you
want the program
to Prompt you for
recording the
velocity point after
you record CFM
data.
This is the column where your Single
Velocity point will be recorded.
178
(C) Performance Trends Inc 2007
Port Flow Analyzer
Appendicies
Figure A24 New Cyl-Cyl Comparison Reports
Pick a “Cyl-Cyl Comparison” Report Type.
New “Pick” option lets you specify which cylinders for this
head to include, in this case you have entered “1, 3”.
These 3 new settings for “Cyl-Cyl Comparison” reports
let you include cylinders from other tests, include a “Dif”
column showing CFM improvements, and if you want
averages of the columns or flow averages for the head
included in the reports.
Click on the “Heads” button for a summary of the heads
shown in this Cyl-Cyl Comparison Report, as shown
here. These comments will be included in printouts.
Cyl 3 and 4 picked in History Log from
Head “A” for comparison.
1st and 3rd cylinders from the Baseline head (Cyl #1
and Cyl #5 on this Chevy head) shown here, as picked
in the Report Options screen.
Difference between each cylinder and the first
cylinder (Cyl 1 CFM in the 4th column in this
case) is shown in the “Dif” columns.
Column Averages shown at bottom of columns.
179
(C) Performance Trends Inc 2007
Port Flow Analyzer
Appendicies
Figure A25 Print Options and History Log for Printing Report from Figure A24
In History Log, put a Yes in the
“Report” column for tests you
want to include in this report.
In Preferences,
set text to be
included in
Printouts.
Click in the “Cyls to Report” to
assign which cylinders to
include in the “Cyl-Cyl
Comparison” report.
Use Browse button to find
your graphics file on this
computer.
Graphics file is
drawn here on
printed reports.
Two lines of text from Preferences
is printed here in printouts.
Cyl-Cyl Comparison Head
Summaries is given here.
180
(C) Performance Trends Inc 2007
Port Flow Analyzer
Figure A26 Saving a Graph Format, and more
Appendicies
To open a
saved format,
click on the
format name
from the list,
then click on
OK. Do the
same but click
on Delete to
delete that
saved Format.
Click here to allowing
Saving of the current graph
settings as a Format.
Type in a name for the current graph settings, then click on
Save to save them under that name and add it to the list.
Figure A27 New Graph Format Styles
Click on Format, then Line Style, then choose
one of these 5 new “Line” Styles.
3D Options are shown in Figure A28
181
(C) Performance Trends Inc 2007
Port Flow Analyzer
Appendicies
Figure A28 Using 3D Graph Options Mentioned in Figure A27
These settings make this graph.
These settings make this graph.
182
(C) Performance Trends Inc 2007
Port Flow Analyzer
Appendicies
Figure A29 New ASCII File Options
Several new options have been
added to writing ASCII data files
for importing into other data base
programs, like Microsoft Excel.
Figure A30 Prototype Automatic Valve Opener
Click here to open Valve Opener Specs
screen. This option only appears if you have
unlocked Port Flow Opener with a special
unlocking code from Performance Trends.
Choose a Type other than “None” to use
a valve opener, then enter settings.
Click on Help button for details.
Production unit will be about half this size, but was not available at
time of printing this update.
Unit automatically finds valve stem and zero’s itself out. Then it steps
through all valve lists you have chosen, returns the valve to closed
position, checks for any slippage, and turns off bench.
183
(C) Performance Trends Inc 2007
Port Flow Analyzer
Appendicies
Figure A31 Features to Calibrate a Custom Flow Bench (similar to calibrating a Performance
Trends’ EZ Flow System)
If you have selected a
“Custom with Orifices”
or “EZ Flow” style of
bench, then the
Calibrate menu option
is made available.
Click on Calibrate, then choose which range you
want to calibrate. IMPORTANT: You must
calibrate the vertical manometer (test pressure)
pressure sensor if you are using electronics
BEFORE calibrating these ranges. It is
CRITICAL the test pressure reading across the
sharp edged orifice is accurate.
Before Calibrating:
For a Custom
Bench, you must
enter the “Full
Scale Reading”, or
the highest reading
you can see on
your inclined
manometer.
Without electronics,
you must also set
the “Linear Scale”
parameter also.
To calibrate, you
will install a sharp
edged orifice of a
known diameter
where the cylinder
head typically goes.
You will turn on
your bench and
flow this orifice as
you would a
cylinder head.
184
Without Electronics you
will type in the inclined
manometer reading and
the test pressure across
the orifice. Test pressure
is the pressure typically
10, 25 or 28 inches of
water).
With electronics or for our
EZ Flow System, you will
click on this Measure Flow
Data button to record the
Inclined Manometer and
Corr Test Pressure data
electronically.
(C) Performance Trends Inc 2007
Port Flow Analyzer
Appendicies
Figure A32 Performance Trends’ EZ Flow System
Figure A33 Resizing FlowCom / Electronics Recording Screen
Click and drag the
blue title bar of
screen to most any
location on screen
you want it.
Place the mouse pointer on the border to get a double arrow
mouse pointer, then drag the border in the direction you want
to expand the screen or shrink it.
185
(C) Performance Trends Inc 2007
186
Port Flow Analyzer
Appendicies
(C) Performance Trends Inc 2007
Port Flow Analyzer
Appendicies
Appendix 8: Sharing Data Files on a Hub
(network)
Assume you want to share your Port Flow Analyzer files on 2 different computers, one called the Shop Computer and one called
the Office Computer. We will assume that the Office computer is where you want all the new files you create to be stored.
This is the procedure to follow:
1.
Install and activate the Port Flow Analyzer on
both computers.
2.
Using Windows Explorer, set up the Port Flow
Analyzer folder (PFA) on the Office computer
to be shared. Usually this is done by right
clicking on the “Port Flow Analyzer v3.5”
folder (usually under the “Performance Trends”
folder under the “Program Files” folder on the
C drive) and selecting the Sharing option. If
you don’t see Sharing, click on Start, then Help
and look for help on Sharing Resources.
3.
In the PFA program in the Shop Computer, set
the Preference to Yes for Use Alternate File
Location. Then click on the Browse button and
find the path to the Mapped drive from the
Office Computer.
4.
Now, when both computers are running, all
your flow files, engine and head spec files, etc
are being opened from and saved to the Office
Computer, both for the Port Flow Analyzer
program on either the Office Computer or the
Shop Computer.
Figure A40 Preference Menu for Networking
Settings
Click on Browse to
pick shared folder from
My Network Places
folder shown below.
Click here to find
network folders.
187
(C) Performance Trends Inc 2007
188
Port Flow Analyzer
Appendicies
(C) Performance Trends Inc 2007
Port Flow Analyzer
Appendicies
Appendix 9: New Features in v3.5 B
Port Flow Analyzer has had many updates since this user manual was written for the original v3.0 for Windows. These include
3.0 A through v3.0 E, v3.5 and now v3.5 B. For the features added to the v3.5, refer to the Readme.doc file (click on Help, then
Display Readme.doc File) in the program. Listed here are features introduced in v3.5 B. Also, v3.5 B has a more advanced
version we call “Head Porter”. So now there are 3 versions of Port Flow Analyzer:
•
Basic Version
•
Professional (Pro) Version (includes all Basic features and more advanced Pro features)
•
Head Porter Version (includes all Professional features and more advanced Head Porter features)
Here is a listing of the major enhancements and new features for v3.5 B.
Data Recording:
In Test Options, you can now select to record port velocity data at 3 depths in the port. See Figure A41, 47. Head Porter only.
Several enhancements to Port Velocity Report for Head Porter version have been added, to allow more averaging for all possible
combinations of recording port velocity. See Figure A42. Head Porter only.
A new Preference to allow for English units of CFM, Deg F, inches of water pressure, etc. but mm valve, lift and engine
dimensions has been added. See Figure A43. Head Porter only.
The Electronics or FlowCom screen has been enlarged in its default setting. You can still enlarge to most any size you want by
turning on the appropriate Preference setting. See Figure A43-B. All versions.
You can now include a “gauge” (bar graph) for some readings on the Electronics or FlowCom screen. This gives you a
graphical representation of the stability of the readings and if the readings are going higher or lower than expected values. See
Figure A43-B. Head Porter only.
Data Analysis (including Graphs and Reports):
You can create custom, user defined graphs, where you choose what data gets included. For example, you can graph CFM and
Swirl and % Exh/Int on the same graph. See Figure A44, A45. Head Porter only.
Program now allows for graphing Flow results corrected to 2 different test pressures. See Figure A46. Head Porter only.
You have several options to allow for more options for doing Port Velocity Graphs. This is an extension to the feature to be
able to record Port Velocity for many more data points. See Figure A47. Head Porter only.
You can now specify if you want the Test Piece picture to be drawn smaller in printouts in portrait mode. (See “Other” category
for Test Piece picture.) This can allow for more printed text to be included with the graph on 1 page. NOTE: In landscape
mode, the Test Piece picture is always drawn small on the same line as the test title. The Test Piece picture can also be printed
in reports. See Figure A48. Head Porter only.
You can now select a single cylinder to make graphs which require a valve lift profile, like Flow Area and Pseudo Flow
Velocity. In previous versions, only the Average Flow for the entire head was used. Head Porter only.
You can now request the graph to be printed in a smaller height. This can allow for more printed text to be included with the
graph on 1 page. See Figure A49. Pro and Head Porter only.
You can now select a Preference to have the graph NOT autoscale when you first open it. This can be handy if you are using
some pre-defined scales and want to keep them for all graphs. Pro and Head Porter only.
189
(C) Performance Trends Inc 2007
Port Flow Analyzer
Appendicies
Added a graph line thickness between Thin and Thick, called Thin 'Plus'. See Figure A50. All versions.
The graph line styles in the drop down menu of line thicknesses are listed together, with the appropriate check mark by the type
currently used. See Figure A50. All versions.
You can now select larger legends (labels) in the graph screen. See Figure A50. Pro and Head Porter only.
Added label to better explain what cylinder or that Average of All Cylinders will be used for Flow Area and Pseudo Flow
Velocity graphs. Pro and Head Porter only.
The graph screen now should more completely fill the available screen in most all situations. All versions.
Improved appearance of some printed graphs, especially in Landscape orientation. Previously the graphs had a border drawn
around them. On the left side, the border could be broken. On the right side the legend (labels) could also be distorted. Now
the border is not drawn in those locations. See Figure A49. All versions.
The graph choices have been simplified by eliminating many of the Int, Exh, and Int & Exh choices into just 1 choice. Now the
program looks to a separate input of "Port to Graph" for this setting Int, Exh, and Int & Exh choices. See Figure A45. All
versions.
Fixed bug where the Port Velocity Map was not being graphed correctly. Pro and Head Porter only.
Made Overlap Graphs go to zero at start and beginning of graph to look more correct. Pro and Head Porter only.
Fixed bug where graphs for % Exh/Int only showed the first cylinder on the head even though you requested all cylinders to be
graphed. Pro and Head Porter only.
Added menu command 'Edit Printed Comments & Data Output' under the File option on the Graph screen in the printing options
section. Pro and Head Porter only.
Program now includes more example cam files, the same files included in the new Engine Analyzer v3.4. See Figure A51. Pro
and Head Porter only.
Hardware:
Pro version now allows for Performance Trends’ motor controller to be used. See Figure A52. Pro and Head Porter only.
Program now allows for a USB switch to be used for starting to record data. This option does not present conflicts with some
features of the SuperFlow Flowcom. This is done buy purchasing the proper switch from Performance Trends, then going into
FlowCom or Electronics screen, clicking on Options at the top, then select the USB Switch Option. You must also set the
proper Com Port for the USB Switch under this option also. See Figure A53. All versions.
In the Bench Specs screen, the program now allows for Valve Opener for any Pro version.
Pro and Head Porter only.
Added Hot Wire (hot wire anemometer mass air flow sensor) as a Custom Bench Type. See Figure A54. All versions.
Other:
The program now lets you "Filter" tests in the library for finding tests of a certain date, certain file name, etc. Pro and Head
Porter only.
190
(C) Performance Trends Inc 2007
Port Flow Analyzer
Appendicies
When quitting program and you select 'Cancel' for Saving Changes to current test file, now the program keeps program open.
Before v3.5B, it continued shutting down. All versions.
The option for using a 2 pulse swirl meter, to be read directly with a FlowCom (no Performance Trends electronics) has been
added. In addition, a special calibration factor for this 2 Blade Swirl meter is also possible. Pro and Head Porter only.
Fixed bug where reports may be requested for intake and exhaust ports, but only intake ports were reported. All versions.
Fixed bug where the cylinders you may "Pick" for a report were not being shown clearly (another input was in front of it). All
versions.
Fixed bug where FlowCom/Electronics screen could be off screen too high or too far to left.
All versions.
Fixed bug where Test Comments were not being shown in the Preview when opening some older Port Flow files. All versions.
Updated a text file to more accurately show Mass Flow correctly for gm/sec and lb/min, and correct for proper air density specs.
Pro and Head Porter only.
Program now hides the 'Range' column for bench types which have only 1 range, like EZ Flow, JKM, new Hot Wire, and LFE.
See Figure A55. All versions.
Program now shows the Company Logo graphic on the main screen. See Figure A55. Pro and Head Porter only.
Added option to include a Test Piece Pic with your data file. This could be of the head, carb, etc. It is displayed on the main
screen and in printouts if you choose to included it from the "Print Options" list (graphs and reports). See Figure A55. Head
Porter only.
Program no longer 'nags' as much about using the CFM at 0 lift as Leakage. All versions.
New Example Flow Files have been added to show new features.
191
(C) Performance Trends Inc 2007
Port Flow Analyzer
Appendicies
Figure A41 More Port Velocity Options
Click on Test Options at Main Screen
New choice for Type of Port
Velocity data: Record 9
points across the port (3
rows of 3 positions) at all lift
data points.
New option of “Depths in
Port” to allow you to record
data at different depths in
the port, 1 depth (the only
choice in previous versions
and in the current Pro
version), 2 and 3.
Different depths marked as
“A”, “B” and “C”.
Labels let you know which data
points are being graphed.
Arrow shows you flow direction.
Slide slide bar left to
see all the entry points
for port velocity.
192
Click on Graph
button (shown
here as “Layout”
because Graph is
being shown) and
with more than 1
depth you have 2
options. Front
View (as done
before) or new
Side View (as
shown here. The
depth in Front
View (A, B, or C)
or the depth in
Side View is
determined by
which cell is
currently
highlighted in the
grid. In this case,
it is side depth 3
(farthest from
viewer).
(C) Performance Trends Inc 2007
Port Flow Analyzer
Figure A42 Port Velocity Reports
Appendicies
Last columns
of report
First columns
of report
No letter
indicates depth
Choose this
Report Type
“C” for depth C
Averages for
depths A
(blank), B and C
Bottom rows of report.
Averages for all valve
lifts at each position
and depth across all
t
193
(C) Performance Trends Inc 2007
Port Flow Analyzer
Appendicies
Figure A43 English Units but Using Millimeters for Lift and Dimensions
New choice in
Preferences
Lift in mm
Flow in CFM
Engine dimensions
also in mm
194
(C) Performance Trends Inc 2007
Port Flow Analyzer
Appendicies
Figure A43-B Bar Gauges for Selected Readings.
Gauge Options
This option lets program pick
the scales for the gauges.
Choose options to change the
settings for each particular gauge,
the high and low value of the bar
graph, and any limits to be flagged
out in either red or yellow color
(warnings or cautions).
Click this and program will
generate “reasonable” scales
for the gauges. This is useful
when first turning on “Use User
Defined Settings” because
these will all be blank.
Bar gauge with real time updates.
This one shown in red because
reading went above user defined
limit of 29.5. See screen to right for
setting scales and limits.
195
(C) Performance Trends Inc 2007
Port Flow Analyzer
Appendicies
Figure A44 Custom, User Defined Graphs
Check here to get these Custom Options
Choose what data you want graphed.
If you choose data types
which are graphed vs
different parameters (like
in this case lift and crank
degrees) a warning is
given here and only one
data type will be graphed.
Graphs of Intake Corr. CFM and
Calc. Valve Vel. corrected to 28”
water for all intake ports.
196
(C) Performance Trends Inc 2007
Figure A45 Custom, User Defined Graphs
Port Flow Analyzer
Appendicies
Check here to get these Custom Options
Pick your graph data
types
Which Cylinder(s)
Which Ports
197
(C) Performance Trends Inc 2007
Port Flow Analyzer
Appendicies
Figure A46 Custom Graph at 2 Test Pressures
Choose Corr. CFM vs Lift ONLY. Note,
correcting to 2 test pressures only works
for this data type.
Set this to Yes.
Select the Second Test Pressure you
want the data corrected to. Note: The
First Test Pressure is set as “New Int Test
Pres, ‘’water” on the left side.
198
(C) Performance Trends Inc 2007
Port Flow Analyzer
Appendicies
Figure A47 Custom Port Velocity Graphs
Pick Port Velocity
Pick View and what lifts
and cylinders to graph
Pick Lift or Cylinder
for graphing, which
ever needed
The breakdown of
the scales for
various port
velocities can be
set here. This was
true in versions
prior to V3.5B.
The color choices here can be set in
Preferences. This was true in
versions prior to V3.5B.
199
(C) Performance Trends Inc 2007
Port Flow Analyzer
Appendicies
Figure A48 Smaller Test Piece Picture in Portrait Mode Printer Orientation
Choose to include Test
Piece Picture in printout
Click here for
screen to right. This
feature is also listed
under Format.
You can choose to make the
picture smaller, which can
give you more room on a
printed page.
Picture Smaller. This only applies
to Portrait page orientation.
Landscape always does this.
Smaller NOT
selected, picture
is larger.
No room on
this page for
Data Table.
200
Room for Data Table
on a single sheet.
(C) Performance Trends Inc 2007
Port Flow Analyzer
Appendicies
Figure A49 Smaller Graph Fits All Results on 1 Printed Sheet
Choose a % to reduce the
height of the printed graph.
This option works in both
Portrait and Landscape
printer orientations.
Printed graphs no longer have a
border on the left and right sides
around the graph. This border
often had a slight “jog” in it
depending on printer, screen
resolution, etc. Now without a
border, there is no “jog”.
The graph can be printed to
include the Data Table even
though the Test Piece picture is
printed large.
201
(C) Performance Trends Inc 2007
Port Flow Analyzer
Figure A50 New Graph Features: Line Thickness and Larger Legends
Various combinations of line thickness and Legend Size
If the legend is too large to
fit on the screen, “more”
buttons appear at top and
or bottom. You can click on
these buttons to scroll
through the labels.
202
Appendicies
(C) Performance Trends Inc 2007
Port Flow Analyzer
Appendicies
Figure A51 More Example Cams for Engine Specs Screen
Choose Pick
an Example
Choose a Category of
Cam from a much larger
list than in earlier versions.
Pick the particular cam from a
large list of cams, almost double
from what was in earlier versions.
203
(C) Performance Trends Inc 2007
Port Flow Analyzer
Figure A52 Motor Controller to Control Test Pressure
Appendicies
AC power in
Controlled AC
power to bench
Motor controller
options. Current
design only works
with special Black
Box IIs.
Control lines from special
Black Box II
Figure A53 USB Recording Switch
Foot Switch
w USB
connector
Hand Switch
w USB
connector
Under Options, click on USB Switch to see options.
First, click on Set USB Switch Com Port and set that to one of the available Com Ports shown
by the program when you click on this.
Then click on Use USB Switch to tell program to look for this switch input for recording data.
F1 keystroke will still work also.
204
(C) Performance Trends Inc 2007
Port Flow Analyzer
Appendicies
Figure A54 New Bench Type: Hot Wire Anemometer
Choose Custom Bench Type
Choose Hot Wire
Enter the 3rd order coefficients for a curve
of flow vs voltage. Most likely you will have
to obtain this from Performance Trends
after you run a calibration on your bench.
Figure A55 Main Screen: No Range Column for Certain Benches and Logo Picture
Company Logo shown
on Main Screen
Click on File
button for options
for the Test
Piece picture.
No Range column for this
Hot Wire type of bench.
205
(C) Performance Trends Inc 2007
206
Port Flow Analyzer
Appendicies
(C) Performance Trends Inc 2007
Port Flow Analyzer
Appendicies
Index
2 Blade, 191
3D-Graphs, 174
accuracy, 3, 18, 20, 59, 71, 112, 122, 145, 146, 151, 152
Accuracy, 6, 145
accurate, 12, 18, 20, 23, 28, 34, 41, 60, 67, 70, 75, 78, 112,
117, 130, 139, 145, 146, 147, 151, 152, 153, 162, 163,
176
accurately, 33, 34, 41, 117, 120, 123, 146, 150, 151, 153,
191
Actual Valve Lash, 46
Adjust, 117, 163
Adobe, 173, 174
Air Flow, 73
Alternate Folder, 173
Anemometer, 152, 190
Area, 28, 40, 68, 69, 70, 75, 77, 78, 94, 173
Ascii File, 5, 1, 63, 83, 174
Assumptions, 6, 3, 12, 33, 46, 47, 48, 66, 72, 74, 75, 78,
118, 129, 145, 173, 187
Automatic Valve Opener, 175, 190
Avg Port Dia, 34, 70, 75, 140
Avg Port Diameter, 34, 70
Avg Port Height, 34, 70
Avg Port Width, 34
back up, 12, 155, 157, 158
Backup, 155, 157, 158, 173
Barometer, 1, 18, 19, 30, 62, 122, 176
Barometric Pressure, 18, 19, 30
Baseline, 21, 35, 56
Basic Version, 2, 5, 22, 33, 67, 87, 129, 166, 173, 174, 175,
176
Bench Specs, 5, 7, 12, 16, 17, 18, 20, 23, 30, 41, 42, 44, 56,
60, 97, 112, 113, 120, 123, 145, 148, 149, 150, 152, 153,
155, 161, 162, 175, 176, 190
Black Box, 59, 60, 159, 160, 165, 175, 176
Black Box Reads +/- Pressure, 176
Bore, 14, 29, 49, 51, 52
Bore Adapter, 14, 29
Bottom Cutter #, 39
calibrate, 43, 120, 148, 149, 160, 162, 175
Calibrate Range, 175
calibration, 14, 57, 61, 113, 119, 120, 149, 150, 152, 153,
162, 163, 165, 175, 191
cam, 1, 3, 27, 38, 45, 46, 47, 48, 49, 53, 70, 71, 76, 77, 78,
94, 130, 135, 136, 137, 139, 140, 141, 142, 143, 146,
166, 171, 176, 190
Cam, 3, 25, 27, 45, 46, 47, 48, 50, 76, 135, 143, 166, 176
Cam Advance, 48, 176
Cam File, 27, 47, 166
camshaft, 1, 139
Centerline, 45, 47
CFM, 1, 7, 12, 14, 15, 16, 17, 18, 19, 20, 27, 28, 29, 30, 41,
42, 43, 44, 57, 59, 60, 61, 62, 64, 65, 66, 67, 68, 69, 70,
71, 73, 74, 81, 86, 87, 105, 106, 112, 113, 116, 117, 118,
123, 125, 126, 127, 128, 129, 130, 133, 139, 145, 146,
147, 149, 150, 151, 152, 153, 166, 167, 171, 172, 173,
174, 175, 176, 189, 191
CFM Flow, 17, 30, 44, 57, 62, 147
Chamber CCs, 40, 52
Chamber CCs in Head, 52
clearance vol, 49, 52, 77, 79
Clearance Volume, 49, 52, 79
coefficient, 70, 94
Coil Bind Height, 38, 39
color, 1, 95, 174
Color, 1, 95, 166, 173, 174
Com Port, 43, 165, 175, 190
Comment, 98, 122
Company Logo, 173, 191
Compare Heads, 80, 167
compression, 8, 45, 49, 52, 78, 139, 143
Compression Ratio, 8, 45, 49, 51, 52, 78, 79, 143
Controller, motor, 171, 190
Convert to Columns, 83
copy, 2, 5, 22, 26, 41, 56, 102, 103, 117, 119, 129, 155,
157, 165, 166, 173
Correct to New Test Pres, 64, 86, 87, 133
correction, 14, 17, 28, 57, 64, 71, 72, 86, 117, 125, 126,
140, 152, 153, 175
CrCFM, 71, 80, 81, 129, 130, 132, 167
Current Test, 9, 57, 87, 108, 111, 130, 134, 135
Cursor, 89, 91
curtain, 67, 68
Curtain, 69
custom, 1, 12, 16, 42, 44, 145, 147, 149, 159, 175, 176, 189
Custom Graphs, 189
customer, 15, 36, 139, 143
Customer, 1, 9, 28, 36, 105, 106, 121
Cyl-Cyl Comparison, 66, 132, 166, 167, 174
Cylinder Numbering, 35
Data, 5, 6, 7, 8, 12, 13, 15, 16, 20, 21, 26, 31, 35, 36, 55,
56, 57, 59, 60, 62, 63, 65, 66, 67, 72, 78, 81, 83, 86, 89,
94, 101, 112, 113, 116, 117, 118, 122, 123, 124, 126,
127, 129, 149, 150, 155, 157, 162, 166, 167, 169, 173,
174, 187, 189, 190
date, 14, 44, 56, 80, 114, 123, 155, 157, 190
Default Floppy Disk Drive, 26
Default Floppy/CD, 174
delete, 36, 102, 107, 165
Demo, 2, 5, 7, 22
Depth, 167
Designed Valve Lash, 46, 48
207
(C) Performance Trends Inc 2007
Dew Point, 19, 30
Diameter, 27, 29, 34, 114, 149, 152
Difference Column, 174
Disk, 26, 157
Display, 173, 174
DOS, 9, 16, 28, 48, 102, 104
Duration, 46, 47, 48, 76, 136, 143
Duration @ .050, 47, 76
Edit, 16, 21, 56, 87, 89, 92, 108, 165, 173, 174, 190
Edit (copy/swap/erase ports), 21
Electronic Interface, 5, 1, 17, 18, 20, 61, 62, 120, 145, 159,
160, 161, 162
Email, 1, 3, 173
Eng. Performance Estimate, 72, 137, 139, 140, 143, 145,
167
Engine Library, 26, 139
Engine Performance Est., 6, 48, 64, 73, 139, 140, 176
Engine Specs, 5, 8, 11, 21, 23, 45, 49, 72, 76, 77, 79, 97,
98, 112, 122, 135, 136, 139, 143, 166, 176
Enter Cam File Directly, 27
errors, 25, 26, 48, 55, 65, 125, 133, 145, 146, 151, 152
Est Idle Vac, 78
Exhaust Adapter, 30
EZ Flow, 149, 175, 176, 191
EZ Start Wizard, 4, 56, 111, 173
Face Width, 37
Factor, 5, 14, 17, 57, 123, 124, 125, 145, 153, 162, 163
FArea, 167
file, 2, 4, 5, 7, 10, 14, 20, 21, 27, 36, 41, 56, 64, 65, 72, 83,
84, 87, 88, 98, 102, 103, 107, 108, 111, 113, 119, 120,
122, 128, 134, 136, 139, 143, 157, 158, 165, 173, 174,
189, 190, 191
File name, 35
Filter, 5, 1, 15, 27, 37, 105, 166, 173, 190
First Lift, 31, 122
First Lift to Record Velocity, 31, 122
Floppy Drive, 21, 157
Flow, 1, 3, 4, 5, 6, 1, 2, 3, 4, 5, 6, 7, 9, 10, 12, 13, 14, 16,
17, 18, 20, 21, 22, 23, 25, 26, 28, 29, 30, 35, 36, 41, 42,
43, 44, 45, 47, 48, 56, 57, 59, 60, 62, 63, 65, 66, 67, 68,
69, 70, 71, 72, 75, 76, 77, 78, 80, 83, 86, 87, 94, 97, 101,
102, 103, 105, 108, 111, 112, 113, 116, 117, 118, 119,
120, 122, 123, 124, 125, 126, 127, 128, 129, 130, 131,
134, 135, 136, 137, 139, 140, 145, 147, 148, 149, 150,
151, 152, 153, 155, 157, 160, 162, 165, 166, 167, 171,
172, 173, 174, 175, 176, 187, 189, 190, 191
Flow Area, 69, 70, 71, 76, 77, 78, 86, 87, 94, 129, 136,
137, 140, 167, 189, 190
Flow Coef, 2, 28, 68, 69, 70, 86, 94, 129, 130, 167
Flow Pres, 12, 16, 17, 57, 116, 117, 127, 145, 148, 149,
151, 165, 175
Flow Temp, 17, 57, 62, 145, 165
FlowCom, 3, 5, 6, 1, 17, 18, 19, 20, 28, 43, 57, 59, 60, 61,
62, 119, 120, 122, 123, 124, 125, 126, 127, 128, 145,
159, 165, 166, 169, 172, 173, 175, 189, 190, 191
FlwArea, 69, 70, 129
208
Port Flow Analyzer
Appendicies
FMA Flow Bench, 175
Folders, 2, 4, 7, 9, 21, 25, 26, 28, 36, 56, 80, 83, 103, 104,
106, 107, 114, 119, 122, 129, 134, 139, 155, 157, 158,
165, 173, 187
Foot Switch, 175
Format, Open/Save/Edit, 174
Free Height, 38
Fuel Flow, 74
Full Scale Reading, 42, 43, 148
Gasket Bore Dia, 52
Gasket Thickness, 51, 52
Gauge, 75, 189
Graph, 1, 7, 10, 15, 16, 20, 22, 26, 27, 28, 56, 60, 66, 68,
78, 83, 85, 86, 87, 88, 89, 90, 91, 92, 93, 94, 95, 107,
108, 132, 133, 134, 135, 136, 137, 165, 166, 173, 174,
189, 190
Graph Dot Matrix Printer Adjustment, 28
Graph line thickness, 27, 190
Graph Type, 7, 86, 133, 135, 136
Graphics, 173
Graphs, 5, 85, 87, 88, 89, 95, 133, 135, 136, 139, 167, 174,
189, 190
Grid, 166
Gross Valve Lift, 47, 53
Head #, 36, 56, 108, 114, 121, 122, 165, 166
Head Comments, 35, 36
Head Details, 5, 23, 36, 37, 55, 97, 98, 112, 121, 155, 166,
173, 174
Head Porter, 85, 95, 132, 189, 190, 191
Head Specs, 5, 7, 8, 14, 16, 21, 23, 27, 33, 35, 36, 40, 56,
70, 74, 75, 97, 98, 101, 111, 112, 113, 114, 115, 116,
117, 120, 121, 155, 166, 174
Header, 75
Height, 34, 37, 52, 75, 121, 173
Help, 2, 3, 5, 7, 8, 15, 23, 36, 43, 51, 55, 61, 113, 165, 175,
187, 189
History Log, 5, 1, 20, 27, 63, 88, 102, 107, 108, 134, 174
horsepower, 1, 3, 12, 139
Hot Wire, 190, 191
HP, 48, 70, 72, 73, 74, 76, 77, 139, 140, 143, 176
Ht, 40
Hub, 6, 187
Humidity, 1, 19, 30
Import, 1, 63, 165, 174
Inclined Flow Manometer, 16, 17, 42, 148
Include a Zero Lift (.000) Point ?, 31
Include Averages, 174
Include Text, 83
Install, 22, 36, 89, 171, 173
Installed Height, 37, 38, 39
Intake Adapter, 29
JKM, 166, 175, 191
jpg, 173
(C) Performance Trends Inc 2007
L/D, 16, 31, 56, 67, 70, 71, 80, 81, 86, 98, 116, 122, 129,
130, 165, 166, 167, 173
Landscape, 108, 189, 190
lash, 45, 46, 47, 48, 78, 94
Lash, 45, 46, 47, 48
Layout, 15, 74, 75
Leakage, 14, 17, 31, 57, 59, 60, 78, 116, 117, 118, 122,
123, 126, 128, 151, 191
legend, 89, 92, 108, 137, 190
Length, 27, 34, 37, 74, 121
LFE, 191
Library, 9, 10, 12, 20, 26, 36, 57, 65, 80, 87, 88, 101, 102,
103, 105, 106, 107, 111, 118, 119, 129, 131, 134, 139,
155, 157
lift, 16, 31, 34, 38, 45, 46, 47, 48, 53, 66, 67, 69, 70, 71,
76, 77, 80, 94, 98, 116, 117, 118, 122, 126, 128, 129,
130, 133, 135, 173, 189, 191
Lift, 16, 31, 39, 46, 47, 48, 53, 57, 59, 62, 67, 68, 70, 71,
76, 80, 81, 86, 94, 116, 117, 122, 127, 129, 130, 132,
133, 136, 165, 167, 173
Lift for Rating Events, 46, 48
lifter, 48
Lifter, 46, 48, 77
Lifter (profile) Type, 46, 48
Line thickness, 27, 190
Linear Scale (like a ruler), 43, 148
Lobe Area, 76, 78
Lobe Center, 76
lobe centerline, 143
Lobe Separation, 49, 77
Lock Groove, 37
Locks, 39
Logo, Company (picture), 173, 174
Main Screen, 5, 2, 5, 6, 7, 9, 10, 13, 14, 15, 20, 21, 22, 23,
25, 26, 27, 35, 36, 55, 56, 57, 59, 60, 64, 65, 85, 87, 88,
102, 103, 106, 107, 114, 115, 116, 119, 120, 123, 127,
128, 129, 133, 135, 136, 139, 140, 143, 157, 171, 173,
175
Main Screen Graph Lines, 27
Main Screen, Other Cyl. Graphs, 15, 26
manometer, 12, 13, 14, 16, 17, 20, 29, 42, 43, 44, 60, 62,
112, 117, 147, 148, 149, 150, 151, 153, 162, 163, 176
Margin Width, 38
Mass air flow sensor, 190
Mass Flow, 166, 167, 191
Master Bench Specs, 41, 112, 113, 120
Material, 40
Max Lobe Lift, 46, 47, 48, 53
Max Setting, 31
Max Tappet Lift, 51
Max Valve Lift, 38, 39
Metric, 166, 176
Motor controller, 171, 190
Network, 6, 25, 165, 187
Networking, 6, 25, 165, 173, 187
Port Flow Analyzer
Appendicies
New Exh Test Pres, 64, 67, 86, 87
New Int Test Pres, 64, 67, 86
New Test, 5, 14, 20, 55, 56, 57, 67, 111, 112, 113, 114,
119, 120, 121, 122, 123, 125, 166
Number of Cylinders to Test, 21, 56
Number of Rows of Data, 29
Offset, 162, 163
Open, 7, 9, 20, 21, 26, 35, 37, 55, 57, 101, 102, 105, 106,
107, 117, 119, 124, 125, 129, 131, 134, 135, 136, 139,
157, 165, 166, 174
Open (from all saved tests), 9, 20, 102, 107, 119, 129, 136,
139
Open from Floppy Drive, 21
Open/Save/Edit, 174
Opener, Valve, 175, 190
Operator, 15, 56, 105, 106, 114, 122
orifice, 12, 14, 57, 123, 125, 126, 145, 147, 149, 150, 152,
153, 175
Orifice Std Pres, 17
Other Calc Data, 71, 72, 167
Other Data, 43
Overlap, 77, 78, 86, 167, 190
PDF, 173, 174
performance estimate, 1, 72, 75
Performance Flo, 175
Picture, 173, 189
Picture File, 173
Picture File (test piece), 189, 191
piston, 49, 52, 70, 74, 79, 140
Piston Acceleration, 166, 167
Piston Position, 166
piston speed, 74, 140
Piston Velocity, 166, 167
Pitot, 1, 20, 34, 62, 70, 79, 86, 95, 122, 127, 128, 147, 173,
175
Pitot Tube, 70, 86, 95, 127, 128, 165, 173, 175
Port Length, 27, 34, 75
Port Shape, 34, 40
Port Vel, 15, 16, 20, 31, 60, 61, 62, 64, 70, 86, 87, 95, 119,
122, 127, 173, 174, 189, 190
Port Velocity, 15, 16, 20, 60, 61, 62, 64, 86, 87, 95, 119,
122, 127, 128, 173, 174, 189, 190
Port Velocity Map, 86, 95, 173, 174, 190
Port Volume, 34, 75, 143
Preferences, 5, 7, 9, 15, 23, 25, 26, 28, 33, 34, 56, 60, 68,
69, 70, 98, 106, 107, 108, 114, 129, 165, 166, 171, 172,
173, 174, 175, 176, 187, 189
Pres at Mx V Lft, 38, 39
Printed Graph Width, % of Page, 27
Printer, 5, 2, 22, 27, 36, 63, 89, 97, 98, 131, 132, 140, 173,
174
Printer Fonts, 27, 98
Printer Orientation, 22, 36, 173, 190
Pro Version, 5, 6, 1, 2, 3, 5, 6, 8, 9, 11, 15, 16, 17, 18, 19,
20, 21, 22, 23, 25, 26, 27, 28, 30, 33, 34, 35, 36, 37, 45,
51, 56, 63, 64, 68, 69, 71, 72, 79, 80, 83, 86, 88, 92, 94,
209
(C) Performance Trends Inc 2007
95, 97, 99, 102, 105, 107, 112, 121, 129, 130, 134, 135,
139, 145, 155, 165, 166, 173, 175, 176, 190
Psuedo Flow Velocity, 166, 167, 171
Range, 16, 17, 18, 19, 44, 57, 59, 60, 62, 116, 117, 118,
123, 125, 126, 149, 150, 153, 175, 191
Range #, 16, 44, 116, 118, 149, 153
Rated Test Pressure, 42
Raw Flow Data, 65, 155, 167
record, 1, 14, 18, 19, 22, 23, 29, 30, 31, 43, 55, 57, 59, 60,
70, 71, 79, 120, 123, 125, 126, 127, 128, 149, 153, 159,
165, 166, 172, 173, 175, 176, 189, 190
Recording Switch, 175
registered, 3, 1, 2, 5, 12, 22
Reltv Hum, 19, 30
Report Type, 64, 65, 129, 130, 140, 166, 173
Restore, 155, 158, 173
Retainers, 39
re-zero, 61
Rocker Arm, 45, 46, 47, 53, 176
Rocker Arm Ratio, 45, 46, 47, 53, 176
Rod Length, 49
RPM, 3, 18, 19, 70, 71, 72, 73, 74, 75, 76, 77, 78, 140, 143,
166
runner, 1, 34, 70, 74, 75, 76, 77, 140, 176
Runner, 74, 75
Saenz, 3, 175
Safety, 73, 143
Save, 1, 7, 8, 9, 12, 20, 21, 25, 26, 35, 36, 41, 55, 56, 65,
83, 101, 102, 103, 104, 107, 108, 118, 120, 122, 128,
136, 145, 166, 173, 174, 175
Save As, 21
Save to Floppy Drive, 21
Scales, 93
Screen Resolution, 173, 174
Seat Angle, 34, 68, 69, 70
Seat Cutter #, 39
Seat Inside Dia, 33
Seat Width, 39
Seated Pressure, 38
Second Lift, 31
Second Lift to Record Velocity, 31
See Details (calibrations), 43, 160
Set Test Pres, 60, 62, 171
Setup, 4, 22, 36, 89, 171, 173
SF Cal. Test Pres. Corr., 28, 60
Shape, 40
Show Std EA Exmp Comparison, 27
Single Velocity Data Point, 173
Spring Description, 38
Spring Rate, 38, 39
Stability, 1, 15, 17, 18, 19, 72
Standard Engine Analyzer Examples, 25
Stem Diameter, 33
Stem to Guide, 37
Step Size, 31, 35
Stroke, 49, 51
210
Port Flow Analyzer
Appendicies
Summary Graph, 15, 16, 85, 117, 133
Super Flow, 3, 6, 1, 12, 14, 17, 18, 19, 27, 28, 41, 42, 43,
44, 59, 61, 62, 111, 113, 119, 120, 123, 125, 127, 145,
147, 151, 152, 153, 159, 161, 165, 172, 175, 190
Swirl, 1, 18, 30, 43, 60, 62, 64, 70, 71, 86, 87, 159, 163,
165, 166, 167, 189, 191
Switch, USB, 190
Tabs, 13, 165
Temperature, 1, 30, 145, 151, 165, 175
Test Comments, 15, 35, 55, 56, 98, 122, 191
Test Correction, 5, 14, 17, 57, 123, 124, 125, 145, 153, 175
Test Data Grid, 12, 13, 15, 16, 17, 20, 30, 31, 59, 60, 62,
65, 66, 111, 112, 117, 118, 119, 123, 126, 128
Test Folder Name in Program, 28
Test Options, 5, 14, 16, 17, 18, 19, 20, 22, 29, 56, 59, 60,
61, 62, 64, 70, 71, 79, 86, 97, 98, 101, 111, 112, 114,
115, 116, 119, 121, 122, 126, 127, 155, 165, 166, 171,
189
Test Pattern, 9, 55, 122
Test Piece, 189, 191
test pres, 1, 7, 12, 16, 17, 22, 28, 29, 42, 60, 64, 67, 69, 70,
71, 72, 79, 80, 86, 108, 126, 129, 149, 150, 152, 165,
166, 171, 172, 174, 176, 189
Test Pres, 12, 14, 16, 17, 18, 27, 29, 57, 60, 62, 64, 67, 69,
80, 86, 114, 116, 117, 123, 126, 127, 130, 145, 147, 152,
155, 165, 166, 171, 172
Test Pres. for History Mx CFM, 27
Test pressure, 1, 7, 12, 16, 17, 22, 28, 29, 42, 60, 64, 67,
69, 70, 71, 72, 79, 80, 86, 108, 126, 129, 149, 150, 152,
165, 166, 171, 172, 174, 176, 189
Test Pressure, 12, 14, 16, 17, 18, 27, 29, 57, 60, 64, 67, 69,
80, 86, 114, 127, 130, 145, 147, 152, 155, 165, 166, 171
Test Pressure Set Points, 171
test temperature, 165
test time, 1, 14
thermocouple, 161
Time/Date, 44, 56, 114, 123
Top Cutter #, 39
torque, 1, 3, 48, 70, 72, 73, 78, 139, 140, 143, 165
Torque, 73, 143
Total Cam Advance, 45, 48
Tq, 72, 143, 165
Troubleshooting, 175
Tumble, 1, 19, 30, 43, 60, 62, 64, 71, 86, 87, 159, 163, 166,
167
Tumble Settings, 30
Unlocking, 2, 5, 7, 22
Unlocking Code, 2, 5, 22
Unlocking Program Options, 2, 5, 22
USB, 165, 175, 190
USB Switch, 190
Use Cam File, 47
Use Seat Angle to Calc Vlv Area, 28, 33, 34, 68, 70, 129
Use Temp Correction, 17
Use Temperature Correction, 42
User Defined, 189
(C) Performance Trends Inc 2007
Valve Area, 2, 68, 69, 86, 94, 167
Valve Description, 14, 37
Valve Dia, 33, 56, 108, 114
Valve Diameter, 33, 56, 108, 114
Valve Length, 37
valve lift, 7, 13, 15, 16, 27, 29, 31, 46, 47, 53, 62, 67, 69,
70, 76, 77, 80, 86, 94, 98, 114, 116, 117, 118, 122, 126,
127, 129, 163, 165, 166, 171, 189
Valve Opener, 175, 190
Valve Seals, 39
Valve Vel, 28, 68, 70
Valve Weight, 37
VArea, 167
velocity, 8, 20, 22, 31, 34, 64, 70, 75, 79, 86, 87, 95, 122,
128, 165, 166, 171, 173, 189
Version 3.5, 1, 28, 31, 43, 56, 57, 63, 64, 66, 81, 83, 84,
97, 104, 107, 111, 119, 129, 132, 135, 149, 155, 158,
173
Port Flow Analyzer
Appendicies
Vlv Area, 28, 67, 69, 70, 81, 94, 129
Volume, 34, 49, 52
Volumetric Eff, 74
volumetric efficiency, 74
Wd, 40
Weather, 152, 176
Weight, 38
Wet Flow benches, 173
When Changing Head Specs Port Length, 27, 34
Which Cylinder(s), 64, 87
Width, 34, 70, 75, 121, 173
Windows, 3, 1, 2, 21, 22, 26, 27, 35, 36, 89, 102, 103, 155,
156, 157, 158, 173, 187, 189
Winflow, 165, 166, 173, 174
Wizard, 4
worksheet, 98
211