1
Mentype® DIPscreen
Manual
The entry to a quantitative chimerism analysis
In-Vitro-Diagnostics
25
100
400
Version July 2015
45-45410-0025
45-45410-0100
45-45410-0400
Batch Code
Biotype Diagnostic GmbH
Moritzburger Weg 67
D-01109 Dresden
Germany
Made in Germany
2
Biotype Diagnostic GmbH develops, produces and markets their PCR-based rapid
Mentype® Detection Kits. Our products provide customers with fast and reliable
testing methods for professional medical diagnostics.
Our Mentype® Test Kits guarantee highest quality standards for clinical research
and diagnostics.
For information and enquiries about the Mentype® DIPscreen
please do not hesitate to get in touch or visit www.biotype.de/en/home.html.
Mentype® DIPscreen
July 2015
LEUGADISv2en
Mentype® DIPscreen
3
Product description
Mentype® DIPscreen is a multiplex-PCR application developed to identify DIP
polymorphisms that individually occur in donor or recipient, and, constitute informative
loci. In a single multiplex-PCR 33 DIP-loci are simultaneously screened together with
the gender specific locus Amelogenin. Mentype® DIPscreen is a multiplex-PCR
application that mediates monitoring of chimerism samples after stem cell
transplatation. The flexible assay format allows an individual diagnostics at any time
required.
Analysis of molecular chimerism resulting from allogeneic stem cell transplantation has
become a well established method to control the course of transplant engraftment and
to assess the risk of threatening relapse. Molecular chimerism analysis can be
performed on diverse DNA-sequence motifs of which biallelic short insertion/deletion
polymorphisms (DIPs, INDELs) offer substantial benefits. Polymerase-mediated
amplification of DIP-markers does not result in formation of stutter peaks that can
hamper clear analysis. Moreover, these polymorphisms are best suited for allele
specific quantitative approaches. Mentype® DIPscreen is a DIP-based chimerism
analysis and therefore accounts for an unambiguous donor/recipient differentiation and
highly clear chimerims monitoring.
Identified informative DIP-loci can subsequently be addressed by Mentype® DIPquant
specific real-time PCR assays to approach highly quantitative chimerism monitoring.
The 33 DIP loci addressed by Mentype® DIPscreen are distributed over 18
chromosomes, and are at least separated by 10 Mbp each (see Tab. 1). The detection
limit of Mentype® DIPscreen is about 200 pg genomic DNA. The optimal range under
standard conditions is 1.0 -2.0 ng DNA. For fast and sensitive fragment length
analysis primers are fluorescence-labelled with 6-FAM, BTG, or BTY.
The test kit was validated and evaluated using the GeneAmp® 9700 Silver, Eppendorf
Mastercycler ep-S, Biometra T1, ABI PRISM® 3130 Genetic Analyzer running with
36 cm capillary array and POP4® polymer. Development, manufacture and distribution
of Biotype® products are certified according to DIN EN ISO13485.
Mentype® DIPscreen
July 2015
LEUGADISv2en
4
Content
1. Description of the Mentype® DIPscreen .......................................................... 5
Outline of working steps performed with Mentype® DIP-products ......................... 8
2. PCR amplification .......................................................................................... 9
2.1 Master mix preparation............................................................................ 9
2.2 PCR amplification parameter .................................................................. 10
3. Electrophoresis using the ABI PRISM® 310 Genetic Analyzer ......................... 11
3.1 Matrix generation .................................................................................. 11
3.2 Sample preparation ............................................................................... 14
3.3 Setting up the Data Collection Software .................................................. 14
3.4 Analysis parameter ............................................................................... 15
4. Electrophoresis using the ABI PRISM® 3100-Avant/3100 Genetic Analyzer ..... 16
4.1 Spectral calibration / matrix generation................................................... 16
4.2 Sample preparation ............................................................................... 18
4.3 Setting up the Data Collection Software .................................................. 19
4.4 Analysis parameter / analysis method .................................................... 20
5. Electrophoresis using the ABI PRISM® 3130/3130xl Genetic Analyzer ............ 21
5.1 Spectral calibration / matrix generation................................................... 21
Sample preparation ..................................................................................... 24
5.2 Setting up the Data Collection Software .................................................. 25
5.3 Analysis parameter / analysis method .................................................... 27
6. Electrophoresis using the ABI PRISM® 3500/3500xL Genetic Analyzer ........... 28
6.1 Spectral calibration / matrix generation................................................... 28
6.2 Sample preparation ............................................................................... 31
6.3 Setting up a run .................................................................................... 32
7. Analysis ...................................................................................................... 35
7.1 Biotype® template files .......................................................................... 36
7.2 Controls................................................................................................ 37
7.3 Lengths of fragments and alleles............................................................ 38
8. Interpretation of results ................................................................................ 42
9. References ................................................................................................. 43
10. Explanation of Symbols .............................................................................. 43
Mentype® DIPscreen
July 2015
LEUGADISv2en
5
1. Description of the Mentype® DIPscreen
Table 1. Locus-specific information of Mentype® DIPscreen
DIP Locus
Chromosomal
position
Motive (-DIP / +DIP)
FAM Panel
AM X
Xp22.1-22.3
AM Y
Yp11.2
HLD106
16q13
-/AATGCGT
HLD70
6q16.1
-/AGCA
HLD84
8q24.12
-/CTTTC
HLD103
12q23.1
-/GCTTATAA
HLD104
13q32.1
-/ACTC
HLD116
18p11.22
-/AGGTGTCGAACAACATGATAC
HLD112
17p12
-/TTGTA
HLD307
Xp11.23
-/TCAACCAA
HLD310
2p22.3
-/GTCTGGTT
HLD110
16q22.1
-/TCCCTG
HLD133
3p22.1
-/CAACCTGGATT
HLD79
7q31.2
-/AATCT
HLD105
14q24.3
-/ATAGACAA
HLD140
3q23
-/GGTAGTATGGGCCT
HLD163
12q24.31
-/AACTACGGCACGCCC
BTG Panel
HLD91
11q14.1
-/GATA
HLD23
18p11.32
-/CTTTAA
HLD88
9q22.33
-/CCACAAAGA
HLD101
15q26.1
-/GTAG
HLD67
5q33.3
-/CTACTGAC
HLD301
17q21.32
-/CAGGGGCTC
HLD53
3q22.1
-/ATGT
HLD97
13q13.1
-/AGAGAAAGCTGAAG
HLD152
16p13.2
-/TGGTCAAAGGCA
HLD128
1q31.3
-/ATTAAATA
HLD134
5q11.2
-/ATGATGGTTCTTCAGA
HLD305
20q11.22
-/CAAGGTCCCACCACACTCGCGTGGGA
BTY Panel
HLD48
2q11.2
-/GACTT
HLD114
17p13.2
-/TCCTATTCTACTCTGAAT
HLD304
9q34.3
-/GAGCTGCTCAAGAGAGAGG
HLD131
7q36.2
-/TTGGGCTTATT
HLD38
1q32.2
-/TAGTT
HLD82
7q21.3
-ACCTCCTACTCCTTGGTCTATTCCTGGTCACATGTACT
Abbreviations: HLD = Human Locus DIP, -DIP = Deletion, +DIP = Insertion
Table 1 shows the chromosomal position, motif and respective reference allele of DIP-loci
addressed by Mentype® DIPscreen.
Mentype® DIPscreen
July 2015
LEUGADISv2en
6
Kit Content
Mentype® DIPscreen (100 Reactions)
Nuclease-free water
Reaction mix A
Primer mix
Multi Taq2 DNA polymerase
Control DNA XY13 (2ng/µl)
DNA Size Standard 550 (BTO)
Allelic ladder
3.0 ml
500 µl
500 µl
60 µl
10 µl
50 µl
25 µl
Ordering information
Mentype® DIPscreen
Mentype® DIPscreen
Mentype® DIPscreen
25 reactions
100 reactions
400 reactions
Cat. No.
Cat. No.
Cat. No.
45-45410-0025
45-45410-0100
45-45410-0400
Storage
Store all components at -20 °C and avoid repeated thawing and freezing. Primer mix
and allelic ladder must be stored protected from light. The DNA samples and post-PCR
reagents (allelic ladder and DNA size standard) should be stored separately from the
PCR reagents. The expiry date is indicated on the kit cover.
Additionally required reagents
Additional reagents are required in order to use the Biotype® PCR Amplification Kit:
Reagent
Hi-Di™ Formamide, 25 ml
Matrix Standards BT5
single-capillary instruments (5x25 µl)
Matrix Standards BT5
multi-capillary instruments (25 µl)
Matrix Standards BT5
multi-capillary instruments (50 µl)
Mentype® DIPscreen
July 2015
Supplier
Applied Biosystems
Order Number
4311320
Biotype Diagnostic GmbH
00-10411-0025
Biotype Diagnostic GmbH
00-10421-0025
Biotype Diagnostic GmbH
00-10421-0050
LEUGADISv2en
7
Warning and safety instructions
The PCR Amplification Kit contains the following potentially hazardous chemicals:
Kit component
Reaction mix
Chemical
Sodium azide NaN3
Hazards
toxic if swallowed, develops toxic gases
when it gets in contact with acids
Observe the Material Safety Data Sheets (MSDS) for all Biotype® products, which are
available on request. Please contact the respective manufacturers for copies of the
MSDS for any additionally needed reagents.
Quality assurance
All kit components undergo an intensive quality assurance process at Biotype
Diagnostic GmbH. The quality of the test kits is permanently monitored to ensure
unrestricted usability. Please contact us if you have any questions regarding quality
assurance.
Trademarks and patents
Mentype® is a registered trademark of Biotype Diagnostic GmbH.
ABI PRISM®, GeneMapper® GeneAmp® and Applied Biosystems® are registered
trademarks of Applied Biosystems LLC.
Under the law of Europe POP4® is registered trademark of Applied Biosystems LLC.
The PCR is covered by patents. Patentees are Hoffmann-La Roche Inc. and
F. Hoffmann-La Roche (Roche).
Mentype® DIPscreen
July 2015
LEUGADISv2en
8
Outline of working steps performed with Mentype® DIP-products
Sampling
DNA Isolation
Genotyping for Informative Alleles
Mentype® DIPscreen
Identify Recipient Specific Alleles
Relative Quantification of Alleles
Mentype® DIPquant
Analysis of Chimerism Status
From sample to analysis – Monitoring chimerism with the Mentype® DIPscreen and the Mentype® DIPquant
assay
Mentype® DIPscreen
July 2015
LEUGADISv2en
9
Protocols for PCR amplification, electrophoresis and analysis
2. PCR amplification
2.1 Master mix preparation
The table below shows the volumes of all PCR reagents per 25 µl reaction volume,
including a sample volume of 1.0 µl (template DNA). The number of reactions to be set
up shall be determined taking into account positive and negative control reactions. Add
one or two reactions to this number to compensate the pipetting error.
Component
Nuclease-free water
Reaction mix A*
Primer mix
Multi Taq2 DNA polymerase (hot start, 2.5 U/µl)
Volume of master mix
Volume
13.4 µl
5.0 µl
5.0 µl
0.6 µl
24.0 µl
* contains Mg2+, dNTPs, BSA
All components should be mixed (vortex) and centrifuged for about 10 s before
preparing the master mix. The DNA volume applied to the assay depends on its
concentration. For reference samples 1 µl is mostly sufficient. For critical patient
samples the amount of template can be increased appropriately. Fill up the final
reaction volume to 25 µl with nuclease-free water.
Generally, DNA templates shall be stored in nuclease-free water or in diluted TE buffer
(10 mM Tris HCl, pH 8.0 and 1 mM EDTA), e.g. 0.1x TE buffer.
The primer mixes are adjusted for balanced peak heights at 28 PCR cycles and 1 ng
Control DNA XY13 in a reaction volume of 25 µl. If more DNA template is applied,
higher peaks can be expected for small PCR fragments and relatively low peaks for
large fragments. Reduce the amount of DNA template to correct this imbalance.
Positive control
For the positive amplification control, dilute the Control DNA XY13 to 1 ng/µl.
Instead of the template DNA, pipette the diluted Control DNA into a reaction tube
containing the PCR master mix.
Negative control
For the negative amplification control, pipette nuclease-free water instead of template
DNA into a reaction tube that contains the PCR master mix.
Template DNA
Sometimes, measured DNA concentration varies depending on the quantification
method used. It might thus be necessary to adjust the optimal DNA amount.
Mentype® DIPscreen
July 2015
LEUGADISv2en
10
2.2 PCR amplification parameter
Perform a “hot start” PCR in order to activate the Multi Taq2 DNA Polymerase and to
prevent formation of non-specific amplification products.
The number of cycles depends on the amount of DNA applied. 28 PCR cycles are
recommended for all samples.
Standard method
Recommended for all DNA samples
Temperature
94°C
94°C
60°C
72°C
68°C
10°C
Time
4 min (hot start for activation of the Multi Taq2 DNA polymerase)
30 s
120 s
28 cycles
75 s
60 min
∞
hold
Note: To provide an optimal kit balance the ramping rate of the thermal cycler should
be adjusted to 4-5 °C/s.
Very small amounts of DNA may result in statistical dropouts and imbalances of the
peaks. Increasing numbers of PCR cycles raise the risk of cross contamination caused
by minimal amounts of impurities. Furthermore, unspecific amplification products could
appear.
Mentype® DIPscreen
July 2015
LEUGADISv2en
11
3. Electrophoresis using the ABI PRISM ® 310 Genetic Analyzer
For general instructions on instrument setup, matrix generation and application of the
GeneScan® or GeneMapper® ID software, refer to the ABI PRISM® 310 Genetic
Analyzer User’s Manual. Electrophoresis using the GeneScan® software is described
below.
The virtual filter set G5 shall be used for combined application of the five fluorescent
labels 6-FAM, BTG, BTY, BTR, and BT0 (the matrix standard will be called BT5
hereinafter).
Material
Capillary
Polymer
Buffer
47 cm / 50 µm (green)
POP4® for 310 Genetic Analyzer
10x Genetic Analyzer Buffer with EDTA
3.1 Matrix generation
Prior to conducting DNA fragment size analysis with the Filter Set G5, a matrix with the
five fluorescent labels 6-FAM, BTG, BTY, BTR, and BTO must be generated.
Color
Blue (B)
Green (G)
Yellow (Y)
Red (R)
Orange (O)
Matrix standard
6-FAM
BTG
BTY
BTR
BTO
Five electrophoresis runs shall be conducted, one for each fluorescent label, 6-FAM,
BTG, BTY, BTR, and BTO. Use the same conditions as for samples and allelic ladders
of the Biotype® test kit to generate suitable matrix files.
Matrix sample
Component
Hi-Di™ Formamide
Matrix standard 6-FAM
Volume
12.0 µl
1.0 µl
Matrix sample 2
Hi-Di™ Formamide
Matrix standard BTG
12.0 µl
1.0 µl
Matrix sample 3
Hi-Di™ Formamide
Matrix standard BTY
12.0 µl
1.0 µl
Matrix sample 4
Hi-Di™ Formamide
Matrix standard BTR
12.0 µl
1.0 µl
Matrix sample 5
Hi-Di™ Formamide
Matrix standard BTO
12.0 µl
1.0 µl
Matrix sample 1
- Denaturation for 3 min at 95°C
- Cool down to 4°C and place samples on the autosampler tray
- Create a Sample Sheet choose 5 Dyes and enter a sample designation
Mentype® DIPscreen
July 2015
LEUGADISv2en
12
Injection list for matrix generation
Parameter
Module File
Matrix File
Size Standard*
Injection [s]
Injection [kV]
Run [kV]
Run [°C]
Run Time [min]
Set up
GS STR POP4 (1 ml) G5
NONE
NONE
5
15.0
15.0
60
24
* Prepare matrix standards always without DNA Size Standard (BTO)
Analysis of the matrix samples
- Run the GeneScan® software
- File New Project (open folder of current run) Add Sample Files
- Select a matrix sample in the Sample File column
- Sample Raw Data
- Check the matrix samples for a flat baseline. As shown in the figure below there
should be at least five peaks with peak heights about 1000-4000 RFU (Y-axis) for
each matrix sample (optimal range: 2000-4000 RFU)
▼ 3200 Data Points (X)
5500▼
Fig. 1 Electropherogram with raw data of the matrix standard 6-FAM
- Select an analysis range with flat baseline and re-inject the matrix sample if
necessary
- Note down start and end value (data points) of the analysis range, e.g. start value
3200, end value 5500
- Calculate the difference, e.g. 5500-3200 = 2300 data points
Mentype® DIPscreen
July 2015
LEUGADISv2en
13
Generation of a new matrix
- File New Matrix
Fig. 2 Matrix sample selection
- Import matrix samples for all dyes (B, G, Y, R, O)
- Enter a Start At value, e.g. 3200
- Enter the calculated difference under Points, e.g. 2300
- Click on OK to calculate the new matrix
Fig. 3 New matrix BT5
- Save the matrix in the matrix folder: File Save as, e.g. Matrix BT5
Matrix check
Check the new matrix with current samples.
- File New Project (open folder of the respective run) Add Sample Files
- Select sample(s) in the Sample File column
- Sample Install New Matrix (open matrix folder and select new matrix)
- Re-analyse your samples
There should be no pull-up peaks between the dye panels (B, G, Y, R, O) with the new
matrix.
Mentype® DIPscreen
July 2015
LEUGADISv2en
14
3.2 Sample preparation
Component
Hi-Di™ Formamide
DNA Size Standard 550 (BTO)
Prepare 12 µl of the mix (formamide + DNA size standard) for all samples
Add 1 µl PCR product (diluted if necessary) or allelic ladder
- Denaturation for 3 min at 95 °C
- Cool down to 4 °C and place samples on the autosampler tray
Volume
12.0 µl
0.5 µl
Signal intensities
Options to increase the signal intensity:
- Reduce the volume of the DNA Size Standard 550 (BTO) to peak heights of
about 500 relative fluorescent units (RFU)
- Purify the PCR products before starting the analysis
3.3 Setting up the Data Collection Software
- Create a Sample Sheet and enter a sample designation
Injection list
Parameter
Module File
Matrix File
Size Standard
Injection [s]*
Injection [kV]
Run [kV]
Run [°C]
Run Time [min]**
Set up
GS STR POP4 (1 ml) G5
e.g. Matrix BT5
e.g. SST-BTO_60-450bp
5
15.0
15.0
60
26
* Deviating from the standard settings, the injection time may range between 1 and 20 s depending on the type
of sample. If reference samples with very high signal intensities are recorded, a shorter injection time may be
selected in order to avoid pull-up peaks. For samples with low DNA content an injection time of up to 20 s may
be necessary.
** Depending on the analysis conditions, the run time for Mentype ® DIPscreen was modified in order to be able
to analyse fragments with lengths of up to 450 bp.
Mentype® DIPscreen
July 2015
LEUGADISv2en
15
3.4 Analysis parameter
The recommended analysis parameters are:
Analysis Range
Data Processing
Peak Detection
Size Call Range
Size Calling Method
Split Peak Correction
Full Range
Baseline: Checked
Multicomponent: Checked
Smooth Options: Light
Peak Amplitude Thresholds
B:* Y:*
G:* R:*
O:*
Min. Peak Half Width: 2 pts
Polynominal Degree: 3
Peak Window Size: 15 pts
Min: 60
Max: 550
Local Southern Method
None
* The peak amplitude threshold (cutoff value) corresponds to the minimum peak height that will be detected by
the GeneScan® or GeneMapper® ID software. Thresholds are usually 50-200 RFU and should be determined
individually by the laboratory. Recommendation: The minimal peak height should be three times as high as the
background noise of the baseline.
Mentype® DIPscreen
July 2015
LEUGADISv2en
16
4. Electrophoresis using the ABI PRISM® 3100-Avant/3100 Genetic Analyzer
For detailed instructions on instrument setup, spectral calibration, application of the
ABI PRISM® 3100 Data Collection Software version 1.01 or 1.1 and the GeneScan®
software, refer to the ABI PRISM ® 3100-Avant/3100 Genetic Analyzer User’s Manual.
For systems with Data Collection Software 2.0 or 3.0 refer to chapter 5.
The system with 4 capillaries is named ABI 3100-Avant, and the system with 16
capillaries is named ABI 3100.
The virtual filter set G5 shall be used for combined application of the five fluorescent
labels 6-FAM, BTG, BTY, BTR, and BT0 (the matrix standard will be called BT5
hereinafter).
Material
Capillary
Polymer
Buffer
36 cm Capillary Array for 3100-Avant/3100
POP-4® Polymer for 3100
10x Genetic Analyzer Buffer with EDTA
4.1 Spectral calibration / matrix generation
Proper spectral calibration is critical to evaluate multicolour systems with the ABI
PRISM® 3100-Avant/3100 Genetic Analyzer and shall be done prior to conducting
fragment length analysis with the five fluorescent labels 6-FAM, BTG, BTY, BTR, and
BT0. The calibration procedure creates a matrix which is used to correct the
overlapping of fluorescence emission spectra of the dyes.
Spectral calibration comprises the following steps:
- Preparation of the spectral calibration standards
- Loading the standards to the 96-well reaction plate (one sample per capillary)
- Entering the plate composition
- Performing a spectral calibration run and checking the matrix
Setting up the spectral calibration standards
Example for 4 capillaries / ABI 3100-Avant
Component
Hi-Di™ Formamide
Matrix standard BT5
- Load 12 μl of the mix to a 96-well reaction plate, e.g. position A1-D1
- Denaturation for 3 min at 95 °C
- Cool down to 4 °C and place samples on the autosampler tray
Volume
60.0 µl
5.0 µl
Example for 16 capillaries / ABI 3100
Component
Volume
Hi-Di™ Formamide
204.0 µl
17.0 µl
Matrix standard BT5
- Load 12 μl of the mix to a 96-well reaction plate, e.g. position A1-H1 and A2-H2
- Denaturation for 3 min at 95 °C
- Cool down to 4 °C and place samples on the autosampler tray
Mentype® DIPscreen
July 2015
LEUGADISv2en
17
Performing a spectral calibration run
First of all, the parameter file for DyeSetG5 must be modified once to achieve
successful calibration with the Data Collection software version 1.0.1 or 1.1.
Spectral parameter
To change settings in the parameter file go to the following path:
D:\AppliedBio\Support Files\Data Collection Support Files\CalibrationData\Spectral
Calibration\ParamFiles
- Select MtxStd{Genescan_SetG5} to open the PAR-file
- Change Condition Bounds Range to [1.0; 20.0]
- Select File Save As to save the parameter file under a new name, e.g.
MtxStd{Genescan_SetG5_BT5}.par
Always use this parameter file for spectral calibration runs using Biotype® matrix standards
BT5.
Plate Editor for spectral calibration (I)
- Place the 96-well plate on the autosampler tray
- Run the ABI PRISM® 3100 Data Collection software
- In Plate View click New to open the Plate Editor dialog box
- Enter a name of the plate
- Select Spectral Calibration
- Select 96-Well as plate type and click on Finish
Plate editor for spectral calibration (II)
Parameter
Sample Name
Dye Set
Spectral Run Module
Spectral Parameters
Set up
Type name for the matrix samples
G5
Default (e.g. Spect36_POP4®)
MtxStd{GeneScan_SetG5_BT5}.par (parameters created before)
- Click into the column header to select the entire column, select Edit → Fill Down to
apply the information of the selected samples and confirm with OK
- Link your reaction plate on the autosampler tray with the created plate ID and start
run
- On completion of the run check in the Spectral Calibration Result dialog box if all
capillaries have successfully passed calibration (label A). If individual capillaries are
labelled X, refer to ABI PRISM ®Genetic Analyzer User’s Manual.
- Click on OK to confirm completion of the run
Mentype® DIPscreen
July 2015
LEUGADISv2en
18
Matrix check
- Select Tools → Display Spectral Calibration → Dye Set → G5 to review the
spectral calibration profile for each capillary
- The quality value (Q value) must be greater than 0.95 and the condition number
(C value) must be between 1 and 20. Both values must be within the previously
determined range
- Check the matrix samples for a flat baseline. There should be five peaks with peak
heights of about 1000-5000 RFU (Y-axis) in each matrix sample (optimal range:
2000-4000 RFU)
- If all capillaries have passed the calibration, the last calibration file for Dye Set G5
must be activated manually under Tools → Set Active Spectral Calibration. Rename
the calibration file under Set Matrix Name (e.g. BT5_Date of calibration)
- If calibration was not successful, try to re-inject the samples with higher injection
voltage or injection time. The editing of the Spectral Run Module will be necessary.
You can re-inject the same samples up to three times. Otherwise use more matrix
standard for spectral calibration
- Check the new matrix with your current samples. There should be no pull-up peaks
between the dye panels (B, G, Y, R, O) with the new matrix
4.2 Sample preparation
Component
Hi-Di™ Formamide
DNA Size Standard 550 (BTO)
Prepare 12 µl of the mix (formamide + DNA size standard) for all samples
Add 1 µl PCR product (diluted if necessary) or allelic ladder
- Denaturation for 3 min at 95 °C
- Cool down to 4 °C and place the samples on the autosampler tray
Volume
12.0 µl
0.5 µl
Since injections take place simultaneously on all capillaries, 4 or 16 samples must be
pipetted on the plate of multi-capillary analyzers. If fewer samples are analysed, the
empty positions must be filled with 12 µl Hi-Di™ Formamide.
To ensure a reliable allelic assignment on multi-capillary analyzers, several ladders
should be run.
Room temperature may influence the performance of PCR products on multi-capillary
instruments, so that shoulder peaks or split peaks occur especially at low
temperatures. Pay attention to keeping ambient conditions as recommended by the
instrument manufacturer. Optimal will be a stable room temperature > 22 °C.
Mentype® DIPscreen
July 2015
LEUGADISv2en
19
Signal intensities
Options to increase the signal intensity:
- Reduce the volume of the DNA Size Standard 550 (BTO) to peak heights of about 500
relative fluorescent units (RFU)
- Purify the PCR products before starting the analysis
4.3 Setting up the Data Collection Software
Edit the default run module in Dye Set G5 once for the first run.
- Select Module Editor to open the dialog box
- Select the appropriate Run Module as template from the GeneScan table
- Modify the Injection Voltage to 3 kV and the Injection Time to 10 s
Run Module 3kV_10s_450bp
Parameter
Run Temperature [°C]
Cap Fill Volume
Maximum Current [A]
Current Tolerance [A]
Run Current [A]
Voltage Tolerance [kV]
Pre Run Voltage [kV]
Pre Run Time [s]
Injection Voltage [kV]
Injection Time [s]*
Run Voltage [kV]
Number of Steps
Voltage Step Interval
Data Delay Time [s]
Run Time [min]**
Set up
Default
Default
Default
Default
Default
Default
Default
Default
3.0
10
Default
Default
Default
Default
25
* Deviating from the standard settings, the injection time may range between 1 and 20 s depending on the type
of sample. If reference samples with very high signal intensities are recorded, a shorter injection time may be
selected in order to avoid pull-up peaks. For samples with low DNA content an injection time of up to 20 s may
be necessary.
** Depending on the analysis conditions, the Run Time for Mentype® DIPscreen was modified in order to be
able to analyse fragments with lengths of up to 450 bp.
- Click on Save As, enter the name of the new module (e.g. 3kV_10s_450bp) and
confirm with OK
- Click on Close to exit the Run Module Editor
Starting the run
- Place the prepared 96-well plate on the autosampler tray
- Run the ABI PRISM® 3100 Data Collection software
- In Plate View click on New to open the Plate Editor dialog box
- Enter a name of the plate
- Select GeneScan
- Select 96-Well as plate type and click on Finish
Mentype® DIPscreen
July 2015
LEUGADISv2en
20
Plate Editor
Parameter
Sample Name
Dyes
Colour Info
Project Name
Dye Set
Run Module*
Analysis Module 1
Set up
enter a name
O
Ladder or sample
e.g. 3100_Project1
G5
3kV_10s_450bp
DefaultAnalysis.gsp
* parameter see above
- Complete the table in the Plate Editor and click on OK
- Click into the column header to select the entire column and select Edit → Fill Down
to apply the information of the selected samples
- Link your reaction plate on the autosampler tray with the created plate ID and start
the run
- On completion of the run, view data as Color Data in Array View of the 3100 Data
Collection software or as Analyzed Sample Files under
D:/AppliedBio/3100/DataExtractor/ExtractRuns
4.4 Analysis parameter / analysis method
The recommended analysis parameters are:
Analysis Range
Data Processing
Peak Detection
Size Call Range
Size Calling Method
Split Peak Correction
Full Range
Baseline: Checked
Multicomponent: Checked
Smooth Options: Light
Peak Amplitude Thresholds
B:* Y:*
G:* R:*
O:*
Min. Peak Half Width: 2 pts
Polynominal Degree: 3
Peak Window Size: 15 pts
Min: 60
Max: 550
Local Southern Method
None
* The peak amplitude threshold (cutoff value) corresponds to the minimum peak height that will be detected by
the GeneScan® or GeneMapper® ID software. Thresholds are usually 50-200 RFU and should be determined
individually by the laboratory. Recommendation: The minimal peak height should be three times as high as the
background noise of the baseline.
Mentype® DIPscreen
July 2015
LEUGADISv2en
21
5. Electrophoresis using the ABI PRISM ® 3130/3130xl Genetic Analyzer
For detailed instructions on instrument setup, spectral calibration, or application of the
ABI PRISM® Data Collection software version 3.0 and the GeneMapper® ID/ID-X
software, refer to the ABI PRISM ® 3130/3130xl Genetic Analyzers Getting Started
Guide.
The system with 4 capillaries is named ABI 3130, and the system with 16 capillaries is
named ABI 3130xl.
The virtual filter set Any5Dye shall be used for the combined application of the five
fluorescent labels 6-FAM, BTG, BTY, BTR, and BT0 (the matrix standard will be called
BT5 hereinafter).
Material
Capillary
Polymer
Buffer
36 cm Capillary Array for 3130/3130xl
POP4® Polymer for 3130
10x Genetic Analyzer Buffer with EDTA
5.1 Spectral calibration / matrix generation
Prior to conducting DNA fragment size analysis, it is necessary to perform a spectral
calibration with the five fluorescent labels 6-FAM, BTG, BTY, BTR, and BTO for each
analyzer. The calibration procedure creates a matrix which is used to correct the
overlapping of fluorescence emission spectra of the dyes.
Spectral calibration comprises the following steps:
- Preparation the spectral calibration standards
- Loading the standards to the 96-well reaction plate (one sample per capillary)
- Creating the instrument protocol for spectral calibration (Protocol Manager)
- Defining the plate composition in the plate editor (Plate Manager)
- Performing a spectral calibration run and checking the matrix
Mentype® DIPscreen
July 2015
LEUGADISv2en
22
Setting up the spectral calibration standards
Example for 4 capillaries/ABI 3130
Component
Hi-Di™ Formamide
Matrix standard BT5
- Load 12 μl of the mix to a 96-well reaction plate, e.g. position A1-D1
- Denaturation for 3 min at 95 °C
- Cool down to 4 °C and place samples in the autosampler tray
Volume
60.0 µl
5.0 µl
Example for 16 capillaries/ABI 3130xl
Component
Volume
Hi-Di™ Formamide
204.0 µl
17.0 µl
Matrix standard BT5
- Load 12 μl of the mix to a 96-well reaction plate, e.g. position A1-H1 and A2-H2
- Denaturation for 3 min at 95 °C
- Cool down to 4 °C and place samples in the autosampler tray
Performing a spectral calibration run
- Place the 96-well plate on the autosampler tray
- In the Protocol Manager of the Data Collection software click on New in Instrument
Protocol to open the Protocol Editor dialog box
Instrument Protocol for spectral calibration
Protocol Editor
Name
Type
Dye Set
Polymer*
Array Length*
Chemistry
Run Module*
Set up
User (e.g. Spectral36_POP4_BT5)
SPECTRAL
Any5Dye
User (e.g. POP4)
User (e.g. 36cm)
Matrix Standard
Default (e.g. Spect36_POP4_1)
* Depends on the type of polymer and length of capillary used
- Click on OK to leave the Protocol Editor dialog box
- In the Plate Manager of the Data Collection software, click on New to open the New
Plate Dialog box
Plate Editor for spectral calibration (I)
New Plate Dialog
Name
Application
Plate Type
Owner Name / Operator Name
Set up
e.g. Spectral_BT5_date
Spectral Calibration
96-Well
…
- Click on OK. A new table in the Plate Editor will open automatically
Mentype® DIPscreen
July 2015
LEUGADISv2en
23
Plate Editor for spectral calibration (II)
Parameter
Sample Name
Priority
Instrument Protocol 1
Set up
Enter name for the matrix samples
e.g. 100
Spectral36_POP4_BT5 (setting described before)
- Click into the column header to select the entire column, select Edit → Fill Down to
apply the information to all selected samples, and click on OK
- In the Run Scheduler click on Find All, select Link to link the reaction plate on the
autosampler up with the newly created plate record (position A or B) and start the run
O,
R,
Y,
G,
B
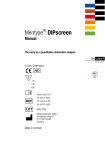
Fig. 4 Electropherogram of spectral calibration with matrix standard BT5 on an ABI 3130
Matrix check
- The quality value (Q value) of each capillary must be greater than 0.95 and the
condition number range (C value) must be between 1 and 20
- Check the matrix samples for a flat baseline. As shown in the figure above, there
should be five peaks with peak heights of about 1000-5000 RFU (Y-axis) in each
matrix sample (optimal range: 2000-4000 RFU)
- If all capillaries have passed the test, the last calibration file for the Dye Set Any5Dye
is activated automatically in the Spectral Viewer. Rename the calibration file (e.g.
BT5_Date of calibration) using the respective button
- If calibration was not successful, try to re-inject the samples with higher injection
voltage or injection time. Editing of the Spectral Run Module will be necessary. You
can re-inject the same samples up to three times. Otherwise use more matrix
standard for spectral calibration
- Check the new matrix with your current samples. There should be no pull-up peaks
between the dye panels (B, G, Y, R, O) with the new matrix
Mentype® DIPscreen
July 2015
LEUGADISv2en
24
Sample preparation
Component
Hi-Di™ Formamide
DNA Size Standard 550 (BTO)
Prepare 12 µl of the mix (formamide + DNA size standard) for all samples
Add 1 µl PCR product (diluted if necessary) or allelic ladder
- Denaturation for 3 min at 95 °C
- Cool down to 4 °C and place the samples on the tray
Volume
12.0 µl
0.5 µl
Since injections take place simultaneously on all capillaries, 4 or 16 samples must be
pipetted on the plate of multi-capillary analyzers. If fewer samples are analysed, the
empty positions must be filled with 12 µl Hi-Di™ Formamide.
To ensure a reliable allelic assignment on multi-capillary analysers, several ladders
should be run.
Room temperature may influence the performance of PCR products on multi-capillary
instruments, so that shoulder peaks or split peaks occur especially at low
temperatures. Pay attention to keeping ambient conditions as recommended by the
instrument manufacturer. Optimal will be a stable room temperature > 22 °C.
Signal intensities
Options to increase the signal intensity:
- Reduce the volume of the DNA Size Standard 550 (BTO) to peak heights of about 500
relative fluorescent units (RFU)
- Purify the PCR products before starting the analysis
Mentype® DIPscreen
July 2015
LEUGADISv2en
25
5.2 Setting up the Data Collection Software
Edit the run module as follows for the first run:
- In the Module Manager of the Data Collection Software click on New to open the
Run Module Editor dialog box
Run Module 3kV_10s_450bp
Parameter
Oven Temperature [°C]
Poly Fill Volume
Current Stability [µA]
PreRun Voltage [kV]
PreRun Time [s]
Injection Voltage [kV]
Injection Time [s]*
Voltage Number of Steps
Voltage Step Interval
Data Delay Time [s]
Run Voltage [kV]
Run Time [s]**
Set up
Default
Default
Default
Default
Default
3.0
10
Default
Default
Default
Default
1500
* Deviating from the standard settings, the injection time may range between 1 and 20 s depending on the type
of sample. If references samples with very high signal intensities are recorded, a shorter injection time may be
selected in orer to avoid pull-up peaks. For samples with low DNA content an injection time of up to 20 s my be
necessary.
** Depending on the analysis conditions the run time for Mentype ® DIPscreen was modified in order to be able
to analyse fragments with lengths of up to 450 bp.
- Click on Save As, enter the name of the new module (e.g. 3kV_10s_450bp) and confirm
with OK
- Click on Close to exit the Run Module Editor
Starting the run
- Place the prepared 96-well plate on the autosampler tray
- In the Protocol Manager of the Data Collection software, click on New in the
Instrument Protocol window to open the Protocol Editor dialog box
Instrument Protocol
Protocol Editor
Name
Type
Run Module*
Dye Set
Set up
enter a name
REGULAR
3kV_10s_450bp
Any5Dye
* parameter see above
- Click on OK to exit the Protocol Editor
Mentype® DIPscreen
July 2015
LEUGADISv2en
26
Prior to each run, it is necessary to create a plate definition as follows:
- In the Plate Manager of the Data Collection software click on New to open the New
Plate Dialog box
Plate Editor (I)
New Plate Dialog
Name
Application
Plate Type
Owner Name / Operator Name
Set up
e.g. Plate_BT5_Date
Select GeneMapper Application
96-Well
…
- Click on OK. A new table in the Plate Editor will open automatically
Plate Editor (II)
Parameter
Sample Name
Priority
Sample Type
Size Standard
Panel
Analysis Method
Snp Set
User-defined 1-3
Results Group 1
Instrument Protocol 1
Set up
Enter name for the samples
e.g. 100 (Default)
Sample or allelic ladder
e.g. SST-BTO_60-450bp
e.g. DIPscreen_Panels_v0
e.g. Analysis_DIPscreen_3130_200rfu
(select results group)
Run36_POP4_BT5_25min (setting described before)
- Click into the column header to select the entire column, select Edit → Fill Down to
apply the information to all selected samples and click on OK
- In the Run Scheduler, click on Find All, select Link to link the reaction plate on the
autosampler up with the newly created plate record (position A or B) and start the run
- During the run, view Error Status in the Event Log or examine the quality of the raw
data for each capillary in the Capillaries Viewer or the Cap/Array Viewer
- View data as overview in Run History or Cap/Array Viewer of the Data Collection
software. Run data are saved in the Run Folder of the previously chosen Result
Group
Mentype® DIPscreen
July 2015
LEUGADISv2en
27
5.3 Analysis parameter / analysis method
The recommended analysis parameters are:
Peak Detection Algorithm
Ranges
Smoothing and Baselining
Size Calling Method
Peak Detection
Advanced
Analysis: Full Range
Sizing: All Sizes
Smoothing: Light
Baseline Window: 51 pts
Local Southern Method
Peak Amplitude Thresholds
B:* Y:*
G:* R:*
O:*
Min. Peak Half Width: 2 pts
Polynominal Degree: 3
Peak Window Size: 15 pts
Slope Thresholds: 0.0
Recommend settings in the worksheet Allele are:
Amelogenin Cutoff**
0.1
Recommend settings in the worksheet Peak Quality are:
Heterozygote balance
Allele number
Min peak height ratio: 0.1
Max expected alleles: 2
* The peak amplitude threshold (Cutoff value) corresponds to the minimum peak height that will be detected
from the GeneMapper® ID/ID-X software. The thresholds are usually 50-200 RFU and should be determined
individually by the laboratory. Recommendation: The minimal peak height should be three times higher then the
background noise of the baseline.
** All DIPs will be examined by GeneMapper® ID/ID-X software like Amelogenin.
Mentype® DIPscreen
July 2015
LEUGADISv2en
28
6. Electrophoresis using the ABI PRISM ® 3500/3500xL Genetic Analyzer
For detailed instructions on instrument setup, spectral calibration, or application of the
Applied Biosystems 3500 Series Data Collection Software version 1.0 and the
GeneMapper® ID-X software version 1.2, refer to the Applied Biosystems
3500/3500xL Genetic Analyzers User Guide.
The system with 8 capillaries is named AB 3500 and the system with 24 capillaries is
named AB 3500xL.
The virtual filter set Any5Dye shall be used for the combined application of five
fluorescent labels 6-FAM, BTG, BTY, BTR, and BT0 (the matrix standard will be called
BT5 hereinafter).
Material
Capillary
Polymer
Buffer
36 cm Capillary Array for 3500/3500xL
POP-4® Polymer for 3500/3500xL
10x Genetic Analyzer Buffer with EDTA for 3500/3500xL
6.1 Spectral calibration / matrix generation
Prior to conducting DNA fragment size analysis, it is necessary to perform a spectral
calibration with the fluorescent labels 6-FAM, BTG, BTY, BTR, and BTO for each
analyzer. The calibration procedure creates a matrix that is used to correct the overlap
of fluorescence emission spectra of the dyes.
Spectral calibration comprises the following steps:
- Preparation of spectral calibration standards
- Loading the standards to the multi-well reaction plate (one sample per capillary)
- Preparation of instrument and creating a Dye Set BT5
- Performing a spectral calibration run and checking the matrix
Mentype® DIPscreen
July 2015
LEUGADISv2en
29
Setting up the spectral calibration standards
Example for 8 capillaries/ABI 3500
Component
Hi-Di™ Formamide
Matrix standard BT5
- Load 12 μl of the mix to a 96-well reaction plate, e.g. position A1-H1
- Denaturation for 3 min at 95 °C
- Cool down to 4 °C and place samples in the autosaple tray
Volume
108.0 µl
9.0 µl
Example for 24 capillaries/ABI 3500xL
Component
Volume
Hi-Di™ Formamide
300.0 µl
25.0 µl
Matrix standard BT5
- Load 12 μl of the mix to a 96-well reaction plate, e.g. position A1-H1, A2-H2 and A3-H3*
- Denaturation for 3 min at 95 °C
- Cool down to 4 °C and place samples in the autosample tray
* When using a 384-well plate, load 10 μl of the mixtures to columns 1, 3, and 5
in rows A, C, E, G, I, K, M, and O.
Performing a spectral calibration run
- Place the multi-well plate on the autosampler tray
- Now prepare the instrument and specific spectral calibration run settings
Preparation of the instrument
Before starting the spectral calibration process ensure that the spatial calibration has
been performed. This process is necessary if a new capillary array was installed before
and is described in detail in the Applied Biosystems 3500/3500xL Genetic Analyzers
User Guide.
Preparation of dye set BT5
Prior to the spectral calibration, a dye set for the Matrix Standard BT5 needs to
be setup.
1. To create a new dye set, go to Library and select Analyze,
followed by Dye Sets and click Create.
2. Enter a Dye Set Name, e.g. BT5.
3. Select Matrix Standard as a chemistry and AnyDye Template as a
Dye Set Template.
4. Disable Purple in the field Arrange Dyes. Ensure that all other
colors are enabled.
5. Under Calibration Peak Order the colors need to be arranged as
Follows: 5 – blue, 4 – green, 3 – yellow, 2 – red, and 1 – orange.
6. Do not alter the Parameter settings.
7. Click Save to confirm the changes.
Mentype® DIPscreen
July 2015
LEUGADISv2en
30
Fig. 5 Setup for dye set BT5
- In the Protocol Manager of the Data Collection software click on New in Instrument
Protocol to open the Protocol Editor dialog box
Performing a spectral calibration run
Once the multiwell plate containing the spectral calibration mixture is placed in the
autosampler tray the spectral calibration process can be started.
1. To access the Spectral Calibration screen, select Maintenance on the Dashboard
of the 3500 Series Data Collection software.
2. The number of wells in the spectral calibration plate and their location in the
instrument must be specified.
3. Select Matrix Standard as a chemistry standard and BT5 for dye set.
4. (Optional) Enable Allow Borrowing.
5. Click Start Run.
Mentype® DIPscreen
July 2015
LEUGADISv2en
31
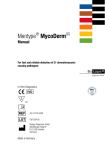
Fig. 6 Electropherogram of spectral calibration with matrix standard BT5 on an ABI 3500
Matrix check
- The quality value (Q value) of each capillary must be greater than 0.8 and the
condition number range (C value) must be between 1 and 20
- Check the matrix samples for a flat baseline. As shown in the figure above, there
should be five peaks with peak heights of about 1000-5000 RFU (Y-axis) in each
matrix sample (optimal range: 2000-4000 RFU)
- A successful calibration will be displayed in green in Overall and for each capillary
- If all capillaries have passed the test, Accept Results
- If calibration failed, Reject Results and refer to spectral calibration troubleshooting
of Applied Biosystems 3500/3500xL Genetic Analyzer User Guides
6.2 Sample preparation
Component
Volume
Hi-Di™ Formamide
12.0 µl
DNA Size Standard 550 (BTO)
0.5 µl
prepare 12 µl of the mix (formamide + DNA size standard) for all samples
add 1 µl PCR product (diluted if necessary) or allelic ladder
- Denaturation for 3 min at 95 °C
- Cool down to 4 °C and place the samples on the autosample tray
Since injections take place simultaneously on all capillaries, 8 or 24 samples must be
pipetted on the plate of multi-capillary analysers. If fewer samples are analysed empty
positions need to be filled with 12 µl Hi-Di™ Formamide.
To ensure a reliable allelic assignment on multi-capillary analysers, several ladders
should be run.
Room temperature may influence the performance of PCR products on multi-capillary
instruments, so that shoulder peaks or split peaks occur especially at low
temperatures. Pay attention to keeping ambient conditions as recommended by the
instrument manufacturer. Optimal will be a stable room temperature > 22 °C.
Mentype® DIPscreen
July 2015
LEUGADISv2en
32
Signal intensities
Options to increase the signal intensity:
- Reduce the volume of the DNA Size Standard 550 (BTO) to peak heights of about 500
relative fluorescent units (RFU)
- Purify the PCR products before starting the analysis
6.3 Setting up a run
For the first run using the Mentype® DIPscreen Kit you will need to setup a number of
protocols within the 3500 Series Data Collection Software.
Create Instrument protocol
- Go to Library and select Analyze / Instrument protocol and click Create
- Change the parameters according the table below
Instrument protocol for Mentype® DIPscreen®
Parameter
Application Type
Capillary Length
Polymer
Dye Set
Run Module
Protocol Name
Oven Temperature [°C]
Run Voltage [kV]
Injection Voltage [kV]
Run Time [s]**
PreRun Time [s]
Injection Time [s]*
Data Delay Time [s]
Advanced Options
Set up
HID / Microsatellite
Default
Default
BT5
Default
e.g. Mentype DIPscreen
Default
Default
3.0
1500
Default
10
Default
Default
* Deviating from the standard settings, the injection time may range between 1 and 20 s depending on the type
of sample. If reference samples with very high signal intensities are recorded, a shorter injection time may be
selected in order to avoid pull-up peaks. For samples with low DNA content an injection time of up to 20 s may
be necessary.
** Depending on the analysis conditions, the run time for Mentype® DIPscreen was modified in order to analyse
fragments with lengths of up to 450 bp.
- Click on Save to confirm the settings
Mentype® DIPscreen
July 2015
LEUGADISv2en
33
Create Size Standard
- Go to Library and select Analyze / Size Standards and click Create
- Change the parameters according the table below
Parameter
Size Standard
Dye Color
Set up
BTO_550
Orange
The DNA Size Standard 550 (BTO) should be used with the following lengths of fragments:
60, 80, 90, 100, 120, 140, 160, 180, 200, 220, 240, 250, 260, 280, 300, 320, 340,
360, 380, 400, 425, 450, 475, 500, 525, and 550 bp.
- Click on Save to confirm the settings
Create QC (Size Calling) Protocol
- Go to Library and select Analyze / QC (Size Calling) and click Create
- Change the parameters according the table below
Parameter
Protocol Name
Size Standard
Sizecaller
Set up
enter a name
BTO_550 (from above)
Size Caller v.1.1.0
- Go to Analysis Settings / Peak Amplitude Threshold and disable purple.
All other colours should be enabled.
- Keep all other settings as Default
- Click on Save to confirm the settings
Create an Assay
- Go to Library and select Manage / Assays and click Create
- Change the parameters according the table below
Parameter
Assay Name
Color
Application Type
Instrument Protocol
QC Protocols
Set up
e.g. Mentype DIPscreen
Default
HID
e.g. Mentype DIPscreen
e.g. BTO_550
- Click on Save to confirm the settings
Mentype® DIPscreen
July 2015
LEUGADISv2en
34
Starting the run
- Place the prepared multi-well plate on the autosampler tray
- In the Dashboard of the Data Collection Software, click Create New Plate
- Go to Define Plate Properties and select Plate Details
- Change the parameters according the table below
Plate Details
Property
Name
Number of Wells
Plate Type*
Capillary Lenght
Polymer
Set up
enter a name
96 or 384
HID
36cm
POP4
- Click Assign Plate Contents to confirm the settings
- Define well position of each sample or ladder for data collection and processing by
entering sample names
- Assign an Assay (required) a File Name Conventions and a Result Group to all
named wells in the plate
- Click Link the plate for Run and enter Run Name
- Click Start Run
Mentype® DIPscreen
July 2015
LEUGADISv2en
35
7. Analysis
For general instructions on automatic sample analysis, refer to the GeneScan® or
GeneMapper® ID or GeneMapper®ID-X Software User’s Manual.
Note: Within the Mentype® DIPscreen the red panel should be faded out.
Finding the exact lengths of the amplified products depends on the device type, the
conditions of electrophoresis, as well as the DNA size standard used. The DNA Size
Standard 550 (BTO) shall thus be used with the following lengths of fragments: 60, 80,
90, 100, 120, 140, 160, 180, 200, 220, 240, 250, 260, 280, 300, 320, 340, 360,
380, 400, 425, 450, 475, 500, 525, and 550 bp.
Fig. 7 Electropherogram of the DNA Size Standard 550 (BTO), fragments with lengths in bp
Note: The provided template files for the DNA size standard SST-BTO_60-450bp can
be applied for the evaluation and analysis of the Mentype® DIPscreen using the
GeneMapper® ID or ID-X Software.
Mentype® DIPscreen
July 2015
LEUGADISv2en
36
7.1 Biotype® template files
Allele allocation should be carried out with suitable analysis software, e.g. the
GeneMapper® ID/ID-X software in combination with the Mentype® DIPscreen template
files from Biotype or the ChimerisTMMonitor Software of Biotype Diagnostic GmbH.
Template files are available from our homepage or as CD-ROM on request.
Recommended Biotype® templates for GeneMapper® ID/ID-X Software are:
Panels
BinSets
Size Standard
Analysis Method
Plot Settings
Table Settings
DIPscreen_Panels_v0/v0X
DIPscreen_Bins_v0/v0X
SST-BTO_60-450bp
Analysis_DIPscreen_310_200rfu
Analysis_DIPscreen_310_1000rfu
Analysis_DIPscreen_3130_200rfu
Analysis_DIPscreen_3130_1000rfu
PlotsBT5_4dyes
Table for 2 alleles
or higher versions
or higher versions
Panels and BinSets always have to be used whereas the other template files are
optional.
The prepared Biotype® templates for GeneMapper® ID/ID-X Software were generated
for POP4® runs. In case of using other polymer types changes may necessary on
Panels and Bins or within the Analysis Method before analyzing the data.
For detailed instruction please refer to the instruction Biotype® Template Files für
GeneMapper® which can be downloaded from our homepage (www.biotype.de).
Important Note: Import and allele calling with provided template files is only guarantied
using GeneMapper® ID/ID-X software. If GeneMapper® software is applied you may
experience import problems using some template files. You may have to adjust Panels
and Bins with one ore more runs of the allelic ladder on your specific instrument setup.
Contact us for support (support@biotype,de).
General procedure for the analysis
1. Check the DNA size standard
2. Check the allelic ladder
3. Check the positive control
4. Check the negative control
5. Analyse and interpret the sample data
Mentype® DIPscreen
July 2015
LEUGADISv2en
37
7.2 Controls
The Control DNA XY13 of the test kit and other commercially available DNA from
standard cell lines represent the following alleles:
Table 2. Allele determinations of Mentype ® DIPscreen
AM
HLD106
HLD70
HLD84
HLD103
HLD104
HLD116
HLD112
HLD307
HLD310
HLD110
HLD133
HLD79
HLD105
HLD140
HLD163
Control-DNA
XY13
XY
+/+
-/+
-/+
+/+
-/+
-/+
-/+
+/+
+/+
-/+
-/+
+/+
-/+
+/+
+/+
ATCC
K-562
XX
-/-/+
+/+
-/-/+/+
+/+
+/+
-/+
-/+
-/+/+
-/+/+
-/+
CCR
9947A
XX
+/+
+/+
-/-/+
-/+
-/-/+
-/+
-/+
-/+
+/+
+/+
-/+
-/-/+
CCR
9948
XY
+/+
-/+
-/+
+/+
+/+
-/+
-/+
+/+
-/-/+
+/+
-/+
-/+
-/+
+/+
CCR
3657
XY
+/+
-/-/-/+
-/-/-/+
+/+
-/+
-/+
-/+
+/+
-/+
+/+
-/+
HLD91
HLD23
HLD88
HLD101
HLD67
HLD301
HLD53
HLD97
HLD152
HLD128
HLD134
HLD305
-/+
-/+
+/+
-/+
-/+
-/+
+/+
-/-/-/+
-/+
-/+
-/+
+/+
-/-/+
-/+
-/+
-/-/+/+
-/+
-/-/+
-/-/-/-/+
+/+
-/+
-/+
-/+
+/+
-/+
+/+
-/+
-/-/+
-/+
-/+
+/+
-/+
+/+
-/+
-/+
-/+/+
+/+
-/+
-/+
+/+
-/+
+/+
-/-/+/+
+/+
-/+
-/-/+
HLD48
HLD114
HLD304
HLD131
HLD38
HLD82
-/+
+/+
+/+
+/+
+/+
+/+
+/+
-/-/-/+
-/+
+/+
+/+
-/-/+
-/-/+
+/+
-/+
+/+
-/+
-/+
+/+
-/+
+/+
-/+
-/+/+
+/+
+/+
Locus
The reference DNA K-562 is available from ATCC (http://atcc.org/Produtcs/
PurifiedDNA.cfm#celllines), DNA 9947A, 9948 and 3657 are available from Coriell Cell
Repositories (CCR; http://locus.umdnj.edu/nigms/) .
Mentype® DIPscreen
July 2015
LEUGADISv2en
38
7.3 Lengths of fragments and alleles
Table 3 show the fragment lengths of individual alleles that refer to the DNA Size
Standard 550 (BTO). All analyses have been performed on an
ABI PRISM® 3130 Genetic Analyzer with POP4® polymer. Different analysis
instruments, DNA size standards or polymers may result in different fragment lengths.
In addition, a visual alignment with the allelic ladder is recommended.
Scaling
Horizontal: 70-430bp (see Fig. 8 and 9)
Vertical: Depending on signal intensity
Mentype® DIPscreen
July 2015
LEUGADISv2en
39
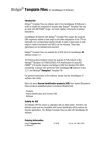
Figure 8
Fig. 8 Electropherogram of the Mentype® DIPscreen using 1ng Control DNA XY13. Analysis was performed on an
ABI PRISM® 3130 Genetic Analyzer with the DNA Size Standard 550 (BTO). Allele assignment was performed
using the GeneMapper® ID Software and the Mentype® DIPscreen template file.
Mentype® DIPScreen
April 2013
40
Figure 9
Fig. 9 Electropherogram of the allelic ladder Mentype® DIPscreen. Analysis was performed on an
ABI PRISM® 3130 Genetic Analyzer with the DNA Size Standard 550 (BTO). Allele assignment was
performed using the GeneMapper® ID Software and the Mentype® DIPscreen template file.
Mentype® DIPscreen
July 2015
LEUGADISv2en
41
Table 3. Fragment lengths of the Mentype® DIPscreen allelic ladder analysed
on an ABI PRISM® 3130 Genetic Analyzer with POP4® (FAM, BTG, BTY panel)
Marker/FAM
-DIP [bp]*
+DIP [bp]*
Marker/BTG
-DIP [bp]*
+DIP [bp]*
AM
77 (X)
80 (Y)
HLD91
84
88
HLD106
91
98
HLD23
107
113
HLD70
104
108
HLD88
118
128
HLD84
112
117
HLD101
131
135
HLD103
129
138
HLD67
140
148
HLD104
153
1157
HLD301
172
182
HLD116
170
192
HLD53
190
194
HLD112
199
204
HLD97
214
228
HLD307
228
236
HLD152
239
250
HLD310
248
257
HLD128
258
266
HLD110
264
270
HLD134
296
312
HLD133
278
288
HLD305
375
401
HLD79
294
299
HLD105
302
310
Marker/BTY
-DIP [bp]*
+DIP [bp]*
HLD140
318
333
HLD48
78
83
HLD163
344
358
HLD114
159
177
HLD304
184
203
HLD131
208
220
HLD38
234
240
HLD82
314
352
* rounded to integer
Mentype® DIPScreen
April 2013
43
8. Interpretation of results
As mentioned above, post PCR analysis and automatic allele allocation with suitable analysis
software ensure a precise and reliable discrimination of alleles.
The automated identification of informative DIP-loci directly from raw data of fragment analysis
runs and the selection of suitable DIPquant assays for monitoring could be performed by using
ChimerisTMMonitor Software from Biotype Diagnostic GmbH.
Pull-up peaks
Pull-up peaks may occur if peak heights are outside the linear detection range (>3000 RFU), or
if an incorrect matrix was applied. They appear at positions of specific peaks in other colour
channels, typically with lower signal intensities. Peak heights should not exceed 3000 RFU in
order to prevent pull-up peaks.
Template-independent addition of nucleotides
Because of its terminal transferase activity, the Multi Taq DNA Polymerase tends to add an
adenosine radical at the 3’-end of the amplified DNA fragments. The artefact peak is one base
shorter than expected (-1 bp peaks). All Biotype® primers are designed to minimise these
artefacts. Artefact formation is further reduced by the final extension step of the PCR protocol at
68 °C for 60 min. Peak height of the artefact correlates with the amount of DNA. Laboratories
should define their individual limits for analysis of the peaks.
Artefacts
Room temperature may influence the performance of PCR products on multi-capillary
instruments, shoulder peaks or split peaks occur. Furthermore, automated assignment could be
influenced in some cases. If these effects occur we recommend injecting the sample again at
higher room temperature and maybe using more than one allelic ladder sample per run.
Influence of polymers
Mentype® DIPscreen was validated and certified for the analysis on POP4® polymer. The use of
other polymers (e.g. POP7™ or POP6TM) might influence the run behaviour of specific PCR
products. Furthermore background noise might increase through different behaviour of free
fluorescent dyes.
43
9. References
Alizadeh M, Bernard M, Danic B, Dauriac C, Birebent B, Lapart C, Lamy T, Le Prise PY,
Beauplet A, Bories D, Semana G, Quelvennec E. (2002) Quantitative assessment of
hematopoietic chimerism after bone marrow transplantation by real-time quantitative polymerase
chain reaction. Blood 99, 4618-4625.
Chen DP, Tseng CP, Wang WT, Wang MC, Tsai SH, Sun CF (2011) Real-time biallelic
polymorphism-polymerase chain reaction for chimerism monitoring of hematopoietic stem cell
transplantation relapsed patients. Clin Chim. Acta 412, 625-630.
Harries LW, Wickham CL, Evans JC, Rule SA, Joyner MV, Ellard S (2005) Analysis of
haematopoietic chimaerism by quantitative real-time polymerase chain reaction. Bone Marrow
Transplant. 35, 283-290.
Masmas TN, Madsen HO, Petersen SL, Ryder LP, Svejgaard A, Alizadeh M, Vindelov LL
(2005) Evaluation and automation of hematopoietic chimerism analysis based on real-time
quantitative polymerase chain reaction. Biol Blood Marrow Transplant. 11, 558-566.
Mills RE, Luttig CT, Larkins CE, Beauchamp A, Tsui C, Pittard WS, Devine SE (2006) An initial
map of insertion and deletion (INDEL) variation in the human
genome. Genome Res 16 (9):1182-1190, 2006.
Qin XY, Li GX, Qin YZ, Wang Y, Wang FR, Liu DH, Xu LP, Chen H, Han W, Wang JZ, Zhang XH,
Li JL, Li LD, Liu KY, Huang XJ (2011) Quantitative assessment of hematopoietic chimerism by
quantitative real-time polymerase chain reaction of sequence polymorphism systems after
hematopoietic stem cell transplantation. Chin Med J (Engl.) 124, 2301-2308.
Weber JL, David D, Heil J, Fan Y, Zhao C, Marth G (2002) Human
diallelic insertion/deletion polymorphisms. Am J Hum Genet 71(4):854-862.
Wilhelm J, Reuter H, Tews B, Pingoud A, Hahn M (2002) Detection and
quantification of insertion/deletion variations by allele-specific real-time PCR:
application for genotyping and chimerism analysis. Biol Chem 383, 1423-1433.
10. Explanation of Symbols
Mentype® DIPscreen
April 2013
44
Manufacturer
Date of manufacture
Batch code
<N>
Contains sufficient reagents for
<N> tests
Consult instructions (handbook)
for use
Use by
Temperature limitations
Catalogue number
In-Vitro-Diagnostics
Mentype® DIPscreen
April 2013
45
Notes
Mentype® DIPscreen
April 2013
46
Notes
Mentype® DIPscreen
April 2013