1
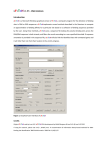
ExPlain Transition Overview
The current ExPlain tool will be phased out at the end of 2015, replaced with an enhanced version of
TRANSFAC. This document provides a mapping of the functions in ExPlain to the comparable functions in
TRANSFAC to help you transition to the new interface.
While many of the functions of ExPlain have been integrated into TRANSFAC and enhanced further, the
set of tools that are primarily focused on basic statistical processing and conversion of raw data files
have not been migrated due to low usage combined with the ready accessibility of high quality data preprocessing tools made available by instrument providers and public resources.
For a more complete description of the features included in this document, as well as a complete
description of other features included in TRANSFAC, please access the TRANSFAC user manual using the
help menu accessible in the type right corner of the TRANSFAC interface:
For any questions, or to request that additional new features be considered for future implementation,
please contact us at [email protected].
Mapped features
Loading gene and miRNA sets
Creating data subsets
Loading sequences and intervals
Match and Composite model search
Loading matrices
Creating profiles
Creating composite models
Last updated September 30, 2015
Finding novel motifs (Seeder)
Functional analysis
Network analysis
Step-by-step analysis (Wizard workflows)
Loading gene and miRNA sets
The options described here replace the ‘File -> Create new data -> Gene set’ and ‘File -> Load data from
file -> Gene set’ functions in ExPlain:
There are two options for loading a list of genes into TRANSFAC for analysis by Match and other tools:
1. Genes and proteins search
From the TRANSFAC home page (click the BIOBASE logo or choose ‘search -> Start a new search’), click
the ‘View more search options’ link if it has not been previously clicked:
Select the ‘Genes and proteins’ radio button and then click the ‘Upload a list of genes or proteins in bulk’
link:
Last updated September 30, 2015
Click the yellow ‘browse for file’ button to select a tab-delimited or Excel file of gene names or
identifiers:
Once you have selected the file, use the prompts to specify whether your file contains a list of gene
names or identifiers, the species (in the case of gene names) or the identifier type (in the case of
identifiers), and whether your file contains a header column (and the first row should therefore be
ignored). Using the preview provided of the file contents, you must specify which column contains the
name or identifier to be used for matching (specify this column as ‘ID’ from the pull-down menu) and
may optionally specify one column containing a numeric value such as fold-change (specify this column
as ‘Observation’ from the pull-down menu). All other columns must be set to ‘Ignore’. Finally, click the
‘upload’ button to upload the contents of the file.
Last updated September 30, 2015
You will receive a message noting which values could not be matched to an entry in the database, and
then the matched entries will be returned in the results section below. Once the results are returned,
click the ‘Save these results’ link to save the list of genes for further analysis.
To save a subset of the genes, use a combination of clicking column headers for sorting and the Filter
link for filtering, then select the desired subset to be saved using the check boxes next to each entry.
After saving, the data set can be accessed from the ‘my data’ menu.
Last updated September 30, 2015
Note that unlike ExPlain, TRANSFAC supports uploading of mature miRNAs by name or identifier. To
upload a list of mature miRNAs such as hsa-miR-155-5p (as opposed to a list of miRNA genes such as
human MIR155), select the ‘miRNAs’ radio button, click the ‘Upload a list of miRNAs in bulk’ link and
then proceed as described above for uploading a list of genes.
2. Match gene or miRNA set upload option
To upload a list of genes or miRNAs and launch a Match analysis in one step, from any location, choose
‘tools -> Predict TF binding sites’.
Last updated September 30, 2015
When the Match tool loads select the ‘I am uploading a gene or miRNA set’ radio button, select the
‘Upload a new gene or miRNA set’ radio button and then click the yellow ‘browse for file’ button to
select a tab-delimited or Excel file of gene names or identifiers:
Last updated September 30, 2015
Once you have selected the file, use the prompts to specify whether your file contains a list of genes or
miRNAs, whether it is a list of names or identifiers, the species (in the case of gene/miRNA names) or the
identifier type (in the case of identifiers), and whether your file contains a header column (and the first
row should therefore be ignored). Using the preview provided of the file contents, you must specify
which column contains the name or identifier to be used for matching (specify this column as ‘ID’ from
the pull-down menu) and may optionally specify one column containing a numeric value such as foldchange (specify this column as ‘Observation’ from the pull-down menu). All other columns must be set
to ‘Ignore’.
When you start the Match analysis, after filling in the required parameters, the data set will be
automatically uploaded and saved to your user account in the ‘my data’ menu.
Last updated September 30, 2015
Creating data subsets
Whenever a list of Genes and proteins or miRNAs is displayed – whether that list is the direct result of a
search or is a previously saved data set that has been loaded from the ‘my data’ menu – individual
entries can be selected using the checkboxes, and then saved using the ‘Save these results’ link:
Alternatively the Filter link can be used to open a filter dialog box that allows you to actively filter the
data set by any of the available columns, and then save the filtered data set.
Loading sequences and intervals
The options described here replace the ‘File -> Create new data -> Sequences’, ‘File -> Load data from
file -> Sequence’ and ‘File -> Load data from file -> Intervals (BED-file)’ functions in ExPlain:
Raw sequences, as well as intervals for extracting sequences, are loaded through the Match tool. From
any page within TRANSFAC, click the tools menu and then the Predict TF binding sites link:
Last updated September 30, 2015
Within the Match tool, select the ‘I am analyzing DNA sequences’ radio button and the ‘Upload a new
sequence’ radio button. Then select whether you wish to upload ‘DNA sequences’ directly or to submit
‘Genomic intervals for automatic sequence retrieval’:
Any sequence or set of sequences up to 1,000,000 nucleotides in length can be uploaded in FASTA,
EMBL, Genbank or RAW format. For human, mouse and rat species you can alternatively upload a list of
Last updated September 30, 2015
genomic coordinates in .bed format. The pull-down menu that appears when this option is selected will
specify what genome version is supported. As of December 2014, the supported versions are human
hg38/GRCh38, mouse mm10/GRCm38, and rat rn5/RGSC 5.0.
Match and Composite model search
TRANSFAC’s Predict TF binding sites tool which includes the Match, Composite model and FMatch
analysis options replaces the ‘Analyze -> Binding sites search -> Match’ and ‘Analyze -> Binding sites
search -> Search for new targets of TF combination’ functions in ExPlain:
To access the Match tool, from any page within TRANSFAC, click the tools menu and then the Predict TF
binding sites link:
There are three types of input that are required in the yellow section of the Match tool:
Last updated September 30, 2015
1. The data set to be analyzed.
The tool provides the option to analyze DNA sequences or to analyze a gene or miRNA set. When ‘I
am analyzing DNA sequences’ is selected, you are given the option to run Match against an example
sequence, against a previously uploaded sequence or set of sequences or to upload a new sequence
or set of sequences. Uploading sequences, either as raw sequences (i.e. FASTA, Genbank) or as
genomic intervals, is described in Loading sequences and intervals.
When ‘I am analyzing a gene or miRNA set’ is selected, you are given the option to run Match
against an example gene, against a previously uploaded list of genes or miRNAs or to upload a new
list of genes or miRNAs. Despite the different entry point, the process for uploading a list of genes
and miRNAs is the same as is described in Loading gene and miRNA sets.
When you choose the option to analyze a gene or miRNA set, Match will extract the promoter
sequence(s) associated with the gene(s) or miRNA(s) from the underlying database and use those
sequences for its analysis. You are provided with 2 additional parameters so that you can specify (1)
whether you want Match to consider all available promoters for a gene or only the best supported
promoter (which is defined as the promoter with the most significant cluster of Ensembl
transcription start sites) and (2) what portion of the promoter sequence you want to consider. Like
in ExPlain, TRANSFAC promoters are 11,000 bp in length, spanning from -10,000 base pairs
upstream of the TSS to +1,000 base pairs downstream of the TSS. A typical range is -500 to +100.
2. The analysis method to be used.
Last updated September 30, 2015
Match - By default, the analysis method will be set to ‘Match – search for TF binding sites’. When
this method is selected, the Match algorithm will use the positional weight matrices in the selected
profile to search your sequences for binding sites which meet the cut-off criteria. This option is
equivalent to running ‘Analyze -> Binding sites search -> Match’ in ExPlain with no background set
selected.
Composite model – When ‘Composite model – search by pairs of TFs’ is selected, the composite
model algorithm (which is based on the Match algorithm), use models composed of pairs of
matrices separated by a specified gap to search your sequences for co-occurring binding sites. This
option is equivalent to running ‘Analyze ->Binding sites search -> Search for new targets of TF
combination’ in ExPlain.
FMatch – When ‘FMatch – search for over-represented binding sites’ is selected, the Match
algorithm will use the positional weight matrices in the selected profile to search your sequences as
well as a set of background sequences for binding sites which meet the cut-off criteria and then
reports those PWMs and sites which are over-represented in your sequence set compared to the
background sequence set. This option is equivalent to running ‘Analyze -> Binding sites search ->
Match’ in ExPlain with a background set.
Note that when you select the FMatch option you will be asked to additionally provide information
about the background set to be used.
3. The profile (group of positional weight matrices) to be used.
As in ExPlain, a number of prepared profiles are provided, including the default Vertebrate NonRedundant profile along with a number of tissue specific profiles. You can also create your own
custom profiles from the collection of matrices within TRANSFAC or from your own uploaded
matrices using the Profile creation tool accessed through the help section on the right-hand-side of
the screen:
Last updated September 30, 2015
Similarly, when using the Composite model option, a number of prepared models are provided or
you can create your own models using the Model creation tool also accessed through the help
section on the right-hand-side of the screen.
Once the required inputs have been specified, you can launch the analysis and it will be run with the
default parameters which are set in the white section of the Match tool:
If you wish to make any changes to the parameters, de-select the ‘Use default parameters’ and make
the desired changes. The parameter options differ based on the analysis method selected, but
collectively cover the following:
1. Data version
TRANSFAC supports the four most recent data versions. By default the current version is selected,
but previous versions may be selected using the pull-down menu.
2. Use only high quality matrices
Last updated September 30, 2015
By default, this option is used to exclude matrices which generate particularly high numbers of false
positives from Match and FMatch analyses. For more information about how high versus low quality
matrices are defined, please see the ‘BKL Search and Tools -> TF Binding Site Prediction -> Cut-off
Values’ page of the TRANSFAC user manual. De-selecting this option will allow the low quality
matrices to be included in the analysis.
3. Set cut-offs
Depending on the profile selected (such as for the tissue specific profiles), you may have the option
to modify the cut-off settings. When this option is enabled, you are able to select whether you want
to use the minFP, minFN or minSUM cut-offs, to use the cut-offs from the profile (which for
prepared profiles are usually the minFN cut-offs), or to manually set your own cut-offs.
4. p-value threshold
As FMatch analyzes two sequence or gene sets in comparison, a p-value is calculated for overrepresentation of sites for particular matrices in the analyzed set versus the background set. FMatch
compares the Match result of the two sets and optimizes the cut-offs for each matrix used in the
analysis to reach the best separation between the two sets. Only those matrices for which the pvalue for over-representation of the sites in the experimental set fits the p-value threshold are
reported. By default the p-value is set to 0.01. To make the p-value more or less stringent, type the
new p-value into the box.
When you are ready, launch the analysis by clicking the ‘start search’ button. Your analysis will be
forwarded to the taskbar. If you keep the taskbar window open until the analysis completes, the analysis
results will automatically be loaded within the open window.
Last updated September 30, 2015
For a detailed description of the analysis report, please see the ‘BKL Search and Tools -> Predicting TFbinding sites’ page of the TRANSFAC user manual.
Last updated September 30, 2015
Loading matrices
TRANSFAC’s Create and compare matrices tool replaces the ‘File -> Create new data -> Weight matrix’
option in ExPlain:
To load a custom matrix in TRANSFAC .dat format, or to create a matrix from a set of aligned or
unaligned sequences, use the Create and compare matrices tools which is accessed from any page
within TRANSFAC by clicking the tools menu followed by clicking the ‘Create and compare matrices’ link:
Last updated September 30, 2015
To upload a matrix in TRANSFAC .dat format, select the ‘Upload matrix’ radio button, click the ‘browse
for file’ button, select the file to be uploaded and click the ‘create matrix’ button:
A nucleotide position frequency table and consensus sequence logo preview will be created and you will
be prompted to click the ‘save matrix and specify cut-off values’ button to finalize the upload:
Last updated September 30, 2015
When the process is complete (this may take a few minutes due to the calculation of the cut-off values)
you will be notified that the matrix has been saved to your library. It will now be listed in the ‘Gene
regulation analysis -> Data -> Matrices -> Uploaded matrices’ folder of the ‘my data’ menu:
and will also be listed in the Profile creation tool (accessed from the Match tool page) which can be used
to create a profile containing the matrix for use by Match.
Last updated September 30, 2015
Alternatively you can create a matrix using a set of aligned or unaligned sequences. For a description of
how to create a matrix from a set of aligned sequences, please see the ‘Gene regulation analysis tools ->
Create and compare matrices’ page of the TRANSFAC user manual.
For a description of how to create a matrix from a set of unaligned sequences, please see Finding novel
motifs (Seeder) in this document.
Creating profiles
TRANSFAC’s Profile creation tool replaces the ‘File -> Create new data -> PWM profile’ option in ExPlain:
The tool for creating custom profiles is accessed through Match. From any page within TRANSFAC, click
the tools menu and then the ‘Predict TF binding sites’ link:
Last updated September 30, 2015
And then click the ‘Create your own profile’ link in the right-hand-side of the page:
Note that you can also access the Profile creation tool via the Create and compare matrices tool.
When the tool loads you can browse the library of matrices by scrolling through the individual pages,
but you can more easily narrow the list by searching for specific matrices by name or by filtering the list
to Exclude low quality matrices or to Show only user matrices (matrices that you have uploaded):
Last updated September 30, 2015
Once you have selected the matrix or matrices that you would like to include in your profile, click the
‘Select matrices’ button. You will be given a preview of the set that you have selected:
You can continue to add to or edit the set. When you are satisfied with the set, click the ‘Proceed to cutoff selection’ button. On the next screen you will be asked to name your profile and to select the cut-off
values to be used:
Last updated September 30, 2015
When you are finished, click the ‘Save profile’ button. The profile will now appear in the profile pulldown menu of the Match tool.
For a more detailed description of how to create a profile, please see the ‘Gene regulation analysis tools
-> Predict TF-binding sites -> Profile Generation’ page of the TRANSFAC user manual.
Last updated September 30, 2015
Creating composite models
TRANSFAC’s Model creation tool replaces the ‘File -> Create new data -> Composite model’ option in
ExPlain:
The tool for creating custom models is accessed through Match. From any page within TRANSFAC, click
the tools menu and then the ‘Predict TF binding sites’ link:
Last updated September 30, 2015
And then click the ‘Create your own model link’ in the right-hand-side of the page or the ‘Create new
model’ link next to the model pull-down menu that appears when ‘Composite model – search by pairs of
TFs’ is selected as the analysis method:
Note that you can also access the Profile creation tool via the Create and compare matrices tool.
When the tool loads you can select the pair of components (matrices) that you would like to include in
your model:
Last updated September 30, 2015
When you click the magnifying glass icon for a component a matrix selection window will open.
When the window opens you can browse the library of matrices by scrolling through the individual
pages, but you can more easily narrow the list by searching for specific matrices by name or by filtering
the list to Exclude low quality matrices or to Show only user matrices (matrices that you have uploaded):
Last updated September 30, 2015
When you have selected the desired matrix or matrices (more than one matrix can be selected to
represent a component), click the ‘Add to model’ button. The recommended minFN cut-off for the
matrix or matrices is specified by default, but can be over-ridden by typing the desired cut-off into the
Cut-off box. Directionless orientation is specified by default, but forward or reverse orientation can
alternately be specified by selecting the desired option from the Orientation pull-down menu.
Repeat this process for the second component.
At this point you can save the model, keeping the remaining default parameters or by adapting them as
desired:
1. Order of components – When the ‘Use inverted order of components’ parameter is checked
(the default setting), the order in which the components are identified within the submitted
sequence will not be considered when determining a match. For example, if Matrix A is selected
as component 1 and Matrix B is selected as component 2, the model will be returned in the
results regardless of whether the order is A -> B or B -> A, as long as the cut-off criteria are met.
When the ‘Use inverted order of components’ selection is turned off, the order in which the
components are identified will determine whether a match is made. For example, if Matrix A is
selected as component 1 and Matrix B is selected as component 2, and ‘Use inverted order of
components’ is turned off, only A -> B models will be returned in the results when the cut-off
criteria is met. B -> A models will be ignored.
2. Distance between components - This parameter specifies the maximum distance, in nucleotides,
that may exist between the two components in order for a pair of binding sites to be identified.
A negative starting distance specifies the number of nucleotides by which the two matrices may
overlap. A default distance of -5 to 30 is set, which is appropriate for most analyses.
Once the model is saved, it will appear in the ‘my data’ menu as well as the model pull-down menu of
the Match tool when ‘Composite model – search by pairs of TFs’ is selected as the analysis method.
For a more detailed description of how to create a profile, please see the ‘Gene regulation analysis
tools-> Predict TF-binding sites -> Composite Model Editor’ page of the TRANSFAC user manual.
Last updated September 30, 2015
Finding novel motifs (Seeder)
The DECOD algorithm in TRANSFAC replaces the Seeder algorithm (‘Analyze -> Binding sites search ->
De-novo motifs (Seeder)’) used for finding novel motifs in a set of sequences in ExPlain:
For more information about this algorithm, please see the publication by Huggins et al. (2011)
Bioinformatics 27:2361.
To identify a novel motif within a set of sequences, use the Create and compare matrices tools which is
accessed from any page within TRANSFAC by clicking the tools menu followed by clicking the ‘Create and
compare matrices’ link:
Last updated September 30, 2015
Once the tool loads, select the ‘Compile matrix from unaligned sequences’ option and fill in the
requested fields in the yellow section including the set of sequences to be searched for the novel motif,
the set of background sequences to be used, and the expected motif width (a default setting of 8 is
given):
Last updated September 30, 2015
At this point you can start the analysis, keeping the remaining default parameters or by adapting them
as desired in the white section:
1. Specify the number of times the motif is expected to appear within a sequence (default is set to
1)
2. Ignore mono- and di-nucleotide repeats (turned on by default)
Once the analysis completes, a nucleotide position frequency table for the best scoring motif and
consensus sequence logo preview will be created and you will be prompted to click the ‘save matrix and
specify cut-off values’ button to finalize the upload:
Last updated September 30, 2015
When the process is complete (this may take a few minutes due to the calculation of the cut-off values)
you will be notified that the matrix has been saved to your library. It will now be listed in the ‘Gene
regulation analysis -> Data -> Matrices -> Uploaded matrices’ folder of the ‘my data’ menu:
and will also be listed in the Profile creation tool (accessed from the Match tool page) which can be used
to create a profile containing the matrix for use by Match.
For a more detailed description of this tool, please see the ‘Gene regulation analysis tools -> Create and
compare matrices’ page of the TRANSFAC user manual.
Last updated September 30, 2015
Functional analysis
The functional analysis tool in TRANSFAC replaces the ‘Analyze -> Functional analysis -> Functional
classification’ and ‘Analyze -> Functional analysis -> Canonical pathways mapping’ functions of ExPlain:
The tool analyzes sets of genes and miRNAs for the presence of statistically over-represented terms
using a basic Fisher test analysis. To access the functional analysis tool, from any page within TRANSFAC,
click the tools menu and then the ‘Identify shared attributes’ link:
Last updated September 30, 2015
When the tool loads, you are given the option to analyze a previously uploaded list of genes or miRNAs
or to upload a new list of genes or miRNAs. Despite the different entry point, the process for uploading a
list of genes and miRNAs is the same as is described in Loading gene and miRNA sets.
Once you have selected the data set to be analyzed, click the ‘perform functional analysis’ button. Your
analysis will be forwarded to the taskbar. If you keep the taskbar window open until the analysis
completes, the analysis results will automatically be loaded within the open window.
Last updated September 30, 2015
For a detailed description of the analysis report, please see the ‘Functional analysis tools -> Identify
shared attributes’ page of the TRANSFAC user manual.
Last updated September 30, 2015
Network analysis
The network analysis tool in TRANSFAC replaces the ‘Analyze -> Network analysis -> Network clusters’
tool of ExPlain:
The tool analyzes sets of genes for networks enriched with members of your gene set. To access the
network analysis tool, from any page within TRANSFAC, click the tools menu and then the ‘Identify
shared networks’ link:
When the tool loads, you are given the option to analyze a previously uploaded list of genes or to upload
a new list of genes. Despite the different entry point, the process for uploading a list of genes is the
same as is described in Loading gene and miRNA sets.
Last updated September 30, 2015
Once you have selected the data set to be analyzed, you can launch the analysis and it will be run with
the default parameters which are set in the white section of the tool. If you wish to make any changes to
the parameters, de-select the ‘Use default parameters’ and make the desired changes:
1. Data version
TRANSFAC supports the four most recent data versions. By default the current version is selected,
but previous versions may be selected using the pull-down menu.
2. Maximum connection distance between nodes
This parameter specifies the maximum number of steps that may separate two nodes in the input
list. By default the parameter is set to 3, but you may select a distance from 1 to 5. Specifying a
smaller maximum connection distance will generally produce more, smaller networks while
specifying a larger maximum connection distance will generally produce fewer, larger networks. In
general, as you increase the maximum connection distance, smaller networks will become merged
into larger networks.
3. Preferred network density
This parameter specifies the connectedness of a node to other nodes in the network. By default the
parameter is set to Medium, but you may select densities of Very low, Low, Medium, High and Very
Last updated September 30, 2015
high. Specifying a lower preferred density favors the retention of nodes and will generally produce
larger, more branched networks. Specifying a higher preferred density favors the removal of nodes
whose connection to the network is more fragile and will generally produce smaller, more dense
networks.
4. Ignore directionality
This parameter specifies the type of relationships that are considered when building the networks.
By default, Ignore directionality is turned off and only those relationships which are unidirectional
are considered. Examples of unidirectional relationships include a ligand activating its receptor, a
kinase phosphorylating a target protein, etc. When Ignore directionality is turned off, the set of
considered relationships is extended to also include bidirectional relationships. Examples of
bidirectional relationships are protein-protein binding interactions which result in bidirectional
complex formation. Ignoring directionality will generally produce larger networks and may merge
smaller networks into larger networks.
When you are ready, launch the analysis by clicking the ‘perform network analyis’ button. Your analysis
will be forwarded to the taskbar. If you keep the taskbar window open until the analysis completes, the
analysis results will automatically be loaded within the open window.
Last updated September 30, 2015
For a detailed description of the analysis report, please see the ‘Functional analysis tools -> Identify
shared networks’ page of the TRANSFAC user manual.
Step-by-step analysis (Wizard workflows)
The step-by-step analysis tool in TRANSFAC replaces the ‘Wizard mode’ of ExPlain. Three workflows are
supported:
1. Gene-level microarray and RNA-seq data sets
2. ChIP-seq data sets
3. Transcript-level RNA-seq data sets
Access the workflows through the quick start section of the Home page:
Last updated September 30, 2015
Or by clicking the tools menu and then the ‘Step-by-step data analysis’ link:
For a detailed description of the workflow options, please see the ‘Gene regulation analysis tools ->
Step-by-step data analysis’ page of the TRANSFAC user manual.
Last updated September 30, 2015
Last updated September 30, 2015