1
Noname manuscript No.
(will be inserted by the editor)
Using Dynamic Runtime Testing for Rapid
Development of Architectural Simulators
Saša Tomić · Adrián Cristal · Osman
Unsal · Mateo Valero
Received: date / Accepted: date
Abstract Architectural simulator platforms are particularly complex and errorprone programs that aim to simulate all hardware details of a given target
architecture. Development of a stable cycle-accurate architectural simulator
can easily take several man-years. Discovering and fixing all visible errors in
a simulator often requires significant effort, much higher than for writing the
simulator code in the first place. In addition, there are no guarantees that all
programming errors will be eliminated, no matter how much effort is put into
testing and debugging.
This paper presents dynamic runtime testing, a methodology for rapid
development and accurate detection of functional bugs in architectural cycleaccurate simulators. Dynamic runtime testing consists of comparing an execution of a cycle-accurate simulator with an execution of a simple and functionally equivalent emulator. Dynamic runtime testing detects a possible functional
error if there is a mismatch between the execution in the simulator and the
emulator.
Dynamic runtime testing provides a reliable and accurate verification of
a simulator, during its entire development cycle, with very acceptable performance impact, and without requiring complex setup for the simulator execution. Based on our experience, dynamic testing reduced the simulator modification time from 12-18 person-months to only 3-4 person-months, while it
only modestly reduced the simulator performance (in our case under 20%).
Keywords architectural · simulator · cycle-accurate · Simulation · dynamic ·
runtime · testing
Saša Tomić, Adrián Cristal, Osman Unsal, Mateo Valero
Barcelona Supercomputing Center (BSC), Spain. E-mail: {[email protected]}
Saša Tomić, Mateo Valero
Universitat Politècnica de Catalunya (UPC), Spain.
Adrián Cristal
Artificial Intelligence Research Institute (IIIA); National Research Council (CSIC), Spain.
2
Saša Tomić et al.
1 Introduction
The proposals for hardware changes are typically first implemented and evaluated on architectural cycle-accurate simulators. The simulators are used to
understand the impact of different architectural features and configurations on
the performance. These simulators aim to accurately represent the functionality, interaction, and timing of all functional components in real hardware.
As such, architectural simulators are typically very complex and prone to
errors. A simulator with errors can unnecessarily delay the evaluations of architectural proposals. Incorrect simulator evaluations can take future product
development in a wrong direction, or create other unnecessary development
costs. Simulator developers often invest significant effort in thoroughly testing and verifying the simulators, attempting to confront the errors. However,
faced with short deadlines, simulator developers are often forced to sacrifice
the quality of testing and verification.
Verification and debugging are often seen as the most difficult (time consuming) problems in today’s complex hardware and software systems. This is
especially the case with the products that require continual modifications. It
is commonly estimated by many hardware and software companies that verification takes between 50 and 70 percent of the total cost of a product [7,
9]. For large or mission-critical projects, verification can take as much as 90
percent of the total cost. Traditional testing methods (for example, unit testing [12]) require a significant amount of programming effort to provide good
code coverage and satisfying level of confidence in simulator correctness.
In contrast with simulators, architectural emulators (e.g., QEMU [2]) model
far fewer details of a target hardware architecture. Emulator implementation
typically revolves around functionality, and functionality alone. For example,
a processor emulator: (1) decodes instructions, (2) executes them, and (3) updates the simulated memory. The objective of an emulator is not to estimate
the performance of such architecture. For example, an architectural emulator
may be used to make a virtual machine and to do cross-platform software
development. Since emulators are far simpler than simulators, they are generally much more stable, much easier to debug, and to validate. Still, executions
on an architectural simulator and an emulator have to produce identical final
results.
In this paper, we present dynamic runtime testing, a development methodology that uses an emulator to accelerate simulator development and to fortify
the simulator. Dynamic runtime testing results in a more reliable and more robust simulator. It discovers functional errors (bugs) and the timing bugs that
result in functional bugs. The bugs are automatically detected at all points of
a simulator development cycle.
In dynamic runtime testing, an execution of a simulator is compared with
an execution of the integrated simple emulator. The emulator is used as a
golden-reference for the functional verification of the simulator. In dynamic
runtime testing, we execute both the simulator and the emulator sequentially
and in the same environment. The execution results of the simulator and the
Dynamic Runtime Testing for Development of Architectural Simulators
3
emulator are compared as often as possible, preferably after every operation.
Any difference between the execution in the simulator and the emulator indicates a possible bug in the simulator or the emulator and needs to be carefully
examined. Dynamic runtime testing aims to be a “write and forget” methodology for continuous testing, where developer creates the testing environment
and then continues to freely change the simulator. A developer can change the
code more rapidly, knowing that a simulator will report any introduced bug,
together with the exact point of execution where the bug appeared.
In particular, dynamic testing has the following advantages over conventional simulator-testing methods:
1. Faster simulator testing, since there is no need for creating a complex and
extensive test suite,
2. Faster simulator debugging, since a developer knows the precise moment
and the circumstances that lead to a bug, instead of only discovering that
a bug appeared, and
3. Faster simulator development, since a developer knows that any introduced
bug will become visible immediately. This gives him more confidence and
freedom to develop the simulator.
In addition, dynamic runtime testing could also help to recover the simulator
execution from a certain type of bugs. If simulator execution is different from
the emulator, it is possible to fallback to the execution results of the emulator.
This can improve the overall reliability of the simulator, although admittedly
not its correctness.
In Section 2, we present the guidelines for applying the methodology, either to the entire simulator, or to a particular component (module) of the
simulator. After that, we present several use cases of the methodology: coherent multi-level caches, Hardware Transactional Memory (HTM), and Out-OfOrder (OOO) processors, and then discuss the general guidelines for applying
dynamic runtime testing.
Dynamic runtime testing verifies the functional correctness of a simulator
during entire simulator execution, in every simulator execution, during entire
lifetime of the simulator. However, the presented methodology only detects
purely functional bugs (e.g., cache gives a value that was never fetched from
the main memory), or timing bugs that result in functional bugs (e.g., cache
does not invalidate a block when it should). In Section 3, we explain the
limitations of the methodology, and the related implications.
In Section 4, we explain how a developer can use dynamic runtime testing to find and fix bugs in a simulator. We describe our preferred debugging
methods – execution tracing and an interactive debugger tool. We also present
an example of a debugging session of a simulator that has dynamic runtime
testing. If it detects a potential bug, dynamic testing provides a direct path
for finding the bug, and for verifying that the bug has been eliminated. We
show a simple and efficient procedure that can help to locate the section of
code with a bug. The procedure is much faster and has much less room for
errors than a typical debugging procedure.
4
Saša Tomić et al.
In Section 5, we evaluate the impact of dynamic runtime testing on the
performance of two cycle-accurate simulators: coherent multi-level caches and
Hardware Transactional Memory (HTM). The overhead of dynamic testing
is modest (10-20%) in our implementations, since our baseline simulator has
much higher complexity than the emulators added for dynamic runtime testing. The overhead of dynamic testing could be even smaller in other implementations, for example, if we test a full-system cycle-accurate simulator of a
pipelined out-of-order architectural processor. In this case we can use a highly
optimized architectural emulator, which can provide speed close to the native
execution [2]. In contrast, the fastest full-system cycle-accurate simulators can
simulate only around 2 MIPS (million instructions per second). An additional
overhead of a performance-optimized architectural emulator could be less than
1%.
In Section 6, we share our experiences with dynamic testing. Dynamic
testing helped us to rapidly develop, test, and verify several architectural cycleaccurate simulators. Consequently, our simulator development became more
productive and more efficient. Finally, in Section 7 we discuss the related work,
and in Section 8 we bring conclusions.
2 Detecting Bugs Using Dynamic Testing
In this section, we present the dynamic simulator testing methodology. We
start by presenting the methodology on a high-level, and then analyze several
use cases and describe more implementation details. After this, we explain the
limitations of the methodology.
Dynamic testing can be applied both to individual components (modules)
of a simulator (examples in Sections 2.1 and 2.2), or to the entire simulator
(example in Section 2.3). In the rest of this paper we will use a generic term
“simulator” even for individual simulator components, since the individual simulator components can usually be transformed to independent simulators.
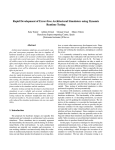
An overview of dynamic runtime testing is illustrated in Figure 1. Dynamic
testing consists of comparing (1) the outputs of a functional simulator, with
(2) the outputs of its functionally equivalent emulator. The comparison is done
after every executed operation, and all outputs have to be identical. Although
any type of output could be compared, we found it convenient and sufficient
to compare the values of read and written memory locations.
A high-level overview of the procedure for implementing dynamic testing
can be represented as:
1. Emulator integration. We make a functionally-equivalent emulator and
integrate its code with a baseline simulator. The emulator should not provide any timing estimations. Instead, it should be easy to understand, be
functionally correct and, if possible, have good performance.
2. Emulator validation. We disable the code of the baseline simulator and
redirect its input (e.g., operations and memory values) to the emulator.
Dynamic Runtime Testing for Development of Architectural Simulators
5
assert
equal
output(s)
output(s)
simple
emulator
(without timing)
detailed cycle-accurate
simulator
(with timing)
input(s)
input(s)
dynamic
testing
Fig. 1 An overview of dynamic testing. The tested simulator (black) and the functionally
identical emulator (red) have to produce the same output during entire simulator execution.
Any difference indicates a likely bug.
We have to confirm that all applications terminate correctly and do not
give any errors or warnings.
3. Simulator-emulator comparison. Finally, we re-enable the code of the
baseline simulator giving it the same input as to the emulator. We execute
an operation in the simulator, after that in the emulator, and then compare the outputs. Any difference in the outputs of the simulator and the
emulator indicates a possible bug in either the simulator or the emulator.
Although we did not do so, it is possible to execute the simulator and
the emulator in parallel (multi-threaded), and to synchronize their execution
in order to verify the correctness. In our view, the added complexity of synchronization would not compensate for the added value of potentially faster
execution. In that approach, we would check and synchronize the progress of
the simulator and the emulator after each executed operation, get the results
(outputs) of the two executions, and compare them. The overhead of synchronization can easily exceed the overheads of the sequential execution of the
emulator, especially in the case when the execution of the emulator is short.
The simulator notifies a developer, and provides an exact point of execution at which the difference from the emulator appeared. In case there is no
difference between the outputs between the simulator and the emulator, we
can be highly confident that the simulator-based evaluations are functionally
correct, but still not certain. Dynamic simulator testing cannot guarantee that
no bugs have remained in the simulator. However, assuming that the simula-
6
Saša Tomić et al.
tor executes a wide set of applications, the majority of bugs are likely to be
discovered.
In the following sections, we demonstrate dynamic testing with several realworld use cases. This may give a better insight into the process of emulator
development.
2.1 Use Case: Coherent Multi-level Caches
Coherent multi-level caches are functionally simple, although their implementation can be very complex. Our cycle-accurate simulator for the coherent
multi-level caches is a collection of objects (one object per cache structure)
that: (1) use a coherence protocol and state machines to track the ownership
of cache lines, (2) track the values (data) of the cache lines, and (3) calculate
the access latency of each access.
Bugs in coherent multi-level caches usually appear in the coherence protocol, which can lead to multiple “modified” copies of the same location at
different instances or levels of cache, resulting to incorrect values of some locations. Our goal was to eliminate the frequently-buggy coherence protocol
and to avoid multiple copies of cache lines. This can be achieved with a cache
emulator that has only one level and that is directly accessible by any part of
the simulator. Such emulator obviously cannot estimate an access latency, but
this is not the objective of the emulator.
A single level of caches allows us to further simplify the code. By analyzing
the requirements, we can conclude that the same functionality can be provided
by a generic data container for key-value pairs. The data container stores the
pairs of (1) an address of a cache line and (2) the data stored in the cache line.
Beside the data container, we wrote simple functions for extracting sequences
of bytes from a cache line. Most modern programming languages provide such
data containers, typically with a name map, or a dictionary. For example,
C++ has a Standard Template Library (STL) map, which supports adding a
new key-value pair, updating the value stored at a certain key, and removing
some or all entries.
The simulator we use has strict consistency, and we use dynamic runtime
testing to verify the following functionalities of multi-level caches: (1) every
read from a location needs to return the last value written by any processor to
the same location, and (2) every write-back from the caches to the simulator
memory needs to return the last written value. These functionalities must be
satisfied at all times, by all types of coherent caches: snoop-based, directorybased, or other, with any cache-interconnection topology and interconnection
type.
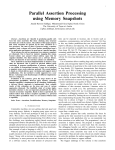
Figure 2 illustrates the resulting configuration of coherent multi-level caches
that includes dynamic runtime testing. When program reads from an address,
the processor requests the value from the multi-level cache simulator. The
cache simulator may have to fetch the value from the main memory of the
simulator. The objects in the cache simulator communicate by exchanging
Dynamic Runtime Testing for Development of Architectural Simulators
7
processor core(s)
write
read
assert
equal
output
output
input
...
L1
STL map
output
input
cycle-accurate
coherent
multi-level
caches
interconnect
input
Last Level Cache
output
input
assert
equal
dynamic testing
extensions
line evict
line fetch
simulator memory
Fig. 2 Dynamic runtime testing applied to coherent multi-level caches. The cache lines
fetched and evicted by (1) the cache emulator (STL map) and (2) the cycle-accurate coherent
caches, must have the same value.
A=10
read
from
Memory
....
time
A
evict A
....
evict A
evict A
assert equal
A=10,
latency
A=10,
latency
get A
get A
L2
cache
.
.
.
Memory
get A
L1
cache
A=10,
latency
Processor
A=10
get A
Cache
Emulator
assert equal
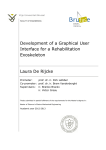
Fig. 3 A time diagram of dynamic testing for coherent multi-level caches. The cachesimulator and the cache-emulator execute sequentially, and have to return the same values.
8
Saša Tomić et al.
READ
// cycle-accurate cache simulator. Multi-level
data = processor[cpuid]->L1->read_data(address, size, &latency);
// cache emulator. Single-level
data_functional = functional_cache.read_data(address, size);
if (data_functional != data) {
FATAL_ERROR("incorrect cache value: %x instead of %x", data, data_functional);
// also print the simulator cycle, state, and the accessed address, and then exit
}
WRITE
// cycle-accurate cache simulator. Multi-level
processor[cpuid]->L1->write_data(address, size, data, &latency);
// cache emulator. Single-level
functional_cache.write_data(address, size, data);
LINE EVICT (fromthe last-level-cache, LLC)
// LLC evicts the line with address "address" and data "data"
data_functional = functional_cache.read_data(address, size);
if (data_functional != data) {
FATAL_ERROR("incorrect data in evicted line address: %x", address);
// also print the simulator cycle, state, and the accessed address, and then exit
}
Fig. 4 Pseudocode of dynamic runtime testing for coherent multi-level caches. The caches
have strict consistency.
messages, and each communication between cache objects increments the total latency of a cache access. Finally, when processor receives the value from
the multi-level cache simulator, it also receives the estimated latency of the
access, and it uses this latency to schedule the execution of the thread.
Figure 3 presents a time diagram of the dynamic testing of caches. When a
processor requests a value from its L1 cache, the request may propagate to L2
cache or higher memory levels. After the request is completed, and the cache
simulator returns the value and the latency of the access, the processor gets the
value of the same location from the cache emulator. A code in the processor
then confirms that the two values (from the simulator and the emulator) are
the same. The same process is performed by all processors in the system, and
with all their cache accesses. When a location is evicted from the top-level
cache, the same location is also evicted from the cache emulator, and the code
in the simulator memory confirms that the two evicted values are the same.
In Figure 4, we show the pseudo-code of our implementation of dynamic
testing for the cache simulator. A read returns the requested value and checks
that the value is the same in both the simulator and the emulator. A write
updates the values in two caches without doing any checks. If the cache simulator needs to evict a line, the same location is also removed from the cache
emulator, and the data in the two cache lines are checked to be identical. If
the data is identical, it is stored in the simulated main memory. Otherwise,
the difference is reported to the developer since it indicates a probable bug
in the implementation of the coherent multi-level caches. Having the exact
point of the execution where the difference appeared, the debugging of the
cache-coherence protocol is much simpler.
Dynamic Runtime Testing for Development of Architectural Simulators
9
2.2 Use Case: Hardware Transactional Memory
In our past work, our group designed, implemented and evaluated several proposals of Hardware Transactional Memory (HTM). Transactional Memory [6]
is an optimistic concurrency mechanism, which allows different threads to execute speculatively the same critical section, in a “transaction”. The assumption
is that the speculative execution of the transaction will not write over the data
used by other concurrent transactions. In case the assumption was correct, we
say that the speculation is successful, the transaction “commits” and publishes
the speculative writes made during its execution. Otherwise, we say that a
transaction has a conflict with some other transaction(s), and the HTM system decides which of the conflicting transactions are aborted. If a transaction
is aborted, the speculative writes made by these transactions are rolled back,
and their execution of these transactions is restarted.
The actual HTM protocol for publishing and rolling back speculative writes
can be very complex, often leading to bugs in commits and aborts of transactions. To improve performance, a designer of an HTM protocol may decide to
partially clear the transactional metadata during transaction commit [11], or
to group-change the permissions of all speculatively written lines [5].
To design a reference HTM emulator, we tried to eliminate complex commit
and abort procedures, providing only the basic functionalities universal to all
HTMs. The first necessary functionality of an HTM emulator is to buffer the
speculative writes until a transaction successfully commits. We can keep the
speculative writes in an STL map (similar to the cache emulator). The second
necessary functionality of an HTM emulator is the detection of conflicts with
other transactions. A transaction needs to check the speculative reads and the
writes with all other active transactions. Since we already track the speculative
writes in the STL map, we only need to track the speculative reads in another
STL set. Since STL map and set have theoretically unlimited capacity, the
reference HTM emulator can also successfully detect the problems usually
caused by limited hardware resources in HTMs.
Figure 5 shows a graphical overview of the presented approach for dynamic
testing of an HTM. The same HTM emulator can be used to test HTMs with
eager and lazy version management and can verify the values of both speculative reads and writes. In case a transaction already speculatively wrote to
the location, a read from the same transaction has to return this speculatively
written value. Otherwise, a read has to return the last non-speculative value
of the location in the system. A transaction has to commit all values speculatively written during its execution, and it has to commit the last written
values of these locations.
Figure 6 presents a time diagram of dynamic runtime testing of an HTM.
During execution, a simulated processor sends the memory accesses and the
transactional events, first to an HTM simulator and after that to the HTM
emulator. The values that transactions read, and the committed values, are
compared between the two HTMs. Any difference from the HTM emulator
indicates a likely bug in the HTM simulator. The simulator logs the differ-
10
Saša Tomić et al.
processor core
read
write, begin tx
abort tx, commit tx
assert
equal
output
output
input
simple HTM emulator
without timing
cycle-accurate HTM
timing simulator
STL map
STL set
input
read set
write set
write/commit
(output)
input
dynamic testing
extensions
read
(input)
shared memory
....
time
get write set
write A
A
read A
read A
A
shared
memory
commit
write set
HTM
simulator
assert
equal
....
write set
Processor
A
read A
HTM
Emulator
write A
Fig. 5 Dynamic runtime testing applied to HTMs. All reads are compared between the
HTM simulator and the HTM emulator, and must return the same value. Optionally,
writes/commits could be compared as well.
assert equal
Fig. 6 The time diagram of dynamic testing of an HTM. The HTM-simulator and the
HTM-emulator execute sequentially, and have to return the same values.
ence together with more details on the simulator state (for example, simulator
clock). Based on the log, a developer can start debugging precisely at simulator
state where the potential bug appeared.
Figure 7 shows the pseudo-code of our implementation of dynamic testing
for HTMs. To simplify the code of the HTM emulator and at the same time
make it less dependent on the particular implementation of the HTM simulator, we decided to slightly relax our implementations of dynamic testing of
HTMs. Our implementations do not verify the committed values. Instead, a
Dynamic Runtime Testing for Development of Architectural Simulators
11
TRANSACTIONAL READ
data
=
HTM.write_set[txid].get(addr) or caches.get(addr)
data_functional = FunctionalHTM.write_set[txid].get(addr) or shr_mem.get(addr)
if (data_functional != data) {
FATAL_ERROR("incorrect HTM value: %x instead of %x", data, data_functional);
// also print the simulator cycle, state, and the accessed address, and then exit
}
TRANSACTIONAL WRITE
if not HTM.write_set[txid].has(addr):
HTM.write_set[txid].fetch_from_caches(addr)
HTM.write_set[txid].update(addr) with data
if not FunctionalHTM.write_set[txid].has(addr):
FunctionalHTM.write_set[txid].fetch_from_shr_mem(addr)
FunctionalHTM.write_set[txid].update(addr) with data
ABORT
FunctionalHTM.abort_instantly(txid) // instantly clears the write_set & restarts
HTM.initiate_abort(txid)
// rollback & restart; may take many cycles
COMMIT
FunctionalHTM.abort_conflicting_transactions(txid) // detect & resolve conflicts
FunctionalHTM.commit_to_shr_mem(txid) // instantly publishes specul. changes
// regular HTM: starts conflict detection/resolution/committing specul. changes
// this may take many cycles
HTM.initiate_commit(txid)
Fig. 7 Pseudocode of the implementation of dynamic runtime testing for an HTM
transaction in a single cycle publishes all its speculative writes, by updating
the values in the cache emulator (the STL map) described in Section 2.1. On
the other side, the cycle-accurate HTM simulator publishes the speculative
writes by interacting with the multi-level cache simulator, in a process that
may take many cycles, and may require many changes of the permissions of
the cache lines.
2.3 Use Case: Out-of-Order Simulator
Dynamic testing can also be applied to an entire cycle-accurate Out-Of-Order
(OOO) processor simulator. The biggest problem with OOO processor simulators are their hard-to-find bugs which appear only with certain values or
certain interleaving of instructions, which may appear only in very long simulations. Many bugs are related to incorrect implementations of some instructions or their parts (micro-operations). These bugs may eventually cause some
memory location to have incorrect value, which may change the execution after
millions or billions of instructions, making debugging almost impossible.
Dynamic runtime testing can significantly improve the stability of OOO
simulators since it detects these bugs instantly, as they happen. In Figure 8,
we present a schematic overview of a possible implementation of dynamic
runtime testing for OOO simulators. This use case is slightly different from
previous examples of dynamic testing, since a reference emulator has only
one input (from simulator memory) and one output (to simulator memory).
12
Saša Tomić et al.
Fetch
read
(input)
ROB
.
.
.
Decode
Execute
simple processor
emulator
input
Writeback
Commit
output
cycle-accurate
out-of-order
processor
simulator
writeback
(output)
assert
equal
read
dynamic testing
extensions
simulator memory
Fig. 8 Dynamic runtime testing applied to the entire Out-of-Order simulator.
However, this does not significantly change the implementation of dynamic
runtime testing, compared to the previous examples. To dynamically test an
OOO simulator, we can compare its writes to the simulator memory with
the writes made by a simple processor emulator. Having identical memory
writes during the entire simulation provides a strong confidence that the cycleaccurate OOO processor simulator is functionally correct.
Since processor emulators are much faster than cycle-accurate OOO simulators (two or more orders of magnitude), the dynamic testing should not
significantly affect the speed of the simulator. Cycle-accurate OOO simulators
are inherently slower from the emulators since they simulate the functionality
and the interaction of all hardware elements physically present in OOO processors, while processor emulators typically only decode instructions, execute
them, and then update the simulated memory.
2.4 Discussion of Dynamic Runtime Testing
Similarly to the presented examples of dynamic testing, the same principle
could be used to improve the functional correctness of other cycle-accurate
hardware simulators, and to simplify their debugging without significantly reducing their performance. Among other potential applications, dynamic runtime testing can be used for: single-processor multi-level memory hierarchy,
incoherent multi-level memory hierarchy, system-on-chip simulators, network
models, on-chip routing protocols, or pipelined processors.
Dynamic runtime testing can be implemented efficiently if a target simulator evaluates the performance of a module that can functionally be represented
by a simple emulator. A developer needs to spend some time to understand and
Dynamic Runtime Testing for Development of Architectural Simulators
13
extract the basic (reference) functionality of the simulator module. Depending on the experience of a developer and the complexity of the module, this
part may require some effort. In extreme cases (e.g., for complex components)
extracting the basic functionality and implementing the emulator may take a
lot of time and it may get almost as complicated as building the simulator.
One way to approach emulator development is think of the target simulator
module at high level, and to observe the inputs and the outputs. The target
simulator module should be observed as a black box that takes (inputs) certain
values and produces (outputs) other values. This may give us the key insight on
the minimal functionality that the equivalent simple black box (the emulator)
must provide. In our development, we were considering only the values of the
memory locations that modules read and write. It took us no longer than a
couple of person-hours to design each of the emulators presented in this paper.
The actual implementations, however, took more time and there were often
corner-cases that required several iterations over the initial emulator design.
3 Limitations of Dynamic Runtime Testing
Simulator bugs can be grouped into three categories:
1. Timing related bugs resulting in inaccurate time estimates,
2. Timing related bugs resulting in inaccurate functional behavior, and
3. Non-timing related functional bugs.
Dynamic runtime testing addresses the second and the third category of
simulator bugs. The bugs falling into the first category can be detected using
for example dual modular redundancy. With this technique, the same simulator
module is implemented by two teams. All implementations have to provide the
same functionality, including an estimation of timing (the execution time). A
different timing estimation indicates a bug in one of the implementations.
For higher confidence, we may use triple modular redundancy instead of dual.
Note that detecting the bugs from the first category may require a significantly
higher development effort.
For example, a bug that falls into the first category is an unnecessary
eviction of lines from L1 cache. In this case, cache simulator will still have
correct functionality, but the estimated execution time will be incorrect – the
result from an "L1->read" will give a correct line (fetched from L2 cache),
but the latency will be that of the L2 access instead of the L1 hit. Another
example of undetected bugs falling into the first category could be unnecessary
aborts of transactions in the HTM simulator.
The bugs from the second and the third category (that dynamic testing
detects) are just as important and at least as common as the bugs from the
first category. An example of a bug from the second category is when L1 cache
does not invalidate some blocks modified by other private caches. A bug from
the third category can be when cache provides a value that was never fetched
from the main memory.
14
Saša Tomić et al.
Dynamic runtime testing does not offer a formal approach for verifying
the correctness of an emulator. However, it is only important that there are
no obvious problems with the emulator execution. To get to this state, we
have to use the regular methods for testing and debugging. After the emulator
is apparently functioning well, by integrating it and comparing its execution
with the baseline simulator we can locate some bugs in the emulator. That
is, any mismatch between the simulator and the emulator indicates a possible
error in one of the two, and a developer needs to address all differences very
carefully.
Finally, the use of dynamic runtime testing does not signify that simulator
testing is complete. A developer also needs to employ other testing and verification techniques, for example unit testing, code reviews, and dual (or triple)
modular redundancy of the simulator modules in question.
4 Finding and Fixing Simulator Bugs
After dynamic testing reports a potential bug in the simulator, a developer
needs to approach the conventional debugging methods in order to find the
source of the bug in the simulator. We describe here two common debugging methods: (1) a conventional debugging tool, or a debugger, for example
gdb [13], and (2) execution traces.
Debugger allows a developer to stop the execution of the simulator at the
moment he finds most appropriate, and to examine the state of the simulator
memory and the architectural registers. This allows the developer to examine
in details the complete state of the simulator, and it even allows him to test the
output of particular simulator functions, or to manually set the values of some
memory locations. Debuggers generally have good performance and support
for advancing the execution “forward in time”. Unfortunately, going “back in
time” is very difficult in a debugger. This means that if a developer misses the
point of failure, he generally has to stop the simulator execution, restart the
simulator, and then wait until the execution comes to the same point.
Trace-based debugging does not require a specific tool, since it consists
of instrumenting the simulator code, to print the important part of simulator
context to a trace file. Having a static trace file allows a developer to explore the
execution not only by advancing “forward in time” (as with typical debuggers),
but also “back in time”, with no added complexity. By analyzing the static trace
file, a developer can reason about the state of the simulator and expect that
a bug appeared in a certain section of simulator code.
However, in certain aspects, trace-based debugging may be more complicated than a debugger. First, a developer needs to instrument the code for
tracing, while developing the simulator. If the trace files do not contain all the
information that a developer needs, he needs to re-instrument the simulator
code, make more verbose trace files, and to re-execute the complete simulation. He similarly needs to remove some tracing instrumentation if the trace
files are too verbose, which makes them unreadable and unnecessarily large.
Dynamic Runtime Testing for Development of Architectural Simulators
15
# execute the simulator evaluation
$ ./build/ALPHA_FS/m5.fast ./configs/example/fs.py ...
# the execution status of the simulator
...
simulation clock 3.068 MIPS
simulation clock 2.967 MIPS
simulation clock 3.163 MIPS
simulation clock 3.159 MIPS
simulation clock 3.143 MIPS
simulation clock 3.133 MIPS
simulation clock 3.111 MIPS
simulation clock 3.074 MIPS
m5.fast:cpu/simple/atomic.cc:612:Fault AtomicSimpleCPU::read(uint64_t, T&, unsigned int) [with T =uint64_t]:
Assertion `data_correct ==data64' failed.
Program aborted at cycle 2101189739000
...
Fig. 9 An example of Dynamic Testing: the simulator reports a potential bug
Our approach to a trace-based debugging is to turn off tracing by default.
This improves the execution speed of a simulation and reduces the storage requirements. In essence, this eliminates the trace files for all executions without
bugs. We enable tracing after dynamic runtime testing reports a potential bug.
Our implementation of tracing also has several levels of verbosity. While more
verbose trace files provide more information on the simulator states, they slow
down the execution more, and are slower or more difficult to analyze later.
4.1 An Example of a Debugging Session
In this section, we show an example of how dynamic runtime testing can
simplify simulator debugging.
In our simulator development, we prefer using the trace-based debugging
and we use a debugger only if necessary. Trace-based debugging provides an
easy way to analyze the execution of the simulator both forward and back in
time, starting from any position in the simulator execution.
If dynamic runtime testing detects a possible bug, it reports the bug on the
“standard error” stream, and stops the execution of the simulator. We show
an output of the described execution scenario in Figure 9.
A developer turns on detail tracing and re-executes the simulator. Dynamic
runtime testing now also generates a complete trace of all memory accesses
(addresses and values of reads and writes) that preceded the bug. From our
experience, a bug is most often created in the last operation performed over
the location. Less frequently a bug is 2-3 operations before, and rarely earlier
than that. To find the previous uses of the location that has an incorrect value,
we analyze the traces using standard text-processing tools, for example, grep,
sed, and awk.
Figure 10 shows an example of a trace file. The last line in the trace file
holds the address of the location with an incorrect value. In this particular
case, the address of the variable is 0xfb4b5c8, and the address of the cache
line holding the variable is 0xfb4b5c0.
In the next step, we “grep” the trace file to find the most recent occurrences
of our cache line. The filtered trace for the cache line is shown in Figure 11. The
16
Saša Tomić et al.
# check the last lines of the execution trace
$ tail htm_trace.txt
T0* TXRD line 0xf9619c0: 0xf9619e0=0x0 OWL
T0* TXRD line 0xf9619c0: 0xf9619e8=0x0 OWL
T0* TXRD line 0xf9619c0: 0xf9619f0=0x0 OWL
T0* TXRD line 0xf9619c0: 0xf9619f8=0x0 OWL
T0* TXRD line 0xf961a00: 0xf961a00=0x0 OWL
T0* TXRD line 0xf961a00: 0xf961a08=0x0 OWL
T0* TXRD line 0xfb4b5c0: 0xfb4b5c8=0x0 OWL
*** ERROR:P0 RD line 0xfb4b5c0:0xfb4b5c8=0x120043220 and should be 0x0
Fig. 10 An Example of Dynamic Testing: potential bug found in the log
# check the last usage of this line
$ grep 0xfb4b5c0 htm_trace.txt | tail
T0 TXRD line 0xfb4b5c0: 0xfb4b5c0=0x0 --T0 TXRD line 0xfb4b5c0: accb->txnoconfl=0, accb->txwr=0
T0 TXRD line 0xfb4b5c0: 0xfb4b5c8=0x0 --L
T0 TXRD line 0xfb4b5c0: 0xfb4b5c8=0x0 --L
T0 TXWR line 0xfb4b5c0: 0xfb4b5c8=0x0 --L
Here is a problem
T0 0xfb4b5c0 TXWR accb->txnoconfl=1, accb->txwr=0
The value should be in the
T0
Line 0xfb4b5c0 evicted, moving to overflow buffer!
overflow buffer, but the
T0* TXRD line 0xfb4b5c0: 0xfb4b5c0=0x0 OWoverflow buffer does not
T0* TXRD line 0xfb4b5c0 searching in shadow space
have it!
T0 shadow ??? --> orig 0xfb4b5c0 no overflow buffer entry
T0* TXRD line 0xfb4b5c0: 0xfb4b5c8=0x0 OWL
*** ERROR: P0 RD line 0xfb4b5c0: 0xfb4b5c8=0x120043220 and should be 0x0
Fig. 11 An Example of Dynamic Testing: a potential cause of the bug found. The overflow
buffer in lazy HTM does not have the value that it should have.
last operations show that the cache line 0xfb4b5c0 was evicted from L1 cache,
and moved to an “overflow buffer” (sort of a victim cache for transactional
data). However, on the next access, the cache line was not present in the
overflow buffer. This means that the bug could be in the code for moving the
value to the overflow buffer, or in the code for the retrieving a value from the
overflow buffer. We now have an exact segment of simulator code that has
a bug, and we can see the interleaving of accesses that lead to the incorrect
behavior. After we analyze the functionality of the simulator code with a bug,
we can very quickly identify and fix the problem.
A problem may arise if the trace files do not hold enough information. For
example, a log file may not include the operations with the overflow buffer.
In this case, a developer needs to increase the verbosity and to repeat the
whole execution. Verbose tracing provides more details on the simulator state
during execution, and this often results in easier debugging. Since all simulator
executions are deterministic, changing the verbosity of traces and re-executing
the simulator will produce the same bug, even if we execute a multi-threaded
application inside the simulator. Note that it is very important to re-execute
the complete benchmark suite after we eliminate a bug, since fixing one bug
might uncover or create other bugs in different benchmark configurations.
5 Evaluation
In this section, we show the performance impact of dynamic testing on simulator performance (execution time). We have used the M5 full-system sim-
Norm a lize d e xe c ution tim e
Dynamic Runtime Testing for Development of Architectural Simulators
With c a c he te s ting
1.4
17
With HTM a nd c a c he te s ting
1.2
1.0
0.8
0.6
0.4
0.2
0.0
1
2
4
8
16
Sim ula te d proc e s s or c ore s
32
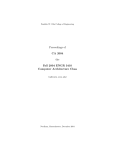
Fig. 12 Dynamic testing impact to the simulator speed during Operating System (OS)
booting. The average simulator speed is normalized to the one without dynamic testing.
ulator [3] as a base architectural simulator, and extended it to implemented
MESI-directory coherent multi-level caches, and several HTM proposals.
We carried out all simulations on modern Intel Xeon X86_64 processors,
taking care of minimizing the I/O and other system calls, which may nondeterministically affect the simulator performance. As a result, all simulator
executions have more than 98% CPU utilization on average. We have measured
the execution time of the simulator for all applications from the STAMP transactional benchmark suite [4], and for 1, 2, 4, 8, 16, and 32 simulated processor
cores. The simulator is single-threaded, and to simulate multi-core processors,
the simulator sequentially processes events of each simulated processor core
or device. We have repeated each execution three times to reduce the effect
of wrong measurements in single executions caused by random, uncontrollable
events, and then calculated an average execution time.
Figure 12 shows the impact to the time needed to simulate the booting
of the Operating System. We have grouped the simulator executions by the
simulated number of processor cores, normalized the execution time to the
simulator without dynamic testing, and then calculated the geometric mean.
The results indicate that dynamic testing reduces the simulator speed by 20%
on average, with a very small standard deviation. Since there are no transactions during the booting of the OS, there is almost no penalty for the empty
calls to the HTM testing code.
Figure 13 shows the performance impact of dynamic testing during application execution. We have grouped the simulator executions by the simulated
application, normalized the execution time to the simulator without dynamic
testing, and then calculated the geometric mean. According to the evaluation,
dynamic testing reduces the execution time between 10% and 20%, which is
relatively less than during the OS booting. The reason is that the basic simulator is now more complex and simulates an HTM protocol. We can see that,
Saša Tomić et al.
With c a c he te s ting
1.4
With HTM a nd c a c he te s ting
1.2
1.0
0.8
0.6
0.4
0.2
da
ya
n-
nva
ca
t io
t io
ca
lo
w
hi
2
ca
ss
va
h
in
t
w
-lo
la
b
yr
i
-h
ns
ns
ea
km
m
de
ea
km
ru
in
t
no
ye
ge
ba
r
e
0.0
s
Norm a lize d e xe c ution tim e
18
Sim ula te d a pplic a tion
Fig. 13 Dynamic testing impact to the simulator speed during application execution. The
average simulator speed is normalized to the one without dynamic testing.
while dynamic HTM testing does introduce some overhead, the total increase
in the simulator execution time is generally below 20%.
In both testing examples, dynamic runtime testing would extend a 10 hour
simulation to less than 12 hours on average. Taking into account that writing
the simulator and the simulator test suite may take many person-months, we
consider the performance impact of dynamic testing to be more than acceptable.
6 Our Experience With Dynamic Runtime Testing
It is commonly believed that the earlier a defect is found, the cheaper it is to
fix it [10]. Our experience is certainly in accordance with this popular belief.
We have developed the dynamic testing methodology out of necessity. Making
a cycle-accurate architectural simulator is certainly not easy and, as any other
software development, it is very prone to errors.
The original cache coherence protocol in M5 simulator is snoop-based,
which we wanted to replace with a MESI directory-based coherence protocol. Our directory-based coherent caches hold both line addresses and data,
which means that a bug in the cache-coherence protocol would cause wrong
data to be provided by caches. Thanks to using dynamic testing, we were able
to complete the implementation of caches in under 3 months, and to have
much stronger confidence in the correctness of our implementation.
Our first two HTM simulators did not implement the dynamic testing
methodology. These two simulators were supposed to be used for validating the
results presented by LogTM [11] and TCC [5]. After more than 12 man-months
spent on simulator development we had to cancel the development, since some
simulations were still not terminating correctly, or were giving wrong results.
Dynamic Runtime Testing for Development of Architectural Simulators
19
Using the results of such simulator would jeopardize the objectiveness and the
correctness of our measurements. To find and eliminate bugs, we would have to
analyze the execution traces of hundreds of gigabytes, and this task is nearly
impossible to be done manually.
Three of our HTM simulators have lazy version management and one has
eager version management. Although the functionality of these HTMs is different, they all have similar functional equivalents. A fundamental difference
between the eager and the lazy HTM is the decision on when to abort a conflicting transaction. In all implementations, a transaction can keep its speculatively modified values private, in a per-transaction buffer, since the speculative
values become public after a transaction commits.
Dynamic testing methodology in our following simulators allowed us to
significantly reduce the time needed to transition from an idea to getting
the evaluation results. The benefits from dynamic testing are two-fold. First,
since we knew exactly where a bug appeared in the simulator execution, we
could quickly detect and eliminate all obvious simulator bugs. This reduced
the simulator development time from 12-18 man-months to 3-4 man-months.
Second, dynamic testing methodology improved our confidence in the results
of our evaluations, since we had a proof that all our HTM simulations were
functionally correct.
We have noticed that dynamic runtime testing significantly changed the
way we approach simulator development. Dynamic testing starts reporting
potential bugs as soon as it is implemented, and this allowed us to find and
resolve bugs much earlier in development than before. However, care must
be taken with that. It happened to us on several occasions that we started
debugging and fixing the simulator before we implemented all details of the
desired functionality. This is counter-productive since we were sometimes fixing
bugs in the code that we would later re-write. It is therefore important to delay
the start of debugging and fixing of the code until the complete functionality
of the simulator module is implemented.
7 Related Work
Dynamic runtime testing is related to several testing and debugging methodologies of software and hardware. These section describes several related testing and development methodologies.
Conventional debugging methods help discover how and why a bug occurred, but they offer very little help for discovering whether and where a
bug occurred. It is also possible that there is a logical flaw in the simulated
protocol. These flaws cannot be detected easily using conventional debugging
methods.
To detect bugs, a developer may add assertions to a program [8], to check
for illegal values of some variables. However, a developer needs to add assertions manually. This means that assertions detect only the bugs that a
developer can anticipate, for example, this value should never be zero. How-
20
Saša Tomić et al.
ever, some bugs produce values that are valid but incorrect. For example, if
an assertion checks if a value is non-zero, that assertion would not detect an
incorrect value 2 instead of 3. In result, beside polluting the source code, the
assertions detect only a small subset of bugs. Finally, even if an assertion fails
(after detecting an illegal value), the bug that caused the illegal value could be
millions of cycles before the assertion fails. Discovering where in the execution
a bug appeared is a difficult problem. Being “efficient in debugging” is directly
related to the previous experience in debugging and programming, causing debugging to be closer to an art than to a science. A bug may cause an execution
to: (1) fail, (2) terminate with an incorrect result, or (3) terminate with correct
result. We cannot underestimate the final case, where a program terminates
with correct result even though it has bugs. These bugs values might cause an
execution to be shorter or longer than it should be, for example, by causing a
wrong number of loop iterations.
In contrast with assertions, which often check values against constant illegal
boundary values, dynamic runtime testing provides precise reference values
to compare an execution with. In that sense, we can see dynamic runtime
testing as assertions with dynamic precise conditions, where the conditions for
assertion checks are strict and calculated in runtime, based on the history and
the current state of the simulator execution.
Back-to-back testing methodology [14] consists of comparing the execution of two independent and functionally equivalent programs. The programs
are compared: (1) statically (for example, by reading the source code), (2)
with specially designed functional test cases, and (3) with random test cases.
However, in back-to-back testing methodology the developers need to dedicate
significant time to creating a large collection of test cases. In contrast, dynamic
runtime testing is a small, “write and forget” one-time development effort that
autonomously performs tests during entire life cycle of the simulator.
“Co-Simulation” (co-operative simulation) [1] aims to accelerate the simulations in Hardware Description Language (HDL). Co-simulation consists of
partitioning the simulator into modules and simulating some modules in hardware simulators (HDL) and the rest in software (e.g., C code). The hardware
and software modules exchange information in a collaborative manner, using
a well defined interface. Since modules simulated in software are much faster
than the modules written in a low-level HDL, the simulation can be completed much faster. Co-simulation is sometimes extended for verification, but
the problem of interfacing modules in a heterogeneous simulation platform
presents a major issue both in performance and programmability. In contrast,
dynamic runtime testing was developed with an objective to provide functional
verification and has all simulator components written in the same language, on
a homogeneous simulation platform. Having a homogeneous simulation platform allows easier development and testing, stronger integration of simulator
modules, and faster execution.
Dual Modular Redundancy (DMR), Triple Modular Redundancy (TMR)
and more generally N-Modular Redundancy is a technique where two or more
identical systems perform the same work and their results are compared at
Dynamic Runtime Testing for Development of Architectural Simulators
21
each step by a voting system to produce a single output. DMR and TMR are
widely used in other areas for improving reliability, but they can also be used
for simulator development in order to verify the functional correctness and
timing estimation of a simulator. DMR (TMR) at least doubles (triples) the
amount of work put into the simulator development, since for effectiveness of
the technique each module needs to be developed independently, preferably
by a separate development group. The developed modules later need to be
integrated, which again increases the simulator development time. In contrast
with DMR (TMR), Dynamic Runtime Testing aims to accelerate the initial
simulator development, although it cannot be used for verifying the timing
estimation in the later phase of simulator development. Note that each module
in DMR or TMR can be developed with the help of dynamic runtime testing,
resulting in accelerated development of each independent module.
8 Conclusions
To increase the stability of cycle-accurate architectural simulators, developers
often put at least as much effort in testing and debugging, as in writing the
code. Still, errors may occur in the simulators even with the most rigorous
testing. Tests rarely cover whole 100% of the source code, and even more rarely
100% of all possible execution paths. The number of the possible combinations
of execution paths grows nearly exponentially with the size of the source code
(assuming that a number of conditional branches is constant over the source
code).
Academic development of architectural simulators is in even more difficult
situation than the industrial. In academia, the development teams working on
simulators are much smaller than in the industry, and the simulator changes
and evaluations are typically done quickly and with short deadlines. This discourages these development teams from writing extensive test suites for the
simulators. As a consequence, if the tests exist, they are typically sparse and
unsystematic.
Dynamic runtime testing is an alternative approach, where the functional
correctness of the simulator is verified automatically during simulator execution, in every execution. This allows developers to change the simulator
rapidly, and still be able to find bugs quickly and be confident that the simulator continues executing correctly. The simulator reports any potential bugs
to a developer, together with the exact time and the circumstances that lead
to the bug. The method imposes a minor reduction in simulator performance
and, in our case, we have managed to reduce the total time for simulator
development and evaluation from 12-18 person-months to 3-4 person-months.
9 Acknowledgements
This work was partially supported by the cooperation agreement between the
Barcelona Supercomputing Center and Microsoft Research, by the Ministry of
22
Saša Tomić et al.
Science and Technology of Spain and the European Union (FEDER funds) under contracts TIN2007-60625 and TIN2008-02055-E, by the European Network
of Excellence on High-Performance Embedded Architecture and Compilation
(HiPEAC) and by the European Commission FP7 project VELOX (216852).
References
1. Becker, D., Singh, R.K., Tell, S.G.: Readings in hardware/software co-design.
chap. An engineering environment for hardware/software co-simulation, pp.
550–555. Kluwer Academic Publishers, Norwell, MA, USA (2002).
URL
http://dl.acm.org/citation.cfm?id=567003.567052
2. Bellard, F.: Qemu, a fast and portable dynamic translator. In: Proceedings of the
USENIX Annual Technical Conference, FREENIX Track, pp. 41–46 (2005)
3. Binkert, N., Dreslinski, R., Hsu, L., Lim, K., Saidi, A., Reinhardt, S.: The M5
simulator: Modeling networked systems. IEEE Micro 26(4), 52–60 (2006). DOI
10.1109/MM.2006.82
4. Cao Minh, C., Chung, J., Kozyrakis, C., Olukotun, K.: STAMP: Stanford transactional
applications for multi-processing. In: IISWC ’08: Proceedings of The IEEE International
Symposium on Workload Characterization (2008). DOI 10.1109/IISWC.2008.4636089
5. Hammond, L., Carlstrom, B.D., Wong, V., Chen, M., Kozyrakis, C., Olukotun, K.:
Transactional coherence and consistency: Simplifying parallel hardware and software.
IEEE Micro 24(6) (2004). DOI 10.1109/MM.2004.91
6. Harris, T., Larus, J., Rajwar, R.: Transactional Memory, 2nd Edition, 2nd edn. Morgan
and Claypool Publishers (2010)
7. Harrold, M.J.: Testing: a roadmap.
In: Proceedings of the Conference
on The Future of Software Engineering, ICSE ’00, pp. 61–72. ACM, New
York, NY, USA (2000).
DOI http://doi.acm.org/10.1145/336512.336532.
URL
http://doi.acm.org/10.1145/336512.336532
8. Hoare, C.: An axiomatic basis for computer programming. Communications of the ACM
12(10), 576–580 (1969)
9. Jindal, R., Jain, K.: Verification of transaction-level systemc models using rtl testbenches. In: Formal Methods and Models for Co-Design, 2003. MEMOCODE’03. Proceedings. First ACM and IEEE International Conference on, pp. 199–203. IEEE (2003)
10. Kaner, C., Bach, J., Pettichord, B.: Lessons learned in software testing: a context-driven
approach. Wiley (2002)
11. Moore, K.E., Bobba, J., Moravan, M.J., Hill, M.D., Wood, D.A.: LogTM: Log-based
transactional memory. In: In proceedings of the HPCA-12, pp. 254–265 (2006)
12. Runeson, P.: A survey of unit testing practices. IEEE Softw. 23, 22–29 (2006). DOI
10.1109/MS.2006.91. URL http://portal.acm.org/citation.cfm?id=1159169.1159387
13. Stallman, R., Pesch, R.: The gnu source-level debugger. User Manual, Edition 4.12, for
GDB version 4
14. Vouk, M.: Back-to-back testing. Information and software technology 32(1), 34–45
(1990)