1
INTREPID User Manual
Library | Help | Top
Line correction and tie levelling (T30)
1
| Back |
Line correction and tie levelling (T30)
Top
Measurements taken during traverses are subject to errors or undesirable data from
a number of sources. These include:
•
Interaction between the direction of the Earth's magnetic field and that of the
aircraft may be affecting the measurements.
•
The aircraft position is measured using an instrument inside the aircraft, but
some data (e.g., magnetic) may be taken from a sensor at the end of a cable some
distance from it. The measurements may therefore be incorrectly located. This is
called systematic parallax error.
Variable aircraft speed may create an additional variable parallax error due to the
navigation instrument and acquisition instruments having a variable time
difference in passing over points in the survey area.
•
There may be inaccuracies in recording the survey craft's location and/or height
when a measurement is taken.
•
There will be a certain error in recording the aircraft attitude, and even if the
instruments are on a stabilized platform, Roll,Pitch and Yaw estimated values
will have an error, and for gradiomtery, this error will leak into the signed tensor
components.
•
The readings are all taken at different times. If the background magnetism or
radiation is changing during this time, these changes will confound the
measurements.
•
Magnetic measurements will include the Earth's core magnetic field.
•
The zero settings of older magnetometers vary exponentially with time (this is
called magnetometer drift).
•
Measurements will be affected by the ground clearance of the survey craft.
Luyendyk (1997)1 gives a comprehensive description of the sources of error in
aeromagnetic surveys and the corrections that can be applied.
The Levelling tool will assist you to correct these errors. It measures and
represents graphically the discrepancies between your acquisition lines and tie
lines. It then corrects your data using the geomagnetic reference data and by
comparing it with tie line and base station data.
Levelling Pro
The Pro version of the Tie Line Levelling tool uses sophisticated tensor and gradient
methods for altitude and heading correction and for loop levelling. It uses the same
task description (job) language as the standard version. At v5.0, this is depricated by
a new GOOGLE protobuf syntax that describes all this tool’s processes in a unique,
and fully transparent language, which INTREPID is publishing, along with new
example instances of the task control language, duplicating all the previously
published examples. The V5.0 strategy is to support both old and new syntax, to allow
you to transition, and verify that all works as required.
This means that the algorithmic compatibility for all existing scalar geophysics
measurements is also extended to include support for new tensor/vector measures, for
all the supported levelling methods. You can easily assess it relative to the existing
1. Luyendyk, A. P. J., (1997) Processing of airborne magnetic data, AGSO Journal of
Australian Geology and Geophysics, 17 (2), 31–38
Library | Help | Top
© 2012 Intrepid Geophysics
| Back |
INTREPID User Manual
Library | Help | Top
Line correction and tie levelling (T30)
2
| Back |
production tool.
We retained the GUI of the old tool but made engine room improvements one by one.
We completely rewrote and restructured the engine room to use INTREPID’s
powerful data objects.
Tie Levelling Pro can process any of the new vector, tensor, quaternion style data
fields in a database. However, probably the best way to check on available functional
status of any of the levelling methods, is to directly examine the “intrepidtasks.proto” file at V5.0, to confirm what you would like to do is supported. The
complete re-write and generalization of the engine room is not a simple or linear
process. It has already taken a lot of time and effort to get things to fall into place.
Our new levelling support library integrates the previous independent codes for
airborne and the special methods we developed to serve the marine levelling tools.
Marine levelling cross-overs include an estimate of the strike and dip of the measured
field at the cross-over point. This is useful for 3D GeoModeller when we have seismic
picks for different horizons.
We generalise all statistics for fields in the same way. We have rewritten all
operations such as interpolation and filtering support the new data types.
Tie Line Levelling Pro includes a new section especially for tensor data. This is
particularly useful for gravity tensors. You can add or remove Earth effects.
We have generalised the Heading correction to take advantage of the fact that for
most surveys there are 4 cardinal directions employed during surveying. the survey
team gathers group statistics for these 4 directions and we use such data as the
various systematic tensor and vector differences as the basis for the Heading
correction. This avoids the difficult task for the user of having to estimate these
heading errors before being able to apply the correction.
There is also a new Altitude correction. This uses a locally fitted truncated Fourier
series to the potential. With this series, on an observation by observation basis, we
make the altitude adjustment to a drape surface.
The Loop levelling algorithm is a least squares minimum residual method. We also
rewrote this to so that it works on Tensor data. The Frobenius norm of the cross-over
difference has proven a driving measure to minimize residuals.
As well as Tensor, the other common case for airborne geophysics is the observed
scalar field together with measured gradients. Tie Line Levelling Pro uses a single
pass method to level the complete signal.
Tie Line Levelling Pro can perform this using both the heading and loop levelling
methods.
We are still developing the generalised Polynomial levelling method. So far it
continues to work for scalars., and there is primary testing to show it working on
tensors as well.
Using the Levelling tool
You can set up the Levelling process in the following ways:
Library | Help | Top
•
Use the Levelling tool wizard.
•
Use the menu options and controls in the Levelling tool window
© 2012 Intrepid Geophysics
| Back |
INTREPID User Manual
Library | Help | Top
Line correction and tie levelling (T30)
3
| Back |
>> To use the Levelling wizard
Library | Help | Top
1
From the File menu, select Wizard for Easy Levelling.
2
Follow the wizard steps, referring to corresponding sections in this chapter as
required.
© 2012 Intrepid Geophysics
| Back |
INTREPID User Manual
Library | Help | Top
Line correction and tie levelling (T30)
4
| Back |
>> To use the Levelling tool1
1
If required, ensure that correctly configured aliases exist for the dataset you are
levelling. In particular, if you are reconstructing the flights using a time field
which has the time for each data point, assign the time field to the Fiducial alias.
See Specifying input and output files for details.
2
Choose Tie_Line_Levelling from the Levelling menu in the Project Manager or
use the command newlevel.exe. INTREPID displays the Levelling window.
3
Specify the Signal field of the line dataset whose values you wish to level. Use
Specify Input from the File menu. See Specifying input and output files for
detailed instructions.
4
Specify field names for your corrected data (or corrections) using Specify Output
from the File menu. INTREPID displays Save dialog boxes for X Y and Signal in
turn. See Specifying input and output files for detailed instructions.
5
If required, sort the data into chronological order (INTREPID sorts its working
copy of the data– not the dataset itself). Choose Reconstruct Flights from the File
menu, and select either Date/time, Julian Day or Fiducials as a basis for the
sorting. See Chronological order—reconstructing the flights for detailed
instructions.
6
If required, obtain the Crossover data—the data points where there is both an
acquisition line and a tie line reading for the same location. To calculate the
crossovers use Find Crossovers at the bottom right of the Levelling window. To
load an existing crossovers dataset, use Load Crossovers from the file menu.
INTREPID displays the crossover data graphically. See Calculating crossovers
and Creating and Using Crossovers Datasets for detailed instructions.
7
Disable crossovers you wish exclude from the levelling process, if any. See
Excluding crossovers from the levelling calculation for instructions.
1. This summary assumes that you are performing an entire typical levelling process in
one session. You can save intermediate data and continue work in a different session or
repeat stages of the process as required. You can vary many of the steps described here.
See the following sections of the manual for more detail.
Library | Help | Top
© 2012 Intrepid Geophysics
| Back |
INTREPID User Manual
Library | Help | Top
8
Line correction and tie levelling (T30)
5
| Back |
Specify the corrections you require. Use the options in the Corrections menu,
entering any parameters required in the dialog boxes that INTREPID displays.
See INTREPID Levelling corrections and the sections following it for detailed
instructions.
Some corrections require preliminary operations before you select their option
from the Corrections menu:
•
If you are performing Diurnal corrections you must load the base station dataset
before specifying the correction. See Diurnal corrections for instructions.
•
If you are using Polynomial levelling, you will need to select the principal tie line
and specify the levelling order for the other tie lines. (See Polynomial levelling for
instructions.)
9
Viewing the data. You can:
•
Choose between Markers and Colours for your data display using the options in
the Style menu. (See Display style—markers vs colours for detailed instructions.)
•
Use the Zoom In, Zoom Out buttons and the Pan/zoom location indicator to adjust
the magnification and position of the display. (See Panning and Zooming the
display for detailed instructions.)
•
View crossover data graphically in the dataset display area. Use the options in
the Display menu to choose the display you require. See Crossover and line
display options for detailed instructions.
•
View a profile graph along a single tie line. See Displaying profiles along
individual tie lines for detailed instructions.
•
View a profile graph of base station data for a flight or day. See Flight/Cruise or
Day profile graphs for details.
•
View values for individual crossovers. See Examining individual crossovers for
instructions.
10 Saving crossovers: You can save the current crossovers and proposed corrections
at any stage after obtaining the crossover data for the session. See Proposed
corrections and crossovers datasets and Creating and Using Crossovers Datasets
for instructions.
11 When you are satisfied that the corrections are as you require and if you wish to
carry out the corrections, choose Apply Corrections near the bottom right corner of
the Levelling window. INTREPID will apply the corrections to the whole set of
data. See Applying the corrections to the whole dataset for instructions and
options.
12 If you wish to record the specifications for this process in a .job file in order to
perform a similar Levelling task in batch mode, use Save Options from the File
menu. (See Specifying input and output files for detailed instructions.)
13 If you have corrections to make to another dataset, repeat steps 3–12 for the
another dataset.
14 Exit from Levelling by choosing Quit from the File menu.
___
Library | Help | Top
© 2012 Intrepid Geophysics
| Back |
INTREPID User Manual
Library | Help | Top
Line correction and tie levelling (T30)
6
| Back |
You can view Help information by choosing options from the Help menu (See Help).
You can execute Levelling in batch mode using a task specification (.job) file that
you have previously prepared. See Displaying options and using task specification
files for details.
Preliminary processes
The following table lists the corrections available in this tool and the preliminary
processes required before you can perform them.
Reconstruct
flights
Specify base
station data
Calculate
crossovers
Diurnal
yes
yes
GRF
yes
Level XY
yes
yes
Polynomial
yes
yes
Loop closure
yes
yes
Specify tie
line list
Parallax
Heading
yes
Suggested Levelling regimes
The Levelling tool can perform a number of levelling functions in the same session. It
will be appropriate in some circumstances for you to complete your levelling
operations over several Levelling sessions.
We recommend that after performing a correction on a dataset you exit from
Levelling and launch it again for the next task.
The following regimes are a pair of extremes. Generally speaking, apart from the
Parallax correction, which you should always perform first, you can combine
corrections or perform them separately as required.
New datasets
If you are processing fresh data, you will most likely wish to grid the results of each
step and examine them before proceeding to the next. We recommend the following
Levelling sessions for an unfamiliar dataset. Repeat each step until the results are
the best possible. Note the parameters that you used to produce this result.
Library | Help | Top
1
Perform Diurnal and GRF corrections, then grid and examine the results. These
corrections may be performed together.
2
Perform Parallax corrections, then grid and examine the results.
3
Perform Heading or Level XY or Polynomial or Loop Closure corrections as
required, then grid and examine the results.
© 2012 Intrepid Geophysics
| Back |
INTREPID User Manual
Library | Help | Top
Line correction and tie levelling (T30)
7
| Back |
Datasets for which you have established required correction parameters
If you are reprocessing a dataset and know the correction parameters you require,
you can perform most of them in the same session. You must perform the Parallax
correction separately. We recommend the following levelling sessions.
1
Perform Parallax corrections.
2
Perform all other corrections.
Components of the Levelling window
The menu bar has pulldown menus that enable you to operate the Levelling
application
The dataset display area occupies most of the window. This area shows the data
you are processing and has Latitude and Longitude as its axes.
The individual crossover display area enables you to
•
View values for individual crossovers,
•
Disable and enable individual crossovers,
The Pan/zoom indicator and Zoom buttons enable you enlarge and reduce
(zoom) the display and select different parts of it for viewing (pan)
The status line at the bottom left of the Levelling window shows information about
the current files and activity.
The calculations command buttons enable you to find the crossovers and apply
the corrections to the data.
Specifying input and output files
To perform Levelling you will need to specify the Signal field of the line dataset to be
levelled, as well as the location fields, the fiducial field and the flight number field. If
you are reconstructing the flights using flight dates and times, you must also specify
a flight date field and, optionally, a time field.
The levelling process will produce corrected data (or corrections) in the form of a
corrected Signal field and/or corrected X and Y fields. You will need to specify names
for these fields.
You may also need to specify a base station dataset for diurnal data.
You can save the crossover point data for examining using other INTREPID tools,
then load it for use during a subsequent levelling session.
Most file operations are listed in the File menu.
Library | Help | Top
© 2012 Intrepid Geophysics
| Back |
INTREPID User Manual
Library | Help | Top
Library | Help | Top
Line correction and tie levelling (T30)
8
| Back |
© 2012 Intrepid Geophysics
| Back |
INTREPID User Manual
Library | Help | Top
Line correction and tie levelling (T30)
9
| Back |
In each case INTREPID displays an Open or Save As dialog box. Use the directory
and file selector to locate the file you require. (See "Specifying input and output files"
in Introduction to INTREPID (R02) for information about specifying files).
INTREPID can obtain information from the dataset aliases. It can use the following
aliases to identify appropriate field files:
Alias
Field
X
X coordinate (location)
Y
Y coordinate (location)
Line Type
Line type
Line Number
Line number
Fiducial
Fiducial count
Flightnumber
Flight number
Clearance
Sensor heighta
a. This alias normally refers to the distance from the sensor to the ground. In
Levelling, the field is only used for the GRF correction, and may therefore be any
sensor height measure. See The geomagnetic reference field in INTREPID (R15)
for details.
If your survey has a time field containing the time for each data point and you wish to
reconstructing flights using this field, you must assign the time field to the Fiducial
alias. See Chronological order—reconstructing the flights for details of this process.
If there is no flight number field in the dataset you can still perform all levelling
corrections except for 'Levelling the flights assuming that the tie lines are correct' in
Polynomial levelling. You should omit this process if you are performing the
Polynomial levelling correction. See The Polynomial 'drift estimation' levelling
method and Selecting polynomial levelling process stages for instructions.
See "Vector dataset field aliases" in INTREPID database, file and data structures
(R05) for more information about aliases.
File menu options
Specify Input Choose Specify Input from the File menu.
INTREPID displays the Load Signal dialog box. Locate the correct dataset
directory if necessary. Specify the name of the Signal values field to be levelled
and choose Open.
If you have not assigned aliases, or if some aliases are missing, INTREPID will
also prompt you to specify the fields missing (See the list above)1.
1. If your Fiducial field is missing you can create a 'fake' fiducial field for the data using
the Spreadsheet tool. Create a new field called FID and generate a unique fiducial
number for each point in the dataset. See "Frequently asked questions" in Spreadsheet
Editor (T15)..
Library | Help | Top
© 2012 Intrepid Geophysics
| Back |
INTREPID User Manual
Library | Help | Top
Line correction and tie levelling (T30)
10
| Back |
Specify Output Because some of the corrections involve changes to the location
data, you will need to save new sets of X and Y values as well as Signal values.
You can save output corrected values to the output X, Y and Signal fields, or
output the corrections themselves. To output corrections, turn on Output
Changes Only in the Levelling window. To output corrected values, ensure that
the check box is turned off.
Choose Specify Output from the File menu. INTREPID displays Save dialog
boxes for X, Y and Signal in turn. For each, specify the name of the new file (or
the old one if you wish to overwrite it).
Load Crossovers If you have previously saved a crossovers dataset for the current
levelling task, use this to load the crossovers dataset into the Levelling tool. See
Creating and Using Crossovers Datasets for details.
Save Crossovers After you have calculated the crossover data, use this to save a
crossovers dataset. See Creating and Using Crossovers Datasets for details.
Specify Basestation If you are performing diurnal corrections, use this to specify
the base station dataset. See Diurnal corrections for instructions.
Save Options If you wish to save the current Levelling file specifications and
parameter settings as an task specification file, use this option to specify the
filename and save the file. You can only use Levelling task specification files in
batch mode. See Displaying options and using task specification files for more
information.
Note: The current version of INTREPID cannot load task specification files for
interactive use. You can load previously specified operations to some extent using
crossovers datasets, but these operate differently from task specification files. See
Creating and Using Crossovers Datasets for information about crossovers
datasets.
Reconstruct Flights When you reconstruct the flights using a flight date and
possibly a flight time field, you need to specify the fields containing the flight
dates and (optionally) the flight times. See Chronological order—reconstructing
the flights for instructions.
Editing aliases
You can edit the aliases for any dataset. This process is independent of any currently
loaded dataset, so you can use it before or after specifying the Signal field to be
levelled
>> To edit the aliases for a dataset
Choose Edit Dataset Aliases from the File menu. See "Vector dataset field aliases" in
INTREPID database, file and data structures (R05) for further instructions.
File operations not listed in the File menu
Library | Help | Top
•
When you reconstruct the flights, INTREPID automatically saves a flight
reconstruction report. See The flight report file for details.
•
When you calculate the crossovers, INTREPID automatically saves a crossovers
report. See The crossover report file for details.
•
You can save and load tie line lists which define the principal and subsequent tie
lines for polynomial levelling. See Choosing the principal tie line and the tie line
order for details.
© 2012 Intrepid Geophysics
| Back |
INTREPID User Manual
Library | Help | Top
Line correction and tie levelling (T30)
11
| Back |
Data display with the Levelling tool
The Levelling tool provides a wide variety of options for displaying your data so that
you can examine it.
•
You can view numerical information about individual crossover points in the
Individual crossover Display Area. See Examining individual crossovers for
details.
•
You can view a variety of crossover point information graphically in the Dataset
Display Area. See Display style—markers vs colours and Crossover and line
display options for details.
•
You can enlarge, reduce and view different parts of the data in the Dataset
Display Area. See Panning and Zooming the display.
•
You can view profile graphs in separate windows of
•
Diurnal data for a flight or a day. See Flight/Cruise or Day profile graphs for
details.
•
Tie line data. See Displaying profiles along individual tie lines for details.
•
During the polynomial levelling process INTREPID displays profile graphs of the
polynomial curves with the errors to be adjusted marked as points in the profile.
See Polynomial levelling for details.
•
You can save a crossovers dataset and view it in an INTREPID visualisation tool
or the Spreadsheet tool. See Creating and Using Crossovers Datasets for details.
Panning and Zooming the display
You can enlarge and reduce the display (zoom in and out) and view different parts of
it (pan).
>> To zoom in and out (enlarge/reduce)
To zoom in (enlarge the display) choose Zoom In at the right edge of the Levelling
window. Each time you choose this button, INTREPID will enlarge the display by
one step.
To zoom out (reduce the display) choose Zoom Out at the right edge of the Levelling
window. Each time you choose this button, INTREPID will reduce the display by one
step.
Library | Help | Top
© 2012 Intrepid Geophysics
| Back |
INTREPID User Manual
Library | Help | Top
Line correction and tie levelling (T30)
12
| Back |
>> To pan the display (view different parts)
The Pan/zoom indicator near the bottom right corner of the Levelling window consists
of a small square within a larger square. The large square represents the whole
display and the small square the part visible on the screen. When you drag the small
square to a different part of the large square INTREPID shows the corresponding
part of the display.
If you have zoomed out to view the whole display, the small square may occupy the
whole of the large square and may therefore not be visible.
Chronological order—reconstructing the flights
You must reconstruct the flights if you wish to perform any of the following
operations,
•
Make diurnal or GRF corrections for changes in the background signal (See
Diurnal corrections and GRF—Subtracting the Earth's core magnetic field),
•
Make crossover-based corrections (See Level XY corrections—inferring the correct
location, Polynomial levelling and Loop closure levelling),
•
View graphs of data along individual flights (See Displaying profiles along
individual tie lines).
Reconstructing the flights will internally sort the data into chronological order.
If INTREPID only has available the flight numbers and fiducials, it will simply sort
the data in order of flights, then the traverse lines of each flight in order of first
fiducial value.
If you supply a flight date field and (optionally) a time field, INTREPID will be able to
sort the data using these fields.
You must supply flight date and time if you wish to apply GRF and / or diurnal
corrections with maximum accuracy (See GRF—Subtracting the Earth's core
magnetic field) and
Flight reconstruction involves choosing one of the options from the Reconstruct
Flights cascade in the File menu.
The procedures for flight reconstruction differ slightly depending on the option you
choose, as described in the following sections.
Library | Help | Top
© 2012 Intrepid Geophysics
| Back |
INTREPID User Manual
Library | Help | Top
Line correction and tie levelling (T30)
13
| Back |
Flight reconstruction using flight date and time
If your survey data includes the date of each flight, you can reconstruct the flight on a
time basis.
If your survey has a TimeOfDay alias field with the time of each reading,
INTREPID can use this for reconstructing the flights.
If the survey has a TimeOfDay alias field which gives only the starting time of each
flight, INTREPID can use it in conjunction with the Fiducial alias field to determine
the time for each reading.
If the survey has no TimeOfDay alias field, INTREPID will calculate the time of
each reading from the Fiducial alias field. It assumes that fiducial 0 is midnight at
the start of the flight date.
Date record and formats
The date must be recorded in integer (4 byte) field of the survey dataset. INTREPID
will only examine the first date for each line, so we recommend that the date field be
a 'group by' field.
The date can be expressed as
Julian date A positive integer representing the number of days since the beginning
of a 'datum year' (A day you regard as a start date for your surveys). In practice,
as long as your data is internally consistent, the value of the start date does not
matter. If you are using other software with your data, for example, importing it
into a general purpose spreadsheet such as Microsoft Excel, you may wish to use a
start date consistent with the general purpose software you intend to use. (In
Microsoft Excel a date whose integer part is 1 represents 1 January 1900.)
yymmdd format A positive integer which will represent a date in yymmdd format
when it is expressed in base 10 using 6 digits. For example, the number 970223
represents the date 23 February 1997.
ddmmyy format A positive integer which will represent a date in ddmmyy format
when it is expressed in base 10 using 6 digits. For example, the number 050293
represents the date 5 February 1993.
Time record and format
If your dataset includes a time field containing a time for each reading, you can use
the time field for reconstructing the flights. In this case you must assign the time
field to the Fiducial alias before commencing the Levelling session. See Specifying
input and output files for details.
If your dataset includes a time field that specifies the start time for each flight (or
each line), you can use it and the Fiducial field to calculate the time for each reading
In this case it would be appropriate for the time field to be a 'group by' field. We can
call it a start time field.
If your dataset has no time field, then INTREPID assumes that fiducial 0 is midnight
sat the start of the flight date.
The time must be expressed in number of seconds since midnight at the beginning of
the flight date. For example, 6:30 am will be 23400 ( = 60 x 60 x 62 ).
Library | Help | Top
© 2012 Intrepid Geophysics
| Back |
INTREPID User Manual
Library | Help | Top
Line correction and tie levelling (T30)
14
| Back |
Using Fiducial numbers to calculate time
INTREPID will calculate and record internally a time for each data point. For each
data point it converts the fiducial count into seconds using the Fiducial factor then
adds the value of the start time field if specified, to give the time for the data point
since midnight at the start of the flight date.
Fiducial factor This parameter is the sampling interval of the dataset being
levelled. For example, a fiducial factor of 0.1 indicates 10 fiducial counts per
second. If you have specified a time field expressed in seconds by assigning it to
the Fiducial alias, you should set the Fiducial factor to 1.
Reconstructing the flights
>> To reconstruct the flights
1
Ensure that you have assigned the time field to the Fiducial alias if required,
commenced the Levelling session and specified the input Signal field to be
levelled.
2
Choose Date / Time / Fiducial or Julian Day / Time / Fiducial from the Reconstruct
Flights cascade in the File menu.
INTREPID will prompt you to specify the date or the Julian day field, depending
on the option you chose from the Reconstruct Flights cascade.
3
Specify the flight date field.
4
INTREPID will prompt you for the flight start time field.
If you assigned the time field to the Fiducial alias, do not specify the same
field as the start time field here.
If a flight start time field exists, specify it here, other wise choose Cancel.
5
If you specified Date / Time / Fiducial, INTREPID displays the Fid Factor and
Date Format dialog box.
If you specified Julian Day / Time / Fiducial, INTREPID displays the Fid Factor
dialog box.
Enter the fiducial factor. (This would normally be 1 if you assigned the time field
to the Fiducial alias).
Library | Help | Top
6
Specify the date format if required.
7
Choose OK. INTREPID will reconstruct the flights.
© 2012 Intrepid Geophysics
| Back |
INTREPID User Manual
Library | Help | Top
Line correction and tie levelling (T30)
15
| Back |
Flight reconstruction where flight date and time are not available
If you do not have dates and times available for the dataset being levelled, you can
reconstruct the flights using flight number and fiducial numbers only. In this case,
INTREPID simply sorts the data into order of flight number, then fiducial order
within each flight.
>> To chronologically sort the data (using fiducials only)
Choose Flight / Fiducial from Reconstruct flights cascade in the File menu.
If there is no field specified for the Flightnumber alias, INTREPID will prompt you
for the Flight number field.
If there is no flight number data in the dataset, you can use the line number instead.
Without flight numbers you can still perform all levelling corrections except for
'Levelling the flights assuming that the tie lines are correct' in Polynomial levelling.
You should omit this process if you are performing the Polynomial levelling
correction. See The Polynomial 'drift estimation' levelling method and Selecting
polynomial levelling process stages for instructions.
INTREPID will reconstruct the flights.
Internal calculated date and time
INTREPID calculates a date for each line and a time for each data point. It expresses
these values in Julian format, with date as a whole number and time as a number
between 0 and 1 (a fraction of the day. You can see this data in the flight report file
(See The flight report file.
The flight report file
INTREPID produces a flight report file flight.rpt in the dataset directory. You
can examine this file in detail to confirm that the flight reconstruction was correct.
The flight report is an ASCII file which you can print or read/edit with any text
editor. It consists of a set of tables—one for each flight. Tables have one column for
each traverse line and six rows of data—Line Number, Line Type, original position of
the line in the dataset ('Rows'), starting Fiducial number, Julian day, Relative Julian
time since the start of the flight.
Relative Julian time is a number representing the time since the start of the flight.
Its fractional part represents a fraction of 24 hours. For example, if the flight
commenced a midnight, 0.3 represents 7:12 am (0.3 x 24 = 7.2 = 7 h 12 min).
Library | Help | Top
© 2012 Intrepid Geophysics
| Back |
INTREPID User Manual
Library | Help | Top
Line correction and tie levelling (T30)
16
| Back |
Here is part of a sample flight report file:
FLIGHTREPORT
for raw_mag
New Flight 1
Lines 2862 2771 2851 2842 2742 2811 ...
Type Line Line Line Line Line Line ...
Rows 13
4
12
11
1
8
...
Start Fids 255680273594284398304852367252375802...
End Fids257464275376286200306458368900377556...
Julians2448166 2448166
2448166
2448166
2448166
Relative Julians0.29590.31670.32920.35280.42510.435...
2448166
...
New Flight 2
Lines 2942 2992 2931 2921 7111 2982 3032 ...
Type Line Line Line Line Tie Line Line ...
Rows 21
27
20
19
33
26
32
...
Start Fids 309612329380336802352908497346507152507376...
End Fids311732335183351821365604499188509146508820...
Julians2448166 2448166
2448166
2448166
2448166
2448166
2448166...
Relative Julians0.35830.38120.38980.40850.57560.5870.5872...
Total Numberof
Flights:
2
If you do not specify a date field, INTREPID omits the Julian date/time rows of the
table.
Calculating crossovers
INTREPID can extract a sample from your dataset containing all of the data points
where acquisition and tie lines cross (crossovers). You can use this sample to prepare
and test corrections before applying them to the whole dataset. (If there are no
crossovers, several of the levelling methods cannot be used) The sample is called the
crossovers.
The advantages of using the crossovers in this way are as follows:
•
The set of crossovers is the focus for several of the Levelling tool corrections.
•
Line datasets can be large and slow to process. If you are testing possible
corrections, it will save time to use a sample of the data for testing.
•
You can save the crossover values as a small sample dataset for easy examination
using other tools.
How INTREPID calculates the crossovers
Crossover points and values
INTREPID calculates the crossover values in the following way:
When viewed from above the points at which tie lines and acquisition lines intersect
are called crossover points.
INTREPID infers the crossover values in the tie line and the acquisition line at this
point by finding an average of the points on either side of the crossover point.
INTREPID weights the contributions of the points to the average according to the
distance of the points from the crossover point. The misclosure at a crossover point
is the original difference between the acquisition line crossover value and the tie line
Library | Help | Top
© 2012 Intrepid Geophysics
| Back |
INTREPID User Manual
Library | Help | Top
Line correction and tie levelling (T30)
17
| Back |
crossover value. The BETA at a crossover point is the current difference between the
acquisition line value and the tie line value. These concepts also apply to tensor/
vector readings.
Crossover gradients
INTREPID calculates the crossover gradient with respect to fiducial data in a line at
the crossover points. It uses the Signal data values on either side of the crossover
points to calculate ΔSignal.
INTREPID calculates the crossover gradients with respect to the fiducials for
convenience. Since the aircraft is likely to be travelling at a constant speed, these
gradients are also an accurate estimate of the gradients with respect to distance, and
INTREPID uses them as such.
If the gradient at the crossover is high, you may need to pay special attention to it
during some corrections. To ensure that it locates a high gradient if it exists at a
crossover, INTREPID can search for the highest gradient in the region of the
crossover and record that as the gradient at the crossover. See step 3 in Section
Calculating the crossovers for instructions.
Crossover report
INTREPID writes a crossover report to a file in the dataset directory (See The
crossover report file for more details).
Calculating the crossovers
>> To calculate the crossovers
1
Choose Find Crossovers at the bottom right of the Levelling window. INTREPID
will specify the Signal Field Pre-Process dialog box. This adapts for scalar/tensor
signals.
2
Select the process you require from the Signal Field Pre-Process options. The
default process is None.
If you have selected Convolve (Fuller), specify the size of the convolution window
in data points, using the Window Size (data points) text box. See "Fuller filter" in
INTREPID spatial and time domain filters and transformations (R13) for further
information.
If you have chosen the Naudy filter, specify
Library | Help | Top
•
The filter wavelength (in data points) using the Window Size (data points) text
box,.
•
The filter tolerance (in Signal units) using the Tolerance text box,
© 2012 Intrepid Geophysics
| Back |
INTREPID User Manual
Library | Help | Top
Line correction and tie levelling (T30)
18
| Back |
See "Naudy filter" in INTREPID spatial and time domain filters and
transformations (R13)for further information.
Library | Help | Top
© 2012 Intrepid Geophysics
| Back |
INTREPID User Manual
Library | Help | Top
Line correction and tie levelling (T30)
19
| Back |
3
Choose OK. INTREPID displays the Search Radius for Gradient dialog box.
4
If you require INTREPID to search the neighbourhood of each crossover point for
the highest gradient to record as the crossover gradient, select Use and specify the
radius (in metres) around the crossover point for selection of the maximum
gradient.
If you wish INTREPID to always record the gradient precisely at the crossover
point as the crossover gradient, select Ignore.
See Crossover gradients for further explanation.
5
Choose OK. INTREPID will calculate and display the crossovers, and write the
crossover report file.
You can save the crossovers if you wish to use them in a later session without
recalculating them. See Creating and Using Crossovers Datasets for instructions.
The crossover report file
INTREPID writes a crossover report to the .rpt file crossover.rpt in the dataset
directory. This is an ASCII file which you can print or read/edit with any text editor.
It consists of a matrix with one acquisition line per row and one tie line per column.
Each cell in the matrix therefore represents a potential intersection point.
INTREPID represents the potential intersection points as follows:
Type of intersection
Notation
Crossover data calculated
OK
Crossover not found but minimum bounding rectangles of
acquisition and tie lines overlap (e.g., one line may stop short of the
other but its end still lie close to the other line).
tie line number followed by R
Crossover not found and minimum bounding rectangles of
acquisition and tie lines do not overlap.
tie line number
Library | Help | Top
© 2012 Intrepid Geophysics
| Back |
INTREPID User Manual
Library | Help | Top
Line correction and tie levelling (T30)
20
| Back |
Here is an example of a crossover report file.
CROSSOVER
CROSSOVER
CROSSOVER
OTHERS BY
REPORT for raw_mag
GRID CONTAINS 33 LINES AND 3 TIES
REPORT - CROSSOVERS NOT FOUND INDICATED BY TIE NUMBER,
OK
LINE
STATUS OF TIES
2731
2742
2751
2761
2771
2781
...
3001
3012
3013
3021
3032
OK
OK 7122
OK
OK 7122
OK
OK 7122
OK
OK 7122R
OK 7121
OK
OK 7121
OK
OK
7111
OK
OK
7111
7121
7121
7121
7121
7121
OK
OK
OK
OK
OK
Total number of Crossovers : 63
Crossovers datasets
You can save the crossovers for examination or further testing in a later levelling
session. See Creating and Using Crossovers Datasets for full instructions.
Examining individual crossovers
At the right of the Levelling window is the individual crossover display area. You
can use the display areas and text boxes to
•
View values for individual crossovers,
•
Enable or disable individual crossovers
>> To view data for an individual crossover
Select the crossover you wish to view by clicking it in the dataset display area.
Library | Help | Top
© 2012 Intrepid Geophysics
| Back |
INTREPID User Manual
Library | Help | Top
Line correction and tie levelling (T30)
21
| Back |
Data displayed for each crossover
INTREPID displays the following information about the current crossover:
For the current acquisition line:
•
Acquisition Line number
•
Acquisition Line Flight/cruise number
•
Acquisition Line Crossover fiducial
•
Acquisition Line Crossover value
•
Acquisition Line Crossover gradient
For the current tie line:
•
Tie Line number
•
Tie Line Flight/cruise number
•
Tie Line Crossover fiducial
•
Tie Line Crossover value
•
Tie Line Crossover gradient
For the current crossover:
•
Misclosure
•
Beta misclosure (See Proposed corrections and the beta misclosure for a
definition)
•
Longitude (East)
•
Latitude (North)
•
Use crossover check box
•
(On if crossover enabled for levelling)
•
(Off if crossover disabled for levelling)
For the whole dataset:
•
Number of acquisition lines
•
Number of tie lines
•
Number of flights
•
Number of crossovers
•
Cumulative length of all traverses
Output Changes Only:
This check box controls whether the output X, Y and Signal fields contain corrected
values or the values of the corrections. It is not part of the individual crossover
display. See Applying the corrections to the whole dataset for further details.
Library | Help | Top
© 2012 Intrepid Geophysics
| Back |
INTREPID User Manual
Library | Help | Top
Line correction and tie levelling (T30)
22
| Back |
Excluding crossovers from the levelling calculation
For crossover-based corrections (Level XY, Polynomial and Loop Closure) you may
wish to exclude some crossovers from the process. You can do this using a condition
(logical expression) or by turning crossovers on and off individually.
Crossovers that are turned on (to be included in the corrections) are enabled.
Crossovers that are turned off (not to be included in the corrections) are disabled.
The Use Xover check box indicates whether the current crossover is enabled for the
levelling process. If it is on, the crossover is enabled. If it is off the crossover is
disabled. INTREPID still displays excluded crossovers in the dataset display area.
Disabling and enabling individual crossovers
>> To disable a crossover
1
Select the crossover you wish to view by clicking it in the dataset display area
with the left mouse button.
2
Turn off the Use Xover check box.
>> To enable a crossover
1
Select the crossover you wish to view by clicking it in the dataset display area
with the left mouse button.
2
Turn on the Use Xover check box.
Disabling crossovers using a condition
You can disable crossovers using a condition in the form of a logical expression. The
expression must use standard INTREPID expressions notation and can involve any
crossovers dataset field name. See Creating and Using Crossovers Datasets for
further details about crossovers datasets.
You must save a crossovers dataset in order to use the condition expression.
In the Disable Crossover Points dialog box (see below) INTREPID lists the names of
the crossovers dataset fields.
Notes
•
The crossovers for which the expression is true will be disabled.
•
If you use the crossover gradient in the expression, use the field LGRAD (e.g.,
ABS(LGRAD)>10). There are records for each line in the dataset, so, in fact, each
crossover is represented twice in the crossovers dataset—once from the viewpoint
of the acquisition line and once from the viewpoint of the tie line. The condition
will therefore be applied twice for each crossover. If you specifically wish to apply
the condition to acquisition lines or tie lines only, include a reference to line type
in the expression (e.g., ... && LTYPE == 2 will exclude all lines except
acquisition lines).
See INTREPID expressions and functions (R12) for full information about
expressions.
Library | Help | Top
© 2012 Intrepid Geophysics
| Back |
INTREPID User Manual
Library | Help | Top
Line correction and tie levelling (T30)
23
| Back |
>> To disable crossovers using a condition
1
Choose Disable from the Crossover menu.
INTREPID displays the Disable Crossover Points dialog box containing a list of the
crossovers datasets fields and a text box for the logical expression.
2
Enter the logical expression into the text box, then choose OK. INTREPID will
disable the crossovers for which the condition is true.
Enabling all crossovers
>> To enable all crossovers
Choose Re-enable All from the Crossover menu. INTREPID will enable all
crossovers.
INTREPID Levelling corrections
There are two types of Levelling correction: crossover-based and immediate.
INTREPID records proposed corrections for both types, but only uses them with
crossover-based corrections. INTREPID keeps a 'running total' of the corrections you
specify as 'beta misclosures'. The following sections contains an explanation of these
terms.
Proposed corrections and the beta misclosure
A correction calculated for a crossover is a proposed correction.
INTREPID records proposed corrections for each correction method.
It keeps a 'running total' of proposed corrections in the beta misclosure.
A beta misclosure is constructed as a proposed alternative misclosure for the
crossover. Therefore a 'blank' beta misclosure is equal in value to the original
misclosure for the crossover.
Library | Help | Top
© 2012 Intrepid Geophysics
| Back |
INTREPID User Manual
Library | Help | Top
Line correction and tie levelling (T30)
24
| Back |
Correction types
Immediate corrections
Immediate corrections involve applying a correction directly to all data. These
correction do not require crossovers.
The immediate corrections are
•
Heading
•
Parallax
•
Diurnal
•
GRF
When you specify an immediate correction, INTREPID calculates and records the
correction for each crossover, and adds the correction to the beta misclosure for the
crossover. The proposed corrections are for your information only. INTREPID does
not use them when applying the corrections.
Crossover-based corrections
Crossover-based corrections involve first calculating corrections for the crossovers,
then interpolating them between the crossovers for the rest of the dataset.
The crossover-based corrections are
•
Level XY,
•
Polynomial levelling
•
Loop closure
•
Single gradient ( alpha only, mainly for Rio)
•
Tensor corrections
When you specify a crossover-based correction, INTREPID calculates and records a
proposed correction for each crossover, and adds the proposed correction to the beta
misclosures for the crossovers.
Proposed corrections and crossovers datasets
Crossovers datasets contain sets of proposed corrections. When you load a crossovers
dataset, INTREPID will prompt you to specify which (if any) of its proposed
corrections to retrieve.
If you retrieve a crossover-based proposed correction it becomes the current proposed
correction for its correction type.
If you do not retrieve a crossover-based proposed correction, the corresponding
correction type will have no current proposed correction.
Immediate proposed corrections are for information only in the crossovers dataset
and have no effect on any immediate correction operation in this tool.
See Creating and Using Crossovers Datasets for further information about crossovers
datasets.
When you choose Apply Corrections INTREPID uses the current proposed correction
for each crossover-based correction type.
Library | Help | Top
© 2012 Intrepid Geophysics
| Back |
INTREPID User Manual
Library | Help | Top
Line correction and tie levelling (T30)
25
| Back |
Clearing beta misclosures
The beta misclosure is a running total of the current proposed corrections.
INTREPID does not use it in the correction process.
You can clear (i.e., set back to equal the original misclosure) beta misclosures from
the dataset if you wish.
If you clear the beta misclosures, you will no longer have a running tally of the
corrections made in the current session.
Clearing the beta misclosures has no effect on any proposed corrections or immediate
correction specifications.
>> To clear the beta misclosures
Choose Clear betas from the Crossovers menu.
Levelling corrections—brief descriptions
INTREPID provides seven types of levelling correction for your data. You can see a
list of them in the Corrections menu
Headings corrections (Immediate) Corrects errors due to aircraft or ship direction.
Parallax corrections (Immediate) Corrects errors in location of readings arising
from the horizontal distance separating the acquisition instrument and the
navigation instrument.
Diurnal corrections (Immediate) Corrects for diurnal variation in the background
signal that occur over time and confound the readings. INTREPID compares the
flight data with data collected at a base station during the same time interval.
GRF corrections (Immediate) Subtracts the intensity of the Earth's core magnetic
field.
Level XY corrections (Crossover-based) Infers the correct location of a crossover
point by extrapolating a line at the crossover point and seeking a point of
intersection.
Polynomial levelling (Crossover-based) Levels the dataset by fitting the data to a
curve along the tie lines, then along the flights and finally along each acquisition
line.
Library | Help | Top
© 2012 Intrepid Geophysics
| Back |
INTREPID User Manual
Library | Help | Top
Line correction and tie levelling (T30)
26
| Back |
Loop closure corrections (Crossover-based) Finds an optimum correction for each
crossover using an iterative procedure.
Single Gradient corrections (alpha only and also Cross-over-based) Finds 3D
Truncated Fourier series methods to attempt to recover the tensor from one of its
parts. The VKc is Tzz - Tyy.
Tensor corrections (Crossover-based) Leads into a new space for a arnge of
innovative tensor only methods to assist in levelling this data signal type.
Heading corrections—for errors due to aircraft direction
Due to a combination of the Earth's magnetic field and the permanent magnetisation
of the sensing craft, measurements may slightly differ depending on the direction of
travel. Compensation for scalar measurments have been turned into a “black-box”
process over the years. This does not work for highjer order gradient measures, and a
whole new invention of techniques is required to correct for Roll, Pitch and Yaw
errors in the coming years.
Traditionally for a TMI scalar signal, after aircraft compensation, you can specify
correction adjustments for four directions and add an adjustment to each data point
according to the line direction. INTREPID calculates the correction for each direction
using a smooth curve from 0°–360° passing through the correction parameters you
have specified for the four directions. If you do not know how to estimate the Heading
errors in this context, INTREPID
The Heading correction alters the Signal values of the data. INTREPID
>> To specify the Heading correction,
1
Choose Headings from the Corrections menu. INTREPID displays the Headings
corrections dialog box.
2
Enter four directions and the adjustment for each direction using the format d/a
d/a d/a d/a where d is the direction in degrees from North, a is the adjustment
in nanoTeslas (nT). For example
0.0/2.0
3
90.0/3.0
180.0/0.0
270/–2.0
Choose OK. INTREPID will note the corrections and apply them when you choose
Apply Corrections.
Gradient Extensions
As it is difficult to see how you can specify a tensor heading correction in a simple
manner, along the lines of a pop-up dialog box, INTREPID instead relies on the
automatic estimation from statistics approach, for a Heading correction for a tensor /
vector signal.
It is proposed that a Heading correction is in fact a compromised concept, and a Full
Rotational levelling correction is the proper way to think of this class of systematic
Library | Help | Top
© 2012 Intrepid Geophysics
| Back |
INTREPID User Manual
Library | Help | Top
Line correction and tie levelling (T30)
27
| Back |
error.
Parallax corrections—cable length
Acquisition instruments are usually in a different position to the navigation
instrument. Parallax corrections involve a slight adjustment to the location of the
data to allow for this positional effect.
INTREPID will adjust all points to have a different location. It bases the new
location on
•
The reported geographic location (X and Y),
•
The direction of travel,
•
The separation of the instruments.
The Parallax correction alters the X and Y values of the data.
>> To specify Parallax corrections
1
Choose Parallax from the Corrections menu. INTREPID displays the Parallax
corrections dialog box.
2
Enter the separation (in metres) into the Cable length text box.
3
Choose OK. INTREPID will note the corrections and apply them when you choose
Apply Corrections.
Diurnal corrections
The background radiation or magnetism may fluctuate during surveys. These are
called diurnal fluctuations, because they vary over a 24 hour period with some
regularity. Some are attributable to sun spots. These fluctuations can occur during
the course of a flight and so can confound your data.
To correct for this you can take readings from a nearby, stationary base station
during the flight, synchronised by the fiducial clock. These readings will show only
the diurnal fluctuations. If you subtract the base station readings from the flight
data, you will remove the background errors.
The Diurnal correction alters the Signal values of the data. It requires a separate
line dataset containing the base station data.
Base station—Survey data synchronisation methods
Before applying diurnal corrections INTREPID must be able to synchronise the
dataset to be levelled with the base station dataset, matching the survey data with
the correct base station data.
INTREPID provides synchronisation methods corresponding to your flight
reconstruction method: Date / Time, Julian Day / Time and Flight / Fiducial
Library | Help | Top
© 2012 Intrepid Geophysics
| Back |
INTREPID User Manual
Library | Help | Top
Line correction and tie levelling (T30)
28
| Back |
matching. See Chronological order—reconstructing the flights for details of this
process.
Date / time synchronisation
If you reconstructed the flights using Date and time data, and the base station
dataset has matching Date and time data, then you can use this data to synchronise
the datasets.
Julian day / time synchronisation
If you reconstructed the flights using Julian day and time data, and the base station
dataset has matching Julian day and time data, then you can use this data to
synchronise the datasets.
Library | Help | Top
© 2012 Intrepid Geophysics
| Back |
INTREPID User Manual
Library | Help | Top
Line correction and tie levelling (T30)
29
| Back |
Time matching options
As long as the results match properly (i.e., INTREPID can calculate matching
internal Julian time fields from them), the two datasets involved can have any of the
following.
•
A start time field and time calculated from fiducial numbers (Fiducial alias) and
a fiducial factor (FiducialFactor alias),
•
No start time field and time calculated from fiducial numbers (Fiducial alias)
and a fiducial factor (FiducialFactor alias) (assuming fiducial 0 represents
midnight at the start of the survey day),
•
No start time field and a time field nominated as the fiducial field (Fiducial
alias).
Flight/Fiducial synchronisation
If you reconstructed the flights using flight and fiducial numbers and the base station
dataset has matching flight and fiducial numbers, you can use them to synchronise
the datasets.
Specifying Diurnal corrections
>> To specify Diurnal corrections:
1
If you have not already done so, reconstruct the flights (See Chronological order—
reconstructing the flights for full instructions).
2
Choose one of the options from the Specify Basestation cascade in the File menu.
(See Base station—Survey data synchronisation methods for an explanation of
the Flight date/time and Julian day/time options.)
Date / Time / Fiducial Synchronisation
If you choose Date / Time / Fiducial INTREPID will prompt you to specify the
Date, start time, fiducial and Signal fields of the base station dataset.
If the base station dataset has a time field with a time for each data point
and you will be specifying this as the fiducial field, do not specify the
same field as the start time field.
Julian Day / Time / Fiducial Synchronisation
If you choose Julian Day / Time / Fiducial INTREPID will prompt you to specify
the Julian day, start time, fiducial and Signal fields of the base station dataset.
If the base station dataset has a time field with a time for each data point
and you will be specifying this as the fiducial field, do not specify the
same field as the start time field.
Library | Help | Top
© 2012 Intrepid Geophysics
| Back |
INTREPID User Manual
Library | Help | Top
Line correction and tie levelling (T30)
30
| Back |
Flight / Fiducial Synchronisation
If you choose Flight / Fiducial Synchronisation INTREPID will prompt you to
specify the flight number, fiducial and Signal fields of the base station dataset.
(See Specifying input and output files for general instructions about specifying
files.)
3
If you specified Date / Time / Fiducial Synchronisation, INTREPID displays the
Fid Factor and Date Format dialog box.
If you specified Julian Day / Time / Fiducial Synchronisation, INTREPID displays
the Fid Factor dialog box.
Enter the fiducial factor. (This would normally be 1 if you assigned the time field
to the Fiducial alias).
4
Specify the date format if required, then choose OK.
5
INTREPID displays the Signal field Pre-Process dialog box.
Select the process you require from the Pre-Process options. The default process
is None.
Diurnal variations are predominately large wavelength phenomena with respect
to time, and often base station data contain noisy spikes. We therefore
recommend subtle pre-filtering of the diurnal magnetic data using either the
Convolve (Fuller) or Naudy filters.
If you have selected Convolve (Fuller), specify the size of the convolution window
in data points, using the Window Size (data points) text box. See "Fuller filter" in
INTREPID spatial and time domain filters and transformations (R13) for further
information.
Library | Help | Top
© 2012 Intrepid Geophysics
| Back |
INTREPID User Manual
Library | Help | Top
Line correction and tie levelling (T30)
31
| Back |
If you have chosen the Naudy filter, specify
•
The filter wavelength (in data points) using the Window Size (data points) text
box,.
•
The filter tolerance (in Signal units) using the Tolerance text box,
See "Naudy filter" in INTREPID spatial and time domain filters and
transformations (R13) for further information.
6
INTREPID displays the Enter Time Lag dialog box.
Enter the time lag in seconds and choose OK. See Time lag for an explanation.
7
Examine the base station data if required. You can do this at any time after
loading base station data. See Examining base station data for instructions.
8
INTREPID will note the base station Signal field that you specified as corrections
and apply them when you choose Apply Corrections.
Since base station data typically has only one data point for about 100 data points
in the survey dataset, INTREPID will interpolate the corrections for the data
points that do not have corresponding data points in the base station dataset.
Time lag
Some diurnal fluctuations occur quite rapidly and may be due to sunspot activity.
This may be vary with the angle of the sun. If the base station is some distance from
the survey area, the angle of the sun at a certain time during the survey will occur at
a slightly different time at the base station due to the Earth's rotation.
You can specify the time difference in seconds between the base station and the
central point of the survey area. Specify the difference in seconds, using a positive
number if the base station is East of the survey area and a negative number if it is
West.
Examining base station data
You can view the following base station data:
Library | Help | Top
•
A list of flights or julian days for which data exists in the base station dataset.
•
A list of all flight numbers in the dataset being levelled.
•
A profile graph of the base station Signal field for a given flight.
•
A profile graph of the base station Signal field for a given date or julian day.
© 2012 Intrepid Geophysics
| Back |
INTREPID User Manual
Library | Help | Top
Line correction and tie levelling (T30)
32
| Back |
>> To examine base station data
1
Choose one of the options from the Base station menu
2
If you choose Display Flight/Cruise or Display Day, INTREPID will prompt you to
enter the date or select the flight number or julian day. Specify the data required.
3
INTREPID displays the information you require.
4
When you have finished viewing the information, choose OK.
Base station or Full Survey Flight list
If you choose Show Base Station Acquisition List. INTREPID displays a message box
showing all of the flights or Julian days (depending on the synchronisation method)
for which data exists in the base station dataset. Choose OK when you have finished
viewing the list.
List of flights with data in the base station dataset
List of Julian days with data in the base station dataset
The numbers are repeated in these message boxes because INTREPID is listing the
flight or Julian day for each group (corresponding to a traverse line) in the dataset.
If you choose Show Full Survey Flight List INTREPID displays the list in a message
box. Choose OK when you have finished viewing the list.
Library | Help | Top
© 2012 Intrepid Geophysics
| Back |
INTREPID User Manual
Library | Help | Top
Line correction and tie levelling (T30)
33
| Back |
Flight/Cruise or Day profile graphs
If you choose Display Flight/Cruise, INTREPID displays the Select Flights dialog box
containing a list of the flights for which the base station dataset contains data. Select
(click) the flight for the profile display, then choose OK.
If you choose Display Day and you are using Julian day/time synchronisation,
INTREPID displays the Select Julians dialog box containing a list of the days for
which the base station dataset contains data. Select (click) the flight for the profile
display, then choose OK.
If you are using Flight/Fiducial synchronisation and choose Display Day INTREPID
displays the Enter date dialog box. Enter the date for the profile in yymmdd format
(e.g., 970221 for 21 February 1997), then choose OK.
INTREPID displays the flight or all flights for the day in a graph with Fiducial record
on the horizontal axis.
Choose OK when you have finished viewing the graph.
Library | Help | Top
© 2012 Intrepid Geophysics
| Back |
INTREPID User Manual
Library | Help | Top
Line correction and tie levelling (T30)
34
| Back |
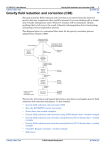
GRF—Subtracting the Earth's core magnetic field
If you are levelling magnetic data, you will need to subtract the intensity of the
Earth's core magnetic field using a Geomagnetic Reference Field (GRF) resource. See
The geomagnetic reference field in INTREPID (R15) for an explanation of GRF. The
correction will remove the influence of the Earth's core magnetic field. Luyendyk
(1997)1 gives a detailed explanation of the GRF correction.
Intrepid can calculate the GRF either by using a fixed survey date or a variable date.
For a fixed date GRF, typically the survey date will be the mean survey date. For a
variable date GRF, you must specify a date field in the Reconstruct flights (Date/time
Fids) phase if you wish Intrepid to use it. In this case the date field will override the
survey date defined in the GUI.
Intrepid can calculate the GRF using either a fixed elevation, or a variable elevation.
For a fixed elevation GRF, typically the nominal fixed height will be the mean height
of the sensor above sea level. For a variable elevation GRF, you must nominate a field
that provides Intrepid with height data above the spheroid, eg: GPS height. In this
case the height field will override the fixed height defined in the GUI.
The GRF correction alters the Signal values of the data.
The GRF field itself can be saved by clicking the Output Changes Only box, on the
right hand side of the tool. In this case the specified output field will contain the
calculated GRF.
>> To specify the GRF correction
1
Choose GRF from the Corrections menu. INTREPID displays the GRF
Corrections dialog box.
2
Enter the mean sensor height2 ASL (in metres), survey date (in the format
dd mm yyyy) and the GRF computation interval (in metres) in the parameters
text box.
3
Choose IGRF (International) or AGRF (Australian) using the IGRF / AGRF option
buttons.
4
Choose OK. Intrepid will display a chooser requesting a field containing height
above spheroid data. If you wish to compute a variable elevation GRF, select the
field and click OK. If you wish to compute a fixed elevation GRF using the
nominal sensor height, click Cancel.
5
Choose OK. INTREPID will note the corrections and apply them next time you
choose Trial Corrections or Apply Corrections.
1. op. cit., p. 33
2. This may be any measure of sensor height. See Using different height measures for
details.
Library | Help | Top
© 2012 Intrepid Geophysics
| Back |
INTREPID User Manual
Library | Help | Top
Line correction and tie levelling (T30)
35
| Back |
GRF Parameters
Survey date and height, AGRF / IGRF See The geomagnetic reference field in
INTREPID (R15) for an explanation of these parameters. 1
GRF computation interval Since the GRF field varies very slowly within surveys,
a single correction applied to a number of points within one line segment may be
accurate enough instead of calculating the GRF for all points. The GRF
computational interval is the length of the line segment for which a single GRF
correction value will suffice.
The computation interval need not be small. INTREPID calculates the GRF
correction for the centre point of each interval. It then interpolates individual
corrections for each data point between the centre points. The default of every 100 m
is reasonable. We recommend that this interval be not more than 1/3 of the line
length.
Of course, if measuring magnetic tensor data, a GRF correction is not likely to be
needed, as a gradient measure does not contain any Common Mode signal, or another
way of saying it, the GRF is differenced out of the signal.
Level XY corrections—inferring the correct location
Two readings on the same location with diurnal and parallax corrections applied
should be the same. If there is a non-zero misclosure for a crossover point it could be
the result of an error in the measurement of location.
Now that we use GPS navigation, the degree and frequency of this error is vastly
reduced. Non-zero misclosures are more likely due to problems with acquisition
height.
In the Level XY correction process, INTREPID searches for the true location of the
crossover point by trying to find a position nearby where extrapolated crossover
values are the same for the tie line and the acquisition line. To search for this point
INTREPID uses the gradients that it calculated for the tie line and the acquisition
line at the crossover point. INTREPID adjusts the line with the highest crossover
gradient (the higher gradient line). As this is a positional adjustment, there is
nothing special required for tensors??
Theory of the Level XY correction
1
The readings near the crossover on the higher gradient line may have been
attributed to the wrong location due to navigational errors.
2
The location of readings near the crossover on the other line may be more
accurate.
3
By a process of extrapolation you can estimate values at other locations near the
measured crossover point in the higher gradient line.
4
The best direction and method of extrapolation is to change X, Y and Signal
values in a direction along a straight line with the following characteristics:
•
It passes through the higher gradient crossover point;
•
It has a gradient equal to the crossover gradient;
•
The direction makes the higher gradient crossover Signal value approach the
1. This may be any measure of sensor height. See Using different height measures for
details.
Library | Help | Top
© 2012 Intrepid Geophysics
| Back |
INTREPID User Manual
Library | Help | Top
Line correction and tie levelling (T30)
36
| Back |
corresponding crossover Signal value in the other line.
Library | Help | Top
© 2012 Intrepid Geophysics
| Back |
INTREPID User Manual
Library | Help | Top
5
Line correction and tie levelling (T30)
37
| Back |
Within a radius that you have set as a limit, you may find a point on this
extrapolation line where the Signal value is equal to the other crossover Signal
value (zero misclosure). Adopt this new point as the correct crossover point.
This involves changing the X, Y and Signal values of the crossover.
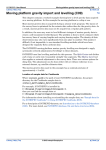
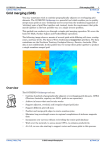
XY Level Correction Process
Gradient line at crossover
Z
A
A’
B
Higher gradient line profile
Radius of influence
Higher gradient line direction
A – Original crossover point on higher gradient line
B – Original crossover point on other line (direction perpendicular to page surface in this diagram)
A’– New crossover point on higher gradient line with zero misclosure
Using the Level XY correction
The Level XY correction alters the X, Y and Signal values of the data.
>> To use the Level XY corrections
1
If you have not already done so,
•
Perform Parallax, Diurnal and GRF1 corrections as required, then commence a
new Levelling session,
•
Reconstruct the flights,
•
Calculate the crossovers for the dataset.
2
Choose Level XY from the Corrections menu. INTREPID displays the Level XY
radius of influence dialog box.
3
The radius of influence is the radius (in metres) within which INTREPID may
extrapolate along the gradients searching for points of zero misclosure. Enter the
required radius of influence in the text box.
1. You may perform Diurnal and GRF corrections simultaneously with the Level XY
correction if you do not need to examine their results before proceeding.
Library | Help | Top
© 2012 Intrepid Geophysics
| Back |
INTREPID User Manual
Library | Help | Top
4
Line correction and tie levelling (T30)
38
| Back |
Choose OK. INTREPID will calculate proposed corrections for all enabled
crossovers. It can display the proposed corrections as line vectors in the dataset
display area (See Crossover and line display options for instructions).
Polynomial levelling
You can use the Polynomial correction technique to eliminate the effects of
instrument drift and gross levelling errors. The technique involves fitting a
polynomial curve through the misclosures along the tie lines, then along the flights
and finally along each acquisition line.
This method uses as a starting point the tie line that you consider to be the most level
(i.e., with the smallest average misclosure and the smallest variation in misclosures).
INTREPID uses this tie line (the principal tie line to detect errors in other tie lines
and in acquisition lines.
The Polynomial levelling correction alters the Signal values of the data.
Choosing the principal tie line and the tie line order
To prepare for the polynomial corrections you must choose the principal tie line, then
determine the order in which the rest of the tie lines will be processed. You can
choose one or more further tie lines after the first that you consider to be reasonably
level. INTREPID will use them after the initial tie line. INTREPID will then
automatically select the rest of the tie lines in sequence.
To assist you to select the most level tie line, INTREPID can display data for
crossovers along a tie line in a variety of ways.
See Crossover and line display options and Displaying profiles along individual tie
lines for instructions.
>> To create the tie line calculation list
Library | Help | Top
1
Choose Create List from the Tie Line menu.
2
Click once any point or crossover of the most level tie line in the dataset display
area. INTREPID will record it as the first tie line for calculation.
3
Click once any subsequent tie lines you wish to individually select. INTREPID
will record them.
4
Choose Complete List from the Tie Line menu. INTREPID will create the rest of
the list automatically.
© 2012 Intrepid Geophysics
| Back |
INTREPID User Manual
Library | Help | Top
Line correction and tie levelling (T30)
39
| Back |
5
Display the list to check that it has been constructed properly. choose Show List
from the Tie Line menu. INTREPID displays the list in a message box. This
example is from Albury.
6
Choose OK when you have finished viewing the list.
7
Save the tie line list for subsequent leveling sessions with this dataset if required.
>> To clear the tie line list,
Choose Delete List from the Tie Line menu.
Tie line list files
You can store tie line lists as text files for use in batch mode tasks or later sessions.
If you will be executing a task in batch mode using a tie line list, you must create a tie
line list file.
Here is an example of tie line list file, which could have the name eba_tie.parm.
TieList Begin
List = {
7122
7111
7121
}
TieList End
>> To save the current tie line list
Choose Save List from the Tie Line menu. INTREPID displays the Save List dialog
box. Locate the directory for the list file if necessary. Specify the name for the list file
(INTREPID will automatically add the extension .parm) and choose Open.
>> To load an existing tie line list
If the tie line list you require already exists as a tie line list (.parm) file, choose Load
List from the Tie Line menu. INTREPID displays the Load List dialog box. Locate
the directory for the list file if necessary. Select (click) the file required and choose
Open.
Library | Help | Top
© 2012 Intrepid Geophysics
| Back |
INTREPID User Manual
Library | Help | Top
Line correction and tie levelling (T30)
40
| Back |
The Polynomial 'drift estimation' levelling method
Drift curves
The polynomial levelling method involves the calculation of least squares fit along
flights, tie lines and acquisition lines. These curves plot misclosure (differences
between Signal values in tie lines and acquisition lines) against time.
Modern magnetometers do not have significant changes in accuracy with time, but
the readings are subject to other sources of error such as diurnal variations.
Radiometric data are also subject to various errors, such as the changing of energy
windows boundaries with temperature. Whatever the source of errors we refer to
them as instrument drift, or simply drift. And assume that they can be approximated
as a function of time by a piecewise polynomial (the so-called drift curves).
Whatever the source of drift, provided that the basic polynomial approximation
assumption holds, the polynomial levelling method is an effective technique for cross
referencing acquisition and tie line data and systematically apportioning the
misclosure between the acquisition and tie lines.
Steps in polynomial levelling
Polynomial levelling has up to four stages:
1
Level the tie lines assuming that the principal tie line has no errors,
2
Correct each flight assuming that the tie lines are correct
This step is sometimes described as 'Drifting the acquisition lines by flight to the
tie lines'.
3
Correct the individual acquisition lines assuming that the tie lines are correct.
This step is sometimes described as 'Drifting the acquisition lines individually to
the tie lines'.
4
Correct the individual tie lines again assuming that the acquisition lines are
correct. This is an optional step intended to remove any last residual errors.
This step is sometimes described as 'Drifting the tie lines individually to the
acquisition lines'.
Stage 1: Levelling the tie lines
1
We select the principal tie line. It should have the following characteristics:
•
'It should be one that was flown during a period of quiet diurnal activity,
•
Be located over a region of low magnetic relief, and
•
Be located approximately at the centre of the survey region.' 1
2
INTREPID creates a polynomial function f(fid) along a flight. The function's
curve is a least squares fit of the misclosures on the principal tie line. We assume
that the principal tie line contains no levelling errors, so this curve represents
acquisition line-only errors.
1. Luyendyk, A. P. J., op. cit., p.35 (Bullets added)
Library | Help | Top
© 2012 Intrepid Geophysics
| Back |
INTREPID User Manual
Library | Help | Top
3
Line correction and tie levelling (T30)
41
| Back |
INTREPID examines the second tie line's misclosures and records their offsets
from the curve created in step 2. Since the curve represents acquisition line-only
error, these offsets must be errors in the tie line Signal values for the second tie
line.
Levelling of tie line data – Step 1
First estimate of the acquisition line-only error curve
Time along flight
Misclosures on principal tie line
Misclosures on second tie line
Errors due to tie line Z value
(offsets from acquisition line-only error
curve)
The curve is calculated by least squares fit to misclosures
on the principal tie line (points marked
).
Since the principal tie line Z values are assumed to have
no error, the curve represents the errors due to acquisition
line Z values only.
The deviation of the second tie line misclosures from this
curve must be due to errors in the second tie line Z values.
We can record these errors and use them to correct the
second tie line Z values.
INTREPID repeats step 2 and 3 for all flights with acquisition lines crossing the
principal tie line. In this way it collects a complete set of corrections for the
second tie line.
4
INTREPID corrects the second tie line Signal values for the errors determined in
step 3. It does this by calculating a least squares fit curve for the errors along the
tie line. It then uses values on the curve as sources for the tie line Signal values
corrections.
Levelling of tie line data – Step 2
Correction curve for tie line Z values
Time along tie line
Error due to tie line Z value (size of offset from acquisition line-only error curve)
The curve is calculated by least squares fit to the tie line errors and represents the errors due
to tie line Z values on this tie line. It is the source of correction for levelling the tie line.
Library | Help | Top
© 2012 Intrepid Geophysics
| Back |
INTREPID User Manual
Library | Help | Top
Line correction and tie levelling (T30)
42
| Back |
5
INTREPID uses the principal tie line Signal values and the corrected second tie
line Signal values to calculate a new curve along a flight. This is based on more
data and is therefore a better estimate of the acquisition line only errors for the
flight.
6
INTREPID examines the third tie line's misclosures records their offset from the
curve created in step 6. Since the curve represents acquisition line-only error,
these offsets must be errors in the tie line Signal values for the third tie line.
Levelling of tie line data – Step 3
Second estimate of the acquisition line-only error curve
Time along flight
Misclosures on principal tie line
Corrected misclosures on second
tie line
Misclosures on third tie line
Errors due to tie line Z values
(offsets from acquisition line-only error
curve)
The curve is calculated by least squares fit to misclosures
on the principal tie line and corrected misclosures on the
second tie line (points marked
).
Since the principal and second tie line Z values are both
now assumed to have no error, the curve represents the
errors due to acquisition line Z values only.
The deviation of the third tie line misclosures from this
curve must be due to errors in the third tie line Z values.
We can record these errors and use them to correct the
third tie line Z values.
INTREPID repeats step 6 and 7 for all flights with acquisition lines crossing the
principal tie line. In this way it collects a complete set of corrections for the third
tie line.
7
INTREPID corrects the third tie line Signal values for the errors determined in
step 7. It does this in the same way as it did with the second tie line in step 5.
8
INTREPID repeats steps 6–9 including the corrected third tie line in the
calculation of the acquisition line-only error curve and calculating corrections for
the 4th tie line. It continues in this way until it has corrected all of the tie lines.
Stage 2: Levelling the flights
Having levelled the tie lines we may now assume that the remaining misclosures are
due to acquisition line errors. INTREPID calculates a least squares fit curve for the
misclosures along the flight and uses it as a source for the corrections to the
acquisition line Signal values in the flight.
For a diagram of this operation refer to the diagram of step 2 in the tie line levelling
stage above.. The flight correction is similar except that you are calculating the curve
along the flight instead of the tie line.
This step is sometimes described as 'Drifting the acquisition lines by flight to the tie
lines'.
If your dataset has no flight number field, you must omit this step.
Library | Help | Top
© 2012 Intrepid Geophysics
| Back |
INTREPID User Manual
Library | Help | Top
Line correction and tie levelling (T30)
43
| Back |
Stage 3: Levelling the individual acquisition lines
After we have levelled the flights there may still be some residual errors that are linespecific (e.g., heading errors (See Heading corrections—for errors due to aircraft
direction for a description of these errors)). INTREPID calculates least squares fit
curves for the misclosures along each line and uses then as sources for the corrections
to their respective acquisition line Signal values.
For a diagram of this operation refer to the diagram of step 2 in the tie line levelling
stage above.. The acquisition line correction is similar except that you are calculating
the curve along the acquisition line instead of the tie line.
This step is sometimes described as 'Drifting the acquisition lines individually to the
tie lines'.
Stage 4: Levelling the individual tie lines again
After we have levelled the individual acquisition lines there may be some remaining
residual errors in the tie line Signal values. If you perform this step, INTREPID
calculates least squares fit curves for the misclosures along each tie line and uses
then as sources for the corrections to their respective tie line Signal values.
For a diagram of this operation refer to the diagram of step 2 in the tie line levelling
stage above.
This step is sometimes described as 'Drifting the tie lines individually to the
acquisition lines'.
Additional information about polynomial levelling
•
INTREPID can weight the contribution of crossover point Signal values in
calculating the polynomial for the curve according to their estimated stability.
See Crossover weighting methods for details of the weighting methods available.
•
INTREPID uses a piecewise low order polynomial for the curve in the process.
Using the Polynomial levelling process
>> To use Polynomial levelling
1
If you have not already done so,
•
Perform Parallax, Diurnal and GRF10 corrections as required, then commence a
new Levelling session,
•
Reconstruct the flights,
•
Calculate the crossovers for the dataset,
•
Create a lie line list. (See Chronological order—reconstructing the flights for full
instructions).
1.0 You may perform Diurnal and GRF corrections simultaneously with the Polynomial
levelling if you do not need to examine their results before proceeding.
Library | Help | Top
© 2012 Intrepid Geophysics
| Back |
INTREPID User Manual
Library | Help | Top
Library | Help | Top
Line correction and tie levelling (T30)
44
| Back |
2
Choose Polynomial from the corrections menu. INTREPID displays the Select
Weighting Method dialog box. Generally for TMI you should pick an inverse of the
gradient of the Signal. The rationale is that in high gradient regions, the error is
likely to be exaggerated. For radiometrics signals, the usual advice is to suggest
the inverse of the square root of the signal, as the weighting. If you do not want
any bias, just choose all weights set to 1.
3
Select (click) the weighting method you wish to use, then choose OK. See
Crossover weighting methods for details about weighting methods.
4
INTREPID displays the Select Defaults for Polynomial dialog box.
5
Enter the initial smoothing length, default order of correction functions and the
width of the piecewise window. See Polynomial levelling for details.
6
Turn on check boxes corresponding to the polynomial levelling stages you wish to
perform. See Selecting polynomial levelling process stages for details. A new
distance weighting option has been introduced, largely for marine levelling
situations, where the sampling intervals can be very different. You do not want
equal weight given to a signal measured at a far distance to the current crossover, compared to a much more local reading. This is unlikely to be needed for
standard airborne surveying. Choose OK.
© 2012 Intrepid Geophysics
| Back |
INTREPID User Manual
Library | Help | Top
Line correction and tie levelling (T30)
45
| Back |
Levelling the tie lines assuming that the principal tie line is correct
7
If the Level Tie Lines to Principal Tie Line check box in the Select Defaults for
Polynomial dialog box was off, go to the next step.
INTREPID displays a panel for the first selected stage of levelling (tie lines) with
the parameters you defined in steps 5 and 6.
Choose Apply to calculate the first polynomial.
INTREPID displays the curve with the crossover misclosure values of the second
tie line. The offsets of the misclosures from this curve represent tie line errors,
which INTREPID proposes to correct, creating new tie line Signal values.
The horizontal axis of the graph represents time in seconds or fiducial numbers
from the beginning of the line (depending on the basis of the flight reconstruction).
The vertical axis represents the misclosure (difference between acquisition and tie
line values in Signal units).
The graph shows the crossover errors as small squares, the polynomial as a single
line curve and the weight assigned to the crossover as a vertical line through the
square. The longer the vertical line, the bigger the gradient value, and so the
smaller the weight applying to this mis-closure.
You can
Library | Help | Top
•
Without changing the parameters, view the results for the next or previous tie
line or a tie line you choose from a list. (Choose Next, Previous or Go To.)
•
Specify automatic or manual Y axis scaling for the graph. (Turn the Y Auto Scale
check box on or off. If you turn Auto Scale off, specify the scale in Signal units /
cm in the Scale text box.)
•
Change the Polynomial Order, Piecewise Window or Smoothing Length
parameters for the next curve calculation (See Polynomial levelling parameters
for details about the purposes of these parameters).
© 2012 Intrepid Geophysics
| Back |
INTREPID User Manual
Library | Help | Top
Line correction and tie levelling (T30)
46
| Back |
•
Recalculate the curve for the current tie line using the currently displayed
parameters and display the results. (Choose Apply). INTREPID only
recalculates results for the current tie line at this time.
•
If you have changed the parameters, recalculate the curve for the current tie line,
then recalculate and view the results for the next or previous tie line or a tie line
you choose from a list. (Choose Next, Previous or Go To.) INTREPID only
recalculates results for tie lines whose graphs you view.
•
Recalculate the curve and corrections for the current tie line and all tie lines that
follow it in the list, then commence the next levelling stage. (Choose OK).
Note: According to the tie line levelling method, the corrections for each tie line
depend on the corrections for the previous tie line. INTREPID, however, does not
automatically recalculate all of the corrections for tie lines later in the list if you
change the parameters for one of the tie lines. When INTREPID calculates the
polynomial and corrections for a tie line, it always uses the set of existing
corrections for earlier tie lines at the time it is performing the calculation.
Levelling the flights assuming that the tie lines are correct
8
If the Level Flights Assuming that the Tie Lines are Correct check box in the
Select Defaults for Polynomial dialog box was off go to the next step.
INTREPID displays a panel for the next selected stage of levelling (flights).
Choose Apply to calculate the polynomial for the first flight using the misclosures
(corrected by the tie line levelling process if performed (Step 7)). Under the
assumptions of polynomial levelling, this curve represents acquisition line error
only.
INTREPID displays the curve with the crossover misclosure values (corrected so
far) of the first flight. The offsets of the misclosures from this curve represent
acquisition line errors in the flight, which INTREPID proposes to correct, creating
new acquisition line Signal values.
Library | Help | Top
© 2012 Intrepid Geophysics
| Back |
INTREPID User Manual
Library | Help | Top
Line correction and tie levelling (T30)
47
| Back |
The horizontal axis of the graph represents time in seconds or fiducial numbers
from the beginning of the flight (depending on the basis of the flight
reconstruction). The vertical axis represents the misclosure (difference between
acquisition and tie line values in Signal units).
The graph shows the crossovers as small squares, the polynomial as a single line
curve and the weight assigned to the crossover as a vertical line through the
square.
You can
•
Without changing the parameters, view the results for the next or previous flight
(in flight reconstruction order) or a flight you choose from a list. (Choose Next,
Previous or Go To.)
•
Specify automatic or manual Y axis scaling for the graph. (Turn the Y Auto Scale
check box on or off. If you turn Auto Scale off, specify the scale in Signal units /
cm in the Scale text box.)
•
Change the Polynomial Order, Piecewise Window or Smoothing Length
parameters for the next curve calculation (See Polynomial levelling parameters
for details about the purposes of these parameters).
•
Recalculate the curve for the current flight using the currently displayed
parameters and display the results. (Choose Apply).
•
If you have changed the parameters, recalculate the curve for the current flight,
then recalculate and view the results for the next or previous flight (in flight
reconstruction order) or a flight you choose from a list. (Choose Next, Previous
or Go To.)
•
Recalculate the curve and corrections for the current flight and all flights that
follow it in the flight reconstruction order, then commence the next levelling
stage. (Choose OK).
•
Turn individual crossovers off or on (See Excluding crossovers from the levelling
calculation for instructions.
Levelling the acquisition lines assuming that the tie lines are correct
9
If the Level Acquisition Lines Assuming that the Tie Lines are Correct check box
in the Select Defaults for Polynomial dialog box was off, go to the next step.
INTREPID will calculate the polynomial for the first acquisition line(s) using the
misclosures (corrected by the tie line and/or flight levelling process(es) if
performed (Steps 7 and/or 8)). Under the assumptions of polynomial levelling,
this curve represents acquisition line error only.
INTREPID displays the curve with the crossover misclosure values (corrected so
far) of the first acquisition line. The offsets of the misclosures from this curve
represent acquisition line errors in the flight, which INTREPID proposes to
correct, creating new acquisition line Signal values.
The graph is similar to that shown in steps 7 and 8 and shows the crossovers as
small squares, the polynomial as a single line curve and the weight assigned to
the crossover as a vertical line through the square.
You can perform the same set of operations during the acquisition line levelling
stage as during the flight levelling process. See step 8 above for a list of possible
operations, substituting 'acquisition line' for 'flight'.
Library | Help | Top
© 2012 Intrepid Geophysics
| Back |
INTREPID User Manual
Library | Help | Top
Line correction and tie levelling (T30)
48
| Back |
Levelling the tie lines assuming that the acquisition lines are correct
10 If the Level Tie Lines Assuming that the Acquisition Lines are Correct check box
in the Select Defaults for Polynomial dialog box was off, go to the next step.
INTREPID will calculate the polynomial for the first tie line using the
misclosures (corrected by the tie line and/or flight and/or acquisition line levelling
process(es) if performed (Steps 7 and/or 8 and/or 9)). To be performing this step
you will normally have performed steps 8 and/or 9. If this is the case, then under
the assumptions of polynomial levelling, this curve represents any residual tie
line error after the acquisition line levelling process.
INTREPID displays the curve with the crossover misclosure values (corrected so
far) of the first tie line. The offsets of the misclosures from this curve represent tie
line errors in the flight, which INTREPID proposes to correct, creating new tie
line Signal values.
The graph is similar to that shown in steps 7 and 8 and shows the crossovers as
small squares, the polynomial as a single line curve and the weight assigned to
the crossover as a vertical line through the square.
You can perform the same set of operations during the tie line levelling stage as
during the flight levelling process. See step 8 above for a list of possible
operations, substituting 'tie line' for 'flight'.
11 INTREPID displays the Repeat Iteration dialog box.
INTREPID can repeat the whole Polynomial correction process using the current
set of corrected crossovers, creating a more levelled result. If you require this,
choose Yes, otherwise No.
If you choose Yes, INTREPID will go back to step 7.
12 Repeat steps 7–11 as often as you require.
13 INTREPID will calculate proposed corrections for all enabled crossovers. It can
display the proposed corrections as colours or red/black crosses in the dataset
display area (See Display style—markers vs colours and Crossover and line
display options for instructions). INTREPID can also display a profile of proposed
polynomial levelling corrections along any tie line (See Displaying profiles along
individual tie lines for details).
Library | Help | Top
© 2012 Intrepid Geophysics
| Back |
INTREPID User Manual
Library | Help | Top
Line correction and tie levelling (T30)
49
| Back |
Crossover weighting methods
The stability of crossover data can vary. All data is subject to noise which causes
rapid fluctuations in the Signal values. High frequency Signal data is an indicator of
noise. You can assign weights to crossover data when calculating the polynomial so
that less stable data has less influence on the polynomial calculation.
When you commence the polynomial levelling process (See Step 2 in Section Using
the Polynomial levelling process), INTREPID prompts you to specify the weighting
method, using the Select Weighting Method dialog box.
In assigning weights INTREPID examines the Signal value of the line that it is
correcting (i.e., the tie line for stages 1 and 4 and the acquisition line for stages 2 and
3 in Section Using the Polynomial levelling process.
INTREPID has three weighting method options:
Gradient of Signal If you select this option INTREPID will assign a lower weight to
crossovers with high gradient Signal values before calculating the polynomial.
High gradient crossovers will contribute less than crossovers with a low gradient.
Use this method with magnetic data. For magnetic data the gradient of Signal
corresponds to the stability of the data.
1
weight = ------------------------------( 0.1 × gradient )
e
Square root of Signal If you select this option INTREPID will assign weights to
crossovers according to the square root of the Signal value. High Signal value
crossovers will contribute less than crossovers with a low Signal value. Use this
method with radiometric data. For radiometric data the square root of the Signal
value corresponds to the standard deviation and indicates the stability of the
data.
weight =
Z
All Weights 1 If you select this option INTREPID assigns weight 1 to all crossover
values.
Library | Help | Top
© 2012 Intrepid Geophysics
| Back |
INTREPID User Manual
Library | Help | Top
Line correction and tie levelling (T30)
50
| Back |
Polynomial levelling parameters
When you commence a polynomial levelling process (See Step 4–5 in Section Using
the Polynomial levelling process) and for each line or flight at each stage of the
process (See Steps 7, 8, 9, 10) you can specify the order of the polynomial function, the
width of the piecewise window and the smoothing length.
Polynomial order (Default Order of Correction Functions) This parameter
determines the order of the piecewise polynomial. The default order is 3.
Piecewise window size This parameter determines the number of adjacent
crossovers to use in computing the piecewise polynomial for a section of a line.
The default value is 50.
Smoothing length The polynomial fit may be poor at the ends of a line or flight, so
INTREPID applies a smoothing filter in this region. This parameter determines
the number of crossovers at the end of the line or flight to which INTREPID
apples the smoothing filter. The default value is 5.
Selecting polynomial levelling process stages
You can specify the polynomial levelling stages for INTREPID to perform. Each
stage can be performed independently. If you omit an earlier stage, you are assuming
that it is not necessary.
When you commence polynomial levelling (See Step 4, 6 in SectionUsing the
Polynomial levelling process), INTREPID prompts you to select the levelling stages to
perform using the Select Defaults for Polynomial dialog box.
Level Tie Lines to Principal Tie Line Turn this check box on if you wish to level
the tie lines assuming one tie line is correct. (See Stage 1: Levelling the tie lines
and Step 7 in Using the Polynomial levelling process for details.)
Level Flights Assuming that the Tie Lines are Correct Turn this check box on if
you wish to level the flights, assuming that the tie lines are correct. If your
dataset has no flight number field, you must turn off the check box for this step.
(See Stage 2: Levelling the flights and Step 8 in Using the Polynomial levelling
process for details.)
Level Acquisition Lines Assuming that the Tie Lines are Correct Turn this
check box on if you wish to level the acquisition lines, assuming that the tie lines
and flights are correct. (See Stage 3: Levelling the individual acquisition lines
and Step 9 in Using the Polynomial levelling process for details.)
Level Tie Lines Assuming that the Acquisition Lines are Correct Turn this
check box on if you wish to level the tie lines, assuming that the acquisition lines
are correct. (See Stage 4: Levelling the individual tie lines again and Step 9 in
Using the Polynomial levelling process for details.)
Library | Help | Top
© 2012 Intrepid Geophysics
| Back |
INTREPID User Manual
Library | Help | Top
Line correction and tie levelling (T30)
51
| Back |
Improving the polynomial fit at line and flight ends
At the ends of lines or flights the fit of the polynomial may be poor, because 'there is
no constraint on the polynomial beyond the limits of the data and they may diverge
from the expected result'1.
To help remedy this, INTREPID applies a smoothing filter at the ends of the lines or
flights. You can determine the number of crossovers to be filtered using the
Smoothing Length parameter (See Polynomial levelling parameters).
If the ends of the tie lines 'whip' out of control in this way, try the following (in order
of preference):
1
Change the piecewise window size (See Polynomial levelling parameters),
2
Reduce the polynomial order if it is greater than 4 (See Polynomial levelling
parameters), and
3
Vary the tie line order for the tie line levelling process (See Choosing the principal
tie line and the tie line order).
Loop closure levelling
The loop closure method repeatedly adjusts the Signal values in the acquisition lines
to minimise overall misclosure for the dataset and distribute the residual errors.
This method is simple and fast to use but results may be unstable in high gradient
areas.
>> To specify loop closure correction.
1
If you have not already done so and it is appropriate,
•
Perform Parallax, Diurnal and GRF2 corrections as required, then commence a
new Levelling session,
•
Reconstruct the flights,
•
Calculate the crossovers for the dataset.
2
Choose Loop closure from the Corrections menu. INTREPID will calculate
proposed corrections for all enabled crossovers. It can display the proposed
corrections as colours or red/black crosses in the dataset display area (See Display
style—markers vs colours and Crossover and line display options for instructions).
1.1 Luyendyk, A. P. J., op. cit., p.36
2.2 You may perform Diurnal and GRF corrections simultaneously with the Loop closure
levelling if you do not need to examine their results before proceeding.
Library | Help | Top
© 2012 Intrepid Geophysics
| Back |
INTREPID User Manual
Library | Help | Top
Line correction and tie levelling (T30)
52
| Back |
The loop closure process
The loop closure process is described in detail by Green (1983)1
M3
M1
A
M2
B
M4
A set of acquisition and tie line form a 'grid' as shown in the diagram above. At each
crossover point there may be a misclosure, or difference between the Signal values on
the acquisition and tie lines.
INTREPID examines the misclosure of a target crossover and that of its four
neighbours along the lines. (For example, in the above diagram crossover A has
neighbouring crossovers with misclosures, M1–M4.
INTREPID makes a first estimate of the correct value for each crossover as the mean
of its two Signal values.
It then adjusts the proposed correction of the target crossover using the current
estimates for the neighbouring crossovers and their average original misclosure.
After calculating a new current estimate for the target crossover, INTREPID then
makes the next crossover the target crossover (This would be crossover B in the
diagram above, and crossover A becomes one of its neighbouring crossovers), and
performs the same adjustment for it. INTREPID continues until all it has adjusted
all crossovers.
INTREPID then repeats the process on all crossovers in reverse order. This two way
pass makes up one loop closure iteration.
INTREPID performs a number of iterations and notes the changes to the crossover
estimates. Repeated iterations will reduce and distribute the overall misclosure for
the dataset.
INTREPID terminates the iterations after it has performed a specified number or
when the average change for crossovers falls below a specified level.
This algorithm can be simply improved to also follow the same steps, but genralised
to vectors and tensors, provided the appropriate swums, divisions, and rotational
algebra, are carefully created and tested. This is what INTREPID have implimented.
1.3 Green, A. A., A comparison of adjustment procedures for leveling aeromagnetic survey
data, Geophysics, 48 (6) (June 1983), 745–753
Library | Help | Top
© 2012 Intrepid Geophysics
| Back |
INTREPID User Manual
Library | Help | Top
Line correction and tie levelling (T30)
53
| Back |
Loop closure parameters
The loop closure process uses two parameters. If you wish to change them you must
use a task specification (.job, or .task) file for the Levelling process and edit the
file according to your requirements. You can use the file in interactive or batch mode.
Max_Iterations controls the maximum number of loop closure iterations performed.
The default value is 500.
Max_Change When the average change to the crossovers in an iteration falls below
the value of this parameter, the process will stop. The default value is 0.01.
See Displaying options and using task specification files for more information.
Process reports for the loop closure method
You can inspect a report of the progress of the loop closure process and the original
and final average misclosure. Under Unix this appears in the background window.
Under Windows it can be written to an WINXX.username.log report file. See
"Diagnostic reporting options" in Configuring and using INTREPID (R04) for more
information about background window or ntout file reports.
Single Gradient Corrections
Gedex and Rio have invested significantly in single gravity gradient measuring
systems in the hope that this strategy will deliver a superior signal for detecting orebodies, compared to a full tensor gradient system. One channel measured with a 1
Eotvos noise envelope maybe more easily achieved than 6 channels with 2E. The hope
has also been that Fourier theory can be used to recover what has not been measured,
in terms of the other tensor gradient components. This is easy enough to propose, but
of course, Mother Nature has her own ways, and you tend to get nothing for nothing in
this type of context. The spatial indexing technique described in the next section
probably gives you the best chance at something which yields stabilised estimates of
non-measured components, while still residing in the profile world. Otherwise, you
have to level and grid your signal before you have any chance, and with those steps,
you immediately lose 80% of the signal content along the profiles, and so the high
frequency resolving power you have hoped for is immediately compromised.
Transverse gradients are very important when defining sources off line. Any anomaly
bull’s eyes will also remain under the profile and not off-line. This is not an issue with
FTG data. All teachers of geophysics and would be inverstors in geophysical survey
instruments take note.
Not withstanding this dilemma, there are simple trasnform that can successfully be
undertaken using gravity gradient component measures that are non-conventional.
this part of the tool is strictly alpha only, as there are still no fiully operational
Library | Help | Top
© 2012 Intrepid Geophysics
| Back |
INTREPID User Manual
Library | Help | Top
Line correction and tie levelling (T30)
54
| Back |
examples of commercial grade systems in operation as yet.
The options deal with converting a Rio style instruments signal to other more
conventional signal types.
Tensor Corrections
New to V4.5 is the tensor corrections selections. While many of the previous
algorithms already work on the generalised notion of a geophysical signal, some
tensor specific algorithms are also required that do not work on scalar signals. Some
of these are light weight, as in the Earth effect for the Full tensor Gravity
Gradiometry signal, and some make heavy use of local approximation theory based
upon 3rd order truncated Fourier series equation fitting.
All the methods in this section are profile based.
The first two options are FTG specific, with a simple model for the Earth gravity
tensor effect at the surface, based around the Free Air correction gradient of 3048
Eotvos. As most survey data does not have this portion of the signal present, as it is
not really being measured, this is academic.
The option to remove a calculated Heading tensor error in each of the 4 cardinal
flying directions for a standard survey is given next. If you try this, examine the
Library | Help | Top
© 2012 Intrepid Geophysics
| Back |
INTREPID User Manual
Library | Help | Top
Line correction and tie levelling (T30)
55
| Back |
levelling report to make sense of the statictical reporting, followed by application of
average difference tensors.
The next option is similar, but is flight based statistically.
Estimating the Frobinus error Norm is a QC option. An 11 point window is passed
down each profile, with the signal at the middle point in the filter subtracted from the
estimated signal, using 5 points either side. The Norm of the difference tensor is then
saved to the output channel, as a primary indicator of the background noise in the
measured signal.
Using somewhat similar techniques, instead of estimating the middle point’s tensor
signal, it is equally easy to integrate the tensor and estimate the vertical component,
which for gravity, is quite interesting. Remember this is high passed, and cannot
have much longer wavelength present.
Perhaps the most challenging levelling method is to drape continue the measured
tensors from an observed flying height, to another surface height. This is required for
joining surveys together and various other purposes. The algorithmic challenge here
is to constrain the cross-gradient terms locally, as data on adjoining lines must be
referneced to accomplish this feat. With V5.0, we now use a spatial indexing
technique to sort all the observed data for a survey into a local neighbourhood
context. this then makes it easy to find observed tensors values locally in all
directions, not just along profiles, os we then can successfully do the required
continuations without having numeric instabilities. Use more samples, and you will
get a smoother result, that is less “high-passed”
Creating and Using Crossovers Datasets
INTREPID can create a crossovers dataset which consists of all the crossover points
in the original line dataset, including the unadjusted and adjusted values for a
specified data field.
The crossovers dataset mimics the original dataset in that it is a line dataset covering
the same region with the same number and location of lines. It differs in that it
contains only data points which occur at the crossover points.
Crossover datasets act as a check point, allowing you to investigate and reflect on
your current task using them instead of always having to re-establish them from the
original data.
INTREPID does not save any Levelling parameters you have specified. When you
load a crossover dataset to continue working with it you need to respecify the
corrections.
You can perform trial gridding1 on crossovers datasets and examine them using
INTREPID tools such as the Spreadsheet Editor, Profile Editor and visualisation
tools.
1.4 The grid may provide an aid to interpreting the crossovers dataset even though it may
not resemble a conventional grid.
Library | Help | Top
© 2012 Intrepid Geophysics
| Back |
INTREPID User Manual
Library | Help | Top
Line correction and tie levelling (T30)
56
| Back |
Saving and loading crossovers datasets
>> To save the crossovers
Calculate the crossovers then choose Save Crossovers from the File menu.
INTREPID displays the Save Crossovers dialog box. Specify the name of the
crossover dataset and choose Save. (See Specifying input and output files for general
information about loading and saving data.)
Library | Help | Top
© 2012 Intrepid Geophysics
| Back |
INTREPID User Manual
Library | Help | Top
Line correction and tie levelling (T30)
57
| Back |
>> To open a crossovers dataset
1
Choose Open Crossovers from the File menu. INTREPID displays the Open
Crossovers dialog box.
2
Specify the dataset. (See Specifying input and output files for general information
about loading and saving data.)
INTREPID will prompt you to specify which sets of proposed corrections from the
crossovers dataset to retrieve and treat as current proposed corrections.
This dialog box contains a check box for each set of proposed corrections contained
in the crossovers dataset.
3
Turn on the check boxes for the corrections you wish to load as the current
proposed corrections, then choose Apply / OK.
•
INTREPID will load the crossovers dataset.
•
INTREPID will adopt the selected crossover-based proposed corrections.
•
Immediate proposed corrections are for information only in the crossovers dataset
and have no effect on any immediate correction operation in this tool.
Crossovers dataset description
The crossovers dataset is a line dataset containing crossover information along each
line of the dataset containing the crossovers.
Since each crossover point occurs at the intersection of two lines, there are two
records of each crossover, one from the acquisition line and one from the tie line. In
each record there is information about both lines. Each group in the crossovers
dataset contains a line labelled LNUM which intersects with one or more other lines
labelled TNUM. Therefore a histogram of the misclosures in the crossovers dataset will
appear symmetrical around zero, since each misclosure occurs twice in the dataset,
one having a positive value, the other having a negative value.
The BETA misclosure is the proposed new misclosure after levelling corrections have
been applied. The initial value for BETA is the same as the misclosure value. It gets
progressively altered as each levelling attempt is applied. Normally a single levelling
pass is done, but it is possible to do repeated levelling. In this case INTREPID stores
all Signal value corrections as changes to the misclosure, and BETA represents the
final misclosure value after all levelling attempts have been applied.
Library | Help | Top
© 2012 Intrepid Geophysics
| Back |
INTREPID User Manual
Library | Help | Top
Line correction and tie levelling (T30)
58
| Back |
For each crossover point the dataset has the following fields:
Field
Description
FLIGHT
Flight number of the line ('group by' field)
LNUM
Line number ('group by' field)
TYPE
Line type ('group by' field)
TIEFLIGHT
Flight number of other line at the crossover point
TNUM
Other line number at the crossover point
LFID
Fiducial value on the line at the crossover point. It will usually be fractional because
crossover point will most likely be between two original data points.
TFID
Fiducial value on the other line at the crossover point. It will usually be fractional
because the crossover point will most likely be between two original data points.
X
X location of crossover point
Y
Y location of crossover point
Signal
Original Signal value on the line at the crossover point
LGRAD
Gradient of the Signal profile on the line at the crossover point (or near it if you used
the search radius). See Crossover gradients for further details about crossover
gradients.
FLAG
Flag indicating whether the crossover is enabled
MISCLOSURE
Original misclosure
BETA
Sum of all proposed corrections expressed as a revised misclosure. INTREPID only
calculates this if you specify XY, polynomial or loop closure correction.
DIURNAL
Proposed Diurnal correction
HEADING
Proposed Heading correction
IORAGRF
Proposed Earth's core magnetic field correction
LOOPDELTA
Proposed Loop Closure correction
POLYDELTA
Proposed Polynomial correction
XYDELTA
Proposed XY correction to Signal field of the line
XDELTA
Proposed XY correction to X field of the line
YDELTA
Proposed XY correction to Y field of the line
Signal
The interpolated signal at the cross-over position
Possible operations with reloaded crossovers datasets
You can use reloaded crossovers datasets for enabling and disabling crossovers and
for viewing crossovers data and as a source of crossover-based corrections to apply to
the dataset to be levelled.
Library | Help | Top
© 2012 Intrepid Geophysics
| Back |
INTREPID User Manual
Library | Help | Top
Line correction and tie levelling (T30)
59
| Back |
If you load an existing crossovers dataset during a Levelling session, you can
•
Specify which sets of crossover-based proposed corrections from the crossovers
dataset INTREPID should retrieve and treat as current proposed corrections.
(See Proposed corrections and crossovers datasets for details.)
•
Examine crossover data in the Individual Crossover Display Area. (See
Examining individual crossovers for details.)
•
Enable and disable crossovers. (See Excluding crossovers from the levelling
calculation for instructions.)
•
Examine the crossover data using options from the Display menu. (See Display
style—markers vs colours and Crossover and line display options for instructions.)
•
Respecify corrections as required. (See INTREPID Levelling corrections.)
•
Save a new copy of the crossovers dataset if required. (See Saving and loading
crossovers datasets for instructions.)
Viewing the crossovers dataset as a point dataset
You can view the crossovers as either a line or point dataset in INTREPID tools if
desired. If you wish to view crossovers as a point dataset you must first prepare it.
>> To prepare and view a crossovers dataset as a point dataset
1
Create a file with the extension ..PNT in the crossovers dataset directory.
INTREPID will not look inside this file, so it may have any content.
2
Open the crossovers dataset as a point dataset in the tool you wish to use.
If you are using the Flight Path Editor, choose Cancel when INTREPID prompts
you for the Signal fields for point colour and size.
INTREPID displays the dataset as a point dataset.
Display style—markers vs colours
You can display data for crossover points using crossover markers or
crossover colours.
Crossover markers are cross '+' symbols. They are black if they represent a
negative quantity and red if they represent a positive quantity. Their size
directly corresponds to the magnitude of the quantity they represent.
Crossover colours are coloured dots. Their colour corresponds to a value
according to a table of value ranges and colours within the Levelling
program.
>> To select crossover markers or colours:
Choose Markers or Colours from the options in the Style menu.
Library | Help | Top
© 2012 Intrepid Geophysics
| Back |
INTREPID User Manual
Library | Help | Top
Line correction and tie levelling (T30)
60
| Back |
Crossover and line display options
You can view a wide variety of crossover data graphically in the dataset display area.
INTREPID represents the values as markers or using colours for different ranges.
See Display style—markers vs colours for details.
>> To choose a display option:
Choose the data for display using the Display menu or its cascades.
Library | Help | Top
© 2012 Intrepid Geophysics
| Back |
INTREPID User Manual
Library | Help | Top
Line correction and tie levelling (T30)
61
| Back |
The following table lists the available display options
Data displayed
Representation
Menu option
Crossover points
black points
Crossovers
Misclosures
colours or red and black '+' symbols
Misclosure
Beta misclosures
Betas
Acquisition line or tie line paths
lines
Acq Lines,
Tie Lines
Acquisition line or tie line
crossover gradients
colours or red and black '+' symbols
Acq Gradients,
Tie Gradients
Acquisition line or tie line flight
paths
coloured lines—one colour for each flight
Acq Flights,
Tie Flights
Difference between acquisition and
tie line gradients
colours or red and black '+' symbols
Gradient Diffs
Size of Signal value corrections to
acquisition line and tie line data
Acq Corrections –>
Tie Corrections –>
Heading corrections
colours or red and black '+' symbols
Heading
Level XY corrections
squares with line vectors
XYmove
Diurnal corrections
colours or red and black '+' symbols
Diurnal
GRF corrections
GRF
Loop closure levelling corrections
Loop
Polynomial levelling corrections
Polynomial
The following illustrations show displays from the Display menu options.
Library | Help | Top
© 2012 Intrepid Geophysics
| Back |
INTREPID User Manual
Library | Help | Top
Line correction and tie levelling (T30)
62
| Back |
Displaying profiles along individual tie lines
You can display crossover data using profile graphs along individual tie lines.
INTREPID uses a separate window to display the values as a profile graph (with
fiducials on the horizontal axis).
You can display data from the crossover points of a single flight or all flights.
>> To display data as a profile graph along a tie line:
1
Ensure that the flights are reconstructed (See Chronological order—
reconstructing the flights for full instructions).
2
Choose the All Flights for Tie or One Flight for Tie option from the Tie Line menu.
All Flights for Tie If you choose this, INTREPID displays the profile for the whole
tie line.
One Flight for Tie If you choose this, INTREPID displays the profile for crossovers
whose acquisition line belongs to one selected flight.
3
Choose the display option you require from the Display Tie Graph cascade in the
Tie Line menu.
The profiles will show the values specified for each crossover:
Readings The original Signal value of the tie line.
Acquisition line gradients The gradient of the acquisition line Signal values.
Tie line gradients The gradient of the tie line Signal values.
Tie line gradient weights The Polynomial levelling weights for the tie line
gradients. (See Crossover weighting methods).
Tie line value weights The Polynomial levelling weights calculated as √Signal
values. (See Crossover weighting methods).
Misclosures the difference between acquisition and tie line Signal values.
Polynomial Corrections The current Polynomial proposed correction.
Betas (Beta Misclosures) The current running total of proposed corrections expressed
as a modified misclosure. (See Proposed corrections and the beta misclosure for a
definition).
Library | Help | Top
© 2012 Intrepid Geophysics
| Back |
INTREPID User Manual
Library | Help | Top
4
Line correction and tie levelling (T30)
63
| Back |
INTREPID displays the Select Tie to be Displayed dialog
box.
Select (click) the number of the tie line you wish to
examine, then choose OK.
5
If you selected the One Flight for Tie option in step 2
above, INTREPID displays the Select Flight dialog box.
Select (click) the number of the flight you wish to examine, then choose OK.
INTREPID displays the tie line profile in a separate window.
6
Library | Help | Top
When you have finished viewing the display, choose OK. INTREPID will close the
Display Along Individual Tie Lines window.
© 2012 Intrepid Geophysics
| Back |
INTREPID User Manual
Library | Help | Top
Line correction and tie levelling (T30)
64
| Back |
The Geomagnetic Reference Field calculator
You can use this calculator to obtain a Geomagnetic Reference Field (GRF) value for
any location expressed in latitude and longitude.
>> To use the GRF calculator
1
Choose AGRF or IGRF from the Mag Field menu.
INTREPID displays the GRF calculator dialog box.
2
Enter in the parameters text box, separated by spaces:
•
Height of location (in metres)
•
Latitude of location (in degrees)
•
Longitude of location (in degrees)
•
Date for the calculation (in the format dd mm yy).
3
Choose OK. INTREPID displays the value in the GRF value dialog box.
Intl. GeoMagnetic Reference Field magnitude, inclination and declination
See The geomagnetic reference field in INTREPID (R15) for an explanation of
these parameters.
Library | Help | Top
© 2012 Intrepid Geophysics
| Back |
INTREPID User Manual
Library | Help | Top
Line correction and tie levelling (T30)
65
| Back |
Suggested levelling procedures for different cases
Levelling suggestions—case 1
An old survey, badly levelled, without any time based information such as Flight
Date/Time or Fiducial record.
Suggested corrections:
Parallax, GRF, Heading, LevelXY, Loop
Suggested procedure:
If you grid the data you may be able to see levelling busts15 in the grid.
If these are alternate highs and lows corresponding to traverse lines, try the Heading
correction.
You can estimate the corrections required by examining Signal values at different
places in the grid using the Visualisation tool (see "Querying points" in Visualisation
(T26)).
Alternatively you can calculate mean Signal values for each group (traverse line)
using the Spreadsheet. If these means are alternately high and low, you can
calculate the value for the Heading correction from their difference.
Levelling suggestions—case 2
A full original located data set is available including all time variables.
Suggested corrections:
All Levelling options are available.
Suggested procedure:
1
If base station data is available, perform the Diurnal correction.
2
Make the GRF correction.
3
Apply the corrections and save the new Signal values.
4
Try to improve the coherency of the features in the data by experimenting with
parallax corrections. Use positive and negative corrections.
5
Starting with the Diurnal and GRF corrected data, calculate crossovers again and
look at the misclosures. You can obtain more information about its current state
by creating a trial grid based on either the full dataset or the reduced crossover
dataset.
6
Perform a Polynomial correction.
Levelling suggestions—case 3
A full tensor gravity gradient survey is newly acquired, and you wish to get a sense of
the turbulence encounted, as the survey was flown.
Suggested query:
1
Use the tensor correction, calculate the Frobinius Norm field
2
Apply the correction and save the new QC signal field.
3
Examine this field in the flight path plot tool
1.5 Levelling busts - patterns in the grid that look as if they are associated with
discrepancies in flight data.
Library | Help | Top
© 2012 Intrepid Geophysics
| Back |
INTREPID User Manual
Library | Help | Top
4
Library | Help | Top
Line correction and tie levelling (T30)
66
| Back |
Alternatively, grid the new field and examine the flight lines for noise levels.
© 2012 Intrepid Geophysics
| Back |
INTREPID User Manual
Library | Help | Top
Line correction and tie levelling (T30)
67
| Back |
Applying the corrections to the whole dataset
After you have specified your corrections for the dataset to be levelled you can apply
the corrections to all data points.
>> To apply the corrections to all data points:
1
Specify whether to save new corrected X, Y and Signal values or values of
corrections in the output field using the Output Changes Only check box below
the individual crossover display area (turn off for corrected values). You are most
unlikely to see the following pop-up, as you would need to be simultaneously
having BETA change sets for each of the listed correction types. The usual
situation is to ask you to confirm you want to commit to the change set from the
single levelling method you have been using.
2
Choose Apply Corrections near the bottom right corner of the Levelling window.
INTREPID displays the Choose Corrections to Apply dialog box.
This dialog box contains a check box for each correction that you have specified in
this session or that was present in the last crossovers dataset that you loaded.
3
Turn on the check boxes for the corrections you wish to apply, then choose Apply.
INTREPID will apply the corrections to the whole dataset.
4
If you wish to apply other already specified corrections, go to step 1.
Help
You can use the Help menu to display help text on the topics shown in the menu
illustration below.
Library | Help | Top
© 2012 Intrepid Geophysics
| Back |
INTREPID User Manual
Library | Help | Top
Library | Help | Top
Line correction and tie levelling (T30)
68
| Back |
© 2012 Intrepid Geophysics
| Back |
INTREPID User Manual
Library | Help | Top
Line correction and tie levelling (T30)
69
| Back |
Exit from the Levelling tool
>> To exit from the Levelling tool
1
Check that you have saved any crossover or corrected data files that you wish to
keep.
2
Choose Quit from the File menu. INTREPID will close the Levelling window.
Displaying options and using task specification files
Displaying options
You can view a list of the files and parameters options you have set for the current
Levelling session by saving a task specification file (see next section) then viewing it
in a text editor.
You can view graphically the effects of options that you have set in the Levelling
window. See Display style—markers vs colours and Crossover and line display
options for instructions.
Examining the crossovers dataset is another way of obtaining information about your
specifications in a Levelling session (See Creating and Using Crossovers Datasets for
details).
Using task specification files
>> To create a task specification file with the Levelling tool
1
Specify all files and parameters.
2
If possible, execute the task (choose Apply) to ensure that it will work.
3
Choose Save Options from the File menu. Specify a task specification file
(INTREPID will add the extension .job) INTREPID will create the file with the
settings current at the time of the Save Options operation.
For full instructions on creating and editing task specification files see INTREPID
task specification (.job) files (R06). V5.0 Intrepid also re;leases GOOGLE protobuf
syntax for this tool, thereby deprecating this older PARMS syntax. In the examples
directory distributed with the software, are directories jobs/levelling and tasks/
levelling. Identical processes are given there with both syntaxes, so you can compare
and contrast the changes forced by the adoption of the GOOGLE parser/messaging
technology. it is very close fit, and the benefits far outweigh the downside of making
this change.
4
you get access to the full data/processing model for all of Intrepid and
Geomodeller via the *.proto files we now distribute at V5.0.
5
The GOOGLE parsers are very good at reporting syntax errors in the language
down to line and column.
6
INTREPID can move to a client/server, super computer/cloud computing
architecture, with a completely independently designed and supported messaging
language as the glue. This is after all one of the technologies upon which
GOOGLE runs its business.
>> To use a task specification file for a batch mode Levelling task
Type the command newlevel.exe with the switch –batch followed by the name
(and path if necessary) of the task specification file.
Library | Help | Top
© 2012 Intrepid Geophysics
| Back |
INTREPID User Manual
Library | Help | Top
Line correction and tie levelling (T30)
70
| Back |
For example, if you had a task specification file called surv329.job in the current
directory you would use the command
newlevel.exe –batch surv329.job
Note: The current version of INTREPID cannot load task specification files for
interactive use. You can load previously specified operations to some extent using
crossovers datasets, but these operate differently from task specification files. See
Creating and Using Crossovers Datasets for information about crossovers datasets.
Task specification file examples
Examples of Levelling task specification files appear below.
Example 1—All corrections except polynomial levelling - PARMS syntax
Process Begin
Name = newlevel
InputZ = /disk1/surveys/ebagoola_S/raw_mag
InputX = /disk1/surveys/ebagoola_S/x
InputY = /disk1/surveys/ebagoola_S/y
inputFid = /disk1/surveys/ebagoola_S/fid
TYPEName = /disk1/surveys/ebagoola_S/linetype
inputLine = /disk1/surveys/ebagoola_S/line
inputFlights = /disk1/surveys/ebagoola_S/Flight
DiurnalFlight = /disk1/surveys/base1/Flight
DiurnalFid = /disk1/surveys/base1/fid
DiurnalReading = /disk1/surveys/base1/diur_mag
OutputZ = /disk1/surveys/ebagoola_S/z_lev
OutputX = /disk1/surveys/ebagoola_S/x_lev
OutputY = /disk1/surveys/ebagoola_S/y_lev
OutputXover = /disk1/surveys/eba_xover
Parameters Begin
Save_Changes_Only = No
Gradient_Radius = 10.0
SurveyStyle Begin
FID_Factor = 0.1
Use_XY_Accuracy = No
#if not reconstructing flights use the following line
#
Reconstruct_Flights_by_Date = No
Reconstruct_Flight_Method = Date_Fid
Date_Style = YYMMDD
Diurnal_Style = FLIGHT_DATE_TIME
SurveyStyle End
Zfilter = None
HeadingCorrection Begin
Bearing_Corrections = {"0.0/0.10
90.0/0.10
180.0/0.02
270.0/0.05"
}
Headings =
{"0.0/0.10
90.0/0.10
180.0/0.02
270.0/0.05"
}
Library | Help | Top
© 2012 Intrepid Geophysics
| Back |
INTREPID User Manual
Library | Help | Top
Line correction and tie levelling (T30)
71
| Back |
HeadingCorrection End
ParallaxCorrection Begin
Cable_Length = 100.0
ParallaxCorrection End
DiurnalCorrection Begin
Time_Lag = 0.1
DiurnalCorrection End
GrfCorrection Begin
Sensor_Elevation = 50.0
UseClearance = No
Year = 96
Month = 08
Day = 25
GrfType = Igrf
Recalculation_Interval = 60.0
GrfCorrection End
LevelXYCorrection Begin
Radius = "5.0"
LevelXYCorrection End
LoopCorrection Begin
Max_Change = 0.01
Max_Iterations = 500
LoopCorrection End
Parameters EndProcess End
Notes
In loop closure levelling you can modify the Max_Change and Max_Iterations
parameters by changing the value in the corresponding line. See Loop closure
parameters for details.
Example 2 Polynomial levelling, Julian flight date and time - PARMS syntax
Process Begin
Name = newlevel
outputXover = /disk1/survey/eba/eba_xo1_btch
InputZ = /disk1/survey/eba/eba_mag/dtm
InputX = /disk1/survey/eba/eba_mag/X3
InputY = /disk1/survey/eba/eba_mag/Y3
inputFid = /disk1/survey/eba/eba_mag/fid
TYPEName = /disk1/survey/eba/eba_mag/linetype
inputLine = /disk1/survey/eba/eba_mag/line
inputFlights = /disk1/survey/eba/eba_mag/flight
OutputZ = /disk1/survey/eba/eba_mag/poly_dtm2
Parameters Begin
Save_Changes_Only = No
Gradient_Radius = 10.0
SurveyStyle Begin
FID_Factor = 0.8
Use_XY_Accuracy = No
Reconstruct_Flight_Method = Julian_Fid
Date_Style =YYMMDD
Diurnal_Style = JULIAN_TIME
SurveyStyle End
PolynominalCorrection Begin
Library | Help | Top
© 2012 Intrepid Geophysics
| Back |
INTREPID User Manual
Library | Help | Top
Line correction and tie levelling (T30)
72
| Back |
Level_to_Principal_Tie = Yes
Tie_line Begin
Poly_Order = 3
Piecewise_Window = 80
Smoothing_Length = 15
Tie_line End
Drift_Flights_onto_Ties = Yes
Flight Begin
Poly_Order = 2
Piecewise_Window = 80
Smoothing_Length = 5
Flight End
Drift_Traverses_onto_Ties = Yes
Traverse Begin
Poly_Order = 0
Piecewise_Window = 50
Smoothing_Length = 5
Traverse End
Drift_Ties_onto_Traverses = No
Tie_Traverse Begin
Poly_Order = 3
Piecewise_Window = 50
Smoothing_Length = 5
Tie_Traverse End
Poly_Iterations = 1
PolyTieListFile=/disk1/survey/eba/tie1.parm
PolynominalCorrection End
Parameters End
Process End
Tensor Altitude drape correction Example - Protobuf syntax
# Example task file V5.0 protbuf syntax - levelling
# Usage: fmanager -batch tensor_drape_correction.task
#
# Show an altitude correction for the FTG processing
IntrepidTask {
Levelling {
InputZ: “D:/test_data/FullTests/tensor/drape_corrections/mauritania_ftg_subset_Intrepid..DIR/
Tensor_FAlev”;
InputX: “D:/test_data/FullTests/tensor/drape_corrections/mauritania_ftg_subset_Intrepid..DIR/
X”;
InputY: “D:/test_data/FullTests/tensor/drape_corrections/mauritania_ftg_subset_Intrepid..DIR/
Y”;
inputFid: “D:/test_data/FullTests/tensor/drape_corrections/
mauritania_ftg_subset_Intrepid..DIR/GS_Fiducial”;
TYPEName: “D:/test_data/FullTests/tensor/drape_corrections/
mauritania_ftg_subset_Intrepid..DIR/GS_LType”;
inputLine: “D:/test_data/FullTests/tensor/drape_corrections/
mauritania_ftg_subset_Intrepid..DIR/GS_Line”;
inputFlights: “D:/test_data/FullTests/tensor/drape_corrections/
mauritania_ftg_subset_Intrepid..DIR/GS_Flight”;
InputHeightAboveSpheroid: “D:/test_data/FullTests/tensor/drape_corrections/
mauritania_ftg_subset_Intrepid..DIR/Altitude”;
InputRequiredHeightAboveSpheroid: “D:/test_data/FullTests/tensor/drape_corrections/
mauritania_ftg_subset_Intrepid..DIR/Drape”;
OutputZ: “D:/test_data/FullTests/tensor/drape_corrections/mauritania_ftg_subset_Intrepid..DIR/
Zout”;
ReportFile: “prolevelling.rpt”;
runType: Tensor_Level; # select the main run type
Save_Changes_Only: false;
Gradient_Radius: 10.0; # not needed
FID_Factor: 0.1;
Use_XY_Accuracy: false; # not needed
Date_Style: DECIMAL_YEAR; # not needed
Diurnal_Style: FLIGHT_DATE_TIME; # not needed
Library | Help | Top
© 2012 Intrepid Geophysics
| Back |
INTREPID User Manual
Library | Help | Top
Line correction and tie levelling (T30)
73
| Back |
# TensorCorrection parameters
FlightBiases: false; # used for a tensor heading correction
Tensor_Adjustment: Profile_Adjust_Altitude;
Tensor_Forcing: TENSORnote_Norm; # used for loop levelling a tensor signal, how to measure
convergence?
NumberSamples_EstimatePotential: 21; # the bigger the window, the smoother the result.
}}
Library | Help | Top
© 2012 Intrepid Geophysics
| Back |