1
Version 6.1
BADLEY GEOSCIENCE LIMITED
New Features in...
TT 6.130 INCREMENTAL UPGRADE
CONTENTS
Introduction...................................................................................................1
Important Notes: ...................................................................................... 1
TrapTester-to-TrapTester/Petrel Data Link .................................................2
Horizon Data-Types ......................................................................................6
Enhanced Horizon Raw Data Display ........................................................17
Composite Section Displays ......................................................................18
EarthGrid Property Modelling Update .......................................................19
Triangle-Direct Updates .............................................................................21
Well Time-Depth Curve Updates................................................................23
Enhanced Task-Based Attribute Export Tool ...........................................24
TT6.130NewFeatures
June 2013
Version 6.1
BADLEY GEOSCIENCE LIMITED
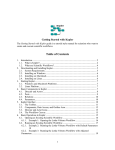
Introduction
This document describes the new headline features and enhancements that make up the
TrapTester 6.130 incremental upgrade and differentiate it from the latest 6.120 release.
TrapTester 6.130 is distributed as a patch release and can be installed as such over an
existing 6.12x installation. For a more detailed description of the new features please refer
to the relevant sections in the TT user-manual.
Important Notes:
1) A database update will be applied to TT projects when opened using TT 6.130.
A project updated for TT 6.130 will not be accessible using previous TT versions.
Please back-up projects prior to performing the database update.
2) No changes have been made to the TT license feature-set.
TT6.130NewFeatures
June 2013
1
BADLEY GEOSCIENCE LIMITED
Version 6.1
TrapTester-to-TrapTester/Petrel Data Link
Introduction
TrapTester has long supported data transfer from Petrel to TrapTester. TrapTester 6.130
extends that support to allow the data transfer between TrapTester sessions, and from
TrapTester to Petrel.
The updated link will allow export of the following data types from TrapTester:
•
3D survey, arbitrary lines (TT to TT only), navigation and BGL volume data
•
2D survey, lines, navigation and BGL volume data
•
Horizon data, pointsets and surfaces
•
Fault sticks, pointsets and surfaces
•
Fault polygons (TT to TT only)
Further updates to the link are planned to support additional data types including, but not
limited to:
2
•
Well trajectories, logs and fault/horizon picks
•
Cellular (ECLIPSE-style) grids, attributes and faults
June 2013
TT6.130NewFeatures
Version 6.1
BADLEY GEOSCIENCE LIMITED
Exporting from TrapTester
Before exporting, the companion import tool must be running in the destination TrapTester
project or Petrel instance. The TrapTester import tool may be launched from the "Import
from TrapTester..." option of the "Interpretation Data Links" or "Well Data Links" submenu
(inside the "Data" menu of the TrapTester control interface):
Alternatively if exporting into Petrel, the Badley Petrel Plugin import dialog must be opened
by double clicking the "Import from TrapTester" menu item in the "Plug-ins" group of the
"Processes" dialog in Petrel:
Note: the Badley Petrel Plugin must have been installed for this feature to be available
TT6.130NewFeatures
June 2013
3
BADLEY GEOSCIENCE LIMITED
Version 6.1
In the source project, to export from TrapTester to another running TrapTester project
choose the "Export to TrapTester..." option from the "Interpretation Data Links" or "Well
Data Links" submenu (inside the "Data" menu of the TrapTester control interface). To
export data from TrapTester to a running instance of Petrel, choose the "Export to
Petrel..." option instead.
The TrapTester export link will appear as below:
In the initial "General" tab, choose to export to a standalone file or an existing instance of
TrapTester or Petrel accessible on the local network.
Select items to export from the "Seismic" and "Interpretation" tabs. Options available for
each tab are shown to the right of the data tree. Help is displayed in the lower status bar
as the mouse is moved over the interface items.
Finally, press the "Export" button to send the selected items to the destination TrapTester
or Petrel project.
4
June 2013
TT6.130NewFeatures
Version 6.1
BADLEY GEOSCIENCE LIMITED
Once complete, the data is available in the destination TrapTester or Petrel project:
TT6.130NewFeatures
June 2013
5
BADLEY GEOSCIENCE LIMITED
Version 6.1
Horizon Data-Types
Introduction
Survey-based horizon raw data (interpretation on 2D lines and 3D rows, columns etc) is
stored by TrapTester in "Horizon Data Volumes" within the project database. Each Horizon
Data-Volume is linked to a 2D or 3D survey. A TrapTester horizon can contain any number
of Horizon Data-Volumes. Prior to the TT 6.130 update, the Horizon Data-Volume only
stored depth or TWT (Z) values but in TT 6.130 this has been extended so that other data
may be stored alongside. Each type of data, including the interpretation data itself, is
referred to as a Horizon Data-Type and requires a corresponding Horizon Data-Type
Definition in the database. The Horizon Data-Types effectively provide for multidimensional Horizon Data-Volumes - each data-type serving a different dimension.
Horizon Data-Type Definitions
When a TrapTester project is upgraded or created using TT 6.130, a number of "standard"
Horizon Data-Type Definitions are created in the project database. These can be seen in
the Database Explorer tool alongside any that have been created by the user. The "DepthTWT" data-type is a special case as it cannot be deleted and always appears at the top of
the list; it corresponds to the Horizon Data-Volumes' Z data.
Tree view of Horizon Data-Types
Horizon Data-Type Definition Editor
The tree-view shown above shows all of the current "standard" Horizon Data-Types. Each
Horizon Data-Type Definition has a "Name", "Colour", "Data-type" assignment, "Unit
domain" and a "Colourmap". Horizon Data-Type Definitions created automatically by
TrapTester (such as the standard ones shown above) have a fixed type-assignment and
units domain that cannot be changed. Horizon Data-Type Definitions created by the user
in the Database Explorer and the Horizon Volume Utility are not restricted in this manner.
The list of type-assignments for an Horizon Data-Type Definition are shown in the table
below:
6
June 2013
TT6.130NewFeatures
Version 6.1
BADLEY GEOSCIENCE LIMITED
Data-Type
Description
Depth-TWT
General picked, auto-tracked or gridded horizon Z data
Seismic Amplitude
Amplitude data from seismic volumes
Auto-track Correlation
3D auto-tracker correlation values
Auto-track Confidence
3D auto-tracker confidence values
Auto-track Sequence
3D auto-tracker tracking sequence values
Dip
Dip extraction from 2D or 3D horizon data
Dip-Azimuth
Dip azimuth extraction from 2D or 3D horizon data
Roughness
Surface roughness measure (3D data only)
Min Curvature
k1, Surface min curvature (3D data only)
Max Curvature
k2, Surface max curvature (3D data only)
Mean Curvature
(k1+k2)/2
Gaussian Curvature
(k1*k2)
Magnitude Curvature
Max (|k1|, |k2|)
Other
Any other type of data
Horizon Data-Type type-assignments
The data-type assignments are used in TrapTester applications to simplify the list of datatypes that are made available for a given task. For example, when extracting seismic
amplitude data for a horizon, only those data-types that are assigned "Seismic Amplitude"
may be selected.
The Horizon Data-Type Definition editor also contains a list of all of the Horizon Data
Volumes that have data stored for that data-type. This list is for information only and can
be used as a means of accessing the Horizon Data Volume editor window.
Horizon Data-Type & Data-Volume Removal
The deletion of a Horizon Data-Type Definition will result in the deletion of all data that it
refers to across all Horizon Data Volumes in the project.
It is not possible to delete the primary Depth-TWT data-type as this is required at all times
to provide storage of the basic horizon Z data.
The deletion of a Horizon Data-Volume will result in the deletion of all the data for all datatypes in that volume.
TT6.130NewFeatures
June 2013
7
BADLEY GEOSCIENCE LIMITED
Version 6.1
Horizon Volume Attribute Extraction
The Volume Editor has a new option on the viewer-popup menu that is available when one
or more 2D or 3D Horizon Data-Volume objects are selected. The associated horizon(s)
must have been loaded via the Surface module's horizon manager.
The Horizon Volume Attribute Extraction tool is accessed via the MB3 popup menu
Horizon->Attribute extraction option. The tool provides the means of extracting the
attribute selected in the "Attribute to extract" option. The results of the extraction will be
stored for the chosen Horizon Data-Type. The list of Horizon Data-Types will only show
those that have a type-assignment that matches chosen "Attribute to extract". If the option
"Set object-style to display this data-type" is enabled, the display-style will be set to show
the extracted data on each of the objects selected. Specific details regarding each of the
attributes are given below.
Seismic amplitude: This option will extract seismic amplitude data at all points in the
selected Horizon Data-Volumes. The "Seismic access definition" option is made available
to select the Seismic Access Definition to use. If this is left to "<use survey/line
assignment>" the extraction will use the Seismic Access Definition(s) that are assigned to
the associated survey. (For Horizon Data-Volumes belonging to 3D surveys the row
Access Definition is used while for those belonging to 2D surveys the 2D-line or linespecific Access Definition is used).
Dip & Dip-azimuth: For Horizon Data-Volumes belonging to 3D surveys the dip and dip
azimuth values will be computed where there is continuous data coverage. For 2D data
these attributes are computed in the line direction.
Roughness & Curvature: Extraction of these attributes will only operate for Horizon DataVolumes belonging to 3D surveys where there is continuous data coverage. For all other
cases the output will be set to a null value.
8
June 2013
TT6.130NewFeatures
Version 6.1
BADLEY GEOSCIENCE LIMITED
3D Auto-Tracker Optional Attributes
For this update, the Volume Editor's 3D horizon auto-tracker (in the CubeXplorer Module)
has been extended to make use of the new Horizon Data-Types system. In so doing, the
user-interface has been simplified into three flow-based tabs, Inputs, Controls and Outputs
which contain all the original interface components and the additional output options that
are described in more detail below.
The "Outputs" tab now contains options for the generation and storage of up to four datatypes to be stored as part of the output Horizon Data Volume. For each data-type there is
a Horizon Data-Type list containing items with a corresponding type assignment and a
"<None>" item. If the "<None>" item is selected no data will be stored for that data-type.
The output data-types are described below.
Seismic amplitude values: The seismic amplitude taken from the 3D seismic volume at
the auto-tracked points.
TT6.130NewFeatures
June 2013
9
BADLEY GEOSCIENCE LIMITED
Version 6.1
Correlation values: This is the raw cross-correlation value that resulted in any given autotracked point being chosen during the auto-tracking process. These values range from -1.0
to +1.0. +1.0 indicates a perfect correlation, -1.0 indicates no correlation.
Tracking confidence: For any autotracked point, P, the tracking confidence Cp is given by
Cp = CN1.CN2.CN3....CNn, where CN1 to CNn are the normalised correlation values for all the
points on the path to P from a seed point. (The normalised correlation value is computed
as CN = (C+1)/2 where C is a raw correlation value). Tracking confidence values range
from 0.0 to 1.0. A value of 1.0 is assigned to the seed point locations. Tracking confidence
values will diminish at each successive point taken by the auto-tracker along auto-tracked
paths.
Tracking sequence numbers: This is simply the number of steps the auto-tracker has
taken to get to any given point from a seed point.
10
June 2013
TT6.130NewFeatures
Version 6.1
BADLEY GEOSCIENCE LIMITED
Amplitude Extraction While Picking
The interpretation of horizons on seismic data can now be enabled to automatically extract
the seismic amplitude data whilst picking or editing. The amplitude data is stored in the
Horizon Data-Volume according to the "Active" Horizon Data-Type. The "Active" Horizon
Data-Type is controlled by a selection in the Section Module tab in the Volume Editor's
main window.
The "Active" Horizon-Data-Type list contains a "<None>" item, which, when selected,
disables the automated amplitude extraction. The "Active" Horizon-Data-Type lists Horizon
Data-Types that have a type-assignment set to "Amplitude data".
In order to visualise the results of the automated amplitude extraction while picking, it is
best to have the horizon loaded via the Surface Module and visible in a second (different)
viewer with the style set to show the horizon raw data coloured by the appropriate datatype.
TT6.130NewFeatures
June 2013
11
BADLEY GEOSCIENCE LIMITED
Version 6.1
Horizon Volume Utility Extensions
Apart from the addition of three more operations and an improved operation filter, the
Horizon Volume Utility has been extended to cater for the new Horizon Data-Types. Where
before, the operations acted solely on horizon Z-data and created new forms of horizon Zdata, they now operate on Horizon Data-Types that are sub-selections of the Horizon Data
Volumes.
As an example, it is now possible to perform a subtraction between the Depth-TWT data of
horizon volume 'A' and horizon volume 'B' and store the result in horizon volume 'A' using
a different Horizon Data-Type - called say, "Isochore". Such an operation is shown in the
image below.
Additional Operations
Out = Horizon 'A' + Constant% x ('B' - 'A'): this operation is designed to operate on the
horizon Z values (Depth or TWT) and provides a means of computing isochore layers at a
percentage value between horizons 'A' and 'B'.
Out = MAX (Horizon 'A', Horizon 'B'): the output will be the greater of the horizon 'A' and
horizon 'B' input values.
Out = MIN (Horizon 'A', Horizon 'B'): the output will be the lesser of the horizon 'A' and
horizon 'B' input values.
12
June 2013
TT6.130NewFeatures
Version 6.1
BADLEY GEOSCIENCE LIMITED
The "Control" volume
If enabled, a control volume and data-type may be specified so that the chosen operation
is only undertaken at points where the data in the control volume satisfies a given
condition. In the above example the condition is set to only perform the "Horizon 'A' Horizon 'B'" operation at points where the Depth-TWT data in Horizon 'A' is greater than
2500m. The data in the output volume is left unchanged at points where this condition is
not satisfied.
Creating a new output Horizon Data-Volume & Data-Type
It is possible to create new Horizon Data-Volumes and Data-Types using the MB3 popup
menu or clicking the "mini" menu button in the top-right corner of the relevant list and
selecting the "Create" option.
Unit considerations
With the addition of the Horizon Data-Types it is possible to perform operations and
generate output with data in different unit domains. If there is a domain conflict a warning
message will be issued prior to allowing the operation to commence.
TT6.130NewFeatures
June 2013
13
BADLEY GEOSCIENCE LIMITED
Version 6.1
Displaying Horizon Data-Types
The Volume Editor's Surface Module style system is used to control the display of data
associated with Horizon Data-Types. First, the associated horizon must be loaded via the
Surface Module's Horizon Manager.
Having loaded the horizon, the "Show Horizon Raw Data" option (under the "Surface>Horizons" tab in the Style Editor) should be enabled. It will be noticed, at this stage, that
the layout of the controls under this option has changed; the "Section-Based" controls now
being subdivided into 2D and 3D data and the "Point-Sets" controls having their own
colour-coding option.
The "Section-Based" controls include the "Colour" options. This may be set to "native (one
colour)", "by time/depth" or "by data-type".
Selecting the "by data-type" colouring option will enable the "Data-type" list, to the right.
This list will contain all of the available Horizon Data-Types. Having made a Horizon DataType selection it is possible to apply the style settings as required to the display. Note that
the Depth-TWT Horizon Data-Type is omitted from this list as the colouring coding of the
horizon data according to this property is controlled directly using the "by time/depth"
colouring option and the colour-bar at the top of the "Horizons" style settings.
Note that when applying a "by data-type" colouring mode to multiple horizons in the same
viewer that not all the horizons may have the chosen Horizon Data-Type available. In
such cases the horizon data will exhibit an out-of-range colour for the chosen Data-Type.
The colour-map and data-range used to represent the Horizon Data-Type's data is defined
in the Horizon Data-Type Definition. The editor for the Horizon Data-Type Definition may
be accessed from the Style Editor by (a) double-clicking on the Horizon Data-Type in the
list selection, (b) using the MB3-popup menu option on the Horizon Data-Type in the list
selection, or (c) clicking on the "mini" menu button in the top-right corner of the Horizon
Data-Type list and selecting the "Edit" option.
14
June 2013
TT6.130NewFeatures
Version 6.1
BADLEY GEOSCIENCE LIMITED
Horizon Data-Type Statistics
The Horizon Data-Volume Editor has been extended to provide statistical data for each of
the available Horizon Data-Types. The statistics are obtained by clicking the "Go" button or
by simply selecting a data-type from the list. The top-most item in the list is "<All>" which,
when selected, provides a text display of the statistics for all Horizon Data-Types in the
project
Histogram view
Text stats for 'Depth-TWT' data-type
Text stats for '<All>' data-types
For any data-types for which the volume contains no data the textual display indicates "NO
DATA".
For Horizon Volumes that belong to 2D surveys the text stats are displayed for each 2D
line with summary stats for all lines given at the end. The histogram display will show data
for all the 2D lines.
Accessing the Horizon Data-Type Editor
It is possible to access the editor window for the selected Horizon Data-Type from the
data-type list; use the MB3 popup menu or click on the "mini" menu button at the top right
of the list and select the "Edit" option.
TT6.130NewFeatures
June 2013
15
BADLEY GEOSCIENCE LIMITED
Version 6.1
Exporting Horizon Data-Types
ASCII export of Horizon Data-Volume's is achieved using the Horizon export option in the
Database Explorer. The Horizon Data-Volume Export window has been extended with a
Horizon Data-Type list selection. The selected data-type will be exported (as if Z-data)
from the chosen Horizon Data-Volume according to the chosen format and in the chosen
units.
The Horizon Data-Type list will only contain items for which data exists in the Horizon
Data-Volume selected for export
16
June 2013
TT6.130NewFeatures
Version 6.1
BADLEY GEOSCIENCE LIMITED
Enhanced Horizon Raw Data Display
In addition to the introduction of the Horizon Data-Types (above) a new and complimentary
display mode for horizon raw data has been added to the Volume Editor - Surface Module
style. This option allows areas of contiguous 3D horizon data to displayed as a lightshaded, solid-filled surface.
Surface Module Horizon Raw Data style controls
3D horizon data with solid fill OFF (traditional)
di l )
3D horizon data with solid fill ON
The solid fill option is not applicable to 2D horizon data or point-sets and should not be
confused with the conventional horizon surface (tri-mesh) display.
The solid fill option will use all of the contiguous data in the 3D Horizon Data Volumes. In
areas where there is little or no contiguous data the solid fill option will result in no output.
For large 3D horizon data volumes, the solid fill option can be graphically intensive and will
have a noticeable impact on display performance.
TT6.130NewFeatures
June 2013
17
BADLEY GEOSCIENCE LIMITED
Version 6.1
Composite Section Displays
When working with seismic data it is often useful to visualise a number of sections at once
in a 3D view. However, when these lines intersect with one-another the area of interest
can become obscured by the physical size of all the loaded lines. A new pop-up menu
option has been added to the Volume Editor viewer, “Define composite section”, which
enables the user to enter a mode where parts of many sections can be loaded together. In
this new mode, the composite section is defined by a series of pairwise operations
(consecutive mouse clicks). For each pair of points, TT will find the optimised route along
connected – 2D, 3D or arbitrary - survey lines (i.e. akin to a route-finder). Once finished,
the relevant sub-sections are loaded as if they were one continuous section.
Two points defining the start and end points. The
green line represents the best route.
Point 1
Point 2
The loaded composite section as defined by the
best path between picked points.
Alternatively define the path in smaller
increments. Note intermediate points (i.e. those
between picks) are also drawn.
Point 1
Point 3
Point 2
The loaded composite section as defined by the
path between picked points.
18
June 2013
TT6.130NewFeatures
Version 6.1
BADLEY GEOSCIENCE LIMITED
EarthGrid Property Modelling Update
Additional functionality has been added to both the Deterministic and Sequential Gaussian
Simulation tools for EarthGrid cellular models.
Model Masks
The interpolation and sequential Gaussian simulation tools found in the property modelling
toolkit (EarthGrid module), have been extended with additional options to select a mask by
means of defining a property model and a property filter. This enables the modelling to be
performed according to zones within a geocellular model that share some commonality
(e.g. the user may wish to model permeability, first in high V-Shale areas and then low VShale areas). The property filter uses the same interface/dialog as the display filter editor
found in the display method editor.
Filter editor
New masking optional
masking features.
TT6.130NewFeatures
June 2013
19
BADLEY GEOSCIENCE LIMITED
Version 6.1
Example
Defining the masking
attribute: SGS realisation
for VShale.
SGS
realisation
permeability using
mask .
for
no
The SGS by attribute filter: where
VShale < 0.35 then sand (yellow)
else shale (blue).
SGS
realisation
for
permeability using the above
mask (SGS with 0.35 cut-off).
Automated multi-SGS runs
The sequential Gaussian simulation (SGS) tool found in the property modelling toolkit
(EarthGrid), now has an additional option to set the number of simulation runs. Before,
each run would require repeating the same experimental process; now, this need only be
done once. Each new simulation is outputted to an automatically created attribute model.
The suite of outputs can then be processed in the property modelling tool’s calculation
tool.
New
multi-simulation
option.
20
June 2013
TT6.130NewFeatures
Version 6.1
BADLEY GEOSCIENCE LIMITED
Triangle-Direct Updates
Main Menu Access
The Triangle Direct system, a tool for quickly performing 1D fault seal analysis introduced
in TT 6.120, has been added to the main TT Control Menu as a new Utility option. The
Triangle Direct option is only available in the Control Menu when a project has been
opened. When selected, Triangle Direct will operate within the currently open project and
pre-set the project-selection form with details from the current project.
TT6.130NewFeatures
June 2013
21
BADLEY GEOSCIENCE LIMITED
Version 6.1
Project Path Control
In order to make Triangle Direct more autonomous with respect to the control of projects it
is now possible to manage the TrapTester project path(s) using Triangle Direct. This
makes it possible to choose the folder into which a new project is created rather than being
restricted to use only those currently under the control of the TrapTester Project Manager.
When using Triangle-Direct to create a new project, the "Project path" in which it will be
created can be specified by selection from the drop-list. The "+" and "X" buttons may be
used to add a new path and to remove the currently selected path, respectively. The "Add
New Project Path" dialog can be used to create new paths if they do not already exist on
the file-system.
22
June 2013
TT6.130NewFeatures
Version 6.1
BADLEY GEOSCIENCE LIMITED
Well Time-Depth Curve Updates
The Well Time-Depth Curve editor has been improved to contain a table of interval
velocities alongside the time-depth pairs. The displayed velocities are computed from the
pairs of TD values in the table thus:
Depth
D1
D2
D3
...
Dn
TWT (ms)
Velocity (m/s)
T1
V1
T2
V2
T3
V3
...
...
Tn
Vn
where Vn = 2(Dn-Dn-1)/(Tn-Tn-1)
Because the TD-pair used to compute Vn uses the nth and the n-1th TD values, the value
for V1 (the top item in the table) is meaningless and is set to zero.
The velocity values are editable in the Time-Depth Curve editor table. When a velocity is
edited it will update the time value in the same row in the table, leaving the depth value
unchanged. The change in the time value will have a knock-on effect on the velocity value
for the interval immediately beneath. Hence editing Vn will adjust Tn and Vn+1.
TT6.130NewFeatures
June 2013
23
BADLEY GEOSCIENCE LIMITED
Version 6.1
Enhanced Task-Based Attribute Export Tool
The fault-surface, horizon-surface, faultED-surface, cell-grid and cell-fault attribute ASCII
export tool (accessed from the "Control Menu->Data" menu and from the Database
Explorer "File->ASCII Export" menu) has been re-worked so that it is capable of exporting
multiple attributes in a single multi-column export file. The Attribute Export tool now uses
an improved version of the "Simple ASCII Export" format controller (used by the discrete
fracture and point-set export tools) so that the user has full control of the output file
content.
Can only select items that
have attributes available to
be exported - other items
are insensitive.
A number of basic format
files are available and new
ones can be created
Open the format
window (see below)
editor
Attribute Export Tool (for Fault Surfaces)
The attribute data that are exported is controlled by the content of the format file. A
number of simple format files for some common attributes are provided in the default
project templates. Additional formats may be created using the format editor tool which is
shown below.
24
June 2013
TT6.130NewFeatures
Version 6.1
BADLEY GEOSCIENCE LIMITED
Header style controls the
content description information
included at the top of each
output file. See Example
outputs below.
The list of data items that
can be included as columns
in the output file(s). Items
shown in red represent data
that is not available for
export in the current object
selection.
The character to use to delimit
fields (columns) in the output files.
List of data items to be
included in the output file(s),
their format controls and
export units (if relevant). Items
will be shown in red if data is
not available for export in the
current object selection.
Move
data
items up and
down in the
list to control
their column
position in the
output file(s)
Example output files showing different header options
Short header
No header
Full header
TT6.130NewFeatures
June 2013
25