1
STEPS - MANUAL
Transfer function, distortion measurement
Maximum linear displacement
Distortion-limited maximum SPL
Based on the original STEPS Manuals
Original tutorial in German by Dr Heinrich Weber
Original manuals in English prepared by Dr Ivo Mateljan
© Weber/Mateljan
Translation into English of Version 2.40D (ARTA 1.80)
Christopher J. Dunn, Hamilton, New Zealand, September 2014
Contents
1.
Introduction to STEPS .................................................................................................................... 3
1.1.
Installation requirements......................................................................................................... 3
1.2.
Equipment ............................................................................................................................... 3
1.3.
Pin assignment for cables and connectors............................................................................... 4
2.
Calibrating STEPS .......................................................................................................................... 6
3.
Measuring with STEPS................................................................................................................... 6
3.1.
Setting up in STEPS................................................................................................................ 7
3.2.
Frequency response and distortion measurements with STEPS ............................................. 9
3.2.1.
4.
Factors influencing distortion measurements................................................................ 10
3.3.
Voltage- or power-related measurements with STEPS ........................................................ 15
3.4.
Measuring maximum linear cone displacement with STEPS ............................................... 18
3.5.
Measuring THD-limited maximum SPL with STEPS .......................................................... 20
References..................................................................................................................................... 28
2
Foreword
Because of the increasing scope and complexity of the ARTA Handbook, this guide is now presented
separately to those for the other programs in the ARTA family.
STEPS is a program for measuring transfer functions and distortion in loudspeakers and audio
equipment. STEPS also provides tools for specialised measurements, including maximum linear
displacement in accordance with IEC 62458, and distortion-limited maximum SPL.
This handbook aims to familiarise users with the STEPS part of the ARTA family of programs. It is
not, however, intended to be a substitute for the original user manual, with which the reader should
familiarise him or herself.
Further information can be found on the ARTA website, which contains the most up-to-date releases
and application notes. Although we aim to continue to supplement and update this handbook in line
with the continuing development of the ARTA software, we would ask for your patience with any
discrepancies that may arise from time to time. Suggestions for improvements and corrections are
always welcome.
1. Introduction to STEPS
1.1. Installation requirements
To use the ARTA suite of programs you will need:
Operating system: Windows 98/ME/2000/XP/VISTA/Windows 7/Windows 8;
Processor: Pentium 400MHz or higher, memory 128k;
Soundcard: full duplex.
Installation is very simple. Copy the files to a directory and unzip them. That's it! All registry entries
are automatically saved at first start-up.
1.2. Equipment
The following is a brief summary of the equipment required accompanied by some basic directions
and cross-referenced to more detailed information elsewhere.
Soundcards
There are three types of soundcard:
Standard onboard soundcard, found typically on a computer motherboard;
Plug-in cards for PCI or ISA bus;
Soundcards connected via USB or firewire.
Essentially, all three types are suitable for use with STEPS if they have an output channel (Line Out)
and two input channels (Line In). Note however that onboard sound cards fitted to laptop computers
often have a single (mono) channel only, identified as the microphone input (Mic In).
Amplifier
A power amplifier with linear frequency response and power 5–10 watts is adequate. The output
impedance should be <0.05 Ohms. An inexpensive solution that meets these requirements and is small
and easily portable is the Thomann t.amp PM40C (see also ARTA-Handbook Section 5.4).
For the measurement of linear displacement (Section 3.4), or distortion-limited maximum SPL
measurement (Section 3.5) you will need something more powerful. Depending on whether hi-fi or
PA speakers are being tested, an output of 200 watts or more may be required.
3
ARTA Measuring Box
The ARTA Measuring Box is not absolutely necessary, but it does make life a lot easier. When
switching between acoustic and electric measurements, the annoyance of having to swap multiple
cables is replaced by the simple flick of a switch (see ARTA Application Note 1 (1)).
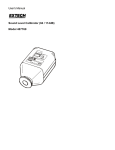
Multimeter
A multimeter for use with STEPS is not strictly necessary, but it is nevertheless indispensable for the
calibration of the measurement equipment to be used. Besides, a good meter is a useful tool for all
manner of other measurements. If you do not have a multimeter, you should ideally opt for a 'true
RMS' type. There are plenty of options on the market for well below €100.
Cables
Several cables are required, all of which should be of good quality. Poor connections, inadequate
shielding, etc. can interfere with measurements (see also ARTA Handbook Section 6.1.1). Keep all
cables as short as possible.
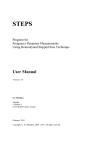
1.3. Pin assignment for cables and connectors
Unbalanced
Balanced
STEREO JACK
Sleeve: earth (GROUND/SHIELD)
Tip: +
Ring: –
XLR
Pin 1: earth (GROUND/ SHIELD)
Pin 2: +
Pin 3: –
Figure 1.3.1 Pin assignment for connecting cables.
4
5
2. Calibrating STEPS
The calibration of STEPS is no different to the calibration of ARTA (see the ARTA Handbook).
Features specific to STEPS (e.g. maximum displacement and distortion-limited maximum SPL) are
covered in the relevant sections of this document.
3. Measuring with STEPS
STEPS measures the frequency response and harmonic distortion of a loudspeaker by using a stepped
sine wave. The major commands and operations in STEPS can be found in the top menu bar.
In addition to the above, STEPS can record the
following special measurements:
Distortion vs amplitude (Section 3.3);
Linearity X vs Y (Section 3.3);
Driver displacement vs distortion (Section 3.4);
Distortion-limited maximum SPL (Section 3.5).
When working with STEPS, care should be taken to ensure that the stepped sine excitation signal
energy level is sufficient to account for noise. At the same time, output levels should be carefully
controlled to protect the DUT and soundcard.
As many of the commands and function in STEPS are the same as those in ARTA, only features
specific to STEPS will be discussed in this section.
6
3.1. Setting up in STEPS
All measurement parameters can be adjusted in 'Measurement setup' (Figure 3.1.1). The menu
window is divided into Measurement System and Stepped Sine Generator sections. A meter for
setting signal levels is provided at the bottom of the window.
Figure 3.1.1 Measurement setup in STEPS.
The available fields are as follows:
Measurement System
Measurement Mode
choose single or dual channel measurement from the drop-down menu
(see also Section 3.2).
Response channel
determines the input channel (default channel = left).
Sampling frequency
ranges from 11025Hz to 192kHz.
Min. integration time
[ms]
STEPS determines the frequency response of the signal from 'I/O Delay'
to the beginning of the 'Transient Time' by integrating the sine signal in
the time domain. This is termed the 'integration time', and its value
depends on the lowest (i.e. start) frequency to be measured. When the
lowest frequency to be measured is 'F' Hz, the minimum integration time
must be 1/F sec. so, for 20Hz, the integration time is 1/20 = 0.05 sec =
50 ms.
In addition, ARTA and STEPS filter the signal by applying Kaiser
windowing, which requires a minimum of five complete cycles (i.e.
250 ms at 20Hz). Faster measurements can be obtained only by increasing
the start frequency.
Note that the integration time relating to the lowest frequency should be
doubled when taking distortion measurements (i.e. 500 msec at 20Hz).
7
Transient time [ms]
the sine signal should be at steady state before measurements start. The
time to steady state depends on the resonance behaviour of the system or
on acoustic reverberation. For room measurements, the transient time
should be at least 1/5 of the reverberation time. For typical rooms, this
will be between 100 ms and 200 ms; for outdoor measurements the
transient time may be set to 50 ms to 100 ms
I/O delay [ms]
this is the signal delay from the speaker to the microphone (t = s ∙ c); it
must be accounted for if useful phase responses are to be obtained.
Intra burst pause [ms]
after a measurement has taken place, the system must be allowed to settle
before the next measurement begins - this is the intra-burst pause. As a
rule of thumb, it may be assumed to be 1/5 of the reverberation time.
Stepped Sine Generator
Start frequency
value of the start frequency in Hz
Stop frequency
value of the stop frequency in Hz.
Generator level
enter the generator output voltage in dB re FS.
Frequency increment
size of frequency step
Mute generator switchoff transients
eliminates clicks at the end of the signal when checked. This prolongs
measurement time a little
8
3.2. Frequency response and distortion measurements with STEPS
STEPS generates frequency response measurements similarly to ARTA. The main difference lies in
the excitation signal (see STEPS User Manual) and the duration of the measurement. Depending on
the choice of parameters, measurements can take several minutes because of the need to sum the
integration time, transient timeline and intra-burst break multiplied by the frequency Increment and
the number of octaves swept. Initial trials should therefore be carried out with conservative signal
levels and frequency resolution (1/6 octave).
Options available in STEPS include amplitude, phase,
amplitude + phase, amplitude + distortion and % distortion.
To see the correct phase relationship the path between the speaker and the microphone should be
compensated by a delay. It is difficult to determine the exact value for this parameter because of the
difficulty in determining the exact acoustic centre of the speaker (see Section 6.3).
For a reasonable approximation, we can calculate the delay as follows:
I/O delay [msec] = 1000 x measuring distance [m]/speed of sound [m/sec] c = 344 m/sec
Thus, for a measured distance of 0.5m from microphone to baffle, the delay would be 1.4534 msec.
Figure 3.2.1. Frequency response of a 6" TMT measured with STEPS with 1/12 octave resolution
As described earlier, STEPS can perform measurements in single or dual channel mode. Unlike
ARTA, however, STEPS shows the absolute current level in single channel mode with no reference.
Thus, if the output voltage of the amplifier is increased or decreased in single channel mode with
STEPS, the different frequency response levels can be seen. This is sometimes useful if you want to
determine the sound level measured by the microphone that corresponds to a particular amplifier
output voltage (Figure 3.2.2).
9
Dual Channel (-1dB to -12dB)
Single Channel (-1dB to -12dB)
Figure 3.2.2 Frequency amplitude response in dual (left) and single (right) channel modes
Dual channel mode (Figure 3.2.2, left) shows the reference level (dB re 20uPa/2.83V). Any change in
the output voltage is back-calculated by STEPS to 2.83 or 1 volt, depending on the choice of units
under 'View' and 'Sound Pressure Units'. In single channel mode, absolute changes corresponding to
the varying output voltage of the amplifier are displayed (Figure 3.2.2, right).
In addition to frequency response, STEPS is particularly suited to measuring harmonic distortion.
Measurements are less prone to noise interference than those taken using the Farina method (Chapter
7.1) but take considerably longer (depending on the settings used).
Different results (dB or %) can be displayed in STEPS by using the buttons on the menu bar.
M+D = Magnitude + Distortion
D% = Distortion %
Figure 3.2.3 Distortion measurement display options
3.2.1. Factors influencing distortion measurements
Distortion measurements may be influenced by both the measuring equipment and the environment,
with environmental effects increasing with the measurement distance. This will limit the extent to
which measurements can be compared and leads to the need for some experimentation with
measurement distances in order to gauge levels of interference.
To exclude environmental effects, measurements should be taken under nearfield conditions.
Critical distance
V = room volume (m3); T60 = reverberation time (sec)
10
If nearfield measurements are used, care should be taken to ensure that the microphone does not
distort. The AES2 specification (2) states that measurements should be carried out at around 10% of
the rated power of the speaker; this is typically ≥90dB at a distance of 1m. At this level, in a nearfield
environment the microphone would register a level of around 120dB, which is enough to drive most
inexpensive models beyond recommended limits.
The following example illustrates this point. Three microphones were compared: an inexpensive
model (MM-1 T-Bone, costing around € 35), a mid-range model (Audix TM1, around € 300), and a
class 1 reference microphone (NTI M2210, cost around € 1100). Figure 3.2.4 compares THD, D2, D3
and D4 traces for the T-Bone and M2210.
THD: t-Bone (grey)
D2: t-Bone (blue)
D3: t-Bone (red)
D4: t-Bone (green)
Figure 3.2.4 Comparison of T-Bone MM1 and NTI M2210.
11
The traces indicate that the T-Bone is not sufficiently accurate for distortion measurements. The
Audix TM1, however, is a much better candidate, with responses very similar to those obtained with
the reference microphone (Figure 3.2.5).
THD: Audix (grey)
D2: Audix (blue)
D3: Audix (red)
D4: Audix (green)
Figure 3.2.5 Comparison of Audix TM1 and NTI M2210.
The comparison demonstrates among other things that the use of cheap equipment is not worthwhile,
given the precision required for distortion measurements.
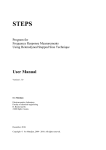
Other factors can also affect results, notably room boundary conditions. Figure 3.2.6 shows distortion
measurements in dB and % on a 5" TMT speaker taken under nearfield conditions at 10, 25 and 40cm.
12
Figure 3.2.6 Distortion (amplitude and %): nearfield and at 10, 25 and 40cm (from top).
With increasing distance, the room influence becomes more noticeable in both frequency and
distortion traces. Figure 3.2.7 shows direct comparisons of % distortion traces for nearfield and 40cm
measurements. Increasing distance not only makes the traces noisier, but it also contributes to overall
apparent distortion.
13
THD: FF (red), NF (blue)
D2: FF (dark blue), NF (light blue)
D3: FF (red), NF (dark blue)
D4: FF (green), NF (brown)
Figure 3.2.7 Distortion traces (%). Comparisons of nearfield and 40cm farfield measurements.
The examples demonstrate the factors to be considered when making reproducible distortion
measurements. They include signal and sound pressure levels, the quality of the microphone and its
distance from the speaker, and the contribution of room reflections. The measurement setup should
account for these factors as much as possible in order to optimise results.
14
3.3. Voltage- or power-related measurements with STEPS
In addition to the functions described above in Section 3.2, STEPS has four further special functions
under the 'Record' menu. These stepped amplitude tests measure system response and distortion as a
function of the amplitude of the excitation signal, a sine or two-sine signal with a user-defined
frequency. The amplitude of the signal changes from the lowest to the highest value in a predefined
number of measurement steps. These tests are primarily intended for power amplifier, audio
compressor and automatic gain control systems, and include the following:
Distortion vs amplitude
Linearity function
Loudspeaker displacement/distortion
Loudspeaker distortion-limited SPL.
The distortion vs amplitude function is used to measure voltage- or power-related distortion in
electrical (e.g. amplifier) and electroacoustic (e.g. speaker) systems. Power values must be worked out
manually according to P = V2/R, where R is the reference resistance, and may be added to the X axis
by hand.
Figure 3.3.1 Distortion vs Amplitude window
The input fields for the measurement parameters are to the left of the window in Figure 3.3.1, while
the settings for graphics and overlays are at the bottom. Under 'General
Distortion Measurement', different evaluation modes can be selected
(THD, IMD DIN, CCIF IMD), together with the input channel and
sampling rate. For more information see the STEPS User Manual.
Measurement parameters are set under 'Excitation sine voltage range'
(frequency, start and stop values, linear or logarithmic voltage increase,
number of steps). The maximum output voltage is recorded in the 'Stop value' field. This is calculated
from the gain of the power amplifier with a safety margin to a maximum of 3dB (see also section 3.2).
Before measuring, check whether the DUT is likely to be damaged by the voltages that will be
applied!
15
Figure 3.3.2 shows distortion in a small power amplifier at 1kHz as a function of voltage. Notes on
measurement and setup can be found in Section 5.4 of the ARTA Handbook.
Figure 3.3.2 THD vs voltage @ 1kHz for a small power amplifier.
Figure 3.3.3 Left: THD vs voltage at different frequencies; right: THD at 3 volts.
Figure 3.3.3 (left) shows THD at different frequencies in relation to voltage for a 5" woofer. The right
panel shows distortion as a function of frequency at about 3 volts. The distortion readings at 3 volts in
the right-hand panel for all frequencies correspond to those in the left-hand panel where each
individual frequency trace crosses 3 volts on the X axis.
16
Figure 3.3.4 Linearity Function window (X vs Y).
Under 'Linearity Function', the relationship between two quantities can be measured. Available
options are shown under 'Measurement Channels' (Figure 3.3.4). Both left and right channels can be
selected for either excitation or recording.
Figure 3.3.5 shows a simple linearity test for a cheap onboard soundcard.
Figure 3.3.5 Onboard soundcard linearity test.
17
3.4. Measuring maximum linear cone displacement with STEPS
The maximum linear displacement of a driver determines its maximum undistorted SPL across a
given frequency range. AES2 (2) defines this as:
The voice-coil peak displacement at which the 'linearity' of the motor deviates by 10%.
Linearity may be measured by percent distortion of the input current or by percent deviation
of displacement versus input current. The manufacturer shall state the method to be used.
This recommendation has been extended by Klippel (3) and is now included in the standard IEC
62458: Sound system equipment - electroacoustical transducers - Measurement of large signal
parameters. The same standard has been implemented in STEPS since release 1.4.
The measurement setup for the determination of peak linear displacement is shown Figure 3.4.1.
Figure 3.4.1 'Klippel Light' measurement setup.
Figure 3.4.2 shows the 'Loudspeaker Displacement/Distortion' window. Although full functionality is
described in ARTA Application Note AP7 (1), a safety feature not included in 'Distortion vs
Amplitude' is discussed here. This is the 'THD break value', whereby a voltage cut-off can be set to
protect the system under test.
Figure 3.4.3 shows distortion vs voltage for a tweeter with two different crossovers (18dB, 6dB slope)
at 2.6 kHz. Here the tweeter has handled the applied voltages better than expected, and the break
value of 1% has not been reached.
18
Figure 3.4.2 Loudspeaker Displacement/Distortion window.
18 dB XO
6 dB XO
Figure 3.4.3 Distortion vs voltage for a tweeter with two different crossovers (f = 2fs).
19
3.5. Measuring THD-limited maximum SPL with STEPS
To assess loudspeaker performance, we need in, addition to frequency-and impedance response,
information on directivity and the achievable limits to which the speaker can be driven. This last
factor is particularly relevant to PA loudspeakers. Manufacturers tend to quote excessively optimistic
sensitivity and power characteristics for their drivers (see also Figure 3.5.4). Effects such as
compression, partial vibration and the limits of displacement of the driver membrane tend to be
glossed over, and the theoretical capabilities of drivers are often greatly overstated (4), especially at
high and low frequencies.
The determination of THD-limited maximum SPL with STEPS solves this problem. A pure sine wave
at predetermined frequency intervals is used to determine SPL at given distortion levels.
Caution: the procedure is carried out at VERY high sound levels!
Before carrying out measurements of this type, the following should be observed.
Use ear protection. The sound levels developed are capable of causing irreparable hearing
damage.
Protect your speakers! Read this whole section completely before starting to test.
The measurement of THD-limited maximum SPL of drivers and speaker cabinets requires
suitable equipment and the right measurement environment. Ideally, these will include a
professional measurement microphone with a high maximum SPL capability, an anechoic
chamber (RAR) and a high-power amplifier. Problems with the measurement microphone or
environment can significantly affect results (see also section 3.2.1).
Notwithstanding the above, however, comparative measurements are of course also possible with
semi-professional equipment and in normal rooms.
Figure 3.5.1 shows the Distortion Limited Levels window with its functions. The main header menus
are as follows:
File
Open - Opens binary files with measurement data (.msp)
Save As - Saves data as binary .msp file
Export - Exports data in ASCII or Excel CSV format.
Edit
B/W - Switches display between black and white and color
Copy - Copies the current graph to the clipboard
Scale maximum level - Allows you to scale the trace, e.g. to correspond to measurement at 1
meter (adds/subtracts the value entered from the trace)
The footer control buttons are as follows:
Record - Start the measurement. Clicking again stops the measurement
Copy - Copies the current graph to the clipboard in .bmp format
B/W - Switch between black and white and color
Setup - Opens the Graph setup menu
Overlay - Opens the overlay menu
Cancel - Closes the window without saving the setup
OK - Closes the window and saves the current setup.
20
Figure 3.5.1 Distortion Limited Levels window.
The controls on the left side of the window have the following functions:
Measurement channels
SPL channel - Selecting the input channel for the microphone (default = line in left)
Measure excit. voltage - Measures the output voltage of the power amplifier when the box is
ticked
Sampling rate (Hz) - Selects sampling frequency
Excitation sine range
THD limit (%) - Enter the THD limit (termination criterion)
Start freq. (Hz) - Enter the start frequency
Stop freq. (Hz) - Enter the stop frequency (see note)
Freq. resolution - Frequency resolution (1/1, 1/6, 1/9, 1/12 octave)
Level step (dB) - Choice of resolution level (0.5, 1.0, 1.5, 2.0dB)
Power reduction factor - Input a value between 2 and 1000 describes the ratio of signal
duration + pause duration to signal duration. This ratio is proportional to the ratio of peak
power to the total power output during signal generation
Integration constants
Transient time (ms) - Enter the time to steady state (see also Section 3.1).
Note: STEPS needs at minimum the second and third harmonics in order to be able to calculate THD
in this part of the program. The upper frequency limit is determined accordingly by the sampling rate
of the sound card (96kHz sampling rate = upper frequency limit of 12kHz).
The menu item 'Setup' at the bottom of the window opens the Graph Margins menu (Figure 3.5.2).
The chart axes are defined here.
Frequency range
High (Hz) - Defines the upper frequency limit
Low (Hz) - Defines the lower frequency limit
21
SPL range (dB re 20uPa) section
Top (dB) - Defines the upper level limit in dB
Range (dB) - Defines the level range in dB
Excitation Voltage (dBV) section
Top (dBV) - Defines the upper voltage limit in dB
Range (dBV) - Defines the voltage range in dB
Show excitation voltage - The measured excitation voltage is plotted when this is activated.
Note: If the 'Microphone used on' checkbox in the Audio Devices Setup menu (Figure 3.5.6) is not
activated, 'Distortion Limited Level' is shown in dBV, otherwise 'Distortion Limited SPL' is shown in
dB.
Figure 3.5.2 Graph Margins menu.
The measurement setup for THD-limited maximum SPL is shown in Figure 3.5.3. For the maximum
SPL measurement, determination of the voltage being delivered by the power amplifier is not
absolutely necessary (right input), but it does provide additional control over the excitation level used
during measurement. For this reason, the complete measurement set-up is described here.
Figure 3.5.3 Setup for THD-limited maximum SPL measurement.
It takes a lot of power to get 10% THD from a speaker. As an example, Figure 3.5.4 shows a BoxSim
simulation for maximum load and input voltage for a small PA monitor. The maximum load capacity
is defined by either maximum displacement or electrical load.
As stated earlier, this simulation is somewhat optimistic, but it shows that in the region above 200Hz
the THD-limited maximum SPL measurement of this speaker would need to be carried out at 100–200
watts – assuming that the 5% to 10% THD limit is reached before the speaker fails altogether. For
testing at a low frequency, however, as little as 10–50 watts would suffice.
22
Figure 3.5.4 Theoretical maximum load of a small PA monitor (BoxSim).
The use of power amplifiers at these levels is guaranteed to overload the right input channel of the
soundcard and cause irreparable damage, so a voltage divider is mandatory. The component values
will depend on the amplifier's output.
Although we know that high-power amplifiers are needed to THD-limited measurements, for practical
reasons the following example uses the Thomann t-amp discussed in the ARTA Handbook and the
soundcard specifications shown in Figure 3.5.5.
Figure 3.5.5 Soundcard line in specifications, ESI UGM96 (Instrumenteneingang = input specs;
unsymmetrische 6.3mm Klinke = unbalanced 6.3mm jack; Max. Eingangspegel = max. input level; Agewichtet = A-weighted; Impedanz = impedance).
Maximum soundcard input voltage UIN MAX = +4.5dBV = 1.0 * 10^(4.5/20) = 1.679V RMS
Soundcard input impedance ZIN = 500kOhm
Amplifier power P = 25 watts (see note and Figure 3.3.2).
Note: It is not always a good idea to rely on manufacturer's specifications. The t-amp is rated at 36
watts into 8 ohms, but Figure 3.3.2 suggests that in reality this should be 24 watts. Thus, rather than
turning the volume control to its maximum, the input sensitivity of the power amplifier and the
maximum output voltage of the sound card should be adjusted. Back off the volume until, with 0 dBFS
feeding in from the sound card, the amplifier output just stops clipping. This should be the maximum
excitation voltage for measurement, and should form the basis for calculation of the voltage divider
components.
23
Using Ohm's law, the maximum output voltage is calculated for a load
impedance Z = 8 ohms as follows:
U = SQRT (P * Z)
U = SQRT (25 * 8) = 14.14V
GIN = UIN MAX/UOUT AMP MAX = 1.679/14.14 = 0.1187 = –18.51dB
Thus, a voltage divider giving about 19dB of attenuation is required.
G = R2 / (R1+ R2)
[1]
R1 = (R2 / G) – R2
[2]
For a value of R2 = 100 ohms, R1 is calculated as follows [2]:
R1 = (R2/G) – R2 = (100/0.1187) – 100 = 742.45 ohms (→820 ohms)
GIN = 100/(820+100) = 0.1087 = –19.28dB
Note: The Zener diodes shown in grey are not strictly necessary, but offer additional protection for
your sound card input. If you do not like using Zener diodes they can be omitted (see also ARTA
Application Note 1 – The ARTA Measuring Box (1)).
Figure 3.5.6 Audio Devices Setup.
The value calculated for the attenuating effect of the voltage divider is entered in the 'Ext. right
preamp gain' field in Audio Devices Setup.
After this is done, calibration can begin using the setup shown in Figure 3.5.3. To do this, use the sine
wave generator in Measurement Setup (Figure 3.5.7) with the generator set to e.g. –30dB re FS and a
test frequency that can be measured reasonably accurately with your multimeter.
This will be the signal that is sent to the power amplifier and used to adjust the output voltage.
UCalib = UAMP/G, where G = 10(Generator Level/20) = 10(3/20) = 1.413
and, for our example, UCalib = 14.14/1.413 = 10.00V
This completes the calibration.
24
Figure 3.5.7 Measurement Setup.
Before beginning the first measurement, please bear in mind the following (4):
For robust results, distances between the measurement setup and reflecting surfaces should be
much greater than the distance between the speaker and microphone (see also ARTA
Handbook Section 6.3).
Familiarize yourself with the likely limits of the speaker before carrying out maximum level
measurements. Is mechanical or thermal overload likely to cause failure? A preliminary
simulation in e.g. AJ-Horn or BoxSim could help here. In principle, woofers are more
mechanically vulnerable, while crossover-protected midranges and tweeters tend to
experience thermal failure (see Figure 3.5.11).
In speakers without protection circuitry, crossover components may also be at risk of thermal
overload.
Carry out a preliminary test at 'normal' levels in STEPS or in ARTA with the Farina method:
use approximately 10% of the rated power of the speaker. This is likely to indicate any
potential weak points in the speaker under test.
Adjust the lower frequency limit carefully. Do NOT start the maximum level measurement at
a frequency significantly below the resonant frequency of the speaker. This is especially true
for midranges and tweeters. Bass reflex speakers should not be tested any more than half an
octave below the tuning frequency.
THD limits have been shown to be between 1% and 3% for hi-fi speakers, and 5% to 10% for
PA systems (4).
Start your measurements as a precaution with a high Power Reduction Factor (e.g. 50-100).
This gives the voice coil time to cool down.
Take care not to choose full frequency resolution, the smallest step and high THD limit for
the first measurement, as such a measurement will take a long time and will place a heavy
load on the speaker.
If the peak power handling of the speaker is known, and the power amplifier can deliver a
peak power PMAX, Power Reduction Factor should = Pmax/P.
Assume as a precaution that tweeters will only tolerate 1–2 watts of continuously supplied
sine wave power. For our above-mentioned 25 watt t-amp power amplifier, the Power
Reduction Factor would be 25/2 = 13.
Figure 3.5.8 shows a 3% THD-limited maximum level measurement for a 3.5-inch full-range driver in
a bass reflex enclosure. The measurement was performed at 20cm, and is level-corrected ('Edit' →
'Scale'). The red curve shows the measured maximum level in dB and the grey curve the excitation
voltage in dBV.
25
Figure 3.5.8 Measurement of a 3.5" full-range driver up to THD = 3%.
We know that the amplifier can only provide power up to about 23 dBV or 14.10 volts. For this
speaker, this is obviously insufficient to achieve the chosen THD limit of 3% from about 1.5kHz.
Figure 3.5.9 shows the same speaker measured at 0.5%, 1.0% and 3.0% THD. The individual curves
were generated using the overlay function. Here, even without the addition of the Excitation (dBV)
axis, we can see that around 2kHz the amplifier is unable to supply enough power because the red and
blue traces are superimposed.
Figure 3.5.9 Measurement of a 3.5" full-range driver (THD = 0.5%, 1.0% and 3.0%).
26
Figure 3.5.10 Varying frequency resolution and step increments.
Figure 3.5.10 shows a measurement taken with a 0.5% THD limit at differing frequency resolution
and step increments. The blue trace was generated with 1/3 octave resolution and 1dB step levels,
while the red trace shows 1/12 octave resolution and a 0.5dB step level. The improved resolution and
closer approximation to the defined THD limit is obtained at the price of a much longer measurement
time and a greater load on the device under test.
Have fun taking THD-limited maximum SPL measurements, but do make sure that your tests do not
end up causing the kind of damage shown in Figure 3.5.11!
Figure 3.5.11 Test victims.
27
4. References
1. ARTA Support [Internet]. [cited 2014 Sep 21]. Available from:
http://www.artalabs.hr/support.htm
2. AES. AES2-2012: AES standard for acoustics - Methods of measuring and specifying the
performance of loudspeakers for professional applications – Drive units. 2012.
3. Klippel GmbH. Measurement of Peak Displacement Xmax (performance-based method)
[Internet]. 2012 [cited 2014 Jul 26]. Available from: http://www.klippel.de/nc/knowhow/application-notes.html?sword_list%5B0%5D=an4
4. Four Audio | Monkey Forest. MF Audio Measuring System [Internet]. 1999 Dec [cited 2014 Jul
27]. Available from: http://www.four-audio.com/en/products/monkey-forest.html
28