1
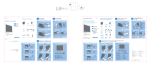
SPECTRA VIEWER
Product Description and User’s Manual
PRODUCT NAME: spectraViewer
VERSION: v0.3.1
RELEASE DATE: 2012-04-13
AUTHOR: Bartosz Lew
SpectraViewer:
version 0.3.1
Bartosz Lew1, ∗
1
Toruń Centre for Astronomy, Nicolaus Copernicus University, ul. Gagarina 11, 87-100 Toruń, Poland
(Dated: April 13, 2012)
The spectraViewer program is a dedicated application to present on-the-fly the intermediate frequency (IF)
spectral gain characteristics of the IF amplifiers used for the super-heterodyne receivers installed on 32-m radio
telescope in Piwnice.
It is a TCP/IP based client for plotting and collecting data sent from a server that interfaces the communication
with the HP8591b spectrum analyzer, used to analyze the IF signals from the 32-m radio telescope after first
down (frequency) conversion.
Its capabilities also include support for radio telescope (RT) connectivity in order to record the current telescope time and position along with the history of the IF gain characteristics.
I/O is based on the standard FITS files.
I. PURPOSE AND INFRASTRUCTURE
The spectraViewer program was written to visualize the spectra of the IF signals coming from the focus cabin of the 32-m
radio telescope (RT32) after first (frequency) down conversion. The spectra is calculated using the HP8591b spectrum analyzer
connected and controlled via HP-IB cable to the PC computer called microlab. On this computer a network TCP/IP server called
analink (written by Eugeniusz Pazderski) is installed. The server is used by the spectraViewer program to communicate with the
spectrum analyzer in terms of few simple commands.
Additionally, spectraViewer uses VXI TCP/IP server and client program located at computer called newfs. This server is used
for selecting the requested IF channel. The IF signals fed into the four IF channels (A, B, C, D) are defined by the current setting
of the “distribution” and their configuration is discussed in a separate document.
rt4
RT-32m SERVER
spectraViewer
newfs
VXI SERVER
microlab
SPECTRUM ANALYZER
SERVER
SPECTRUM ANALYZER
HP8591B
Figure 1: spectraViewer TCP/IP connections map.
∗ [email protected]
2
Additionally spectraViewer may communicate with the RT-32m control server for acquiring the current position of the telescope.
II. CONFIGURATION
The crucial configuration options for the successful program operation are the networking options located in
“Edit>Preferences>Network”. The relevant server IP and port combinations are stored in the combo-boxes for settings of the
“IF servers” and “RT control server”. Use the default settings for these servers as described in Sec. I.
III. USAGE
The spectraViewer program has been installed on personal computer (PC) - trao3 - working under Linux Debian (Lenny). It
can be started from the command line after logging in as oper@trao3.
oper@trao3:~$ spectraViewer
Figure 2: Main window of the spectraViewer program without extra features (left) and with extra features (right). Use “Tools>Show” extra
features option to toggle between the two views.
The four controllable spectrum analyzer parameters are1 :
• fa (= 0) [MHz] - lower frequency limit in the viewed IF spectra
• fb (= 1800) [MHz] - upper frequency limit in the viewed IF spectra
• rl (= 0) [dbm] - reference level w.r.t. which the spectrum is calibrated. By default it is 0 dbm: i.e. 0db w.r.t. 1 mWatt
signal.
1
In brackets the default values were given.
3
• vb (= 3) [MHz] - video bandwidth filter settings. This controls the low-pass filtering of the signal after it is detected in
the spectrum analyzer. The wider video bandwidth makes the output signal pass-filtering less aggressive, resulting in the
noisier spectra but better resolving temporal narrow-band spike-like RFI signals.
The narrower video bandwidth makes the output signal low-pass filtering more aggressive, which results in a smoother
spectra but better suited for detecting weak, and relatively broad-band, non-transient signals. Since the spectraViewer
allows for time averaging of the spectra and hence noise reduction for the typical use it is useful to have vb as large as
possible (by default it is set to 3MHz).
In the simplified operation mode the spectraViewer allows for:
• acquiring the current settings of the spectrum analyzer, defined by the four parameters fa , fb , rl , and vb (button “Get
status”).
• setting the four spectrum analyzer parameter (button “Set all”)
• selecting IF channel (combo-box “channel”)
• activating displaying (recording) the IF spectra (button “Show/Record spectra”)
• over-plotting the single readout spectra (“Tools>Show single spectra”)
• over-plotting the time averaged spectra (“Tools>Show integrated spectra”)
• saving the recorded and integrated spectra to FITS file.
IV. EXTENDED OPTIONS
When the “Tools>Show extra features” option is checked, the program will display buttons that allow setting individual
spectrum analyzer parameters.
Note that it takes some time to send and execute the commands on the spectrum analyzer.
The extended usage options allow for:
• connecting to the RT-32 server
• acquiring and storing the history of the current position information from RT-32 server (option “Tools>Record RT position”)
• storing all spectra readouts (option “Tools>store all spectra”)
• simple scaling of the spectra plot
• saving all the recorded spectra and RT-32 position information to FITS file.
A.
Changing channels
Whenever the IF channel selection is changed, or different spectra analyzer parameters are set, the average spectra information
is reset and integrated anew. Also, all the stored spectra and related RT-32 information (option “Tools>store all spectra”) are
reset and collected anew.
V. FILES
A.
Single spectra and average spectra FITS files data
When a file is saved using “File>Save as fits” command this file format will be used. The header of the binary table called
“spectra” in the first Header Data Unit (HDU) stores all important information about the setup including the spectrum analyzer
parameters, selected channel, date and time of the measurement, and (if the “Tools>Record RT position” option is checked) the
RT position information. The contents of the binary table consists of 4 columns: the first two contain the information on the last
recorded single spectra, and the last two contain the information on the integrated average spectra. The first columns for each of
the spectra types contain the frequency and the second columns contain the spectra information.
4
B. All spectra FITS files data
When a file is saved using “File>Save all as fits” command, this file format is used. In this format each file contains two
HDUs (binary tables). In the first one, all collected spectra are stored, while in the second one all spectrum analyzer and
telescope information is stored.
In the first binary table in every column a full spectra from a single readout is stored. The subsequent readouts are stored in
columns with indexes increasing with time.
In the second binary table in every column the full information on the corresponding spectra from the first binary table is
stored. The contents of the individual rows are also described in the header information. These include
1. JD - Julian date at the time of the readout
2. RA - right ascension of the RT-32 when the time of the readout [deg]
3. DEC - declination of the RT-32 when the time of the readout [deg]
4. A - RT-32 azimuth (counting from the North eastwards) [deg]
5. h - RT-32 elevation [deg]
6. epoch - epoch [year]
7. channel - IF channel (0 - A, 1 - B, 2 - C, 3 - D)
8. fa - spectrum analyzer parameter
9. fb - spectrum analyzer parameter
10. rl - spectrum analyzer parameter
11. vb - spectrum analyzer parameter
VI. EXAMPLES
A. Detecting the RFI from the local radio stations.
Using the time averaged spectra is useful for detection of weak non-transient RFI signals like radio-stations. An example of
the integrated and single spectra displayed in the “spectra view” window of the spectraViewer is shown in Fig. 3.
Figure 3: Radio stations RFI as seen in spectraViewer program.
The radio stations signals clearly stand out in the integrated spectra (blue curve) above the noise levels inferred from the single
spectra readout. In the right panel the integration time is shown and updated. The spectral features strongly coincide with the
radio stations frequencies as shown in Fig. 4.
5
Radio Gra Bydgoszcz
Radio Maryja RTCN Plock
Polskie Radio Program 1 RTCN Bydgoszcz
Radio ZET RTCN Konin
RMF Classic SLR Torun
Radio Eska Torun
Radio Maryja RTCN Konin
Polskie Radio Program 3 RTCN Konin
Radio 103,5 Roxy FM Bydgoszcz
Radio Plus Bydgoszcz Bydgoszcz
Radio dla Ciebie RTCN Plock
Polskie Radio Program 3 RTCN Bydgoszcz
Radio Maryja Torun
Radio PiK RTCN Bydgoszcz
RMF FM RTCN Konin
Radio ZET RTCN Plock
Polskie Radio Program 2 RTCN Bydgoszcz
Radio Wawa Torun
Radio ZET RTCN Bydgoszcz
Polskie Radio Program 3 RTCN Plock
Radio Plus Torun
RMF FM RTCN Bydgoszcz
Polskie Radio Czworka Torun
70
Radio Gra Torun
Polskie Radio Program 1 RTCN Konin
Power [dbm]
65
Merkury Polskie Radio RTCN Konin
Polskie Radio Program 1 RTCN Plock
(A,h)=(355,25) [deg], date: 2012-04-12, 19:59
106
107
75
80
87
88
89
90
91
92
93
94
95
96
97
f [MHz]
98
99
100
101
102
103
104
105
Figure 4: Radio stations RFI as seen in spectraViewer program. The data plotted were saved to fits file and re-plotted with radio stations
information. The date and time of the measurement was also saved in the fits file header along with the radio telescope orientation as indicated
in the plot title.
B. Observing transient RFI signals.
In order to trace the transient RFI signals the spectraViewer program allows for continuous recording of all spectra information
along with (optionally) the telescope position information. To enable these options check “Tools>Record RT position” and
“Tools>Store all spectra”. The spectra are recorded when the “Show/Record spectra” button is checked - i.e. when the “spectra
view” window is open. The acquisition of the spectra stops when the “spectra view” window is closed. At this time the recorded
spectra are still in the memory and can be saved using “File>Save all as fits”.
However when the “spectra view” window is closed and re-opened again all the recorded information is cleared and the spectra
acquisition starts anew. This is also indicated by the status bar message indicating the total count of the recorded spectra. Any
change in the spectrum analyzer parameters also results in clearing the stored spectra buffer.
An example of recorded observation allows for making a dynamical maps of RFI signals based on the data stored in the FITS
files as showed in Fig. 5.
6
Figure 5: Gain characteristics spectra history recorded over a period of about 140 seconds.
7
VII. SOURCES
A.
Download
The spectraViewer program is available for download via anonymous CVS using:
oper@trao3:~$ cvs -d :pserver:[email protected]:/home/cvs co
spectraViewer
To checkout the version “v0.3.1” use:
oper@trao3:~$ cvs -d :pserver:anonymouscosmos.astro.umk.pl:/home/cvs co -r v_0_3_1
spectraViewer
B. Dependencies
There is a substantial amount of self-developed libraries that the spectraViewer depends on and they also need to be installed
and configured for the proper compilation and linking.
Required dedicated libraries:
• mscsfn - http://cosmos.astro.umk.pl/ blew/mscs.php (available @ CVS)
• CPEDS - http://cosmos.astro.umk.pl/ blew/cpeds.php (available @ CVS)
• rt32common - library common to all programs related to 32-m radio telescope devised by the author (available @ CVS)
• rtscan - http://cosmos.astro.umk.pl/ blew/scan_simulator.php (available @ CVS)
• ocraToolkit - (available @ CVS)
Other standard required libraries:
• qt - version >= 4.6
• kdecore, kdeui - version
• gsl
• nova
• fftw3
• cfitsio
• qca
Other optional packages:
• hdf5 - (ver.>=1.8) if not available, remember to edit the spectraViewer.pro file and set the appropriate compiler flag
-DNO_HDF5 (default)
C.
Compilation
VIII. CHANGE LOG
This section will cover list of important updates to the program if such will be needed.
8
IX. TROUBLESHOOTING
A.
I cannot change the spectrum analyzer settings. What can I do ?
This may happen when the spectrum analyzer server (called analink) on the microlab computer has problems in (re-)setting the
hp8591b spectrum analyzer unit. A restart of that server might be required. Currently this isn’t supported via the spectrViewer
program. It is planned that such tool will be supported in the next version of the program.
For no obvious reason resetting the spectrum analyzer server not always brings the hp8591b unit back to the reasonable values.
Few cycles of reset might be required. This is an evolving issue.
B. The data saved by spectraViewer as FITS file cannot be viewed by fv program installed on trao3. Why?
Get a newer fv program. The data are stored correctly. It is a fits file handling program problem.