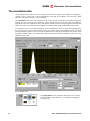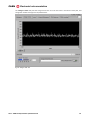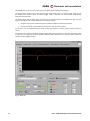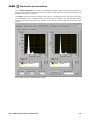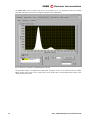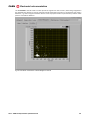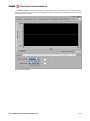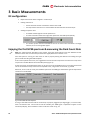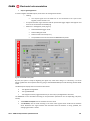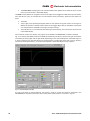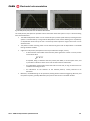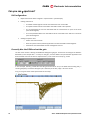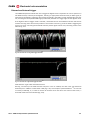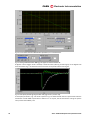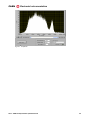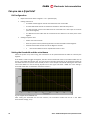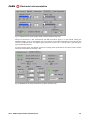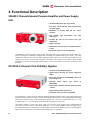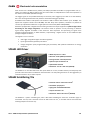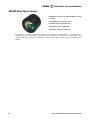
1
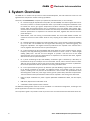
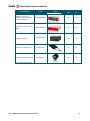
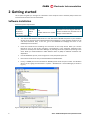
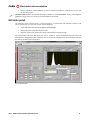
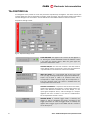
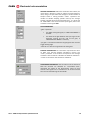
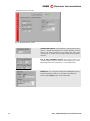
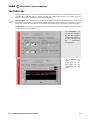
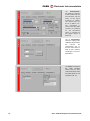
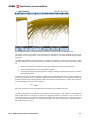
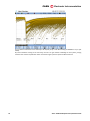
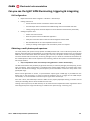
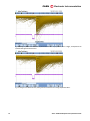
CAEN Tools for Discovery n Electronic Instrumentation 2484 1. Rev. 2 - 11 November 2011 GD2473 SiPM Development Kit QuickStart Guide Rev. 5 - 25 March 2014 Purpose of this Guide This QuickStart Guide contains basic information and examples that will let you use SIPM educational Kit in few steps. Change Document Record Date May 2011 July 2011 November 2011 May 2012 December 2012 March 2014 Revision 00 01 02 03 04 05 Changes Initial release. n.a. Revised all chapters; new document format Revised §Software Installation in chapter 2 Revised chapters 1 and 2 Revised LabVIEW requirements in Tab. 2.1 Symbols, abbreviated terms and notation AMC FPGA DPP FPGA OS PSAU ROC FPGA SiPM Acquisition & Memory Controller FPGA Digital Pulse Processing Field Programmable Gate Array Operating System Power Supply & Amplification Unit ReadOut Controller FGPA Silicon Photo-Multiplier Reference Documents DT5720 User Manual UM1935 – CAENDigitizer User & Reference Manual GD2783 - First Installation Guide to Desktop Digitizers & MCA CAEN S.pA. Via Vetraia, 11 55049 Viareggio (LU) - ITALY Tel. +39.0584.388.398 Fax +39.0584.388.959 [email protected] www.caen.it © CAEN SpA – 2014 Disclaimer No part of this manual may be reproduced in any form or by any means, electronic, mechanical, recording, or otherwise, without the prior written permission of CAEN SpA. The information contained herein has been carefully checked and is believed to be accurate; however, no responsibility is assumed for inaccuracies. CAEN SpA reserves the right to modify its products specifications without giving any notice; for up to date information please visit www.caen.it. CAEN Electronic Instrumentation 3 2473 – SiPM Development Kit QuickStart Guide CAEN Electronic Instrumentation 2473 – SiPM Development Kit QuickStart Guide 4 CAEN Electronic Instrumentation 1 System Overview The SiPM Kit is a modular set-up based on Silicon Photo-Multipliers, the state-of-the-art sensors for low light detection with photon number resolving capabilities. The full kit, called Educational, comprises (a simplified kit, called Evaluation, is also available): Nr. 1 Power Supply & Amplification Unit (PSAU, ID code SP5600). The PSAU supplies the bias for the sensors, features a variable amplification factor up to 50 dB and integrates a feedback circuit to stabilize the sensor gain against temperature variations. Moreover, the PSAU includes one leading edge discriminator/channel and a coincidence circuit for flexible event trigger logic. Sensors housed in dedicated mechanical holders can be directly connected to the PSAU. The PSAU technical specifications are reported in the relevant data sheet, together with the front and rear panel description. SiPM Holders, each one housing an Hamamatsu MPPC 1x1 mm2 model S10362-11-100C. The mechanical structure of the holders allows an easy coupling of the holders themselves with the PSAU. Nr. 1 Desktop Waveform digitizer (ID code DT5720A), with 2 input channels sampled at 250 MS/s by a 12 bit ADC. The DT5720A runs the Digital Pulse Processing for enhanced triggering and integration capabilities. The Digitizer technical specifications are reported in the relevant User’s manual, together with the front and rear panel description. Nr. 1 ultra-fast LED Driver (ID code SP5601) with pulse width at ns level, tunable intensity, pulsing frequency internally/externally generated and FC interface to either a clear or a Wave Length Shifting (WLS) fiber. The LED unit was designed to provide a low-cost tool for the SiPM characterization and its technical specifications are reported in the relevant data sheet, together with the front and rear panel description. Nr. 1 plastic scintillating tile (ID code SP5602). Scintillation light is collected by a WLS fibre, FC terminated at its tips and ready-to-mount on the PSAU. The tile, with a sensitive volume of 100 x 100 x 10 mm3, provides an easy-to-use access to beta emitting isotope and cosmic ray detection. Its technical specifications will be reported in the coming soon data sheet. Nr. 1 mini-spectrometer for gamma ray detection (ID code SP5603), engineered as special holder to be directly mounted on the PSAU. Two different heads are provided, housing a series of crystals, including a CsI one, bound to be interfaced to a sensor matrix. The spectrometer heads were designed to make easy a full range of basic gamma spectrometry educational experiments. The main features of the spectrometer heads in will be reported in the coming soon data sheet. External AC/DC stabilized 12V power supplies (Meanwell GS40A12-P1J 40W, 12V DC Output, 3.34A). USB cables, Optical Fibres and Power cords A LabView™ based Graphical Users’ Interface The different building blocks of the kit can be assembled in a customized configuration, according to the specific application and the user’s requirements. The scope of this guide is to provide a hands-on primer on the use of the essential functionalities of the kit. 5 2473 – SiPM Development Kit QuickStart Guide CAEN Electronic Instrumentation Item description Code Image Education al kit Evaluation kit SP5600 - 2 Channels General Purpose Amplifier and Power Supply WSP5600XAAAA yes yes DT5720A - 2 Ch. 12 bit 250 MS/s WDT5720AXAAA yes yes SP5601 - Led Driver WSP5601XAAAA yes Yes SP5602 - Scintillating Tile WSP5602XAAAA yes No SP5603 - Mini Spectrometer WSP5603XAAAA yes no Tab. 1.1: Building blocks of the kit 2473 – SiPM Development Kit QuickStart Guide 6 CAEN Electronic Instrumentation 2 Getting started This chapter will guide you through the installation of the Graphical Users’ Interface (GUI) and the first measurements based on the use of the PSAU. Software Installation Minimum system requirements: OS Windows XP/Vista/7 (32/64-bit) Hardware 2 available USB2.0 ports CAEN drivers required DT5720 USB driver (32/64bit) SP5600 USB driver (32/64bit) Third-party software required LabView™ Run-Time Engine 2009 SP1 (32-bit Standard RTE) available free of charge at the NI website. Tab. 2.1: host PC requirements You need to download the USB drivers for both DT5720 and SP5600 compliant to your Windows version (32 or 64-bit) and the LabView based Control Software (a single package compliant to 32 and 64-bit Windows OSs). To do this, go to the SP5600A KIT webpage and click on the Software/Firmware section: Install the DT5720 drivers following the instruction of the setup wizard. When you connect DT5720 to your PC the OS will recognize it automatically. If the automatic installation fails, perform it manually from the Device Manager by selecting the driver update and pointing to the driver folder you downloaded from CAEN website. Refer to [RD3] for detailed installation OSdependent. Connect SP5600 to your PC; it will recognize as a new peripheral by the OS. Please select as driver the one you downloaded from CAEN website. Finally, a COMM port will be associated to SP5600; please check the port number. For Windows XP you can do it going to Control Panel -> System -> Hardware tab -> Device Manager (as shown in Fig. 2.1) Fig. 2.1: Tracking the PSAU port assignment on a PC running Windows XP 7 2473 – SiPM Development Kit QuickStart Guide CAEN Electronic Instrumentation Unzip the SiPM kit Control Software; it doesn’t require an installation, a double click on the .exe file will make it work. Important Note: Releases of the SiPM Kit Control Software ≥ 0.6-build20120520 strictly need a digitizer USB Driver release ≥ 3.4.7 if running in a 32-bit Windows environment. GUI main panel The GUI main panel is structured as a “virtual instrument”: its appearance and operations imitate a real central system (Fig. 2.2). Three sub-panels may be identified: Upper-left panel: tabs refer to the Digitizer PSAU SP5600 Bottom-left panel: tabs address the DT5720 Right-hand side panel: visualization of the measurements and data storage. The bottom-right side of the GUI allows the user to retrieve or save a configuration file with all the set parameters for the digitizer and the PSAU, to save the current visualized data on the visualization tabs and the plots in the active tab as image files. Fig. 2.2: GUI main panel 2473 – SiPM Development Kit QuickStart Guide 8 CAEN Electronic Instrumentation The DIGITIZER tab In the digitizer tab is possible to set all the parameters requested by the digitizer: the active channel, the input DC offset, the channel threshold, the trigger mode, the trigger, the gate and the baseline parameters and the settings for the coincidence. The tab include also information about connection and errors. Acquisition settings sub tab: Fig. 2.3: “Acquisition settings” sub tab START DIGITIZER: the digitizer tab is inactive till the digitizer is on. Pushing the “START DIGITIZER” button the software create a link with the physical device. After the green light the parameters tab become active. CHANNEL ON/OFF: the channels involved in the data readout of the digitizer. When one channel is active, the correspondent “input DC offset” and “threshold” controls are enabled. INPUT DC OFFSET: it is a percentage shift of the input range scale (=2 Vpp), allowing the dynamic range to be shifted from 2.0/0 V up to 0/2.0 V. -50% is its minimum value and it corresponds to -2.0/0 V dynamic range. 0% corresponds to a 1.0/+1.0 V dynamic range. The control is enabled when the correspondent channel is active. CHANNEL THRESHOLD: it represents the threshold over delta, allowing the detection of the pulses, in auto-trigger mode. The delta is the difference between the current sample, i.e. the input signal sampled at time t, and the average of a samples digitized “rise time” ns before t. The control is enabled when the correspondent channel is active. TRIGGER MODE: if “internal trigger mode” is selected, the digitizer is able to self-detect the signals, according to the trigger parameters. If “external trigger mode” is selected, the digitizer wait a trigger signal on the LEMO “TRG IN” connector on the front panel. 9 2473 – SiPM Development Kit QuickStart Guide CAEN Electronic Instrumentation TRIGGER PARAMETERS: Before the calculation of the delta, the input signal is filtered in order to reduce the high frequency noise, using a low pass filter that averages a certain number of samples within a moving window. “mean” represents the number of double sampling periods used by the average window; allowed values for the parameter are 1, 2, 4, 8, 16 and 32. “RISE TIME” is the rise time of the input signal, used in the calculation of the signal delta. GATE PARAMETERS: “gate” represents: The width of the gate signals, if “FIXED GATE MODE” is selected: The width of the gate between the input signal under threshold crossing and the end of the gate, if “MATCHED GATE MODE” is selected; “pre gate” is the advance between the gate generation and the trigger leading edge. “hold-off” is a veto for the generation of other gates. BASELINE PARAMETERS: the “threshold” represents the value on delta, over that the baseline calculation is frozen. The “mean” parameter is the number of samples for the average calculation of the baseline. 0 disables the baseline restoration. “no flat” is the veto for the calculation of baseline. COINCIDENCE PARAMETERS: the coincidence can be selected if both the channels are switched on. “Coincidence time” represents the width of the discriminator signal of each channel. Two signals are in coincidence if all of them exceed their own threshold during this time width. 2473 – SiPM Development Kit QuickStart Guide 10 CAEN Electronic Instrumentation Connection & errors sub tab: Fig. 2.4: “Connection & errors” sub tab CONNECTION HANDLE: once the device is opened, the function returns a handle that becomes the unique identifier of that device; any access operation to the device will take place according to its handle, thus making transparent the physical channel. ROC & AMC FIRMWARE RELEASE: these fields contain the current firmware release running on the mainboard (i.e. on the ROC FPGA) and on the mezzanine (i.e. on the AMC PFGA). ERROR OUT: any error given back by the CAENDigitizer library which the program stands on, is reported in the field code. Please, refer to [RD2] for the return codes table. 11 2473 – SiPM Development Kit QuickStart Guide CAEN Electronic Instrumentation The PSAU tabs The PSAU tabs allow the user to set and monitor all the PSAU parameters. They become active after the communication with the PSAU is started, through the “START PSAU” button. This button opens the communication with the PSAU by the selected COMM Port. Important Note: if you wish to set and monitor all the PSAU parameters in Standalone mode, you shall use the PSAU Control Software: unzip the PSAU Control Software; it doesn’t require an installation, a double click on the .exe file will make it work; only the PSAU tabs of SiPM kit Control Software will be displayed.). The Bias/Gain tab provides the switchers for the two channels enabling the settings of the bias, the gain and the temperature compensation. The “Bias/Gain” tab provides the switchers for the two channels enabling the settings of the bias, the gain and the temperature compensation. The “T monitor” shows temperature of two SiPM and temperature of board. 2473 – SiPM Development Kit QuickStart Guide tab the the the the 12 CAEN Electronic Instrumentation The “Discriminator” tab allows the settings of the threshold of the discriminators and the width of the signal produced as output. The output level can be set as NIM or TTL. The coincidence is active if the two PSAU channels are switched on. The coincidence signal is provided on the digital output 0 (DOUT 0) The “T compensation” allows the setting of the coefficient dV/dT for both the channels. The compensation acts on the bias of the sensor to keep its gain constant, according to a linear VT dependence. The “Errors” tab contains the PSAU firmware release and the error code of the library which the PSAU stands on and reported in Tab. 2.2. 13 2473 – SiPM Development Kit QuickStart Guide CAEN Electronic Instrumentation Error code PSAU_Success PSAU_InvalidComPortError PSAU_TooManyClientsError Value 0 -1 -2 PSAU_CommunicationError PSAU_InvalidHandleError PSAU_InvalidHandleError PSAU_InvalidCommandError PSAU_InvalidParameterError PSAU_DeviceNotFound -3 -4 -5 -6 -7 -8 Meaning Operation completed successfully Error related to the COM port Max. nr. of PSAUs simultaneously manageable exceeded. Communication error Invalid device handler Unspecified error Invalid command error Invalid parameter error Device error (e.g. hardware or firmware issue) Tab. 2.2: PSAU library return codes 2473 – SiPM Development Kit QuickStart Guide 14 CAEN Electronic Instrumentation The visualization tabs The visualization tabs allow the user to manage and visualize the signals of the SiPMs. The “Histogram”, “charge vs time”, “wave” and “2 channel Histograms” tabs refer to the digitizer. The other two, “PSAU Staircase” and “PSAU counting”, refer to the PSAU. The “Histogram” tab shows the histogram of the active channel according to the PSAU and digitizer settings. The user can change the refresh rate in the meaning of the access to the buffer of the digitizer: high refresh rate means high access rate to the digitizer and low number of integral signals transferred; low refresh rate means low access rate to the digitizer, but a big amount of data transferred for each access. The properties of the X scale of the histogram can be selected by the user: the origin of the histogram (in the meaning of the minimum plotted charge value), the number of bins (which determine the end of the plotting window) and the bin size. These values determine the range of the histogram that will be stored pushing the “SAVE” button. The prefix of the histogram output file saved can be written by the user in the “Histo file name” field. Fig. 2.5: “Histogram” tab The graph palette of the histogram allows the user to change the visualization of the spectrum, i.e. enlarging the histogram, zooming it, etc. 15 2473 – SiPM Development Kit QuickStart Guide CAEN Electronic Instrumentation The “charge vs time” tab plots the charge versus time. The user can zoom in and zoom out the plot, and change the number of charges for the plotted mean. Fig. 2.6: “charge vs time” tab 2473 – SiPM Development Kit QuickStart Guide 16 CAEN Electronic Instrumentation The “wave” tab shows the trace of the analog and digital signals read from the digitizer. The analog signals are the trace of the input and the virtual probe, which, in internal trigger mode, can be the delta or the baseline signal. If external trigger mode is selected, the virtual probe automatically switches on baseline only. The digital signals are the Gate (red), the Time Over Threshold (yellow), the Holdoff time (blu), the Flat signal i.e. the signal that visualize the baseline calculation (violet): the gate, flat and over threshold signals represent the digitizer selected parameters; the over threshold is generated when the signal is over the set threshold; All the trace can be amplified with the Scale control and moved in vertical position with the Position control. The switch on the bottom-left side of the tab changes the plotting mode from a continuous stream of data to single shot. In single shot mode the update of the plot stops, and the user has to push “SHOT” button for visualize another triggered signal. Fig. 2.7: “Wave” tab 17 2473 – SiPM Development Kit QuickStart Guide CAEN Electronic Instrumentation The “2 channel Histograms” tab allows for managing the histogram plots from the two channels of the digitizer simultaneously. In the three sub tabs it is possible to plot, reset and save the two histograms, the histogram sum and the correlation. The “Histos” sub tab contains two histogram plots, where it is possible to set the x-axis origin, the number of bins and the bin size in a dedicated menu common to both the channels, the reset histograms button and the saving menu (output file prefix, common to both the files, and the SAVE button to perform the saving) Fig. 2.8: “Histos” sub tab of “2 channel Histogram” main tab 2473 – SiPM Development Kit QuickStart Guide 18 CAEN Electronic Instrumentation The “Histo Sum” sub tab contains the plot of the histogram sum. This histogram results from adding channel0’s histogram to channel1’s histogram multiplied by an alpha factor. Fig. 2.9: “Histo Sum” sub tab of the “2 channel Histograms” main tab The parameter alpha is configurable by 0.001/step. Histogram reset can be performed by the “RESET HISTO” button and the plot can be saved by the “Save” button with a user-defined prefix written in the “HistoSum file name” field. 19 2473 – SiPM Development Kit QuickStart Guide CAEN Electronic Instrumentation The “Correlation” sub tab shows a scatter plot of the signals from the 2 sensors, after being integrated in the specified time window. It may be of help for specific applications relying on a simultaneous use of the 2 detectors, e.g. when using the scintillator tile for cosmic ray experiments or 2 spectrometry heads for 22Na positron annihilation detection. Fig. 2.10: “Correlation” sub tab of the “2 channel Histograms” main tab 2473 – SiPM Development Kit QuickStart Guide 20 CAEN Electronic Instrumentation The “PSAU staircase” tab allows the interaction with the PSAU in order to produce the so-called SiPM staircase: the plot shows the frequency of the signals which are over the threshold, during a scan from the “min thr” value up to “max thr.” value. The user can change these limits, the step, the number of read point which produce the mean plotted value and the gate width for the counting. Fig. 2.11: “PSAU staircase” tab Plot data can be saved by the “save staircase” button with a user-defined prefix of the output file written in the “PSAU name file user” field. 21 2473 – SiPM Development Kit QuickStart Guide CAEN Electronic Instrumentation The “PSAU counting” tab plots the frequency of the signals over the threshold set in the “Discriminator” tab for the active channel. The user can change the number of points for the plotted mean value and the gate width for the counting. Fig. 2.12: “PSAU counting” tab 2473 – SiPM Development Kit QuickStart Guide 22 CAEN Electronic Instrumentation 3 Basic Measurements Kit configuration Required elements: PSAU + Digitizer + Oscilloscope Cabling instructions: o the kit elements shall be connected to the PC via the USB o the output from Channel 0 or 1 of the PSAU shall be directed to the oscilloscope Getting the system alive: o The PSAU and the Digitizer shall be powered on o The GUI launched and the Port assignment specified in the PSAU panel (below). o The Control system shall be activated for the fun to start! If the CommPort is wrongly selected, an error message will appear. Enjoying the first SiPM spectrum & measuring the Dark Count Rate Note: the measurements described in this chapter have been performed by using the SiPM Kit Control Software release 0.6. The tabs here presented can slightly differ from releases > 0.6. Once the system is running, the first action to take is properly biasing the detector and setting the right gain to avoid saturating the PSAU amplifier. As far as the optimal sensor bias, it is suggested to stick to the value reported on the sensor ID card, which may be set in the Bias & Gain tab of the PSAU panel (Figure 3). At the same time, the amplification factor can be set and, since the SiPM for the current measurement will not be illuminated and only a few cells are expected to fire, a high value can be used, e.g. 40 dB. Moreover, for the sake of clarity, the feedback system for the SiPM gain stabilization against temperature variations can be disabled. Fig. 3.1: Bias & Gain tab of the GUI panel. As long as the SiPM is biased and the oscilloscope is properly triggered (an edge trigger, in manual mode, with a threshold at the -10 mV level should be suitable), the SiPM signal is expected to appear on the oscilloscope display, with a waveform similar to what is shown in Fig. 3.2 23 2473 – SiPM Development Kit QuickStart Guide CAEN Electronic Instrumentation Fig. 3.2: SiPM output signal for a not illuminated sensor. Bias: 69.72 V; Gain: 40 db. Peak-to-peak distance: 63.13 mV. The different bands in the signal output correspond to avalanches in the cells triggered by the thermal generation of the charge carriers or by the photons associated to the avalanche development (optical cross-talk). The SiPM Geiger-Mueller multiplication factor is actually corresponding to the area underneath the single cell signal. However, the peak-to-peak distance provides a fair indication of the overall system gain, useful for checking the SiPM gain dependence on the over-voltage with respect to the breakdown set the amplification factor and avoid saturation effects set the discriminator threshold to generate a trigger condition and integrate the signal or perform counting experiments. A useful entry-level parameter is the Dark Count Rate (DCR) of the SiPM under study, namely the frequency with which avalanches occur for thermal or optical cross-talk (OXT) effects. It is a standard procedure to quantify the DCR as the counting frequency with a threshold corresponding to 0.5 x single photo-electron (p.e.) peak (DCR0.5) and to measure the OXT as OXT DCR1.5 DCR0.5 Being the numerator the Dark Count Rate with a threshold at 1.5 photoelectron peak. The DCR vs threshold can be precisely measured with the Kit. However, a fair indication can be obtained with the Oscilloscope, if the option to measure the triggering frequency is offered. In case, it is worth to exploit this feature to cross check the values against the factory measurements and as reference value for the most advanced procedures. As exemplary illustration, the DCR measurement at 0.5 Photoelectron threshold is shown in Fig. 3.3. 2473 – SiPM Development Kit QuickStart Guide 24 CAEN Electronic Instrumentation Fig. 3.3: DCR 0.5 measurement at the oscilloscope. The frequency drops to ~206 KHz increasing the threshold to 1.5 p.e. (not shown). By now and before moving to the next step, the user can gain further knowledge on the system, playing with the bias and the amplification factor and measuring the peak-to-peak and DCR variations. 25 2473 – SiPM Development Kit QuickStart Guide CAEN Electronic Instrumentation Can you see the light? SiPM illuminating; triggering & integrating Kit Configuration Required elements: PSAU + Digitizer + LED driver + Oscilloscope Cabling instructions: o the kit elements shall be connected to the PC via the USB o the LED output shall be directed to the SiPM through the FC terminated clear fiber o cabling among the kit elements depend on the undertaken measurement (see below) Getting the system alive: o Power on the kit elements o Start the system control and RUN the application o Verify the connection & error tabs for both the Digitizer and the PSAU o Bias the SiPM and set an initial amplification factor as of 0 o Initially no setting of the Digitizer and visualization panels are required Obtaining a multi-photon peak spectrum The multi-photon peak spectrum fully exploits the SiPM potential and it is the reference quantity for the detector characterisation and qualification. It corresponds to the output signal spectrum for an illuminated SiPM and carries information about the detector gain and noise, the photon number resolving capability and even the DCR and the cross talk; concerning the light source, it allows to characterize the statistics of the emitted photons. More will be reported in the following, after the first spectrum is obtained through a two-step procedure: Step 1: amplification factor and intensity tuning [LED driver + PSAU + Oscilloscope] The LED driver features the possibility to generate internally or externally the light pulse frequency; for the sake of simplicity, internal generation is considered here and the toggle switch on the back plane of the LED driver shall be set accordingly. The pulse frequency can be selected via a multi-turn rotary meter in the [6;500] kHz range. When internal generation is chosen, a synchronization output signal in NIM logic is provided from the DOUT plug on the back panel. In order to know the frequency and as a trigger for the SiPM output visualization, it is recommended to look at the synch signal at the oscilloscope. Once this is done, the SiPM output from the PSAU can be properly displayed showing a number of fired cells by far exceeding what is due to the DCR and cross-talk. Looking at the scope track, the LED intensity can be tuned and the amplification factor regulated to avoid saturating the dynamic range and inducing an artefact in the spectrum (Fig. 3.4 and Fig. 3.5). 2473 – SiPM Development Kit QuickStart Guide 26 CAEN Electronic Instrumentation Fig. 3.4: Analog output from the SiPM under test, illuminated the LED. The purple track, used as a trigger, correspondes to the synchronization signal form the LED driver. Fig. 3.5: Analog out from SiPM under test, showing onset of saturation due to a too large amplification factor. 27 2473 – SiPM Development Kit QuickStart Guide CAEN Electronic Instrumentation Step 2: signal digitization In order to digitize the SiPM output, the kit has to be configured as follows: o Cabling: The output signal form the PSAU has to be connected to the input of the Digitizer, either channel 0 or 1 o The Synchronization signal from the LED will provide the trigger edge to the Digitizer and it has to be connected to the TRGIN plug o Software: in the Digitizer panel (Fig. 3.6), Select EXTERNAL trigger mode Select FIXED gate mode Select the active channel (0 or 1) Accept default values for the GATE and BASELINE sub-panels Fig. 3.6: The DIGITIZER control panel. By now, the system is ready for digitizing the signal but, rather than doing it in a blind way, it is worth taking a guided tour of the system features, going to the VISUALIZATION panel and switching ON the WAVE mode. The WAVE panel displays the most relevant information: a. The digitized analog INPUT b. The signal BASELINE c. The integration GATE, triggered externally or internally by the Digital Pulse Processor The BASELINE can be calculated according to the parameters specified in the corresponding sub-panel, namely: The number of samples used to calculate the mean value The threshold, used to avoid including in the mean value signals which could bias the baseline value. Whenever the signal exceeds the threshold while the baseline is being updated, the averaging procedure is frozen 2473 – SiPM Development Kit QuickStart Guide 28 CAEN Electronic Instrumentation The no flat time, specifying the time interval between two updates of the baseline value. The flat time can also be shown in the WAVE display. The GATE actually defines the integration time and its edge may be triggered in different ways (see below). Once the GATE is open, its characteristics are associated to three parameters, specified in the GATE subpanel: The width The pre-gate, fully exploiting the digital power for the optimal timing with respect to the signal. It defines the position of the GATE with respect to the trigger edge, with the possibility to anticipate it, to compensate for the different timing in the signal routing. The hold-off time, a user’s defined veto following a GATE opening. The hold-off can also be shown in the WAVE display. For the sake of clarity in the display, every signal can be OFFESET and MAGNIFIED, enabled or disabled. Fig. 3.7 is showing the WAVE panel for the SiPM illuminated by the LED, for optimal tuning of the baseline and notably of the pre-gate and the gate width, depending on the time development of the SiPM signal. It is worth remarking here that the LED driver was designed to provide light pulses with a few ns duration (see the technical specifications), so the time development is dominated by the sensor response. Fig. 3.7: The WAVE display of the GUI. As long as the GATE is properly defined, the system is ready to record the spectrum, displayed in the HISTOGRAM tab. Exemplary illustration of the multi-photon peak spectrum are shown in Fig. 3.8. 29 2473 – SiPM Development Kit QuickStart Guide CAEN Electronic Instrumentation Fig. 3.8: Multi-photon peak spectrum at two different LED intensities. The multi-photon peak spectrum provides several information about the system in use; it is worth recalling here the fundamentals: The SiPM multiplication factor can be measured by the peak-to-peak distance, knowing that the system is characterized by a charge LSB of 40 fC/ADC channel and the SiPM signal is amplified by an amplification factor set by the user. The linearity and the dynamic range of the sensor can be studied as well. The photon number resolving power can be obtained at glance and its dependence on the SiPM biasing conditions studied A genuine multi-photon peak spectrum fit can provide further insight, namely: o A measurement of the width of the Gaussian peaks against the number n of cells, where a trend of the form n 2 2 0 1 2 Is expected, being 0 related to the zero-photon peak width, so to the system noise, and 1 provides an indication of the cell-to-cell variation of the characteristics. o An independent measurement of the DCR and the cross-talk, as long as these terms are included in the fitting function o An information on the statistics of the emitted photons, usually retained to be Poissonian. Moreover, the SiPM biasing can be optimized, trading-off the avalanche triggering efficiency and the spectrum quality, possibly affected by the spurious dark counts in the GATE window. 2473 – SiPM Development Kit QuickStart Guide 30 CAEN Electronic Instrumentation Can you see spectrum? Kit Configuration Required elements: PSAU + Digitizer + Spectrometer + [Oscilloscope] Cabling instructions: o The PSAU and the Digitizer shall be connected to the PC via the USB o The Spectrometer shall be connected to the PSAU in CH0 or CH1 position o The correspondent CH out from the PSAU shall be connected to an input on the front panel of the digitizer; o The correspondent DOUT from the PSAU shall be connected to the TRG IN on the front panel of the Digitizer Getting the system alive: o Power on the kit elements o Start the system control, RUN the application and start the PSAU and the Digitizer o Activate the connected PSAU channel and Digitizer channel Correctly bias the SiPM and set the gain The first action to take is biasing the SiPM and setting the right gain: set the bias according to the detector datasheet (in this example bias = 71.27V). For the gain, since the SiPM in the spectrometer application will be illuminated and a lots of cells are expected to fire, a low value can be used, e.g. 27 dB. In this example, selecting a PSAU discriminating threshold of 10 mV (in the PSAU discriminating tab), a counting frequency around the DCR @ 0.5 ph is obtained; in this way a Vpp = 20 mV is chosen. In Fig. 3.9 a typical trace of the spectrometer at the scope. Fig. 3.9: Scope trace of the spectrometer with a 137Cs source. 31 2473 – SiPM Development Kit QuickStart Guide CAEN Electronic Instrumentation External and internal trigger The SiPM development kit allows the user to trigger the digitizer for the acquisition of a source spectrum in two different ways: internally to the digitizer, selecting an appropriate threshold value (on delta signal) or externally to the digitizer, setting the discriminator threshold in the PSAU, through the PSAU discriminator tab, and using the correspondent NIM signal produced by the PSAU as a trigger signal for the digitizer itself. If the digitizer external trigger mode is selected, a threshold value on the PSAU discriminator tab shall be selected. A wrong choice of this value produce a wave similar to that in Fig. 3.10: the PSAU is triggering the signal on its noise. Increasing the threshold value the particle signal shall be clear, becoming similar to the wave of Fig. 3.11. Fig. 3.10: the wave for a wrong PSAU trigger threshold. Fig. 3.11: the wave for a right PSAU trigger threshold. How select the “right” external threshold value? Running a staircase (in the PSAU staircase tab) from -5mV to -100mV, the dark count rate decreases 137 drastically from ~2 MHz to a value below 1 kHz (Fig. 3.12). This example is performed with a Cs source of an activity of 180 kBq, so, in order to remove all the dark count rate due to the nature of the sensor, a threshold of 100 mV can be selected (Fig. 3.13). 2473 – SiPM Development Kit QuickStart Guide 32 CAEN Electronic Instrumentation Fig. 3.12: “not so much” staircase for SiPM 33-50C of spectrometer, in a run without source. Fig. 3.13: setting of PSAU threshold for NIM trigger for digitizer in PSAU discriminator tab. If digitizer internal trigger mode is selected, a threshold value (referring to delta signal) on the digitizer tab shall be selected. Fig. 3.14 shows the wave trace with correspondent delta and the gate. Fig. 3.14: wave (white) and delta (green) [Threshold =300; trigger mean =8; rise time =48]. 137 As exemplary illustration, Fig. 3.15 shows a spectrum of Cs obtained with the mini-spectrometer with the 2 Hamamatsu 33-50C SiPM coupled with a 3x3x15 mm CsI crystal; the set threshold is cutting the system noise peak and the 30KeV γ-line. 33 2473 – SiPM Development Kit QuickStart Guide CAEN Electronic Instrumentation Fig. 3.15: 137Cs spectrum. 2473 – SiPM Development Kit QuickStart Guide 34 CAEN Electronic Instrumentation Can you see a β particle? Kit Configuration Required elements: PSAU + Digitizer + Tile + [Oscilloscope] Cabling instructions: o The PSAU and the Digitizer shall be connected to the PC via the USB o The two SiPM heads shall be connected to the PSAU in CH0 and CH1 position o The CH0 and CH1 out from the PSAU shall be connected to the two input on the front panel of the digitizer; o The DOUT0 from the PSAU shall be connected to the TRG IN on the front panel of the digitizer Getting the system alive: o Power on the kit elements o Start the system control, RUN the application and start the PSAU and the Digitizer o Activate all the PSAU channels and all the Digitizer channels o o Bias the two SiPM and set an amplification factor as of 0 Setting the threshold and the coincidence When the system is up and running, the coincidence can be performed with the PSAU or internally the digitizer. If the PSAU is used to trigger the digitizer, the two channel thresholds and the coincidence width have to be set in the PSAU discriminator tab. The right choice of the two thresholds can be performed looking at the PSAU staircase run (one for each channel) as of 2.5.3: for example a threshold reducing the dark count rate of the SiPM to a level around [1;10] kHz can be set. Figure 18 shows a SiPM stair case: setting a threshold of 100-110 mV the DCR is reduced of a factor 2. Fig. 3.16: A typical 1x1 mm2 SiPM stair case. After setting the thresholds for the two channels, the coincidence width shall be set in the PSAU discriminator tab (Fig. 3.17). 35 2473 – SiPM Development Kit QuickStart Guide CAEN Electronic Instrumentation Fig. 3.17: PSAU discriminator tab for setting threshold, coincidence width and output level. When the coincidence is ON, automatically the NIM coincidence signal is on the DOUT0. Setting the EXTERNAL trigger mode on the Digitizer tab, the spectrum will be obtained triggering the system by this external coincidence signal. The digitizer gate parameters shall be set in order to have a gate fitting the signal produced by the tile. In internal trigger mode, the digitizer requires the setting of the thresholds for the two channels, and the setting of the coincidence time (Fig. 3.18). Fig. 3.18: DIGITIZER tab: two channel thresholds are set and the coincidence is ON. 2473 – SiPM Development Kit QuickStart Guide 36 CAEN Electronic Instrumentation 4 Functional Description SP5600 2 Channels General Purpose Amplifier and Power Supply Unit Variable amplification gain (up to 50 dB) Low noise, not to spoil the sensor performances for small signals Wideband, to comply with the fast sensor response Fast leading coincidence edge discriminator and time Provides the bias for the sensors with gain stabilization USB 2.0 interface Mechanical structure with an embedded SiPM 1 x 1 mm2 Dimension: 150 x 50 x 70 mm3 (WxHxD) The SP5600 is a General purpose Power Supply and Amplification Unit, integrating up to two SiPMs in a mother & daughter architecture allowing easy mounting and replacement of the sensors. The basic configuration features two channels with indipendent gain control up to 50 dB and provides the bias voltage (up to 120 V) to the sensors with gain stabilization. Each channel can provide a digital output generated by the fast leading edge discriminators. A timing coincidence of the two channels is also available. DT5720A 2 Channel 12 bit 250 MS/s Digitizer 2 Channel 12 bit 250 MS/s Digitizer Digital Pulse Processing for Charge Integration DPP-CI Best suited for PMT and SiPM/MPPC readout at low and high rates Mid-High speed signals (Typ: output of PMT/SiPM) Good timing resolution with fast signals (rise time < 100 ns) Optical Link and USB 2.0 interfaces 3 Dimension: 154 x 50 x 164 mm (WxHxD) The DT5720A is a 2 Channel 12 bit 250 MS/s Desktop Waveform Digitizer with 2 Vpp single ended input dynamics on MCX coaxial connectors. The DC offset adjustment (range ± 1 V) by programmable 16bit DACs (one for each channel) allows a right sampling of a bipolar (Vin = ±1 V) up to a full positive (Vin = 0 ÷ +2 V) or negative (Vin = 0 ÷ -2 V) analog input swing without losing dynamic resolution. The module features a front panel Clock Input and a PLL for clock synthesis from internal/external references. The data stream is continuously written in a circular memory buffer. When the trigger occurs, the FPGA writes further N samples for the post trigger and freezes the buffer that can be read by USB or Optical Link. The acquisition can continue without dead time in a new buffer. 37 2473 – SiPM Development Kit QuickStart Guide CAEN Electronic Instrumentation Each channel has a SRAM memory buffer (1.25 MS/ch) divided into buffers of programmable size (1 ÷ 1024). The readout (by USB or Optical Link) of a frozen buffer is independent from the write operations in the active circular buffer (ADC data storage). The trigger signal can be provided externally via the front panel Trigger Input as well as via the software, but it can also be generated internally thanks to threshold self-trigger capability. DT5720A houses USB 2.0 and Optical Link interfaces. USB 2.0 allows data transfers up to 30 MB/s. The Optical Link supports transfer rate of 80 MB/s and offer Daisy chain capability. Therefore it is possible to connect up to 8/32 ADC modules to a single Optical Link Controller (Mod. A2818/A3818). Dt5720 is equipped with a Digital Pulse Processing firmware for Physics Applications (DPP-CI Digital Pulse Processing for the Charge Integration). This feature allows to perform on-line processing on detector signal directly digitized. DT5720A is well suited for data acquisition and processing of signals from scintillators/photomultipliers or SiPM detectors, implementing a digital version of the traditional QDC (Charge-to-Digital Converter). The digitizer runs on real time: Self Trigger using CR-RC digital Time filter algorithm Input signal baseline (pedestal) calculation Charge Integration (with programmable gate parameters) with pedestal subtraction for energy calculation SP5601 LED Driver Width of pulse 1.1 ÷ 60 ns LED color: violet (400nm) 1500 mcd Pulse generator: internal/external Optical output connectors: FC Optical fiber included 3 Dimension: 79 x 42 x 102 mm (WxHxD) The SP5601 is an ultra-fast LED Driver with pulse width at ns level, tunable intensity and frequency that provides a low-cost tool for the detector characterization. The LED pulse generation can be triggered by an internal oscillator or by an external pulser. SP5602 Scintillating Tile Sensitive volume: 150 x 150 x 10 mm 3 Scintillator: polystyrene Light guide: embedded WLS fiber Output connectors: FC 3 Dimension: 200 x 150 x 10 mm (WxHxD) The SP5602 is a plastic scintillating tile, with a WLS fiber embedded to collect the scintillator light, FC 3 terminated. The tile, with a sensitive volume of 150 x 150 x 10 mm , is the ideal tool for tests with beta emitting isotopes and cosmic rays. 2473 – SiPM Development Kit QuickStart Guide 38 CAEN Electronic Instrumentation SP5603 Mini Spectrometer Mechanical structure for optimal SiPM to crystal coupling Crystal dimensions: 3 x 3 x 15 mm 3 Included crystals: LYSO, BGO, Csl 2 One SiPM 3 x 3 mm embedded Dimension: 40 mm (D), 35 mm (L) The SP5603 is a mini-spectrometer for gamma ray detection. The spectrometer is composed by a 2 mechanical structure that houses a scintillating crystal, coupled to a dedicated 3 x 3 mm SiPM. Three crystals (LYSO, BGO, CsI) are also provided. The spectrometer’s design allows an easy connection to the SP5600. 39 2473 – SiPM Development Kit QuickStart Guide CAEN Tools for Discovery n Electronic Instrumentation CAEN SpA is acknowledged as the only company in the world providing a complete range of High/Low Voltage Power Supply systems and Front-End/Data Acquisition modules which meet IEEE Standards for Nuclear and Particle Physics. Extensive Research and Development capabilities have allowed CAEN SpA to play an important, long term role in this field. Our activities have always been at the forefront of technology, thanks to years of intensive collaborations with the most important Research Centres of the world. Our products appeal to a wide range of customers including engineers, scientists and technical professionals who all trust them to help achieve their goals faster and more effectively. CAEN Tools for Discovery CAEN S.p.A. CAEN GmbH CAEN Technologies, Inc. Via Vetraia, 11 Klingenstraße 108 1140 Bay Street - Suite 2 C 55049 Viareggio Italy Tel. +39.0584.388.398 Fax +39.0584.388.959 [email protected] www.caen.it D-42651 Solingen Germany Tel. +49 (0)212 254 4077 Mob. +49 (0)151 16 548 484 Fax +49 (0)212 25 44079 [email protected] www.caen-de.com Staten Island, NY 10305 USA Tel. +1.718.981.0401 Fax +1.718.556.9185 [email protected] www.caentechnologies.com Electronic Instrumentation Guide GD2473 - SiPM Development Kit QuickStart Guide rev. 5 - 25 March 2014 00126-9-SIPM0-GXXX Copyright © CAEN SpA. All rights reserved. Information in this publication supersedes all earlier versions. Specifications subject to change without notice. 2473 – SiPM Development Kit QuickStart Guide 40