1
Quick Guide
ELYRA
Superresolution Systems
November 2013
Contents
Page
Contents ................................................................................................................................. 1
Introduction............................................................................................................................ 2
Starting the System ............................................................................................................... 3
Introduction to ZEN – Efficient Navigation .......................................................................... 6
Setting up the microscope................................................................................................... 11
Configuring the beam path and lasers for the LSM 780 / 710 .......................................... 14
Scanning an image with the LSM 710 / 780 ....................................................................... 20
Configuring the beam path and lasers for SIM.................................................................. 25
Taking a SIM image ............................................................................................................. 29
Processing of SIM images .................................................................................................... 33
Configuring the beam path and lasers for PALM .............................................................. 35
Taking a PALM image .......................................................................................................... 39
Processing of PALM images................................................................................................. 42
Storing and exporting image data ..................................................................................... 45
11/2013
1
Introduction
This Quick Guide describes the basic operation of the ELYRA and LSM 7 ELYRA systems with the
ZEN 2012 software.
The purpose of this document is to guide the user to get started with the system as quick as possible in
order to obtain some first images from his samples.
This Quick Guide does NOT replace the detailed information available in the full user manual or in the
manual of the respective microscope (Axio Observer).
Also, this Quick Guide is written for a user who is familiar with the basics of Laser Scanning Microscopy.
For your safety!
Observe the following instructions:
− The ELYRA and LSM 7 ELYRA microscopes, including their original accessories and
compatible accessories from other manufacturers, may only be used for the purposes
and microscopy techniques described in this manual (intended use).
− In the Operating Manual, read the chapter Safety Instructions carefully before
starting operation.
− Follow the safety instructions described in the operating manual of the microscope
and X-Cite 120 lamp.
2
01/2013
Starting the System
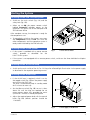
Switching on the LSM 7 ELYRA system
• Switch on the main switch (Fig. 1/1) and the
safety lock (Fig. 1/2).
• When set to ON the power remote switch
labeled System/PC provides power to the
computer. This allows use of the computer and
ZEN software offline
After complete startup, the computer is ready for
the components start.
• To completely switch on the system, now press
the Components switch to ON. This starts the
other components and the complete system is
ready to be initialized by the ZEN software.
Switching on the ELYRA system
• If the system is provided with a power remote
switch, proceed as described for the
LSM 7 ELYRA system.
Fig. 1
Power remote switch
• If the system is not equipped with a remote power switch, switch on the three individual multipoint
connectors.
Switching on the X-Cite 120 lamp
• Switch on the main switch of the X-Cite 120 lamp for reflected light illumination via the power supply
as described in the respective operating manual.
Switching on the Ar-ML Laser
• If the Ar-ML laser is required, switch it on via
the toggle switch (Fig. 2/2) on the power supply
and turn the key (Fig. 2/1).
The laser is automatically kept in standby mode
for 5 minutes to warm up.
• Set the idle-run-switch (Fig. 2/3) to run. It takes
about 50s until the laser has reached the set
output power (green LED) provided the warm
up time of 5 minutes is already completed.
• Adjust the required power level with the control
knob (Fig. 2/4) (default position should be
11 o’clock).
Fig. 2
11/2013
Power supply of Ar-ML laser
3
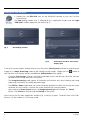
Starting the ZEN software
• Double click the ZEN 2012 icon on the WINDOWS desktop to start the Carl Zeiss
LSM software.
The ZEN loading window (Fig. 3) followed by the Application window and the Login
"ZEN 2012" window appear on the screen (Fig. 4).
Fig. 3
ZEN loading window
Fig. 4
ZEN loading window - Boot Status
display open
In the small startup window, choose either to start the system (Start System hardware for acquiring new
images) or in Image Processing mode to edit already existing images. Toggle the little
view the Boot Status display and get the additional Offline/Demo button option:
symbol to
− Choosing Start System initializes the whole microscope system and activates the entire software
package for new image acquisition and analysis.
− The Image Processing mode ignores all hardware and activates only data handling and image
processing functionality for already acquired images.
− The Offline / Demo mode reads the current hardware database but does not activate the system
hardware for use. Instead, it simulates the system hardware for training purposes.
−
Upon clicking the Start System button, the Image Processing button changes to a Cancel
button. Click Cancel to interrupt/stop the Startup of the system.
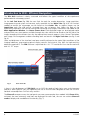
After Startup, the ZEN Main Application Window (Fig. 5 and Fig. 6) opens. To benefit from all of ZEN's
features, run the window in its full screen mode.
4
11/2013
Fig. 5
ZEN Main Application Window after Startup with empty image container
Fig. 6
ZEN Main Application Window after Startup with several images loaded
11/2013
5
Introduction to ZEN – Efficient Navigation
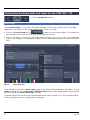
The ZEN 2012 interface is clearly structured and follows the typical workflow of the experiments
performed with microscopy systems:
On the Left Tool Area (Fig. 5/D) the user finds the tools for sample observation, image acquisition,
image processing and system maintenance, easily accessible via four Main Tabs (Fig. 6/1). All functions
needed to control the microscope can be found on the Ocular Tab, to acquire images use the
Acquisition tools (Fig. 6/3 and 4). Arranged from top to bottom they follow the logic of the
experimental workflow. The area for viewing and interacting with images is centered in the middle of the
Main Application Window: the Center Screen Area. Each displayed image can be displayed and/or
analyzed with many view options available through view tabs which can be found on the left side of the
image. According to the chosen view tab, the required view controls appear in View Control Tabs below
each image. File management and data handling tools are found in the Right Tool Area (see Fig. 5 and
Fig. 6).
Color and brightness of the interface have been carefully adjusted to the typical light conditions of the
imaging laboratory, guaranteeing optimal display contrast and minimal stray light for high-sensitivity
detection experiments. The ZEN software is optimized for a 30" TFT monitor but can also be used with
dual-20" TFT setups.
Fig. 7
Show all mode
A focus in the development of ZEN 2012 was to fulfill the needs of both basic users and microscopy
specialists. Both types of users will appreciate the set of intuitive tools designed to make the use of a
confocal microscope from Carl Zeiss easy and fast:
The Show all concept ensures that tool panels are never more complex than needed. With Show all deactivated, the most commonly used tools are displayed. For each tool, the user can activate Show all
mode to display and use additional functionality (Fig. 7).
6
11/2013
Fig. 8
ZEN Window Layout configuration
More features of ZEN 2012 include:
− The user can add more columns for tools to the Left Tool Area or detach individual tools to
position them anywhere on the monitor. To add a column, drag a tool group by the title bar (e.g.,
Acquisition Parameter) to the right and a new tool column automatically opens. Alternatively use
the context menu "move toolgroup to next column". To detach a tool, click on the little icon on
the very right end of the blue tool header bar (Fig. 8).
− Another unique feature in Imaging Software is the scalable ZEN interface. This Workspace Zoom
allows adjustment of the ZEN 2012 window size and fonts to the situational needs or your
personal preferences (Fig. 8).
− Setting up conventional confocal software for a specific experiment can take a long time and is
often tedious to repeat. With ZEN these adjustments have to be done only once – and may be
restored with just two clicks of the mouse. For each type of experiment one can now set-up and
save the suitable Workspace Layout. These configurations can also be shared between users.
− For most controls, buttons and sliders, a tool tip is available. When the mouse pointer is kept over
the button, a small pop-up window will display which function is covered by this tool/button.
These are just some of the most important features of the ZEN interface. For a more detailed description
of the functionality for the ZEN 2012 software, please refer to the User Manual that is provided with
your system.
11/2013
7
Setting up a new image document and saving your data
To create a new image document in an empty image container, click the Snap
Set Exposure
button. For an empty image document press the New
or
or the
buttons.
The new document is immediately presented in the Images and Documents panel of the Right Tool
Area. Remember, an unsaved 2D image in the active image tab will be over-written by a new scan.
Multi-dimensional scans or saved images will never be over-written and a new scan will then
automatically create a new image document.
Acquired data is not automatically saved to disc. Make sure you save your data appropriately and back it
up regularly. The ZEN software will ask you if you want to save your unsaved images when you try to
close the application with unsaved images still open.
There is no image database any more like in the earlier Zeiss LSM software versions.
Fig. 9
8
New image document in the Open Images Areas
11/2013
Advanced data browsing is available through the ZEN File Browser (Ctrl + F or from the File menu). The
ZEN File Browser can be used like the WINDOWS program file browser. Images can be opened by doubleclick and image acquisition parameters are displayed with the thumbnails (Fig. 10). For more information
on data browsing please refer to the detailed operating manual.
Fig. 10
11/2013
File Browser
9
Turning on the lasers
ZEN 2012 operates all lasers automatically. Whenever they are used (manually or by the Smart Setup
function) the lasers are turned on automatically. The Laser Life Extender function of the software shuts
all lasers off if ZEN is not used for more than 15 minutes.
To manually switch lasers on or off:
• Click the Show all tools tickbox and open the Laser tool. All available lasers can be operated within
this tool (Fig. 11).
→
Fig. 11
10
Laser Control tool
11/2013
Setting up the microscope
Changing between direct observation and laser scanning mode
The Locate and Acquisition buttons switch between the use of the microscope and the LSM 7 ELYRA:
• Click on the Locate button to open the controls for the
microscope beam path and for direct observation via the
eyepieces of the binocular tube, lasers are blocked.
Locate selected
• Click on the Acquisition button to move back to the
LSM system.
Acquisition selected
11/2013
11
Setting up the microscope and storing
settings
Click on the Locate tab for direct observation;
press the Oculars Online button for your actions
to take effect immediately. Then open the Ocular
tool tab to configure the components of your
microscope like filters, shutters or objectives
(Fig. 12).
Selecting an objective
• Open the graphical pop-up menu by clicking on
the Objective symbol and select the objective
lens for your experiment (Fig. 12).
• The chosen objective lens will automatically
move into the beam path.
Focusing the microscope for transmitted light
• Open the graphical pop-up menu by clicking on
the Transmitted Light icon (Fig. 13).
• Click on the On button. Set the intensity of the
Halogen lamp using the slider.
• Clicking outside the pop-up control closes it.
Fig. 12
Microscope Control window of the
Axio Observer.Z1
• Place specimen on microscope stage. The cover
slip must be facing the objective lens. Remember the immersion medium if the objective
chosen requires it!
• Use the focusing drive of the microscope to
focus the object plane.
• Select specimen detail by moving the stage in X
and Y using the XY stage fine motion control.
12
11/2013
Setting the microscope for reflected light
• Click on the Reflected Light icon to open the
X-Cite 120 Controls and turn it on.
• Click on the Reflected Light shutter to open
the shutter of the X-Cite 120 lamp.
• Click on the Reflector button and select the
desired filter set by clicking on it.
Storing the microscope settings
Microscope
settings
can
be
stored
as
configurations (Fig. 14) by typing a config name in
the pull-down selector and pressing the save
button. Fast restoration of a saved config is
achieved by selecting the config from the pulldown list and pressing the
load button. The
current config can be deleted by pressing the
delete
button.
Fig. 13
Microscope Control window with
Transmitted Light pop-up menu
Fig. 14
Configuration panel
These configurations can be assigned to buttons
that are easier to press.
Depending on the microscope configuration,
settings must be done manually if necessary.
11/2013
13
Configuring the beam path and lasers for the LSM 780 / 710
• Click the Acquisition button.
Smart Setup
The tool Smart Setup is an intuitive, user-friendly interface which can be used for almost all standard
applications. It configures all the system hardware for a chosen set of dyes.
• Click on the Smart Setup button
to open the smart setup window. This window can
be accessed any time from the software to change dye combinations.
• Click on the arrow in the dye list and simply choose the dye(s) you want to use in your experiment
from the list dialogue. In this dialogue, the dyes can be also searched by typing the name in the search
field.
Fig. 15
Smart setup tool
Once finished with the input, Smart Setup suggests four alternative considerations (see below): One for
Fastest imaging, one for the Best signal, Smartest (Line) between both speed and best signal and the
optimal setup for later linear unmixing of the dyes.
The graphs display relative values for the expected emission signals and cross-talk. The resulting imaging
scheme (single or multitrack) is shown below the graphs.
14
11/2013
Fig. 16
11/2013
Proposals panel of the Smart Setup tool
15
Motifs
The feature Motifs is part of the Smart Setup panel. Like in photography, common imaging conditions
with typical requirements also exist in laser scanning microscopy.
The different Motifs are presets of scanning parameters (pixels size, pinhole diameter, scan speeds etc.)
addressing such conditions (Fig. 17).
Upon selecting one of these options by mouse click the selected icon will be highlighted. If the motif
Current is clicked, the current set of scanning parameters will be left untouched.
• Pressing the Apply button applies the selected proposal in Smart Setup as well as the motif.
Fig. 17
The Motifs are presets for typical imaging tasks. The selected
motif is highlighted.
If the option Linear unmixing is selected, the system is set in the lambda mode automatically.
button will then optimize the settings of the Gain (Master) and offset
Pressing the Set Exposure
for the given laser power and pinhole size. Further image optimization from this point can be done easily.
16
11/2013
Setting up a configuration manually
Simultaneous scanning of single, double and triple labeling:
− Advantage: faster image acquisition
− Disadvantage: potential cross-talk between channels
Sequential scanning of double and triple labeling; line-by-line or frame-by-frame:
− Advantage: Only one detector and one laser are switched on at any one time. This reduces crosstalk.
− Disadvantage: slower image acquisition
• Open the Light Path tool in the Setup Manager tool group and the Channels tool in the
Acquisition Parameter tool group to access the hardware control window to set-up the beam path.
The open Light Path is shown in Fig. 18.
→
Fig. 18
11/2013
Light Path tool for a single track (LSM)
17
Settings for track configuration in Channel Mode
• Select Channel Mode if necessary (Fig. 18).
The Light Path tool displays the selected track configuration which is used for the scan procedure.
• You can change the settings of this panel using the following function elements:
Activation / deactivation of the excitation wavelengths (check box) and setting of
excitation intensities (slider). If necessary open the Laser Control tool (see above).
Selection of the main dichroic beam splitter (MBS) for visible and invisible light from the
relevant list box.
Selection of an emission filter through selection from the relevant list box.
Activation / deactivation (via check box) of the selected channel (Ch 1-4, monitor diode
ChM, QUASAR detectors ChS1-8, transmission ChD) for the scanning procedure and
assigning a color to the channel.
• Select the appropriate filters and activate the
channels (Fig. 18).
• Click the Laser icon to select the laser lines and
set the attenuation values (transmission in %) in
the displayed window (Fig. 18).
• For the configuration of the beam path, please
refer to the application-specific configurations
depending on the used dyes and markers and
the existing instrument configuration (Fig. 19).
• The Detection Bands & Laser Lines are displayed
in a spectral panel (Fig. 19) to visualize the
activated laser lines for excitation (vertical lines)
and activated detection channels (colored
horizontal bars).
Fig. 19
Detection Bands & Laser Lines
display
• For storing a new track configuration open the
Channels tool in the Acquisition Parameter
tool group, click
and enter a desired name
in the first line of the list box (Fig. 20), then click
Ok to store the configuration.
• For loading an existing configuration click
then select it from the list box.
Fig. 20
18
Track configurations functions
• For deleting an existing configuration click
then select it from the list box and confirm the
deletion with Ok.
11/2013
Settings for multiple track configurations in Channel Mode
Multiple track set-ups for sequential scanning can be defined as one configuration (Channel Mode
Configuration), to be stored under any name, reloaded or deleted.
The maximum of four tracks with up to eight channels can be defined simultaneously and then scanned
one after the other. Each track is a separate unit and can be configured independently from the other
tracks with regard to channels, Acousto-Optical Tunable Filters (AOTF), emission filters and dichroic beam
splitters.
The following functions are available in the Light Path tool of the Setup Manager tool group (Fig. 18).
Switch track every selection box
Line
Tracks are switched during scanning line-by-line. The following settings can be changed
between tracks: Laser line, laser intensity and channels.
Frame
Tracks are switched during scanning frame-by-frame. The following settings can be
changed between tracks: Laser line and intensity, all filters and beam splitters, the
channels incl. settings for gain and offset and the pinhole position and diameter.
Frame Fast
The scanning procedure can be made faster. Only the laser line intensity and the
Amplifier Offset are switched, but no other hardware components. The tracks are all
matched to the current track with regard to emission filter, dichroic beam splitter,
setting of Detector Gain, pinhole position and diameter. When the Line button is
selected, the same rules apply as for Frame Fast.
Tracks line
Track buttons: To change between the tracks settings click on the
appropriate track button. The selected track is highlighted. The setting table
for configuration will be shown behind.
Add Track button: An additional track is added to the configuration list in
the Light Path tool. The maximum of four tracks can be used. One track
each with basic configuration is added, i.e.: Ch 1 channel is activated, all laser
lines are switched off, emission filters and dichroic beam splitters are set in
accordance with the last configuration used.
Remove button: The track marked in the List of Tracks panel is deleted.
11/2013
19
Scanning an image with the LSM 710 / 780
Setting the parameters for scanning
• Select the Acquisition Mode tool from the Left Tool Area (Fig. 21).
• Select the Frame Size as predefined number of pixels or enter your own values (e.g. 300 x 600) in the
Acquisition Mode tool. Click on the Optimal button for calculation of appropriate number of pixels
depending on objective N.A. and λ.
The number of pixels influences the image resolution!
→
Fig. 21
Acquisition Mode tool
Adjusting scan speed
• Use the Scan Speed slider in the Acquisition Mode tool (Fig. 21) to adjust the scan speed.
A higher speed with averaging results in the best signal-to-noise ratio. Scan speed 8 usually produces
good results. Use speed 6 or 7 for superior images.
Choosing the dynamic range
• Select the dynamic range 8 or 12 Bit (per pixel) in the Bit Depth pull-down in the Acquisition Mode
tool (Fig. 21).
8 Bit will give 256 gray levels; 12 Bit will give 4096 gray levels. Publication quality images should be
acquired using 12 Bit data depth. 12 Bit is also recommended when doing quantitative measurements or
when imaging low fluorescence intensities.
20
11/2013
Setting scan averaging
Averaging improves the image by increasing the signal-to-noise ratio. Averaging scans can be carried out
line-by-line or frame-by-frame. Frame averaging helps to reduce photo-bleaching, but does not give quite
as smooth of an image.
• For averaging, select the Line or Frame mode in the Acquisition Mode tool.
• Select the number of lines or frames to average.
Adjusting pinhole size
• Select the Channels tool in the Left Tool Area.
• Set the Pinhole size to 1 AU (Airy unit) for best compromise between depth discrimination and
detection efficiency.
Pinhole adjustment changes the Optical Slice thickness. When collecting multi-channel images, adjust
the pinholes so that each channel has the same Optical Slice thickness. This is important for
colocalization studies.
→
Fig. 22
11/2013
Channels tool
21
Image acquisition
Once you have set up your parameter as defined in
the above section, you can acquire a frame image
of your specimen.
• Use one of the Set Exposure, Live,
Continuous or Snap buttons to start the
scanning procedure to acquire an image.
• Scanned images
windows.
are
shown
in
separate
• Click on the Stop button to stop the current
scan procedure if necessary.
Select Set Exposure for
automatic pre-adjustment of
detector gain and offset.
Select Live for continuous fast
scanning – useful for finding and
changing the focus.
Select Continuous for
continuous scanning with the
selected scan speed.
Fig. 23
Image Display
Select Snap for recording a
single image.
Select Stop for stopping the
current scan procedure.
Image optimization
Choosing Range Indicator
• In the View – Dimensions View Option
Control Block, activate the Range indicator
check box (Fig. 24).
Clicking on the right hand side of the
button leads to a list of colors.
Fig. 24
22
View Dimensions Control Block
11/2013
The scanned image appears in a false-color
presentation (Fig. 25).
If the image is too bright, it appears red on the
screen. Red = saturation (maximum).
If the image is not bright enough, it appears blue
on the screen. Blue = zero (minimum).
Adjusting the laser intensity
• Set the Pinhole to 1 Airy Unit (Fig. 26).
Fig. 25
Image Display
Fig. 26
Channels tool
• Set the Gain (Master) high.
• When the image is saturated, reduce AOTF
transmission in the Laser control section of the
Channels tool (Fig. 26) using the slider to
reduce the intensity of the laser light to the
specimen.
Adjusting gain and offset
• Increase the Digital Offset until all blue pixels
disappear, and then make it slightly positive
(Fig. 26).
• Reduce the Gain (Master) until the red pixels
only just disappear.
11/2013
23
Scanning a Z-Stack
• Select Z-Stack
tools area.
in the main
• Open the Z-Stack tool in the Left Tool Area.
• Select Mode First/Last on the top of the
Z-Stack tool.
• Click on the
Button area.
button in the Action
A continuous XY-scan of the set focus position will
be performed.
• Use the focus drive of the microscope to focus
on the upper position of the specimen area
where the Z-Stack is to start.
• Click on the Set First button to set the upper
position of the Z-Stack.
Fig. 27
Z-Stack tool
• Then focus on the lower specimen area where
the recording of the Z-Stack is to end.
• Click on the Set Last button to set this lower
position.
• Click on the
button to set number of slices to match the optimal
Z-interval for the given stack size, objective lens, and the pinhole diameter.
• Click on the
Start Experiment button to start the recording of the Z-Stack.
When a multi-dimensional acquisition tool is not selected, the respective tool and its set parameters
are not included in the multidimensional image acquisition. If no multidimensional tool is activated,
the
be scanned.
24
Start Experiment button is grayed out and only single images can
11/2013
Configuring the beam path and lasers for SIM
Setting up configurations
Sequential imaging of double, triple and quadruple labeling frame-by-frame:
− Advantage: Only one detector is needed and one laser is switched on at any one time. This reduces
cross-talk.
− Disadvantage: slower image acquisition
• Open the Light Path tool in the Setup Manager tool group to access the hardware control window
to set-up the beam path. Select SIM.
• The open Light Path is shown in Fig. 28.
• The Light Path tool displays the selected track configuration which is used for imaging. Each track
can be configured individually by activating the track.
• You can change the settings of this panel using the following function elements:
Activation / deactivation of the
excitation wavelengths (check box).
Click the Laser icon to select the laser
lines and set the attenuation values
(transmission in %) in the displayed
window.
Selection of FOV size is done
automatically.
Selection of grid is done automatically,
but can be overruled.
Selection of the filter cube with main
beam splitter and emission filter. Please
refer to the spectrum of the used dyes
for the best filter setting.
Selection of objective.
Selection of camera is done
automatically
Selection of emission tube lens is done
automatically, but can be overruled
Fig. 28
11/2013
Light Path tool for SIM
25
• Multiple track set-ups for sequential scanning
can be defined as one configuration, to be
stored under any name, reloaded or deleted.
• For storing a new configuration click
of the
Experiment Manager of the Acquisition tab
and enter a desired name in the first line of the
list box (Fig. 29), then click Ok to store the configuration.
• For loading an existing track configuration click
then select it from the list box.
Fig. 29
Saving Configurations via the
experiment Manager
• For deleting an existing track configuration click
then select it from the list box and confirm
the deletion with Ok.
• Switch track every selection box
26
Frame
Tracks are switched during imaging frame-by-frame. The following settings can be
changed between tracks: Laser line and intensity, all filters and beam splitters, the
channels incl. settings for gain.
Frame Fast
The image acquisition can be made faster. Only the laser line intensity is switched,
but no other hardware components. The tracks are all matched to the current track
with regard to filter cube and setting of Detector Gain.
11/2013
Setting up tracks
• Select the Channels tab from the Acquisition
parameter tool group (Fig. 30).
• The maximum of four tracks can be defined
simultaneously and then imaged one after the
other. Each track is a separate unit and can be
configured independently from the other tracks
with regard to channels, Acousto-Optical Tunable
Filters (AOTF), and filter cubes.
The following functions are available
• Activate/Deactivate Lasers as necessary and set the
laser power via AOTF using the Laser slider.
• Set the FOV. For SIM iamging the setting SIM
should be chosen.
• Set the Exposure time in ms. A good start value is
200 ms.
• Set the EMCCD gain. For SIM imaging it is
recommended to stay below 10.
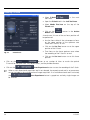
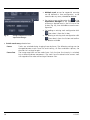
Fig. 30
Add Track button
Remove button
Channels tool for SIM with two tracks
An additional track is added to the configuration list by pressing the button.
A maximum of four tracks can be used. Beam configuration of a track is
defined in the Light Path tool.
The track marked in the List of Tracks panel is deleted.
A click on this arrow button will move the selected track (highlighted in light
grey) one position upwards in the list box.
A click on this arrow button will move the selected track (highlighted in light
grey) one position downwards in the list box.
• For storing a new track configuration click
of the Track Configuration and enter a
desired name in the first line of the list box
(Fig. 31), then click Ok to store the configuration.
• For loading an existing track configuration click
then select it from the list box.
• For deleting an existing track configuration click
then select it from the list box and confirm
the deletion with Ok.
11/2013
Fig. 31
Saving Configurations via the
experiment Manager
27
Setting up parameters
The following parameters can be set in the
Acquisition Mode tool (Fig. 32):
• Objective: For best performance use PlanApochromat 63x / 1.4 oil objective
• Scan mode: is by default Frame and is fixed
• Scan Size: is by default 1004 x 1002 and is
fixed
• Format: is by default 1004 x 1002 standard
and should not be altered.
• Average: Number of 1 and Method Mean are
the defaults. Averaging can help to increase
signal-to-noise.
Fig. 32
Acquisition mode tab
• Bit Depth: is by default 16 Bit. It is
recommended not to alter the value.
• Scan Area: is by default the full chip and fixed.
The scan area can only be altered by Cropping
and Panning.
• Grating: is by default 3 Rotations. 5
Rotations is recommended for better isotropic
resolution enhancement. 3 Rotations will have
the benefit of faster image acquisition.
28
11/2013
Taking a SIM image
Image acquisition
Once you have set up your parameter as defined in
the above section, you can acquire a frame image
of your specimen.
• Use one of the AF Find Focus, Set Exposure,
Live, Continuous or Snap buttons to start the
procedure to acquire an image (Fig. 33).
• New images are shown in separate windows.
• Click on the Stop button to stop the current
scan procedure if necessary.
• The set up should be such that the grid can be
seen during image acquisition (Fig. 34). It might
help to change the phase and rotation by
moving
the
corresponding
sliders
in
Dimensions view control tab of the original
image (Fig. 35). If the grid cannot be seen,
resolution enhancement will be limited. In case
no grid is seen, it might help to switch to the
grid with the next higher spacing.
Fig. 33
Image Display
Select AF Find Focus to screen
for the focus position based on
contrast
Select Set Exposure for
automatic pre-adjustment of
detector gain and offset.
Select Live for continuous fast
acquisition – useful for finding
and changing the focus.
Fig. 34
Image with grid pattern
Select Continuous for
continuous scanning with the
selected scan speed.
Select Snap for recording a
single image.
Select Stop for stopping the
current scan procedure.
11/2013
Fig. 35
Dimensions view control tab for a raw
SIM image
29
Image optimization
Choosing Range Indicator
• In the Dimensions view control tab check the
Range Indicator box (Fig. 36).
Fig. 36
Dimensions view control tab for a SIM
image
Fig. 37
Image with Range Indicator
• The scanned image appears in a false-color
presentation (Fig. 37). If the image is too bright,
it appears red on the screen. Red = saturation
(maximum). If the image is not bright enough, it
appears blue on the screen. Blue = zero
(minimum).
Adjusting the laser intensity
• When the image is saturated with the slider in
the Display view control tab at Reset (linear),
reduce AOTF transmission in the Laser control
section of the Channels tool (Fig. 38).
Adjusting gain
Fig. 38
Display view control tab
• Reduce the EMCCD Gain until the red pixels
just disappear.
Adjusting display settings
• If the slider in the Display view control tab is offset from the Reset (linear) position, red as well as blue
pixels can also occur. Use the slider to set contrast and brightness to values that avoid red and blue
pixels. (Fig. 38).
30
11/2013
Acquire a Z-Stack
• Select Z-Stack
tools area.
in the main
• Open the Z-Stack tool in the Left Tool Area.
First/Last Mode (Fig. 39)
• Select Mode First/Last on the top of the
Z-Stack tool.
button in the Action
• Click on the
Button area. A continuous XY-scan of the set
focus position will be performed.
• Use the focus drive of the microscope to focus
on the upper position of the specimen area
where the Z-Stack is to start.
• Click on the Set First button to set the upper
position of the Z-Stack.
Fig. 39
Z-Stack tool - First/Last active
Fig. 40
Z-Stack tool - Center active
• Then focus on the lower specimen area where
the recording of the Z-Stack is to end.
• Click on the Set Last button to set this lower
position.
Center Mode (Fig. 40)
• Select Mode Center on the top of the Z-Stack
tool.
• Click on the
button in the Action
Button area. A continuous XY-scan of the set
focus position will be performed.
• Use the focus drive of the microscope to focus
on the center position of the specimen.
• Click on Center to center the Z-Piezo stage
insert to the present focus position of the
microscopes focus drive.
11/2013
31
Trigger the z-Scan
button to set number of slices to match the optimal
• Click on the
Z-interval for the given stack size, objective lens, and the pinhole diameter.
• Click on the
Start Experiment button to start the recording of the Z-Stack.
The recording will be performed with the Z-Piezo stage insert.
When a multi-dimensional acquisition tool is not selected, the respective tool and its set parameters
are not included in the multidimensional image acquisition. If no multidimensional tool is activated,
the
be scanned.
32
Start Experiment button is grayed out and only single images can
11/2013
Processing of SIM images
Loading the image
• Click on the Processing tab (Fig. 41).
• Open the Method tab.
• Scroll to Structured Illumination (SIM) and
open the tool.
• Select Structured Illumination.
• In the image container click on the Image you
want to process.
• Open the Methods Parameters tab.
• Press Select to load the image.
Fig. 41
11/2013
Processing tab, Method tab
33
Processing the image
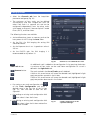
• Expand the parameter definition field in the
Methods Parameters tab (Fig. 42).
• Select First-Last and define the slice of the
stack you want to process. If you want to
process only one slice select Single. It is
recommended to process a stack, since this will
also enhance x,y resolution.
• Select for Processing - Automatic. If you want
to refine processing and want to set parameters
manually, select Manual.
• As Mode select 3D if you process a stack. Select
2D if you do not want to get resolution
enhancement in z.
• As Output select SR-SIM + Wide Field. If you
also want to display a deconvolved wide field
image (DCV) select SR-SIM +DCV+Wide Field.
• Press
SIM image.
Fig. 42
34
to compute the
Methods Parameters tab
11/2013
Configuring the beam path and lasers for PALM
Setting up a configuration
• Open the Light Path tool in the Setup
Manager tool group to access the hardware
control window to set-up the beam path.
•
Select Laser WF.
• The open Light Path is shown in Fig. 43.
The Light Path tool displays the selected track
configuration which is used for imaging. Each track
can be configured individually by activating the
track.
• You can change the settings of this panel using
the following function elements:
Activation / deactivation of the
excitation wavelengths (check box).
Click the Laser icon to select the laser
lines and set the attenuation values
(transmission in %) in the displayed
window.
Selection of FOV size is done
automatically, but can be overruled.
Collimator adjustment. Set to obtain
evenly illuminated field.
TIRF Angle adjustment. Select EPI for
epi fluorescence, TIRF for total
internal reflection. In TIRF mode adjust
angle so that epi fluorescence light is
minimized.
Fig. 43
Light Path tool for PALM
Selection of the filter cube with main
beam splitter and emission filter.
Please refer to the spectrum of the
used dyes for the best filter setting.
11/2013
35
Moving the 3D PALM slider between load and work positions.
Selection of objective.
Selection of camera is done automatically, but can be overruled by pressing the TV#:Andor
iXon xxx buttons. The Andor iXon 897 is recommended for PALM applications. For systems
without LSM an AxioCam camera for IR transmitted light is optionally available. Activate the
camera by checking the box if required.
Selection of emission tube lens is done automatically, but can be overruled
of the
• For storing a new configuration click
Experiment Manager of the Acquisition tab
and enter a desired name in the first line of the
list box (Fig. 44), then click Ok to store the configuration.
• For loading an existing track configuration click
then select it from the list box.
• For deleting an existing track configuration click
Fig. 44
36
Saving Configurations via the
experiment Manager
then select it from the list box and confirm
the deletion with Ok.
11/2013
Setting up a track
• Select the Channels tab from the Acquisition
parameter tool group (Fig. 45).
• It is recommended for PALM to just define one
track. The track can be configured with regard to
channels, Acousto-Optical Tunable Filters (AOTF),
and filter cubes.
The following functions are available:
• Activate/Deactivate Lasers as necessary (activation
and imaging laser) and set the laser power via
AOTF using the Laser slider.
• Set the FOV. For PALM imaging the setting TIRF
should be chosen.
• Set the TIRF Angle (o) by activating TIRF and adjust
the slider. Press Save TIRF angle to save the
setting. For finding cells it can be beneficial to use
epi illumination. To this end press the EPI button
to screen and go back to TIRF or HILO for 2D or 3D
PALM imaging, respectively. TIRF and HILO will
result in a better signal-to-noise ratio and better
localization precisions.
• Press 3D PALM button to move 3D PALM slider
from load position (button appears unpressed) to
work position (button appears pressed) and vice
versa.
• Adjust the Collimator Camera ELYRA to have a
homogeneously illuminated filed. Store the settings
by pressing the Save collimator position(s) button.
• Set the Exposure time in ms. A good start value is
100 ms.
• Set the EMCCD Gain. For PALM imaging it is
recommended to stay above 100.
Fig. 45
Channels tool for PALM with a
single track
• If beneficial set the Laser trigger of the activation
laser to transfer and the imaging laser to
integration.
11/2013
37
• For storing a new track configuration click
of
the Track Configuration and enter a desired
name in the first line of the list box (Fig. 46), then
click Ok to store the configuration.
• For loading an existing track configuration click
then select it from the list box.
• For deleting an existing track configuration click
Fig. 46
Saving Configurations via the
experiment Manager
then select it from the list box and confirm
the deletion with Ok.
Setting up parameters
The following parameters can be set in the
Acquisition Mode tool (Fig. 47):
Objective: For best performance use alpha PlanApochromat 63x / 1.46 oil objective
Scan mode: is by default Frame and is fixed
Scan Size: is by default 512 x 512 and is fixed
Format: is by default 512 x 512 standard and
should not be altered.
Averaging: Number of 1 and Method Mean are
the defaults. Averaging should not be used for
PALM.
Bit Depth: is by default 16 Bit. It is recommended
not to alter the value.
Scan Area: is by default the full chip and fixed.
The scan area can only be altered by cropping and
panning.
Fig. 47
38
Acquisition mode tab
11/2013
Taking a PALM image
Image acquisition
Once you have set up your parameter as defined in
the above section, you can acquire a frame image
of your specimen.
• Use one of the AF Find Focus, Set Exposure,
Live, Continuous or Snap buttons to start the
procedure to acquire an image (Fig. 48).
• New images are shown in separate windows.
• Click on the Stop button to stop the current
scan procedure if necessary.
• The set up should be such that, once you found
your cells, you have a regime where you bring
molecules to blink. This is done by balancing
the laser powers of the activating (low power)
and imaging (high powers) lasers (Fig. 49).
Select AF Find Focus to screen
for the focus position based on
contrast.
Fig. 48
Image Display
Select Set Exposure for
automatic pre-adjustment of
detector gain and offset.
Select Live for continuous fast
acquisition – useful for finding
and changing the focus.
Select Continuous for
continuous scanning with the
selected scan speed.
Select Snap for recording a
single image.
Select Stop for stopping the
current scan procedure.
11/2013
39
Image optimization
Choosing Range Indicator
• In the Dimensions view control tab check the
Range Indicator box (Fig. 49).
• The scanned image appears in a false-color
presentation (Fig. 50). If the image is too bright,
it appears red on the screen. Red = saturation
(maximum). If the image is not bright enough, it
appears blue on the screen. Blue = zero
(minimum).
Fig. 49
Dimensions view control tab for a
PALM image
Fig. 50
Image with Range Indicator
Adjusting the laser intensity
• When the image is saturated with the slider in
the Display view control tab at Reset (linear),
reduce AOTF transmission in the Laser control
section of the Channels tool (Fig. 51).
Adjusting gain
Fig. 51
Display view control tab
• Reduce the EMCCD Gain until the red pixels
just disappear.
Adjusting display settings
• If the slider in the Display view control tab is offset from the Reset (linear) position, red as well as blue
pixels can also occur. Use the slider to set contrast and brightness to values that avoid red and blue
pixels. (Fig. 51).
40
11/2013
Acquire a time series
For PALM imaging a time series has to be set up.
• Select Time Series
tools area.
in the main
• Open the Time Series tool in the Left Tool
Area (Fig. 52).
• Set the required Cycles. For PALM you will need
5000 - 15000 images.
Fig. 52
Time series
Fig. 53
Online Processing Options tab
Online Processing
Data can be processed during acquisition already
online (Fig. 53).
• Open the Online Processing Options tab
• Check the Online Processing PALM box
• Check the Fit 2D Gauss 2D box to allow for full
2D Gauss fitting.
• Set the Peak mask size [pixel] to 9, which is the
default value.
• Set the Peak intensity to noise to 6, which is the
default value.
If a fiducial is present, it can be used for a holding
focus.
• Check the Use holding focus box
• Check the Use region(s) box and set Regions
to 1.
• Press Continuous and mark the fiducial with the
displayed ROI.
• Press
that will appear. The system will determine the z-focus of the fiducial.
• Press the STOP button.
• Press the Start Experiment button. Data will be processed online and the developing PALM image is
displayed side by side to the time series.
11/2013
41
Processing of PALM images
Loading the image
• Click on the Processing tab (Fig. 54).
• Open the Method tab.
• Scroll to PALM and expand the tool.
• Select PALM.
• In the image container click on the Image you
want to process. You can use a time series or
an online processed time series.
• Open the Methods Parameters tab.
• Press Select to load the image.
Fig. 54
42
Processing tab
11/2013
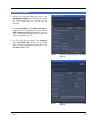
Processing the image
• Expand the Parameter definition field in the
Methods Parameter tab and select the image.
The respective settings for a 2D PALM (Fig. 55)
or a 3D PALM data set (Fig. 56) will be
available.
• In the Peak Finder set the Peak mask size to
9 (default for 2D) or 19 (default for 3D) and the
Peak intensity to noise to 6 (default). You can
view in the preview window which peaks the
system will identify (Fig. 57).
• For 2D PALM data set select in the Localizer
field x,y 2D Gauss Fit (default). For 3D PALM
data set load an appropriate Experimental PSF
with attached Localization Precision LUT in the
PSF File selection field.
11/2013
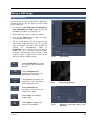
Fig. 55
Methods Parameter tab for 2D PALM
data set
Fig. 56
Methods Parameter tab for 3D PALM
data set
43
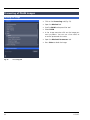
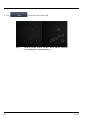
• Press
to compute the PALM image.
Fig. 57
44
PALM Processing Preview window. Circles indicate identified
peaks (displayed for a 3D PALM data set)
11/2013
Storing and exporting image data
• To save your acquired or processed images, click
on the Save or Save As button in File menu,
or click the
button in the Main Toolbar
(Fig. 58/1), or click on the
button at the
bottom of the Images and Documents area
(Fig. 58/2).
Fig. 58
Save image buttons in ZEN
Fig. 59
Save as window
Fig. 60
Export window
• The WINDOWS Save As window appears.
• Enter a file name and choose the appropriate
image format. Note: the LSM 5 format is the
native Carl Zeiss LSM image data format and
contains all available extra information and
hardware settings of your experiment.
• Click on the Save button.
If you close an image which has not been saved, a
pop-up window will ask you if you want to save it.
Choosing yes will lead you to the WINDOWS Save
As window.
To export image display data, a single optical
section in raw data format or the contents of the
image display window including analysis and
overlays, choose Export from the File menu. In
the Export window you can select from a number
of options and proceed to the WINDOWS Save As
window to save the exported data to disk.
11/2013
45