1
Getting Started Guide
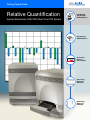
Relative Quantification
Introduction
and Example
RQ Experiment
Applied Biosystems 7300/7500 Real Time PCR System
Designing an
RQ Experiment
Primer Extended on mRNA
5′
3′
Reverse
Primer
5′ cDNA
Oligo d(T) or random hexamer
Synthesis of 1st cDNA strand
3′
5′ cDNA
Performing
Reverse
Transcription
Generating
Data from
RQ Plates
Generating
Data in an
RQ Study
© Copyright 2004, Applied Biosystems. All rights reserved.
For Research Use Only. Not for use in diagnostic procedures.
Authorized Thermal Cycler
This instrument, Serial No___________, is an Authorized Thermal Cycler. Its purchase price includes the up-front fee
component of a license under United States Patent Nos. 4,683,195, 4,683,202 and 4,965,188, owned by Roche
Molecular Systems, Inc., and under corresponding claims in patents outside the United States, owned by F. HoffmannLa Roche Ltd, covering the Polymerase Chain Reaction ("PCR") process to practice the PCR process for internal
research and development using this instrument. The running royalty component of that license may be purchased
from Applied Biosystems or obtained by purchasing Authorized Reagents. This instrument is also an Authorized
Thermal Cycler for use with applications licenses available from Applied Biosystems. Its use with Authorized
Reagents also provides a limited PCR license in accordance with the label rights accompanying such reagents.
Purchase of this product does not itself convey to the purchaser a complete license or right to perform the PCR
process. Further information on purchasing licenses to practice the PCR process may be obtained by contacting the
Director of Licensing at Applied Biosystems, 850 Lincoln Centre Drive, Foster City, California 94404.
DISCLAIMER OF LICENSE: No rights for any application, including any in vitro diagnostic application, are
conveyed expressly, by implication or by estoppel under any patent or patent applications claiming homogeneous or
real-time detection methods, including patents covering such methods used in conjunction with the PCR process or
other amplification processes. The 5' nuclease detection assay and certain other homogeneous or real-time
amplification and detection methods are covered by United States Patent Nos. 5,210,015, 5,487,972, 5,804,375 and
5,994,056, owned by Roche Molecular Systems, Inc.; by corresponding patents and patent applications outside the
United States, owned by F. Hoffmann-La Roche Ltd; and by United States Patent Nos. 5,538,848 and 6,030,787, and
corresponding patents and patent applications outside the United States, owned by Applera Corporation. Purchase of
this instrument conveys no license or right under the foregoing patents. Use of these and other patented processes in
conjunction with the PCR process requires a license. For information on obtaining licenses, contact the Director of
Licensing at Applied Biosystems, 850 Lincoln Centre Drive, Foster City, California 94404, or The Licensing
Department, Roche Molecular Systems, Inc., 1145 Atlantic Avenue, Alameda, California, 94501, USA.
Trademarks
Applied Biosystems, MicroAmp, Primer Express, ROX, and VIC are registered trademarks of Applera Corporation or
its subsidiaries in the US and/or certain other countries.
AB (Design), ABI PRISM, Applera, Assays-by-Design, Assays-on-Demand, Celera Genomics, FAM, iScience,
iScience (Design), and MultiScribe are trademarks of Applera Corporation or its subsidiaries in the US and/or certain
other countries.
AmpErase, AmpliTaq Gold, and TaqMan are registered trademarks of Roche Molecular Systems, Inc.
SYBR Green is a registered trademark of Molecular Probes, Inc.
Microsoft and Windows are registered trademarks of Microsoft Corporation.
All other trademarks are the sole property of their respective owners.
Part Number 4347824 Rev. A
1/2004
ii
Relative Quantification Getting Started Guide for the 7300/7500 System
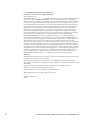
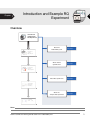
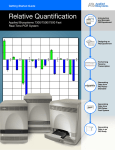
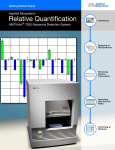
RQ Experiment Workflow
Chapter 1
Introduction
and Example
RQ Experiment
Chapter 2
Designing
an RQ
Experiment
About the
7300/7500 system
Select the
PCR method
About
RQ experiments
About relative
quantification
Specify the components
of an RQ experiment
Select the chemistry
Example
RQ experiment
Select one-step or
two-step RT-PCR
Choose probes
and primers
Performing
Reverse
Transcription
Isolate total RNA
Chapter 4
Generating
Data from
RQ Plates
Prepare the
PCR Master Mix
Prepare the
reaction plate
Create a new
RQ Plate document
Program the
thermal cycling
conditions
Save the
RQ Plate
document
Start the run
Chapter 5
Performing
an RQ Study
Create a new
RQ Study document
Configure
analysis settings
Adjust the
baseline and
threshold
Analyze and
view results
If necessary,
omit samples
Export AQ
Plate document,
if desired
Chapter 3
Primer Extended on mRNA
5′
3′
Reverse
Primer
5′ cDNA
Oligo d(T) or random hexamer
Synthesis of 1st cDNA strand
3′
5′ cDNA
Relative Quantification Getting Started Guide for the 7300/7500 System
Adjust RNA
concentration
Convert
total RNA to cDNA
Primer Extended on mRNA
5′
3′
Reverse
Primer
5′ cDNA
Oligo d(T) or random hexamer
Synthesis of 1st cDNA strand
3′
5′ cDNA
View
RQ plate data
iii
iv
Relative Quantification Getting Started Guide for the 7300/7500 System
Contents
RQ Experiment Workflow
iii
Preface
vii
How to Use This Guide . . . . . . . . . . . . . . . . . . . . . . . . . . . . . . . . . . . . . . . . . . . . . . . . vii
How to Obtain More Information . . . . . . . . . . . . . . . . . . . . . . . . . . . . . . . . . . . . . . . . viii
How to Obtain Services and Support . . . . . . . . . . . . . . . . . . . . . . . . . . . . . . . . . . . . . viii
Send Us Your Comments . . . . . . . . . . . . . . . . . . . . . . . . . . . . . . . . . . . . . . . . . . . . . . viii
Chapter 1
Introduction and Example RQ Experiment
1
Overview . . . . . . . . . . . . . . . . . . . . . . . . . . . . . . . . . . . . . . . . . . . . . . . . . . . . . . . . . . . . .1
About the 7300/7500 System . . . . . . . . . . . . . . . . . . . . . . . . . . . . . . . . . . . . . . . . . . . . .2
About Relative Quantification . . . . . . . . . . . . . . . . . . . . . . . . . . . . . . . . . . . . . . . . . . . . .2
About RQ Experiments . . . . . . . . . . . . . . . . . . . . . . . . . . . . . . . . . . . . . . . . . . . . . . . . . .2
Example RQ Experiment . . . . . . . . . . . . . . . . . . . . . . . . . . . . . . . . . . . . . . . . . . . . . . . . .5
Chapter 2
Designing an RQ Experiment
11
Workflow . . . . . . . . . . . . . . . . . . . . . . . . . . . . . . . . . . . . . . . . . . . . . . . . . . . . . . . . . . . .11
Selecting the PCR Method . . . . . . . . . . . . . . . . . . . . . . . . . . . . . . . . . . . . . . . . . . . . . .12
Specifying the Components of an RQ Experiment . . . . . . . . . . . . . . . . . . . . . . . . . . . .13
Selecting the Chemistry . . . . . . . . . . . . . . . . . . . . . . . . . . . . . . . . . . . . . . . . . . . . . . . .15
Selecting One- or Two-Step RT-PCR . . . . . . . . . . . . . . . . . . . . . . . . . . . . . . . . . . . . . .16
Choosing the Probes and Primers . . . . . . . . . . . . . . . . . . . . . . . . . . . . . . . . . . . . . . . .17
Chapter 3
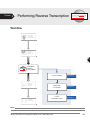
Performing Reverse Transcription
19
Workflow . . . . . . . . . . . . . . . . . . . . . . . . . . . . . . . . . . . . . . . . . . . . . . . . . . . . . . . . . . . .19
Guidelines for Preparing RNA . . . . . . . . . . . . . . . . . . . . . . . . . . . . . . . . . . . . . . . . . . . .20
Converting Total RNA to cDNA . . . . . . . . . . . . . . . . . . . . . . . . . . . . . . . . . . . . . . . . . . .21
Chapter 4
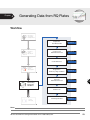
Generating Data from RQ Plates
23
Workflow . . . . . . . . . . . . . . . . . . . . . . . . . . . . . . . . . . . . . . . . . . . . . . . . . . . . . . . . . . . .23
Before You Begin . . . . . . . . . . . . . . . . . . . . . . . . . . . . . . . . . . . . . . . . . . . . . . . . . . . . .24
Preparing the PCR Master Mix . . . . . . . . . . . . . . . . . . . . . . . . . . . . . . . . . . . . . . . . . . .24
Relative Quantification Getting Started Guide for the 7300/7500 System
v
Preparing the Reaction Plate . . . . . . . . . . . . . . . . . . . . . . . . . . . . . . . . . . . . . . . . . . . . 25
Creating a Relative Quantification (RQ) Plate Document . . . . . . . . . . . . . . . . . . . . . . . 26
Specifying Thermal Cycling Conditions and Starting the Run . . . . . . . . . . . . . . . . . . . 30
Analyzing and Viewing RQ Plate Data . . . . . . . . . . . . . . . . . . . . . . . . . . . . . . . . . . . . . 32
Exporting RQ Plate Data . . . . . . . . . . . . . . . . . . . . . . . . . . . . . . . . . . . . . . . . . . . . . . . . 34
Chapter 5
Analyzing Data in an RQ Study
35
Workflow . . . . . . . . . . . . . . . . . . . . . . . . . . . . . . . . . . . . . . . . . . . . . . . . . . . . . . . . . . . . 35
Creating an RQ Study Document . . . . . . . . . . . . . . . . . . . . . . . . . . . . . . . . . . . . . . . . . 36
Configuring Analysis Settings . . . . . . . . . . . . . . . . . . . . . . . . . . . . . . . . . . . . . . . . . . . . 38
Adjusting the Baseline and Threshold . . . . . . . . . . . . . . . . . . . . . . . . . . . . . . . . . . . . . 40
Analyzing and Viewing the Results of the RQ Study . . . . . . . . . . . . . . . . . . . . . . . . . . 45
Reanalyzing an RQ Study . . . . . . . . . . . . . . . . . . . . . . . . . . . . . . . . . . . . . . . . . . . . . . . 49
Omitting Samples from a Study . . . . . . . . . . . . . . . . . . . . . . . . . . . . . . . . . . . . . . . . . . 50
Exporting RQ Study Data . . . . . . . . . . . . . . . . . . . . . . . . . . . . . . . . . . . . . . . . . . . . . . . 52
Appendix A Creating Detectors
vi
53
References
55
Index
57
Relative Quantification Getting Started Guide for the 7300/7500 System
Preface
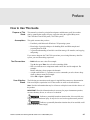
How to Use This Guide
Purpose of This
Guide
Assumptions
This manual is written for principal investigators and laboratory staff who conduct
relative quantification studies for gene expression using the Applied Biosystems
7300/7500 Real Time PCR System (7300/7500 system).
This guide assumes that you have:
• Familiarity with Microsoft® Windows® XP operating system.
• Knowledge of general techniques for handling DNA and RNA samples and
preparing them for PCR.
• A general understanding of hard drives and data storage, file transfers, and copying
and pasting.
If you want to integrate the 7300/7500 system into your existing laboratory data flow
system, you need networking experience.
Text Conventions
• Bold indicates user action. For example:
Type 0, then press Enter for each of the remaining fields.
• Italic text indicates new or important words and is also used for emphasis. For
example:
Before analyzing, always prepare fresh matrix.
• A right arrow bracket (>) separates successive commands you select from a dropdown or shortcut menu. For example:
Select File > Open > Spot Set.
User Attention
Words
The following user attention words appear in Applied Biosystems user documentation.
Each word implies a particular level of observation or action as described below:
Note: Provides information that may be of interest or help but is not critical to the use of
the product.
IMPORTANT! Provides information that is necessary for proper instrument operation,
accurate chemistry kit use, or safe use of a chemical.
Indicates a potentially hazardous situation that, if not avoided, may
result in minor or moderate injury. It may also be used to alert against unsafe practices.
Indicates a potentially hazardous situation that, if not avoided, could
result in death or serious injury.
Relative Quantification Getting Started Guide for the 7300/7500 System
vii
Preface
How to Obtain More Information
Safety
Refer to the Applied Biosystems 7300/7500 Real Time PCR System Installation and
Maintenance Getting Started Guide and the Applied Biosystems 7300/7500 Real Time
PCR System Site Preparation Guide for important safety information.
How to Obtain More Information
For more information about using the 7300/7500 system, refer to:
• Applied Biosystems 7300/7500 Real Time PCR System Online Help
• Applied Biosystems 7300/7500 Real Time PCR System Allelic Discrimination
Getting Started Guide (PN 4347822)
• Applied Biosystems 7300/7500 Real Time PCR System Plus/Minus Getting Started
Guide (PN 4347821)
• Applied Biosystems 7300/7500 Real Time PCR System Absolute Quantification
Getting Started Guide (PN 4347825)
• Applied Biosystems 7300/7500 Real Time PCR System Installation and
Maintenance Getting Started Guide (PN 4347828)
• Applied Biosystems 7300/7500 Real Time PCR System Site Preparation Guide
(PN 4347823)
• Sequence Detection Systems Chemistry Guide (PN 4348358)
• ABI PRISM® 7700 Sequence Detection System User Bulletin #2: Relative
Quantitation of Gene Expression (PN 4303859)
How to Obtain Services and Support
For the latest services and support information for all locations, go to
http://www.appliedbiosystems.com, then click the link for Support.
At the Support page, you can:
• Search through frequently asked questions (FAQs)
• Submit a question directly to Technical Support
• Order Applied Biosystems user documents, MSDSs, certificates of analysis, and
other related documents
• Download PDF documents
• Obtain information about customer training
• Download software updates and patches
In addition, the Support page provides access to worldwide telephone and fax numbers
to contact Applied Biosystems Technical Support and Sales facilities.
Send Us Your Comments
Applied Biosystems welcomes your comments and suggestions for improving its user
documents. You can e-mail your comments to:
[email protected]
viii
Relative Quantification Getting Started Guide for the 7300/7500 System
Introduction and Example RQ
Experiment
Chapter 1
1
Overview
Introduction
and Example
RQ Experiment
About the
7300/7500 system
See page 2
About relative
quantification
See page 2
About RQ experiments
See page 2
About the
example RQ experiment
See page 5
Designing
an RQ
Experiment
Primer Extended on mRNA
5′
3′
Reverse
Primer
5′ cDNA
Oligo d(T) or random hexamer
Synthesis of 1st cDNA strand
3′
5′ cDNA
Performing
Reverse
Transcription
Generating
Data from
RQ Plates
Performing
an RQ Study
Notes
Relative Quantification Getting Started Guide for the 7300/7500 System
1
Chapter 1 Introduction and Example RQ Experiment
About the 7300/7500 System
About the 7300/7500 System
Description
Relative
Quantification
Assay
The Applied Biosystems 7300/7500 Real Time PCR System (7300/7500 system) uses
fluorescent-based PCR chemistries to provide quantitative detection of nucleic acid
sequences using real-time analysis and qualitative detection of nucleic acid sequences
using end-point and dissociation-curve analysis.
The 7300/7500 system allows you to perform several assay types using plates or tubes in
the 96-well format. This guide describes the relative quantification (RQ) assay type.
For information about the other assay types, refer to the Sequence Detection Systems
Chemistry Guide (SDS Chemistry Guide) and the Online Help for the 7300/7500 system
(Online Help).
About Relative Quantification
Definition
Relative quantification determines the change in expression of a nucleic acid sequence
(target) in a test sample relative to the same sequence in a calibrator sample. The
calibrator sample can be an untreated control or a sample at time zero in a time-course
study (Livak and Schmittgen, 2001). For example, relative quantification is commonly
used to compare expression levels of wild-type with mutated alleles or the expression
levels of a gene in different tissues.
RQ provides accurate comparison between the initial level of template in each sample,
without requiring the exact copy number of the template. Further, the relative levels of
templates in samples can be determined without the use of standard curves.
Real-time PCR
Assays
RQ is performed using real-time PCR. In real-time PCR assays, you monitor the
progress of the PCR as it occurs. Data are collected throughout the PCR process rather
than at the end of the PCR process (end-point PCR).
In real-time PCR, reactions are characterized by the point in time during cycling when
amplification of a target is first detected rather than by the amount of target accumulated
at the end of PCR.
There are two types of quantitative real-time PCR: absolute and relative.
About RQ Experiments
RQ Experiment
Workflow
In this document, the term “RQ experiment” refers to the entire process of relative
quantification, beginning with generating cDNA from RNA (reverse transcription) and
ending with analyzing an RQ study. The RQ experiment workflow is shown on page iii.
Notes
2
Relative Quantification Getting Started Guide for the 7300/7500 System
About RQ Experiments
RQ Studies with the 7300/7500 System
RQ Studies with
the 7300/7500
System
The data-collection part of an RQ assay is a single-plate document, called the RQ Plate.
Amplification data from PCR runs is stored with sample setup information on the plate.
The data-analysis part of an RQ assay is a multi-plate document, called the RQ Study.
You can analyze up to ten RQ plates in a study. RQ Study documents neither control the
instrument, nor do they provide tools for setting up or modifying plates.
IMPORTANT! RQ Study software is an optional package for the 7300 instrument but is
standard for the 7500 instrument.
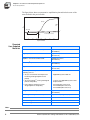
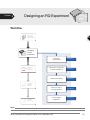
The following figure illustrates the RQ Study process.
Kidney
kidneyplate.sds
Liver
liverplate.sds
Bladder
bladderplate.sds
Plated Reactions
7300/7500 System
SDS Software
RQ Plate Documents
SDS Software
RQ Study Document
Note: The 7300/7500 system software uses only the comparative method (∆∆CT) to
calculate relative quantities of a nucleic acid sequence.
Terms Used in
Quantification
Analysis
Term
Definition
Baseline
The initial cycles of PCR in which there is little change in
fluorescence signal.
Threshold
A level of ∆Rn—automatically determined by the SDS software or
manually set—used for CT determination in real-time assays. The
level is set to be above the baseline and sufficiently low to be within
the exponential growth region of the amplification curve. The
threshold is the line whose intersection with the Amplification plot
defines the CT.
Threshold cycle (CT)
The fractional cycle number at which the fluorescence passes the
threshold.
Passive reference
A dye that provides an internal fluorescence reference to which the
reporter dye signal can be normalized during data analysis.
Normalization is necessary to correct for fluorescence fluctuations
caused by changes in concentration or in volume.
Reporter dye
The dye attached to the 5′ end of a TaqMan probe. The dye
provides a signal that is an indicator of specific amplification.
Normalized reporter
(Rn)
The ratio of the fluorescence emission intensity of the reporter dye
to the fluorescence emission intensity of the passive reference dye.
Delta Rn (∆Rn)
The magnitude of the signal generated by the specified set of PCR
conditions. (∆Rn = Rn − baseline)
Notes
Relative Quantification Getting Started Guide for the 7300/7500 System
3
1
Chapter 1 Introduction and Example RQ Experiment
About RQ Experiments
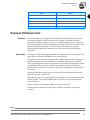
The figure below shows a representative amplification plot and includes some of the
terms defined in the previous table.
Rn+
Sample
Rn
Rn
Threshold
Rn–
No Template Control
Baseline
0
5
10
15
GR0757
CT
20
25
30
35
40
Cycle Number
Required
User-Supplied
Materials
Item
Source
ABI PRISM™ 6100 Nucleic Acid PrepStation
Applied Biosystems
(PN 6100-01)
High Capacity cDNA Archive Kit
Applied Biosystems
(PN 4322171)
TaqMan® Universal PCR Master Mix
Applied Biosystems
(PN 4304437)
MicroAmp® Optical 96-Well Reaction Plate
Applied Biosystems
(PN 4306757)
Optical Adhesive Cover
Applied Biosystems
(PN 4311971)
Labeled primers and probes from one of the
following sources:
• Assays-on-Demand™ Gene Expression
Products (predesigned primers and
probes)
• Applied Biosystems Web site
• Assays-by-Design™ service (predesigned
primers and probes)
• Contact your Applied Biosystems Sales
Representative
• Primer Express Software (customdesigned primers and probes)
• PN 4330710 (1-user license)
PN 4330709 (10-user license)
PN 4330708 (50-user license)
Reagent tubes with caps, 10-mL
Applied Biosystems
(PN 4305932)
Centrifuge with adapter for 96-well plates
Major laboratory supplier (MLS)
Gloves
MLS
Microcentrifuge
MLS
Microcentrifuge tubes, sterile 1.5-mL
MLS
Notes
4
Relative Quantification Getting Started Guide for the 7300/7500 System
Example RQ Experiment
Overview
Item
Source
Nuclease-free water
MLS
Pipette tips, with filter plugs
MLS
Pipettors, positive-displacement
MLS
Safety goggles
MLS
Vortexer
MLS
1
Example RQ Experiment
Overview
To better illustrate how to design, perform, and analyze RQ experiments, this section
guides you through an example experiment. The example experiment represents a
typical RQ experiment setup that you can use as a quick-start procedure to familiarize
yourself with the RQ workflow. Detailed steps in the RQ workflow are described in the
subsequent chapters of this guide. Also in the subsequent chapters are Example
Experiment boxes that provide details for some of the related steps in the example
experiment.
Description
The objective of the example RQ experiment is to compare the levels of expression of 23
genes in the liver, kidney, and bladder tissue of an individual.
The experiment is designed for singleplex PCR – samples and endogenous controls were
amplified in separate wells. Glyceraldehyde-3-phosphate dehydrogenase (GAPDH)
serves as the endogenous control. Four replicates of each sample and endogenous control
are amplified. (In this experiment, an entire 96-well-plate is devoted to each tissue
because the four replicates of each of the 23 genes plus the endogenous control require
all 96 wells.)
Predesigned and labeled primer/probe sets are selected from the Applied Biosystems
Assays-on-Demand™ product line.
Reactions are set up for two-step RT-PCR, where the High Capacity cDNA Archive Kit
and the TaqMan® Universal PCR Master Mix are used for reverse transcription and
PCR, respectively.
Data are generated by running three RQ plates, one for each tissue.
All three plates are analyzed in an RQ study, with the liver samples serving as the
calibrator.
Notes
Relative Quantification Getting Started Guide for the 7300/7500 System
5
Chapter 1 Introduction and Example RQ Experiment
Example RQ Experiment
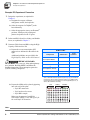
Example RQ Experiment Procedure
1. Design the experiment, as explained in
Chapter 2.
a. Designate the targets, calibrator,
endogenous control, and replicates.
b. Order the reagents for TaqMan® probe-
based chemistry.
c. Order the appropriate Assays-on-Demand™
products, which provide predesigned
primers and probes for the 23 genes.
2. Isolate total RNA from liver, kidney, and bladder
tissue, as explained in Chapter 3.
3. Generate cDNA from total RNA using the High
Capacity cDNA Archive Kit.
a. Prepare the reverse transcription (RT)
master mix as indicated in the table to the
right.
Additional guidelines are provided in the
High Capacity cDNA Archive Kit Protocol.
CHEMICAL HAZARD.
10 × RT Buffer may cause eye, skin, and respiratory
tract irritation. Read the MSDS, and follow the
handling instructions. Wear appropriate protective
eyewear, clothing, and gloves.
RT Master Mix
µL/Reaction
µL/21
reactions a
10✕ Reverse
Transcription Buffer
10
210
25✕ dNTPs
4
84
10✕ random primers
10
210
MultiScribe™
Reverse
Transcriptase, 50 U/µL
5
105
Nuclease-free water
21
441
Total
50
1050
Component
a. Each RT reaction is 100 µL (see step 3b). If you need 5 µL cDNA for
each of 104 PCR reactions per tissue (see step 4), you need 6 RT
reactions per tissue. Extra volume (enough for one additional RT
reaction per tissue) is included to account for pipetting losses, as
well as extra cDNA for archiving.
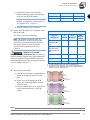
b. Prepare the cDNA archive plate by pipetting
into each well of the plate:
• 50 µL RT master mix
• 30 µL nuclease-free water
• 20 µL RNA sample
Make sure the amount of total RNA
converted to cDNA is 10 to 100 ng in 5 µL
for each 50-µL PCR reaction.
Liver
Kidney
Bladder
GR2322
Notes
6
Relative Quantification Getting Started Guide for the 7300/7500 System
Example RQ Experiment
Example RQ Experiment Procedure
c. Program the thermal cycler using the
indicated parameter values for the RT step
of the two-step RT-PCR method.
Step Type
Time
Temperature
HOLD
10 min
25 °C
Note: You have the option to use one-step
HOLD
120 min
37 °C
1
RT-PCR, as explained in “Selecting One- or
Two-Step RT-PCR” on page 16.
d. Store the cDNA at −20 °C until use.
4. Prepare the PCR master mix as indicated in the
PCR Master Mix
table to the right.
See Chapter 4 for more information.
Note: The reaction volumes for Assay-by-
Design products are specified in the product
insert; those for primers and probes designed
with Primer Express software follow the
universal assay conditions described in
Chapter 4.
CHEMICAL HAZARD.
TaqMan Universal PCR Master Mix may cause eye
and skin irritation. Exposure may cause discomfort if
swallowed or inhaled. Read the MSDS, and follow
the handling instructions. Wear appropriate protective
eyewear, clothing, and gloves.
µL/
Sample
µL/ 5
Reactions b
Final
Concentration
TaqMan Universal
PCR Master Mix
(2✕)
25.0
125.0
1✕
20✕ Assays-onDemand™ Gene
Expression Assay
Mix a
2.5
12.5
1✕
cDNA sample
5.0
25.0
10 to 100
ng
Nuclease-free water
17.5
87.5
—
Total
50.0
250
—
Reaction
Component
a. Contains forward and reverse primers and labeled probe.
b. 24 master mixes are prepared, one for each of 23 genes plus the
endogenous control. Volume for five reactions (4 replicates plus
extra) to account for pipetting losses.
5. Prepare the reaction plates.
a. Label the reaction plates, ensuring that you
include an endogenous control on each
plate.
GR2323
Regulus
Liver_96Plate.eps
Endogenous
controls (GAPDH)
b. Pipette 50 µL of the appropriate PCR
GR2323
master mix (containing cDNA) into each
well of the plate.
c. Keep the reaction plates on ice until you are
ready to load them into the 7300/7500
system.
Liver
samples
GR2324
Regulus
Kidney_96Plate.eps
Kidney
samples
Endogenous
controls (GAPDH)
GR2324
GR2325
Regulus
Bladder_96Plate.eps
Bladder
samples
Endogenous
controls (GAPDH)
GR2325
Notes
Relative Quantification Getting Started Guide for the 7300/7500 System
7
Chapter 1 Introduction and Example RQ Experiment
Example RQ Experiment
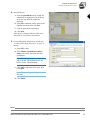
6. Create an RQ Plate document as described in
“Creating a Relative Quantification (RQ) Plate
Document” on page 26. Briefly,
a. Select File > New.
b. Select Relative Quantification (ddCt)
Plate in the Assay drop-down list, then
click Next >.
IMPORTANT! You cannot use AQ Plate
documents for RQ assays and vice versa.
The information stored in AQ and RQ Plate
documents is not interchangeable.
c. Add detectors to the plate document, then
click Next >.
d. Specify the detectors and tasks for each
well, then click Finish.
You cannot add RQ plates to RQ studies
unless you have specified sample names, as
indicated in the message shown to the right.
Click OK.
The SDS software displays the Well
Inspector.
7. Enter the sample names in the Well Inspector
(View > Well Inspector).
IMPORTANT! If your experiment does not use
all the wells on a plate, do not omit the wells
from use at this point. You can omit unused wells
after the run is completed. For more information
about omitting wells, refer to the Online Help.
The figure on the right shows a completed plate
set up.
Notes
8
Relative Quantification Getting Started Guide for the 7300/7500 System
Example RQ Experiment
Example RQ Experiment Procedure
8. Start the RQ run.
a. Select the Instrument tab. By default, the
1
standard PCR conditions for the PCR step
of the two-step RT-PCR method are
displayed.
b. Select File > Save As, enter a name for the
RQ Plate document, then click Save.
c. Load the plate into the instrument.
d. Click Start.
After the run, a message indicates if the run is
successful or if errors were encountered.
9. Create an RQ Study document as described in
“Creating an RQ Study Document” on page 36.
Briefly,
a. Select File > New.
b. Select Relative Quantification (ddCt)
Study in the Assay drop-down list, then
click Next >.
IMPORTANT! RQ Studies are an optional
add-on for the 7300 instrument; they are
built-in for the 7500 instrument.
c. Click Add to add plates to the study, then
click Open.
Note: You can add up to 10 RQ plates to an
RQ study.
d. Click Finish.
Notes
Relative Quantification Getting Started Guide for the 7300/7500 System
9
Chapter 1 Introduction and Example RQ Experiment
Example RQ Experiment
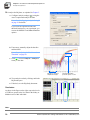
10. Analyze the RQ data, as explained in Chapter 5.
a. Configure analysis settings (
), using the
Auto Ct option and analyze the data.
Note: See “Configuring Analysis Settings”
on page 38 for details.
If you know the optimal baseline and
threshold settings for your experiment, you
can use the Manual Ct and Manual Baseline
options.
b. If necessary, manually adjust the baseline
and threshold.
Note: See “Adjusting the Baseline and
Threshold” on page 40.
c. Click
, or select Analysis > Analyze to
reanalyze the data.
Baseline is set before
amplification begins
Threshold falls within
geometric phase of curve
d. View analysis results by clicking a tab in the
RQ Results pane.
e. If desired, save the RQ Study document.
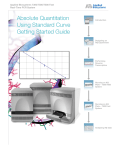
Conclusion
As shown in the figure on the right, expression levels
of CCR2 are greater in the liver than in the kidney or
bladder tissues of this individual.
Notes
10
Relative Quantification Getting Started Guide for the 7300/7500 System
Designing an RQ Experiment
Chapter 2
Workflow
Introduction
and Sample
RQ Experiment
2
Designing
an RQ
Experiment
Primer Extended on mRNA
5′
Synthesis of 1st cDNA strand
3′
Performing
Reverse
Transcription
Select the
PCR method
See page 12
Specify the components
of an RQ experiment
See page 13
Select the chemistry
See page 15
Select one-step or
two-step RT-PCR
See page 16
Choose probes
and primers
See page 17
Generating
Data from
RQ Plates
Performing
an RQ Study
Notes
Absolute Quantification Getting Started Guide for the 7300/7500 System
11
Chapter 2 Designing an RQ Experiment
Selecting the PCR Method
Selecting the PCR Method
Types of PCR
Methods
PCR is performed as either of the following:
• A singleplex reaction, where a single primer pair is present in the reaction tube or
well. Only one target sequence or endogenous control can be amplified per reaction.
• A multiplex reaction, where two or more primer pairs are present in the reaction.
Each primer pair amplifies either a target sequence or an endogenous control.
Target Primer Set
Endogenous Control
Primer Set
Singleplex PCR
Selection Criteria
Multiplex PCR
cDNA
GR2331
Both methods give equivalent results for relative quantification experiments. To select a
method, consider the:
• Type of chemistry you use to detect PCR products – Singleplex PCR can use either
SYBR® Green or TaqMan reagent-based chemistry. Multiplex PCR can use only
TaqMan chemistry.
• Amount of time you want to spend optimizing and validating your experiment –
Amplifying target sequences and endogenous controls in separate reactions
(singleplex PCR) requires less optimization and validation than multiplex PCR.
Among the factors to consider in multiplex PCR are primer limitation, the relative
abundance of the target and reference sequences (the endogenous control must be
more abundant than the targets), and the number of targets in the study.
IMPORTANT! As the number of gene targets increases, the singleplex format is
typically more effective than the multiplex format because less optimization is
required.
Additionally, running multiple reactions in the same tube multiplex PCR increases
throughput and reduces the effects of pipetting errors.
For more information about multiplex and singleplex PCR, refer to the SDS Chemistry
Guide (PN 4348358).
Example Experiment
The singleplex PCR method is used in the example experiment because:
• The number of targets to be amplified (23 genes, plus one endogenous control) is large
• Optimization and validation requirements are reduced for singleplex experiments
Notes
12
Absolute Quantification Getting Started Guide for the 7300/7500 System
Specifying the Components of an RQ Experiment
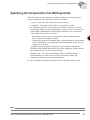
Specifying the Components of an RQ Experiment
After you decide to use the singleplex or multiplex method, you need to specify the
required components of the RQ experiment for every sample:
• A target – The nucleic acid sequence that you are studying.
• A calibrator – The sample used as the basis for comparative results.
• An endogenous control – A gene present at a consistent expression level in all
experimental samples. By using an endogenous control as an active reference, you
can normalize quantification of a cDNA target for differences in the amount of
cDNA added to each reaction. Note that:
– Each sample type (for example, each tissue in a study comparing multiple
tissues) requires an endogenous control.
– If samples are spread across multiple plates, each plate must have an endogenous
control. Additionally, every plate must include an endogenous control for every
sample type on the plate.
Typically, housekeeping genes such as β-actin, glyceraldehyde-3-phosphate
(GAPDH), and ribosomal RNA (rRNA), are used as endogenous controls, because
their expression levels tend to be relatively stable.
• Replicate wells – For relative quantification studies, Applied Biosystems
recommends the use of three or more replicate reactions per sample and
endogenous control to ensure statistical significance.
For more information about these requirements, refer to the SDS Chemistry Guide.
Notes
Absolute Quantification Getting Started Guide for the 7300/7500 System
13
2
Chapter 2 Designing an RQ Experiment
Specifying the Components of an RQ Experiment
Example Experiment
In the example experiment, the objective is to compare the expression levels of several genes in the liver, kidney, and
bladder tissue of an individual. The 23 genes of interest, including ACVR1, ACVR2, CCR2, CD3D, and FLT4, are the targets
and the liver samples serve as the calibrator.
The SDS software sets gene expression levels for the calibrator samples to 1. Consequently, if more ACRV1 is in the kidney
than in the liver, the gene expression level of ACRV1 in the kidney is greater than 1. Similarly, if less CD3D is in the bladder
than in the liver, the gene expression level of CD3D in the bladder is less than 1.
Because RQ is based on PCR, the more template in a reaction, the more the PCR product and the greater the fluorescence.
To adjust for possible differences in the amount of template added to the reaction, GAPDH serves as an endogenous
control. (Expression levels of the endogenous control are subtracted from expression levels of target genes.) An
endogenous control is prepared for each tissue.
The experiment includes three sets of endogenous controls—one for each tissue. Also, the endogenous control for each
tissue must be amplified on the same plate as the target sequences for that tissue. Finally, note that the experiment uses
the singleplex PCR format, and therefore, the endogenous controls are amplified in wells different from the target wells.
Four replicates of each sample and endogenous control are performed to ensure statistical significance (see below).
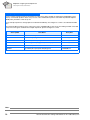
Note: The example RQ experiment requires a separate plate for each of the three tissues because of the large number of
genes being studied. Experiments can also be designed so that several samples are amplified on the same plate, as
shown in the following table.
In the example RQ experiment, each plate contains a
single sample type (tissue). The endogenous control for
each tissue is on the same plate as the targets for that
tissue.
If the example experiment were run with multiple sample
types on the same plate, an endogenous control for each
sample type must also be included on the same plate, as
shown here.
Liver
GR2323
Regulus
Liver_96Plate.eps
Liver
samples
Kidney
Bladder
GR2322
Regulus
LivKidBladPlate.eps
Samples
Endogenous
controls (GAPDH)
GR2323
GR2322
GR2324
Regulus
Kidney_96Plate.eps
Endogenous
controls (GAPDH)
Kidney
samples
Endogenous
controls (GAPDH)
GR2324
GR2325
Regulus
Bladder_96Plate.eps
Bladder
samples
Endogenous
Notes
14
Absolute Quantification Getting Started Guide for the 7300/7500 System
Selecting the Chemistry
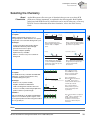
About Chemistries
Selecting the Chemistry
About
Chemistries
Applied Biosystems offers two types of chemistries that you can use to detect PCR
products on real-time instruments, as explained in the following table. Both TaqMan
probe-based and SYBR Green I dye chemistries can be used for either one- or two-step
RT-PCR. For more information about these chemistries, refer to the SDS Chemistry
Guide.
Chemistry
TaqMan® reagents or kits
Description
TaqMan reagent-based chemistry uses a
fluorogenic probe to enable detection of a specific
PCR product as it accumulates during PCR cycles.
Process
Polymerization
FORWARD
PRIMER
5′
3′
PROBE
R = REPORTER
Q
3′
R
Q = QUENCHER
5′
5′
3′
5′
REVERSE
PRIMER
Q
5′
3′
• Increases specificity with a probe. Specific
hybridization between probe and target
generates fluorescence signal.
Cleavage
3′
5′
Polymerization Completed
R
R
Q
Q
3′
5′
3′
5′
5′
3′
5′
Step 2: During each extension
cycle, the AmpliTaq Gold® DNA
polymerase cleaves the reporter
dye from the probe.
SYBR® Green I reagents
3′
5′
3′
5′
5′
3′
5′
Step 3: After being separated from
the quencher, the reporter dye
emits its characteristic
fluorescence.
Step 1: Reaction setup
The SYBR® Green I dye
fluoresces when bound to
double-stranded DNA.
Description
Uses SYBR Green I dye, a double-stranded DNA
binding dye, to detect PCR products as they
accumulate during PCR cycles.
Step 2: Denaturation
When the DNA is denatured,
the SYBR® Green I dye is
released and the fluorescence
is drastically reduced.
Advantages
• Reduces cost (no probe needed)
• Amplifies all double-stranded DNA
5′
Step 1 continued: when both dyes
are attached to the probe, reporter
dye emission is quenched.
• Optimized assays available
• Allows 5′-nuclease assay to be carried out
during PCR
3′
5′
Step 1: A reporter (R) and a
quencher (Q) are attached to the
5' and 3' ends of a TaqMan
probe.
Advantages
• Provides multiplex capability
Strand Displacement
R
FORWARD
PRIMER
Step 3: Polymerization
During extension, primers
anneal and PCR product
is generated.
• Yields a melting profile of distinct PCR runs
• Increases sensitivity for detecting amplification
products relative to product length
REVERSE
PRIMER
Limitations
Binds nonspecifically to all double-stranded DNA
sequences. To avoid false positive signals, check
for nonspecific product formation using dissociation
curve or gel analysis.
Step 4: Polymerization completed
SYBR® Green I dye binds to the
double-stranded product,
resulting in a net increase in
fluorescence detected by the
instrument.
Notes
Absolute Quantification Getting Started Guide for the 7300/7500 System
15
2
Chapter 2 Designing an RQ Experiment
Selecting One- or Two-Step RT-PCR
Selecting One- or Two-Step RT-PCR
When performing real-time PCR, you have the option
of performing reverse transcription (RT) and PCR in a
single reaction (one-step) or in separate reactions
(two-step).The reagent configuration you use depends
on whether you are performing one-step or two-step
RT-PCR:
• Two-step RT-PCR is performed in two separate
reactions: first, total RNA is reverse transcribed
into cDNA, then the cDNA is amplified by PCR.
This method is useful for detecting multiple
transcripts from a single cDNA template or for
storing cDNA aliquots for later use. AmpErase®
UNG enzyme can be used to prevent carryover
contamination.
Two-Step RT-PCR
Sample RNA
RT Master Mix
RT Incubation
Aliquot DNA
IMPORTANT! This guide assumes that RQ
experiments are designed using two-step RTPCR. For additional options, refer to the SDS
Chemistry Guide.
Archive
PCR Master Mix
PCR Amplification
and Detection
Results
One-Step RT-PCR
Sample RNA
RT
Master Mix
PCR
Master Mix
RT Incubation and
PCR Amplification
Results
GR2333
• In one-step RT-PCR, RT and PCR take place in
one buffer system, which provides the
convenience of a single-tube preparation for RT
and PCR amplification. However, you cannot use
the carryover prevention enzyme, AmpErase®
UNG (uracil-N-glycosylase), with one-step RTPCR. For more information about UNG, refer to
the SDS Chemistry Guide.
Notes
16
Absolute Quantification Getting Started Guide for the 7300/7500 System
Choosing the Probes and Primers
Recommended Kits for Two-Step RT-PCR
Chemistry
Step
TaqMan reagents or kits
SYBR Green I reagents or kits
Reagent
Part Number
RT
High Capacity cDNA Archive Kit
4322171
PCR
TaqMan Universal PCR Master Mix
4304437
RT
High Capacity cDNA Archive Kit
4322171
PCR
SYBR Green Master Mix
4309155
RT and PCR
SYBR Green RT-PCR Reagents
4310179
Example Experiment
Premade probes and primers for all the genes of interest are available from the Assays-on-Demand™ product line, which
uses TaqMan chemistry. Two-step RT-PCR is performed using the reagents recommended for TaqMan reagent- or kitbased chemistry in the table above.
2
Choosing the Probes and Primers
Choose probe and primer sets for both your target and endogenous control sequences.
Applied Biosystems provides three options for choosing primers and probes:
• Assays-on-Demand™ Gene Expression Products – Provide you with optimized,
ready-to-use TaqMan 5′-nuclease assays for human, mouse, or rat transcripts. For
information on available primer/probe sets, go to:
http://www.allgenes.com
• Assays-by-DesignSM Service – Designs, synthesizes, formulates, and delivers
quality-controlled primer and probe sets. Use this service if the assay you need is
not currently available. To place an order, contact your Applied Biosystems
representative.
• Primer Express® Software – Helps you design primers and probes for your own
quantification assays. For more information about using this software, refer to the
Primer Express Software v2.0 User’s Manual (PN 4329500).
Applied Biosystems provides assay design guidelines that have been developed
specifically for quantification assays. When followed, these guidelines provide a
reliable system for assay design and optimization. For information about the assay
design guidelines, refer to the SDS Chemistry Guide.
If you ordered Assays-on-Demand or Assays-by-Design products, probes are already
labeled with a reporter dye. If you design your own assays, you need to specify a reporter
dye for your custom probe(s). For singleplex experiments, you can use the same dye for
targets and endogenous control(s). For multiplex experiments, the probe for the target is
typically labeled with FAM dye and that for the endogenous control with VIC® dye.
Notes
Absolute Quantification Getting Started Guide for the 7300/7500 System
17
Chapter 2 Designing an RQ Experiment
Choosing the Probes and Primers
Example Experiment
For the example experiment, primers and probes for all the genes being studied are obtained from Applied Biosystems
Assays-on-Demand™ products. Each assay consists of two unlabeled PCR primers and a FAM™ dye-labeled TaqMan®
MGB probe, provided as a 20✕ assay mix.
In the example experiment, all target probes are labeled with FAM dye; the endogenous control is also labeled with FAM
dye.
The following table provides the gene symbol, gene name, and Applied Biosystems Assay ID number (provided on the Web
site) for five of the genes studied in the example experiment, plus the endogenous control.
Gene Symbol
Gene Name
Assay ID #
ACVR1
acrosomal vesicle protein I
Hs00153836 m1
ACVR2
activin A receptor, type II
Hs00155658_m1
CCR2
chemokine (C-C motif) receptor 2
Hs00174150_m1
CD3D
CD3D antigen, delta polypeptide (TiT3 complex)
Hs00174158_m1
FLT4
fms-related tyrosine kinase 4
Hs00176607 m1
GAPDH
glyceraldehyde-3-phosphate dehydrogenase
Hs99999905 m1
Notes
18
Absolute Quantification Getting Started Guide for the 7300/7500 System
Chapter 3
Performing Reverse Transcription
Primer Extended on mRNA
5′
3′
Reverse
Primer
5′ cDNA
Oligo d(T) or random hexamer
Synthesis of 1st cDNA strand
3′
5′ cDNA
Workflow
Introduction
and Sample
RQ Experiment
Designing
an RQ
Experiment
3
Primer Extended on mRNA
5′
3′
Reverse
Primer
5′ cDNA
Oligo d(T) or random hexamer
Synthesis of 1st cDNA strand
3′
5′ cDNA
Performing
Reverse
Transcription
Generating
Data from
RQ Plates
Isolate total RNA
See page 20
Adjust RNA
concentration
See page 20
Convert
total RNA to cDNA
See page 21
Performing
an RQ Study
Notes
Absolute Quantification Getting Started Guide for the 7300/7500 System
19
Primer Extended on mRNA
5′
3′
Reverse
Primer
Chapter 3 Performing Reverse Transcription
5′ cDNA
Oligo d(T) or random hexamer
Synthesis of 1st cDNA strand
5′ cDNA
3′
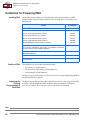
Guidelines for Preparing RNA
Guidelines for Preparing RNA
Isolating RNA
Applied Biosystems supplies several instrument systems and chemistries for RNA
isolation from a variety of starting materials, such as blood, tissue, cell cultures, and
plant material.
System
ABI PRISM™ 6100 Nucleic Acid PrepStation
Part Number
6100-01
Total RNA Chemistry Reagents:
Quality of RNA
Nucleic Acid Purification Elution Solution
4305893
Nucleic Acid Purification Lysis Solution
4305895
Nucleic Acid Purification Wash Solution I
4305891
Nucleic Acid Purification Wash Solution II
4305890
AbsoluteRNA Wash Solution (DNase treatment)
4305545
Tempus™
Blood RNA Tubes
(For collection, stabilization, and isolation of total RNA in whole blood
for gene analysis using the 6100 PrepStation)
4342972
Isolation of Total RNA from Whole Blood and from Cells Isolated from
Whole Blood Protocol
4332809
Tempus™ Blood RNA Tube and Large Volume Consumables Protocol
4345218
Tissue RNA Isolation: Isolation of Total RNA from Plant and Animal
Tissue Protocol
4330252
The total RNA you use for RQ experiments should:
• Have an A260/280 greater than 1.9
• Be intact when visualized by gel electrophoresis
• Not contain RT or PCR inhibitors
The High Capacity cDNA Archive Kit Protocol (4312169) contains additional guidelines
for preparing the RNA template.
Adjusting the
Starting
Concentration of
Total RNA
The High Capacity cDNA Archive Kit is optimized to convert 0.1 to 10 µg of total RNA
to cDNA. Convert enough total RNA so that the final concentration of total RNA
converted to cDNA is 10 to 100 ng in 5 µL for each 50-µL PCR reaction.
Notes
20
Absolute Quantification Getting Started Guide for the 7300/7500 System
Converting Total RNA to cDNA
Using the High Capacity cDNA Archive Kit
Primer Extended on mRNA
5′
3′
Reverse
Primer
5′ cDNA
Oligo d(T) or random hexamer
Synthesis of 1st cDNA strand
5′ cDNA
3′
Converting Total RNA to cDNA
Using the High
Capacity cDNA
Archive Kit
Use the High Capacity cDNA Archive Kit (PN 4322171) to perform the first step (RT)
in the two-step RT-PCR method. Follow the manual method for converting total RNA
into cDNA, as specified in the High Capacity cDNA Archive Kit Protocol (PN 4322169).
IMPORTANT! The protocol is not shipped with the High Capacity cDNA Archive Kit.
Download the protocol from
http://docs.appliedbiosystems.com/search.taf
To search for the document, select ABI PRISM™ 6100 Nucleic Acid PrepStation in the
Product list box, then click Search at the bottom of the page. The protocol is listed under
the Protocols heading.
Thermal Profile
Parameters for RT
The High Capacity cDNA Archive Kit uses the following thermal profile parameters for
the RT step.
Step Type
Time
Temperature
HOLD
10 min
25 °C
HOLD
120 min
37 °C
3
Note: Thermal cycling conditions for one-step RT-PCR are described on page 30.
Notes
Absolute Quantification Getting Started Guide for the 7300/7500 System
21
Primer Extended on mRNA
5′
3′
Reverse
Primer
Chapter 3 Performing Reverse Transcription
5′ cDNA
Oligo d(T) or random hexamer
Synthesis of 1st cDNA strand
5′ cDNA
3′
Converting Total RNA to cDNA
Storing cDNA
After cDNA conversion, store all cDNA samples at −15 to −25 °C. To minimize
repeated freeze-thaw cycles of cDNA, store cDNA samples in aliquots.
CHEMICAL HAZARD. 10 × RT Buffer may cause eye, skin, and
respiratory tract irritation. Read the MSDS, and follow the handling instructions. Wear
appropriate protective eyewear, clothing, and gloves.
Example Experiment
For the example experiment, RNA is extracted from the liver, bladder, and kidney tissues of an individual. RNA
concentration is determined spectrophotometrically (using A260), and the RNA is diluted to a final concentration of 50 ng/µL.
The RT master mix is prepared as follows, using guidelines from the High Capacity cDNA Archive Kit Protocol:
µL/Reaction
µL/21 Reactions a
10✕ Reverse Transcription Buffer
10
210
25✕ dNTPs
4
84
10✕ random primers
10
210
MultiScribe™ Reverse Transcriptase, 50
U/µL
5
105
Nuclease-free water
21
441
Total per reaction
50
1050
Component
a. Each RT reaction is 100 µL (see below). If you need 5 µL cDNA for each of 104 PCR reactions per tissue (see “Creating a
Relative Quantification (RQ) Plate Document” on page 26), you need 6 RT reactions per tissue. Extra volume (enough for one
additional RT reaction per tissue) is included to account for pipetting losses, as well as extra cDNA for archiving.
The cDNA archive plate is then prepared by pipetting into each well:
• 50 µL of the RT master mix
• 30 µL of nuclease-free water
• 20 µL of RNA sample (bringing the total starting amount of RNA to 1 µg per 100 µL reaction)
Liver
Kidney
Bladder
GR2322
The RNA is then converted to cDNA using the thermal cycling parameters for two-step RT-PCR, as described in “Thermal
Profile Parameters for RT” on page 21.
The cDNA is stored at −20 °C until use.
Notes
22
Absolute Quantification Getting Started Guide for the 7300/7500 System
Chapter 4
Generating Data from RQ Plates
Workflow
Introduction
and Sample
RQ Experiment
Designing
an RQ
Experiment
Primer Extended on mRNA
5′
3′
Reverse
Primer
5′ cDNA
Oligo d(T) or random hexamer
Synthesis of 1st cDNA strand
3′
5′ cDNA
Performing
Reverse
Transcription
Prepare the
PCR Master Mix
See page 24
Create a new
RQ Plate document
See page 26
Create detectors
See page 26
Program the
thermal cycling conditions
See page 30
Save the
RQ Plate document
See page 31
Start the run
See page 31
View RQ plate data
See page 32
4
Generating
Data from
RQ Plates
Performing
an RQ Study
Notes
Absolute Quantification Getting Started Guide for the 7300/7500 System
23
Chapter 4 Generating Data from RQ Plates
Before You Begin
Before You Begin
Check that background and pure-dye runs have been performed regularly to ensure
optimal performance of the 7300/7500 system. For more information about calibrating
the 7300/7500 system, refer to the Online Help.
Preparing the PCR Master Mix
The second step (PCR) in the two-step RT-PCR procedure is amplifying the cDNA,
which you perform using the TaqMan® Universal PCR Master Mix reagents.
The TaqMan Universal PCR Master Mix Protocol (PN 4304449) explains how to use the
reagents in the kit. The following table lists the universal assay conditions (volume and
final concentration) for using the master mix.
CHEMICAL HAZARD. TaqMan Universal PCR Master Mix
may cause eye and skin irritation. Exposure may cause discomfort if swallowed or
inhaled. Read the MSDS, and follow the handling instructions. Wear appropriate
protective eyewear, clothing, and gloves.
Reaction Component
µL/ Sample
Final Concentration
TaqMan Universal PCR Master Mix (2✕)
25.0
1✕
Forward primer
5.0
50 to 900 nM
Reverse primer
5.0
50 to 900 nM
TaqMan probe
5.0
50 to 250 nM
cDNA sample
5.0
10 to 100 ng
Nuclease-free water
5.0
—
Total
50.0
—
If you design probes and primers using Primer Express software, they must be optimized
to work with the universal assay conditions, using the volumes listed in the table above.
All Assays-by-Design and Assays-on-Demand products are formulated so that the final
concentration of the primers and probes are within the recommended values.
Notes
24
Absolute Quantification Getting Started Guide for the 7300/7500 System
Preparing the Reaction Plate
Preparing the Reaction Plate
1. Label the reaction plates, ensuring that you include an endogenous control for each
sample type (for example, each tissue in a study comparing multiple tissues). If
samples are spread across multiple plates, each plate must have an endogenous
control. Additionally, every plate must include an endogenous control for every
sample type on the plate.
2. Into each well of the reaction plate, add 50 µL of the appropriate PCR master mix.
3. Keep the reaction plates on ice until you are ready to load them into the 7300/7500
system.
Example Experiment
Primers and probes for the example RQ experiment are obtained from the Assays-on-Demand product line and are
provided as a 20✕ Gene Expression Assay Mix. The PCR master mix is prepared as follows:
Reaction Component
µL/
Sample
µL/ 5 Reactions b
Final Concentration
TaqMan Universal PCR Master Mix (2✕)
25.0
125.0
1✕
20✕ Assays-on-Demand™ Gene
Expression Assay Mix a
2.5
12.5
1✕
cDNA sample
5.0
25.0
50 ng (for the 50-µL reaction)
Nuclease-free water
17.5
87.5
—
Total
50.0
250
—
a. Contains forward and reverse primers and labeled probe.
b. 24 master mixes are prepared, one for each of 23 genes plus the endogenous control. Volume for five reactions (4 replicates plus extra)
to account for pipetting losses.
Samples and endogenous controls are arranged on three plates as shown below. 50 µL of PCR master mix containing
cDNA are added to each well.
GR2323
Regulus
Liver_96Plate.eps
Liver
samples
GR2325
Regulus
Bladder_96Plate.eps
Endogenous
controls (GAPDH)
GR2323
GR2324
Regulus
Kidney_96Plate.eps
4
Bladder
samples
Endogenous
controls (GAPDH)
GR2325
Kidney
samples
Endogenous
controls (GAPDH)
GR2324
The reactions are kept on ice until the plates are loaded on the 7300/7500 system.
Notes
Absolute Quantification Getting Started Guide for the 7300/7500 System
25
Chapter 4 Generating Data from RQ Plates
Creating a Relative Quantification (RQ) Plate Document
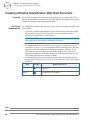
Creating a Relative Quantification (RQ) Plate Document
Overview
An RQ Plate document stores data collected from an RQ run for a single plate. There
must be one RQ Plate document for every RQ plate. RQ Plate documents also store other
information, including sample names and detectors.
Run Setup
Requirements
For each RQ plate document that you create, specify detectors, endogenous controls, and
detector tasks:
• A detector is a virtual representation of a gene-specific nucleic acid probe reagent
used in assays. You specify which detector to use for each target sequence.
Appendix A explains how to create detectors.
IMPORTANT! To conduct a comparative analysis of the data in a study, all the
plates in the study must contain a common set of detectors.
• An endogenous control(s) (as defined in “Specifying the Components of an RQ
Experiment” on page 13). If your experiment consists of multiple plates, each plate
must have at least one endogenous control with at least three replicates. If your
experiment consists of a single plate with multiple samples, there must be an
endogenous control for each sample. All plates in an RQ experiment must use the
same endogenous control (for example, GAPDH).
• A detector task specifies how the software uses the data collected from the well
during analysis. You apply one of two tasks to each detector in each well of a plate
document.
Task
Symbol
Apply to detectors of...
Target
Wells that contain PCR reagents for the amplification of target
sequences.
Endogenous
Control
Wells that contain reagents for the amplification of the
endogenous control sequence.
Notes
26
Absolute Quantification Getting Started Guide for the 7300/7500 System
Creating a Relative Quantification (RQ) Plate Document
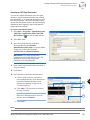
Creating an RQ Plate Document
Creating an RQ Plate Document
You can enter sample information into a new plate
document, import sample information from existing
plate documents, or use a template document to set up
new plate documents. This section describes setting
up new plate documents. Refer to the Online Help for
information about importing sample information or
using template documents.
To create a new plate document:
1. Select Start > Programs > Applied Biosystems
7300/7500 > Applied Biosystems 7300/7500
SDS Software (
) to start the SDS software.
2. Select File > New.
3. In the Assay drop-down list of the New
Document Wizard, select Relative
Quantification (ddCt) Plate. Accept the default
settings for Container and Template
(96-Well Clear and Blank Document).
IMPORTANT! You cannot use RQ Plate
documents for AQ assays and vice versa. The
information stored in AQ and RQ Plate
documents is not interchangeable.
4. Enter a name in the Default Plate Name field, or
accept the default.
5. Click Next >.
6. Select detectors to add to the plate document.
a. Click to select a detector. (Ctrl-click to
select multiple detectors.) If no detectors are
listed in the Detector Manager, create
detectors as explained in Appendix A,
“Creating Detectors.”
6a
6b
b. Click Add>>. The detectors are added to
the plate document.
Note: To remove a detector from the
Detectors in Document panel, select the
detector, then click Remove.
6c
c. Click Next >.
Notes
Absolute Quantification Getting Started Guide for the 7300/7500 System
27
4
Chapter 4 Generating Data from RQ Plates
Creating a Relative Quantification (RQ) Plate Document
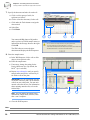
7. Specify the detectors and tasks for each well.
a. Click a well (or group of wells, for
replicates) to select it.
b. Click to select the detector(s) for the well.
c. Click under the Task column to assign the
detector task.
d. Select Use.
e. Click Finish.
7a
7d
7e
7c
You cannot add RQ plates to RQ studies
unless you have specified sample names, as
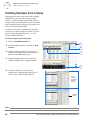
indicated in the message shown to the right.
Click OK.
The SDS software creates the plate
document and displays the Well Inspector.
8. Enter the sample names.
a. In the Well Inspector, click a well or click-
drag to select replicate wells.
b. Enter the sample name.
c. If necessary, change the setting for the
Passive Reference dye. (By default, the
ROX™ dye is selected.)
d. Repeat steps a through c until you specify
sample names and passive reference dyes
for all the wells on the plate.
IMPORTANT! If your experiment does not
use all the wells on a plate, do not omit the
wells from use at this point. You can omit
unused wells after the run. For information
about omitting unused wells, refer to the
Online Help.
Note: You can change the sample setup
8a
8b
8e
8c
information (sample name, detector, task)
after a run is complete.
e. Close the Well Inspector.
Notes
28
Absolute Quantification Getting Started Guide for the 7300/7500 System
Creating a Relative Quantification (RQ) Plate Document
Creating an RQ Plate Document
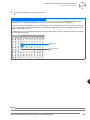
9. Verify the information on each well in the Setup
tab.
Example Experiment
In the example RQ experiment, the samples for each of the three tissues (liver, kidney, and bladder) are loaded on three
separate plates. Consequently, three RQ Plate documents are created, one for each of the sample plates.
Because the experiment is singleplex, there is only one sample—either a target or endogenous control—in each well. Each
well is associated with a detector (indicated by the colored squares). Additionally, each well is assigned a detector task—T
(target) or E (endogenous control).
The figure below shows the example RQ Plate document after sample names, detectors, and detector tasks are assigned
for each well in the liver plate.
Sample name
Detector task and
color
4
Notes
Absolute Quantification Getting Started Guide for the 7300/7500 System
29
Chapter 4 Generating Data from RQ Plates
Specifying Thermal Cycling Conditions and Starting the Run
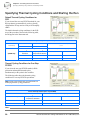
Specifying Thermal Cycling Conditions and Starting the Run
Default Thermal Cycling Conditions for
PCR
If you selected the two-step RT-PCR method for your
RQ experiment (recommended), you have already
completed the RT step and are ready to PCR amplify
cDNA.
The default thermal cycling conditions for the PCR
step of the procedure, shown in the following table,
should appear in the Instrument tab.
Times and Temperatures (Two-step RT-PCR)
1) RT Step
HOLD
HOLD
10 min @ 25 °C
120 min @ 37 °C
* For reference only. RT is complete at this
point.
Initial Steps
®
2) PCR Step
PCR (Each of 40 cycles)
®
AmpErase UNG
Activation
AmpliTaq Gold DNA
Polymerase Activation
Melt
HOLD
HOLD
CYCLE
2 min @ 50 °C
10 min @ 95 °C
15 sec @ 95 °C
Anneal/Extend
1 min @ 60 °C
Thermal Cycling Conditions for One-Step
RT-PCR
If you select the one-step RT-PCR method, cDNA
generation and amplification take place
simultaneously at this point in the workflow.
The following table shows the thermal cycling
conditions for one-step RT-PCR experiments.
Note: Refer to the Online Help for instructions on
modifying thermal cycling parameters.
Times and Temperatures (One-step RT-PCR)
Initial Steps
PCR (Each of 40 Cycles)
Reverse Transcription
AmpliTaq® Gold DNA
Polymerase Activation
HOLD
HOLD
30 min @ 48 °C
10 min @ 95 °C
Melt
Anneal/Extend
CYCLE
15 sec @ 95 °C
1 min @ 60 °C
Notes
30
Absolute Quantification Getting Started Guide for the 7300/7500 System
Specifying Thermal Cycling Conditions and Starting the Run
Thermal Cycling Conditions for One-Step RT-PCR
To specify thermal cycling conditions and start the
run:
1. Select the Instrument tab.
By default, the standard PCR conditions for the
PCR step of the two-step RT-PCR method are
displayed.
2. Verify that:
• For two-step RT-PCR, the default PCR
thermal cycling conditions are set.
• For one-step RT-PCR, you set the thermal
cycling parameters as shown in “Thermal
Cycling Conditions for One-Step RT-PCR”
on page 30.
• Sample volume is 50 µL.
• 9600 Emulation is selected.
Note: If you are using SYBR Green I
chemistry and you want to determine if
there is contamination or if you want to
determine the dissociation temperature,
create a separate Dissociation assay or
template. Refer to the Online Help for more
information.
Note: In the 7300 instrument, the 9600
Emulation feature is not available.
3. Select File > Save As, enter a name for the RQ
Plate document, then click Save.
4. Load the plate into the instrument..
Note: The A1 position is in the top-left side of
Well A1
the instrument tray.
5. Click Start.
As the instrument performs the PCR run, it
displays real-time status information in the
Instrument tab and records the fluorescence
emissions.
4
12
Keyed
corner
After the run, a message indicates whether or not
the run is successful.
All data generated during the run are saved to the
RQ Plate document that you specified in step 3.
Notes
Absolute Quantification Getting Started Guide for the 7300/7500 System
31
Chapter 4 Generating Data from RQ Plates
Analyzing and Viewing RQ Plate Data
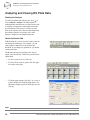
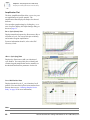
Analyzing and Viewing RQ Plate Data
Starting the Analysis
To analyze RQ Plate data after the run, click
or
select Analysis > Analyze. The SDS software
mathematically transforms the raw fluorescence data
to establish a comparative relationship between the
spectral changes in the passive reference dye and
those of the reporter dyes. Based on that comparison,
the software generates four result views: Plate,
Spectra, Component, and Amplification Plot.
About the Results Tab
In the Results tab, you can view the results of the run
and change the parameters. For example, you can
omit samples or manually set the baseline and
threshold. If you change any parameters, you should
reanalyze the data.
The Results tab has four secondary tabs, each of
which is described below. Details are provided in the
Online Help.
• To move between views, click a tab.
• To select all 96 wells on a plate, click the upperleft corner of the plate.
• To adjust graph settings, click the y- or x-axes of
a plot to display the Graph Settings dialog. The
adjustable settings depend on which plot you are
viewing.
Notes
32
Absolute Quantification Getting Started Guide for the 7300/7500 System
Analyzing and Viewing RQ Plate Data
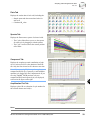
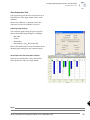
Plate Tab
Plate Tab
Displays the results data of each well, including the:
• Sample name and detector task and color for
each well
• Calculated Rn value
Spectra Tab
Displays the fluorescence spectra of selected wells.
• The Cycles slider allows you to see the spectra
for each cycle by dragging it with the pointer.
• The Cycle # text box shows the current position
of the slider.
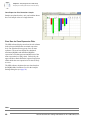
Component Tab
Displays the complete spectral contribution of each
dye in a selected well over the duration of the PCR
run. Only the first selected well is shown at one time.
Note: If you are using TaqMan® products, three
components (ROX® dye, reporter dye, and TAMRA™
quencher) are displayed in the Component tab. If you
are using TaqMan® MGB products, only two
components (ROX and reporter dyes) are displayed,
as shown in the figure on the right.
4
Amplification Plot Tab
Displays a plot of Rn as a function of cycle number for
the selected detector and well(s).
Notes
Absolute Quantification Getting Started Guide for the 7300/7500 System
33
Chapter 4 Generating Data from RQ Plates
Exporting RQ Plate Data
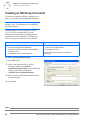
Reanalyzing Data
Raw fluorescence data (spectra), Rn values, and well
information (sample name, detector, and detector
task) are saved in an RQ plate document.
If you decide to omit wells or change well
information after a run is complete, you must
reanalyze the data.
Note: After the software analyzes data, the Analyze
button is disabled ( ). Whenever you change a
setting that requires reanalysis, the Analyze button is
enabled ( ).
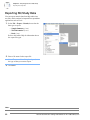
Exporting RQ Plate Data
You can export numeric data from RQ plates into text
files, which can then be imported into spreadsheet
applications such as Microsoft Excel.
1. Select File > Export, then select the data type to
export:
• Sample Setup (*.txt)
• Calibration Data (*.csv)
• Background Spectra (*.csv)
• Component (*.csv)
• Rn (*.csv)
Typically, you export sample setup data for
newly created and newly run plates; other data
types are exported for existing plates.
2. Enter a file name for the export file.
Note: The name of the dialog box depends on
the type of data you want to export.
3. Click Save.
Notes
34
Absolute Quantification Getting Started Guide for the 7300/7500 System
Chapter 5
Analyzing Data in an RQ Study
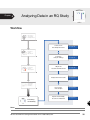
Workflow
Introduction
and Sample
RQ Experiment
Create a new
RQ Study document
See page 36
Configure
analysis settings
See page 38
Adjust the
baseline and threshold
See page 40
Analyze and view results
See page 45
If necessary,
omit samples
See page 50
Export the RQ Study
document, if desired
See page 52
Designing
an RQ
Experiment
Primer Extended on mRNA
5′
3′
Reverse
Primer
5′ cDNA
Oligo d(T) or random hexamer
Synthesis of 1st cDNA strand
3′
5′ cDNA
Performing
Reverse
Transcription
Generating
Data from
RQ Plates
Performing
an RQ Study
5
Notes
Absolute Quantification Getting Started Guide for the 7300/7500 System
35
Chapter 5 Analyzing Data in an RQ Study
Creating an RQ Study Document
Creating an RQ Study Document
To conduct a comparative analysis of RQ plates in a
study, you must first create an RQ Study document.
IMPORTANT! RQ Study software is an optional
package for the 7300 instrument but is standard for
the 7500 instrument.
The SDS software uses the comparative method
(2− ∆∆Ct) of relative quantification. For more
information about methods of calculating relative
quantification, refer to ABI PRISM® 7700 Sequence
Detection System User Bulletin #2 (PN 4303859).
In an RQ study, you can...
You cannot
• Select the endogenous control and the calibrator sample.
• Create, add, or modify samples.
• Select the control type when applicable.
• Create, add, or modify detectors.
• Set baseline and threshold values and RQ Min/Max
Confidence Levels.
• Change detector tasks.
• Omit individual wells or sample replicates.
(You can perform these operations in RQ Plate
documents.)
To create a new RQ Study document:
1. Select File> New.
2. In the Assay drop-down list of the New
Document Wizard, select Relative
Quantification (ddCt) Study. Accept the default
settings for Container and Template
(96-Well Clear and Blank Document).
3. Enter a name in the Default Plate Name field, or
accept the default.
4. Click Next>.
Notes
36
Absolute Quantification Getting Started Guide for the 7300/7500 System
Creating an RQ Study Document
5. Add RQ plates to the study.
a. Click Add Plates.
Note: You can add up to 10 RQ plates to an
RQ study.
b. Select the plate(s) that you want to add to
the study, then click Open.
The selected plates are displayed.
IMPORTANT! All plates added to a study
must have identical thermal cycling
parameters—the same number of steps,
cycles, sample volume, emulation mode.
The SDS software will reject a plate if it
detects any differences. (The first plate
added to the study serves as the reference
plate against which other plates are
compared.)
o
6. Click Finish. If desired, save the RQ Study
document when prompted.
The SDS software opens a new RQ Study
document and displays the RQ Study main view
with its three panes:
6a
a. RQ Detector grid – Allows you to select
detectors to associate with the loaded study.
For each detector,Color, Detector name,
Threshold value, Auto Ct, and Baseline are
displayed.
6c
Note: At this point, all the values in the
Threshold, Auto Ct, and Baseline columns
are set to the default values (0.200000,
Manual, and [6,15], respectively).
6b
b. RQ Sample grid – Displays the samples
associated with the selected detector(s). The
Sample Grid displays numerical results of
RQ calculations and has two subtabs:
Sample Summary and Well Information.
5
Notes
Absolute Quantification Getting Started Guide for the 7300/7500 System
37
Chapter 5 Analyzing Data in an RQ Study
Configuring Analysis Settings
c. RQ Results panel – Contains the three
results-based tabs: Plate (default),
Amplification Plot, and Gene Expression.
Note: You can save the RQ Study
document now, or wait until after specifying
analysis settings and analyzing the data.
Configuring Analysis Settings
After you create the RQ Study document, you must
specify parameter values for the analysis.
Unless you have already determined the optimal
baseline and threshold settings for your experiment,
use the automatic baseline and threshold feature of the
SDS software (auto Ct), explained below. If the
baseline and threshold were called correctly for each
well, you can proceed to view the results. Otherwise,
you must manually set the baseline and threshold as
explained in “Manual Baseline and Threshold
Determination” on page 40.
To configure analysis settings:
1. Click
or select Analysis > Analysis Settings.
2. In the Detector drop-down list, select All.
3. Select Auto Ct. The SDS software automatically
generates baseline and threshold values for each
well.
2
3
IMPORTANT! After analysis, you must verify
that the baseline and threshold were called
correctly for each well, as explained in
“Adjusting the Baseline and Threshold” on
page 40.
4
5
Alternatively, you can select Manual Ct and
specify the threshold and baseline manually.
6
7
8
Notes
38
Absolute Quantification Getting Started Guide for the 7300/7500 System
Configuring Analysis Settings
4. Select the Calibrator Sample.
Note: If your experiment uses only a single
plate, there must be at least two different samples
that have different names and have their own
endogenous controls. (You can go back to a
saved RQ Plate document and change the sample
names, if necessary.)
5. Select the Endogenous Control Detector.
6. Select the Control Type if the study contains both
multiplex and nonmultiplex reactions.
Note: The Multiplexed or Non-Multiplexed
options are active only if the plates loaded for
analysis contain both multiplexed and
nonmultiplexed reactions that share the same
endogenous control.
7. Select the RQ Min/Max Confidence level.
Note: The SDS software uses this value to
calculate error bars for gene expression levels, as
explained in “Error Bars for Gene Expression
Plots” on page 48.
8. Optionally, select Remove Outliers to enable the
SDS software to automatically identify and filter
outliers for groups containing at least four
replicates.
Note: You can also remove outliers manually, as
explained in “Omitting Samples from a Study”
on page 50.
9. Click OK & Reanalyze. The detector
information appears in the RQ Detector grid.
After analysis, the Threshold column displays
the automatically calculated threshold values.
The Auto Ct and Baseline columns are set to
“Auto.”
For more information about the settings in the
Analysis Settings dialog box, refer to the Online
Help.
5
Notes
Absolute Quantification Getting Started Guide for the 7300/7500 System
39
Chapter 5 Analyzing Data in an RQ Study
Adjusting the Baseline and Threshold
After the analysis, you must verify that the baseline
and threshold were called correctly for each detector,
as explained in the following section.
Adjusting the Baseline and Threshold
Automatic Baseline and Threshold
Determination
The SDS software calculates baseline and threshold
values for a detector based on the assumption that the
data exhibit the “typical” amplification curve.
Threshold
A typical amplification curve has a:
•
•
•
•
•
a
b
c
∆Rn
Plateau phase (a)
Linear phase (b)
Geometric phase (c)
Background (d)
Baseline (e)
d
Experimental error (such as contamination, pipetting
errors, and so on) can produce data that deviate
significantly from data for typical amplification
curves. Such atypical data cause the software
algorithm to generate incorrect baseline and threshold
values for the associated detector.
e
Cycle
Therefore, Applied Biosystems recommends
reviewing all baseline and threshold values after
analysis of the study data. If necessary, adjust the
values manually as described on page 43.
Manual Baseline and Threshold
Determination
If you set the baseline and threshold values manually
for any detector in the study, you must perform the
procedure on page 43 for each of the detectors.
The following amplification plots show the effects of
baseline and threshold settings.
Notes
40
Absolute Quantification Getting Started Guide for the 7300/7500 System
Adjusting the Baseline and Threshold
Manual Baseline and Threshold Determination
Baseline Set Correctly
The amplification curve begins after the maximum
baseline. No adjustment necessary.
Baseline Set Too Low
The amplification curve begins too far to the right of
the maximum baseline. Increase the End Cycle value.
Baseline Set Too High
The amplification curve begins before the maximum
baseline. Decrease the End Cycle value.
5
Notes
Absolute Quantification Getting Started Guide for the 7300/7500 System
41
Chapter 5 Analyzing Data in an RQ Study
Adjusting the Baseline and Threshold
Threshold Set Correctly
The threshold is set in the geometric phase of the
amplification curve.
Threshold settings above or below the optimum
increase the standard error of the replicate groups.
Threshold Set Too Low
The threshold is set below the geometric phase of the
amplification curve. The standard error is
significantly higher than that for a plot where the
threshold is set correctly. Drag the threshold bar up
into the geometric phase of the curve.
Threshold Set Too High
The threshold is set above the geometric phase of the
amplification curve. The standard error is
significantly higher than that for a plot where the
threshold is set correctly. Drag the threshold bar down
into the geometric phase of the curve.
Notes
42
Absolute Quantification Getting Started Guide for the 7300/7500 System
Adjusting the Baseline and Threshold
Manual Baseline and Threshold Determination
1
2
Geometric
phase of the
amplification
curve
4b
To manually adjust the baseline and threshold:
1. Select the Amplification Plot tab, then select
Delta Rn vs. Cycle in the Data drop-down list.
2. In the RQ Detector grid, select a detector.
The SDS software displays the:
• Associated samples (from all plates
included in the study) in the RQ
Sample grid.
• Graph for the selected detector in the
RQ Results panel.
Note: When manually adjusting baseline
and threshold settings, you can select only
one detector at a time. If you select multiple
detectors, the Analysis Settings section and
the threshold bar are disabled.
3. Set the baseline for the detector.
a. Under Analysis Settings, select Manual
Baseline.
5
Notes
Absolute Quantification Getting Started Guide for the 7300/7500 System
43
Chapter 5 Analyzing Data in an RQ Study
Adjusting the Baseline and Threshold
b. Enter values in the Start Cycle and End
Cycle fields, ensuring that the amplification
curve growth begins at a cycle after the End
Cycle value.
Note: After you change a baseline or
threshold setting for a detector, the Analyze
button ( ) is enabled, indicating that you
must reanalyze the data.
4. Set the threshold for the detector.
a. Under Analysis Settings, select Manual Ct.
b. Drag the threshold setting bar so the
threshold is:
• Above the background
• Below the plateaued and linear regions
of the amplification curve
• Within the geometric phase of the
amplification curve
The SDS software adjusts the theshold
value and displays it in the Threshold field
after reanalyzing.
5. Repeat steps 2 through 3 to set the baseline and
threshold values for all remaining detectors in
the study.
6. Click
or select Analysis > Analyze to
reanalyze the data using the adjusted baseline
and threshold values.
Click and drag the Threshold setting
to adjust the threshold. The bar turns
red, indicating that the threshold has
been changed.
Notes
44
Absolute Quantification Getting Started Guide for the 7300/7500 System
Analyzing and Viewing the Results of the RQ Study
Selecting Detectors to Include in Results Graphs
Analyzing and Viewing the Results of the RQ Study
Selecting Detectors to Include in Results
Graphs
In the RQ Detector Grid, select detectors to include in
the result graphs by clicking a detector. (Ctrl-click to
include multiple detectors; Click-drag to include
multiple adjacent detectors.)
The corresponding samples appear in the RQ Sample
Grid. Depending on which tab you select in the RQ
Results Panel (Plate, Amplification Plot, or Gene
Expression), analysis results are displayed.
To see information about a specific well, select the
Well Information tab.
Example Experiment
Suppose that you want to view the comparative gene expression levels of the following genes when the liver tissue is used
as the calibrator: ACVR1, ACVR2, CCR2, CD3D, and FLT4. Selecting the detectors in the RQ Detector grid (1) displays the
sample information in the RQ Sample grid (2) and in a result graph in the RQ Results panel (3). Note that:
• The Gene Expression tab is selected, and the gene expression levels are sorted by detector.
• Gene expression levels for bladder samples are indicated by the green bar; those for kidney samples by the blue bar.
These colors also indicate the samples in the RQ Sample Grid and the RQ Results Panel plots.
• Because liver samples are used as calibrators, the expression levels are set to 1. But because the gene expression levels
were plotted as log10 values (and the log10 of 1 is 0), the expression level of the calibrator samples appear as 0 in the
graph.
• Because the relative quantities of the targets are normalized against the relative quantities of the endogenous control,
the expression level of the endogenous control is 0; there are no bars for GAPDH.
• Fold-expression changes are calculated using the equation 2−∆∆CT.
1
3
2
5
Notes
Absolute Quantification Getting Started Guide for the 7300/7500 System
45
Chapter 5 Analyzing Data in an RQ Study
Analyzing and Viewing the Results of the RQ Study
Amplification Plot
The three Amplification Plots allow you to view postrun amplification of specific samples. The
Amplification Plots display all samples for selected
detectors.
You can adjust graph settings by clicking the y- or xaxes of a plot to display the Graph Settings dialog, as
shown on page 32.
Rn vs. Cycle (Linear) View
Displays normalized reporter dye fluorescence (Rn) as
a function of cycle. You can use this plot to identify
and examine irregular amplification.
For more information about Rn, refer to the SDS
Chemistry Guide.
∆Rn vs. Cycle (Log) View
Displays dye fluorescence (∆Rn) as a function of
cycle number. You can use this plot to identify and
examine irregular amplification and to manually set
the threshold and baseline parameters for the run.
Ct vs. Well Position View
Displays threshold cycle (CT) as a function of well
position. You can use this plot to locate outliers from
detector data sets (see “Omitting Samples from a
Study” on page 50 for more information).
Notes
46
Absolute Quantification Getting Started Guide for the 7300/7500 System
Analyzing and Viewing the Results of the RQ Study
Gene Expression Plot
Gene Expression Plot
Gene Expression plots show the expression level or
fold-difference of the target sample relative to the
calibrator.
Because the calibrator is compared to itself, the
expression level for the calibrator is always 1.
Adjusting Graph Settings
You can adjust graph settings for gene expression
plots in the Graph Settings dialog box, including:
•
•
•
•
Bar width
3D bars
Autoscaling
Data display as Log10 RQ or Raw RQ
Refer to the Online Help for more information about
adjusting graph settings for gene expression plots.
Gene Expression Plot Orientation: Detector
Detectors are plotted on the x-axis, and each bar
shows the detector value of a single sample.
5
Notes
Absolute Quantification Getting Started Guide for the 7300/7500 System
47
Chapter 5 Analyzing Data in an RQ Study
Analyzing and Viewing the Results of the RQ Study
Gene Expression Plot Orientation: Sample
Samples are plotted on the x-axis, and each bar shows
the set of sample values of a single detector.
Error Bars for Gene Expression Plots
The SDS software displays error bars for each column
in the plot provided that the associated expression
level was calculated from a group of two or more
replicates. The error bars display the calculated
maximum (RQMax) and minimum (RQMin)
expression levels that represent standard error of the
mean expression level (RQ value). Collectively, the
upper and lower limits define the region of expression
within which the true expression level value is likely
to occur.
The SDS software calculates the error bars based on
the RQMin/Max Confidence Level in the Analysis
Settings dialog box (see page 38).
Notes
48
Absolute Quantification Getting Started Guide for the 7300/7500 System
Reanalyzing an RQ Study
Reanalyzing an RQ Study
If you change any of the analysis settings, you must
reanalyze the data before you can view results. (You
can switch between the variations of the
Amplification and Gene Expression plots without
having to reanalyze the data.)
Calibrator
Gene Expression Plot
Liver
Suppose you select Liver as the calibrator, then
perform an analysis. Next, you view the
Amplification and Gene Expression plots. If you then
want to use Kidney or Bladder as the calibrator, you
need to reanalyze the data before viewing results.
Similarly, if you want to change the baseline or
threshold values, the endogenous control, the control
type, or the RQ Min/Max parameters, you need to
reanalyze your data.
Kidney
Bladder
5
Notes
Absolute Quantification Getting Started Guide for the 7300/7500 System
49
Chapter 5 Analyzing Data in an RQ Study
Omitting Samples from a Study
Omitting Samples from a Study
Experimental error may cause some wells to amplify
insufficiently or not at all. These wells typically
produce CT values that differ significantly from the
average for the associated replicate wells. If included
in the calculations, these outlying wells (outliers) can
result in erroneous measurements.
To ensure precise relative quantification, you must
carefully view replicate groups for outliers. You can
remove outliers manually using the CT vs. Well
Position Amplification Plot.
To remove samples from an RQ Study:
1. Select the Amplification Plot tab.
1
2. In the Data drop-down list, select Ct vs. Well
Position.
2
3. In the RQ Detector grid, select a detector to
3
examine. All samples that use this detector are
displayed in the RQ Samples grid.
4. In the RQ Samples grid, click to select the
samples to display in the Amplification Plot.
4
5. Verify the uniformity of each replicate
population by comparing the groupings of CT
values for the wells that make up the set.
Good
clustering
of replicate
data. No
outliers.
Potential
outlier.
Notes
50
Absolute Quantification Getting Started Guide for the 7300/7500 System
Omitting Samples from a Study
6. Do one of the following:
• If outliers are present, select the Well
Information tab, find the outlying sample,
and select the Omit check box for the
sample.
• If outliers are not present, go to step 7.
7. Repeat steps 5 and 6 to screen the remaining
replicate groups.
8. Select Analysis > Analyze (
) to reanalyze the
run without the outlying data.
9. Repeat steps 3 to 8 for other detectors you want
to screen.
The
outlier is
Select
removed
Omit.
during
analysis.
The
Theoutlier
outlierisis
removed
removed
during
during
analysis.
analysis.
5
Notes
Absolute Quantification Getting Started Guide for the 7300/7500 System
51
Chapter 5 Analyzing Data in an RQ Study
Exporting RQ Study Data
Exporting RQ Study Data
You can export numeric data from RQ studies into
text files, which can then be imported into spreadsheet
applications such as Excel.
1. Select File > Export > Results, then select the
data type to export:
• Sample Summary (*.csv)
• Well Information (*.csv)
• Both (*.csv)
Refer to the Online Help for information about
the export file types.
2. Enter a file name for the export file.
Note: The name of the dialog box depends on
the type of data you want to export.
3. Click Save.
Notes
52
Absolute Quantification Getting Started Guide for the 7300/7500 System
Creating Detectors
A
Before you can use a plate document to run a plate,
you need to create and apply detectors for all samples
on the plate. A detector is a virtual representation of a
gene- or allele-specific nucleic acid probe reagent
used for analyses performed on instruments.
To create a detector:
1. Select Tools > Detector Manager.
Note: A plate document (any type) must be open
before you can access the Tools menu.
2. Select File > New.
2
3. In the New Detector dialog box, enter a name for
the detector.
IMPORTANT! The name of the detector must be
unique and should reflect the target locus of the
assay (such as GAPDH or RNase P). Do not use
the same name for multiple detectors.
3
4
5
6
4. Optionally, click the Description field, then
enter a brief description of the detector.
7
Notes
Absolute Quantification Getting Started Guide for the 7300/7500 System
53
Appendix A
5. In the Reporter Dye and Quencher Dye dropdown lists, select the appropriate dyes for the
detector.
Note: The dyes that appear on the Reporter and
Quencher Dye lists are those that have been
previously entered using the Dye Manager. If the
dye that you want to use does not appear in a list,
use the Dye Manager to add the dye and then
return to this step in this procedure. Refer to the
Online Help for more information.
Note: Select TAMRA as the quencher for
TaqMan™ probes and None for TaqMan MGB
probes.
6. Click the Color box, select a color to represent
the detector using the Color dialog box, then
click OK.
7. Optionally, click the Notes field, then enter any
additional comments for the detector.
8. Click OK to save the detector and return to the
Detector Manager.
9. Repeat steps 2 through 8 for the remaining
detectors.
10. In the Detector Manager, click Done when you
finish adding detectors.
g
Example Experiment
In the example RQ experiment, a detector is created for each target gene and the endogenous control. 24 detectors are
created: 23 for the target genes and 1 for the endogenous control, GAPDH.
For example, the detector for the ACVR1 gene is named ACVR1 and assigned a yellow color. Because all Assays-onDemand™ products have probes that are labeled with FAM™ dye, FAM was selected for the reporter dye. Additionally,
Assays-on-Demand products use TaqMan MGB probes, which use nonfluorescent quenchers. No quencher dye is selected
for the detector.
Note: Assays-on-Demand products are shipped with an assay information file (AIF). This text-based file contains
information about the assays that you ordered, including the Applied Biosystems Assay ID number, well-location
of each assay, primer concentration, and primer sequence. The file also indicates the reporter dyes and quenchers
(if applicable) that are used for each assay. When creating detectors, you use the reporter dye and quencher
information (and optionally, the gene name or symbol for the sample name). You can view the contents of AIFs in
a spreadsheet program, such as Microsoft Excel.
Notes
54
Absolute Quantification Getting Started Guide for the 7300/7500 System
References
Kwok, S. and Higuchi, R. 1989. Avoiding false positives with PCR. Nature
339:237–238.
Mullis, K.B. and Faloona, F.A. 1987. Specific synthesis of DNA in vitro via a
polymerase-catalyzed chain reaction. Methods Enzymol. 155:335–350.
Livak, K.J., and Schmittgen, T.D. 2001. Analysis of Relative Gene Expression Data
Using Real-Time Quantitative PCR and the 2–∆∆CT Method. Methods 25:402–408.
Saiki, R.K., Scharf, S., Faloona, F., et al. 1985. Enzymatic amplification of β-globin
genomic sequences and restriction site analysis for diagnosis of sickle cell anemia.
Science 230:1350–1354.
Absolute Quantification Getting Started Guide for the 7300/7500 System
55
References
56
Absolute Quantification Getting Started Guide for the 7300/7500 System
Index
Numerics
3D bars 47
5′-nuclease assay 15
9600 Emulation Mode
31
A
AIF. See assay information files
AmpErase UNG 16
amplification curve 40
amplification plots
Amplification Plot view for RQ plates 33
types of amplification plots for RQ studies 45
appearance of graphs 32, 46, 47
Applied Biosystems
contacting viii
customer feedback on documentation viii
Services and Support viii
Technical Communications viii
Technical Support viii
assay information files 54
Assays-by-Design 17
Assays-on-Demand 17
autoscaling options 32, 46, 47
B
background in amplification curve
bar width 47
baseline
adjusting 40
defintion 3
examples 41
40
C
calibrating the 7300/7500 instrument
calibrator
definition 13
selecting in RQ studies 39
CAUTION, description vii
cDNA
generating 21
storing 22
See also reverse transcription
24
Chemistries 15
comparative method of calculation
Component view 33
concentration of RNA 20
confidence levels 39
conventions, text vii
Ct. See threshold cycle
curves
amplification 40
standard 2
3, 36
D
data
analyzing 32, 45
exporting 34, 52
generating PCR data from RQ plates 31
importing 27
omitting from a study 50
delta Rn 3
Delta Rn vs.Cycle view 46
designing RQ experiments
determining reagent configuration 15
PCR method 12
primers and probes 17
selecting the chemistry 15
Detector Manager dialog box 53
detector tasks, definition 26
detectors
adding to RQ plates 27
creating 53
definition 53
selecting for RQ studies 38
deviation, standard 42
display options 32, 46, 47
documentation, feedback viii
documents
exporting 34, 52
RQ Plate 26
RQ Study 36
templates 27
dyes
FAM 17, 54
reporter 3
ROX 28, 33
Absolute Quantification Getting Started Guide for the 7300/7500 System
57
Index
dyes (continued)
SYBR Green I 15, 17
TAMRA 33, 54
materials 4
mode, emulation 31
MSDSs,obtaining viii
multiplex PCR 12
E
emulation mode, 9600 31
endogenous controls
associating with detectors 26
definition 13
for RQ plates 26
selecting for RQ studies 39
endpoint PCR 2
equipment 4
example RQ experiment
components 14
creating detectors 54
description 5
PCR master mix 25
PCR method 12
reverse transcription 22
RQ Plate document, example 29
RQ Study document, example 45
exporting data
RQ plates 34
RQ studies 52
N
New Detector dialog box
normalized reporter 3
O
options, display 32, 46, 47
options, graph 32, 46, 47
outliers 50
P
F
FAM dye
17, 54
G
Gene Expression plots 47
geometric phase of amplification curve
graph settings 32, 46, 47
guidelines
preparing RNA 20
High Capacity cDNA Archive kit
21
I
importing plate setup information
Instrument tab 31
27
L
line width 32, 46, 47
linear phase of amplification curve
M
58
40
passive reference 3, 28
PCR
end-point 2
master mix, preparing 24
multiplex 12
real-time 2
selecting a method 12
singleplex 12
starting an RQ plate run 31
phases of amplification curve 40
Plate view 33
plate, RQ. See RQ plates
plateau phase of amplification curve
plot appearance 32, 46, 47
Primer Express Software 17
primers 17
probes 17, 54
40
R
H
master mix, PCR
53
24
40
reagent configurations 16
real-time PCR assays 2
reference sample.See calibrator
reference, passive 3, 28
relative quantification
comparative method of calculation 3
definition 2
example experiment 5
experiments.See also RQ experiments 2
real-time PCR 2
references 2
RQ plates 3
RQ studies 3
replicates 13
reporter dye 3
Absolute Quantification Getting Started Guide for the 7300/7500 System
Index
Results tab 32
results, RQ Study analysis 45
reverse transcription
guidelines for preparing RNA 20
High Capacity cDNA Archive kit 21
thermal cycling parameters 21
Rn vs. Cycle view 46
Rn. See normalized reporter
RNA
guidelines for preparing 20
isolation 20
starting concentration 20
ROX dye 28, 33
RQ Detector grid 39
RQ experiments
chemistries 15
components 13
probes and primers 17
reagent configuration 15
requirements 13
workflow 2
RQ Main Study view 37
RQ plates
adding to RQ studies 37
Amplification Plot view 33
analyzing 32
Component view 33
data types 34
definition 3
detectors, creating 53
exporting data 34
Plate view 33
reanalyzing data 34
results 32
RQ Plate documents 26
Spectra view 33
starting a run 31
RQ Results panel 45
RQ Sample grid 45
RQ studies
adding RQ plates 37
Amplification Plots 45
confidence level 39
control type 39
data types 52
definition 3
exporting data 52
Gene Expression plots 47
omitting samples from 50
orientation 47
reanalyzing data 49
results 45
RQ Study documents 36
RT-PCR
one-step
two-step
16, 30
16, 30
S
Services and Support, obtaining viii
settings, graph 32, 46, 47
Setup tab 29
singleplex PCR 12
Spectra view 33
standard curves 2
standard deviation, effect of threshold on
starting an RQ plate run 31
study, RQ. See RQ studies
SYBR Green I dye chemistry 15
42
T
TAMRA dye 33, 54
TaqMan chemistry 15
TaqMan MGB probes 18, 54
TaqMan Universal PCR Master Mix 24
target
associating with detectors 26
definition 13
tasks. See detector tasks
Technical Communications, contacting viii
Technical Support, contacting viii
template documents 27
text conventions vii
thermal cycling conditions
default for PCR 30
one-step RT-PCR 30
specifying 31
two-step RT-PCR 30
thermal cycling parameters
for plates added to a study 37
RT using High Capacity cDNA Archive kit
threshold
adjusting 40
definition 3
examples 42
threshold cycle
definition 3
setting for RQ studies 38
Training, obtaining information about viii
21
U
uracil-N-glycosylase
Absolute Quantification Getting Started Guide for the 7300/7500 System
16
59
Index
W
WARNING, description vii
Well Information tab 45
wells, replicate 13
width, bars 47
width, lines 32, 46, 47
workflow, RQ experiment overview
2
X
x-axis
32, 46, 47
Y
y-axis
60
32, 46, 47
Absolute Quantification Getting Started Guide for the 7300/7500 System
Headquarters
850 Lincoln Centre Drive
Foster City, CA 94404 USA
Phone: +1 650.638.5800
Toll Free (In North America): +1 800.345.5224
Fax: +1 650.638.5884
Worldwide Sales and Support
Applied Biosystems vast distribution and service
network, composed of highly trained support and
applications personnel, reaches 150 countries on six
continents. For sales office locations and technical
support, please call our local office or refer to our Web
site at www.appliedbiosystems.com.
Applera is committed to providing the world’s
leading technology and information for life scientists.
Applera Corporation consists of the Applied Biosystems
and Celera Genomics businesses.
Printed in the USA, 01/2004
Part Number 4347824 Rev. A