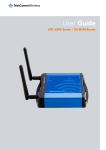
1
Arts Council of New Zealand Toi AoteAroa
°
Audience 360°
Vital Statistics Essentials:
User Manual
Audience 360° | Vital Statistics Essentials: User Manual i
What is Creative
New Zealand’s
Audience 360º
programme?
Audience 360º is a Creative New Zealand
initiative designed to enable arts companies
to further understand and analyse their
audiences using a data analysis tool called
Vital Statistics, powered by Purple Seven.
This manual explains to participants how to
use Vital Statistics Essentials.
ii
Audience 360° | Vital Statistics Essentials: User Manual
Contact Details
Senior Adviser Audience Development
Creative New Zealand
Level 3
Southern Cross Building
59-67 High Street
Auckland 1010
PO Box 1425
Auckland 1140
T: +64 9 373 3066
F: +64 9 377 6795
creativenz.govt.nz/audience360
Contents
Contents
1
Acknowledgements
Log In
2
Vital Statistics Essentials
Set Up
3
Venue Homepage
5
Event Snapshot Report
Exporting
7
Data
Understanding the Report
8
Page 1
12
Page 2
Understanding your Profile
14
Mosaic Analysis
Acknowledgements
In association with
This document was originally created by Michelle Oxenham
and Leanne Gunnulson in consultation with Merryn Carter
for the ADVICE Project, Australia Council, 2009. Thanks and
acknowledgment to Purple Seven for contribution to content.
Audience 360° | Vital Statistics Essentials: User Manual 1
Log In
Vital Statistics Essentials
To log into your Vital Statistics Account visit www.purpleseven.co.uk and click on VS Venue
(you will log in using your email address and password – if you have misplaced or forgotten your password,
please contact the Audience 360° Project Co-ordinator).
2
Audience 360° | Vital Statistics Essentials: User Manual
Set Up
Venue Homepage
Once you are logged into Vital Statistics, you will see your Venue Homepage which gives you an overview
of how your current, matured and unmatured events are performing. To get the maximum benefit from this
page you will need to enter your financial and capacity targets for each event manually.
RunIs the Event Name
SoldIs the total number of actual tickets sold*
Sold & RsvdIs the total number of tickets held and sold*
Forecast
Is a prediction of number of tickets sold using an algorithm based on the first 2 weeks
of sale and updated from figures in the 3rd and 4th quarter of the ‘on sale’ period
(it is 80-85% accurate)*
% Achvd
Is the % of your target achieved (the figure in brackets is % time elapsed of the
‘on sale’ period)*
TargetIs your target number of tickets sold*
CapacityIs the total number of tickets for sale for your event*
Start Date
Is the start date of your event (or season if there are repeat performances of the
same event)
End Date
Is the end date of your event (this will be the same as the Start Date unless there are
repeat performances of the same event in a Season)
* You can toggle between number of tickets sold and ticket revenue using the View: drop down menu.
Audience 360° | Vital Statistics Essentials: User Manual 3
In order to edit your targets use the following steps:
➊Click the ‘edit’ button next to the event you wish to add targets to. Which will open the following screen:
➋You can also add the Tix Target (no. of tickets), Fin Target (Financial Target in $) and the Tix and Fin
Capacity. Use your net budget to complete these fields and then press ‘Apply’. It is critical that you
do it in that order or you will lose the data you have entered. The other fields are automatically populated
from your account.
➌ Once complete click ‘Save’ and the information will be saved and you will return to your Venue
Homepage.
➍ Please ignore the ‘Artform’ and ‘Company’ fields. Their use is relevant to a VS Analysis account only.
To discuss the advantages of upgrading from VS Essentials to VS Analysis please contact the Audience
360º Project Co-ordinator who will arrange for a Purple 7 representative to contact you.
Once you have completed this process for all of your events
the Venue Homepage will offer an invaluable ‘at a glance’
view of the current performance vs. budget of all your events.
The Venue Homepage can be further customised and
the visible data filtered in other ways. We suggest the more
advanced user explore these options for themselves or use the
Help > Knowledge Base audio guides (see right).
4
Audience 360° | Vital Statistics Essentials: User Manual
Set Up
Event Snapshot Report
This report provides you with a useful summary of sales information for a particular event
in your database.
➊You will find the Event Snapshot report in your Report List – hover your mouse over the Analysis field
and click on Report List.
➋Now the Reporting & Analysis page has loaded, click on Run next to Event SnapshotNZ.
Audience 360° | Vital Statistics Essentials: User Manual 5
➌ Next, select the year your Event started in – click <Select a Value> to open the list of years,
scroll down and select the year.
➍ Click <Select a Value> to open the Event names list, scroll down and click on the Event you
wish to view.
➎ Click View Report – an animation and “Report is being generated” will appear – it may take several
seconds for your report to generate as the data from the UK server is configured.
6
Audience 360° | Vital Statistics Essentials: User Manual
Exporting
Data
As with all Vital Statistics reports, you can export the data from VS into various file formats to allow you to
download, save and email/print the information. To do this, simply expand the Select a format list at the
top of the report to choose the file format you want, and then click on Export. Available formats include:
XML File, CSV, TIFF, PDF, Web Archive or Excel.
Audience 360° | Vital Statistics Essentials: User Manual 7
Understanding the Report
Page 1
Once your report has been generated, you will see a summary at the top of page 1 of the report (see below).
This summary includes the location of the event, the start and end dates of the event, the number of
performances in the event run, and the date up to which the figures are correct – this is the date on which
Purple Seven received the last successful DDX upload from your venue, and is particularly critical to bear
in mind when viewing data for events that are currently on sale.
The second part of the summary shows the sales information from the event run. Included in this are:
Customers: the total number of customer accounts to which tickets were sold (note – the
underlined text indicates a link, click for a list of all the customers of the event)
Non Quick Sale: the number of customers who bought tickets as non-quick (non-door) sales
i.e. where the tickets were sold into customer accounts, so customer data
is captured
Revenue: the total revenue generated
Tickets: total number of tickets sold
Capacity: the total capacity of all the performances in the event run
Sold: the percentage of the capacity that sold
Avg. Group Size: the average (mean) size of the group of tickets bought by each customer
Customer Yield: the average (mean) revenue per customer
Ticket Yield: 8
the average (mean) revenue per ticket
Audience 360° | Vital Statistics Essentials: User Manual
Capacity Achieved By Weeks Out: The first chart displayed in the report (below) tells you how far
in advance the tickets were purchased for the performances, against the (cumulative) total capacity of
the event run. In the graph below we can see that 6 weeks before the performance only 15% of the ticket
capacity had been sold, at 2 weeks out, the sales increased to 35% and then doubled to 70% as the final
sales percentage in the last two weeks of sale!
It is possible to compare the figures for this event run with others in your database. Simply choose the
‘Click here to compare to another event’ link on the bottom right of the chart. This will take you to
a screen where you choose the events you wish to add to the chart as a comparison.
Just click on the downward pointing arrow to the right of ‘Select Year’ and select a year.
Now click on the downward pointing arrow to the right of ‘Select Event(s) to Compare’ and select your
events from the list. You can select multiple events for this analysis if you require.
Audience 360° | Vital Statistics Essentials: User Manual 9
NOTE: If you wish to compare events from different years, simply repeat these two steps for each
different year you wish to include. Once you have chosen which events you wish to compare, click on the
‘View Report’ button to generate the chart.
In the chart below we can see the event’s selling patterns. EVENT 1 achieved a final total of 70% of the total
event capacity and EVENT 2 sold 74% of tickets. EVENT 1 went on sale 8 weeks earlier than EVENT 2 with
a similar steady purchasing trend with both events up until 2 weeks out where there was a sharp increase
in both events. In particular, EVENT 1 had a huge increase selling over half the tickets in the final week of
sales. It will be useful for you to compare the ways these two events were marketed, to see the relationship
between your marketing campaign and the sales patterns so you may make future marketing decisions.
The next report shows the percentage of tickets sold
as quick sales (door sales) – where no customer
details were recorded for the ticket purchasers.
In this case, we can see that 66 of the 964 tickets
sold were quick sales, which is 7% of the total
number of tickets sold.
10 Audience 360° | Vital Statistics Essentials: User Manual
To the right of the quick sale gauge you
will find information about the customer’s
relationship to you – their repeat
attendance. At the top of the pyramid,
in dark blue, is an area representing the
customers who have only purchased tickets
for events at your venue once – they have
only bought for the event chosen for this
report. For this particular event you will
see that 100 customers have not booked
for any other event. Below this, in red,
are the customers who have bought tickets
for this event and one other; in yellow are
those who have booked for a total of three
events, and so on. If you want to find out which of your customers fell into each of these categories, you can click
on each of the areas in the pyramid to see the customer lists.
The next chart (above) shows you how long it has been since the last attendance of the customers who have
attended more than once. We can see that for the event chosen for this report, 33 customers had previously
attended relatively recently, within 3 or 4 weeks of this performance. To draw out a list of these 33 customers,
click on the line to the right of the selected number. This will open a list of those customers that you can export.
We now need to move on to page 2 of the report. Click on the arrow next to the page numbers at the top of the report.
Audience 360° | Vital Statistics Essentials: User Manual 11
Understanding the Report
Page 2
Page 2 of the report begins with tables showing the crossover between the event you have chosen for analysis and other events
within your database.
The Top 10 Previous Events table shows us, for the customers who have made more than one attendance, which were the
most popular previous events to book for. The column Event tells us the name of the event the customers booked for, and the
Start Date is the date of the first performance in the event run. The Customers column tells us how many of your bookers have
bought tickets for both the selected Event, which we have chosen to report on, and the event listed. As this Event was a musical,
it is perhaps unsurprising that other musicals feature heavily in this crossover list. The most popular previous event was ‘Fame’,
with 35 bookers also buying tickets for this event. ‘Blood Brothers’ was the second most popular, with 27 bookers crossing over,
and so on down the list.
The Top 10 Future Events table shows us which are the most popular future events for our selected Event bookers. The most
popular future event is ‘Aladdin’, with 35 customers also purchasing tickets for this. The second most popular is ‘Grease’,
with 29 bookers crossing over. Interestingly, ‘Blood Brothers’ appears in this list too, only this time we are looking at a different
event run of the same musical – we can determine this by checking the start dates. All underlined events in both columns are
links. Click on the event name for the list of customers who purchased ticket/s to both events.
The next section of the report shows the ticket purchasing patterns according to group size. This information is shown as both
a table and a graph.
12 Audience 360° | Vital Statistics Essentials: User Manual
There are three columns to the table. The first is the Group Size. This tells us how many tickets each of the bookers has
purchased for the event we are reporting on. In this table the bookers are grouped according to these Group Size categories.
Click on the underlined number for the list of customers. The Bookers column tells us how many of our customers fell into
each of the group size categories. Finally, the Revenue column tells us the total amount of money paid by all of the customers
in each of the Group Size. So, for the Event selected, 91 bookers bought single tickets and spent $2,937 in total on those
tickets; 43 people each bought 10 or more tickets, and between them brought $18,887 of revenue to the organisation.
Please note that the following two tables in the Event Snapshot report may require additional formatting by Purple Seven.
If your Event Snapshot report does not generate these tables and you would like this information to be available, please
contact the Audience 360° Project Co-ordinator.
The columns in the chart above are as follows:
Discount Code: The codes used by box office staff to discount the tickets sold for the Event. These codes are extracted
directly from your box office system. The list of discount codes you see in this report may not be a complete list of the
discount codes in your database: only those used for sales for the individual event run chosen for this report are displayed.
Customers: The number of customers who have booked using each of the discount codes.
Tickets: The total number of tickets bought under each discount code.
At the bottom of the column there is a total of all tickets sold for the event.
Paid: The amount of money paid in total for all of the tickets under each discount
code. At the bottom of the column there is a total of all revenue from tickets sold
for the event.
The final table in the Event Snapshot displays information about the geographical
location of the customers attending the selected event. The bookers are broken
down by the postal sector they live in, and for each postal sector we can see
the number of bookers, the amount of revenue those bookers generated, and the
number of tickets they purchased.
Audience 360° | Vital Statistics Essentials: User Manual 13
Understanding your Profile
Mosaic Analysis
Profile Reports Explained: This section allows you to understand the characteristics of your customers/
geographical catchment to be compared against a comparison file or area known as a base. The following
will explain how to interpret the information in this Mosaic NZ Profile Report.
14 Audience 360° | Vital Statistics Essentials: User Manual
➊ Hyperlinks: In the electronic copy of your profile you can click on the group and type headings
on each page to be able to access the descriptions through our Mosaic NZ online resource website
(Internet access required).
➋ Target: This is the amount of your customers that belong to each Mosaic NZ group/type.
➌ Target %: This is the amount of your customers that fall into each Mosaic NZ group/type
expressed as a percentage of the “Target” total. This helps you to identify which groups/types the
majority of your customers belong to.
➍ Base: The total number of records in your chosen comparison that belong to each Mosaic group/type.
➎ Base %: The number of records in your chosen comparison population that belong to each
Mosaic group/type as a percentage of the “Base” total. This helps you understand which Mosaic NZ
groups/types your comparison population belong to.
➏ Penetration %: This percentage shows the “Target” population as a proportion of the “Base”
population for each mosaic group/type. This percentage allows you to understand the amount of
customers that you attract from the base population.
➐ Index: This statistic indicates the propensity of each group and type to be within the realms of
enquiry. For example, if your customer data has been profiled, the index will show the propensity
of each group or type to show the behavioural trait of being a customer to your business. An “Index”
compares the “Target %” (derived from your data) against the “Base %” to produce an “Index Value”.
Values of 100 show an average propensity and mean that the “Target %” and “Base %” are equal.
Values below 100 indicate increasingly lower propensities and mean that the “Target %” is lower
than the “Base %”. Alternatively, values above 100 show increasingly higher propensities and
mean that the “Target %” is higher than the “Base %”.
➑ Index Value Chart: This visualises the index value. The centre line equals 100 where the “Target
%” and “Base %” are equal. A bar appearing to the right of the average line means that there is a high
propensity of that group/type, whereas a bar to the left of the line means that there is a low propensity.
➒ “Target %” Vs “Base %” Graph: This visualises the differences between the “Target” & “Base”
proportions, allowing you to understand why the index value for each group/type is either high
(above 100) or low (below 100).
➓ Ranked Group/Type Profile: A ranked profile is provided for both pieces of group and type
level analysis. They show the same information as the first profile, but this time shows the groups/
types in rank order according to their index values so that the most represented groups/types
within your customer file/ geographical area are at the top and the least represented groups/types
are at the bottom. Those that are most represented can be considered as “Key” groups/types that
have the highest propensity to buy into your products and/or services.
Audience 360° | Vital Statistics Essentials: User Manual 15
Over-represented Types: The groups and types within this profile that have high index values of >200
and >130 have been coloured Red and Orange, respectively. These types have a statistically high propensity
to show the qualities or characteristics being investigated, such as consuming the products/services sold
and provided your business, for example.
Average Representation: The groups and types within this profile that have average index values of ~100 are
coloured Black. Statistically, these types have an average propensity to show the qualities or characteristics being
investigated.
Under-represented Types: The groups and types within this profile that have low index values of <85
and <50 have been coloured Light Blue and Dark Blue, respectively. These types have a statistically low
propensity to show the qualities or characteristics being investigated, such as consuming the products/services of
your business for example.
16 Audience 360° | Vital Statistics Essentials: User Manual
Creative New Zealand
Level 3
Southern Cross Building
59-67 High Street
Auckland 1010
creativenz.govt.nz/audience360
18 Audience 360° | Vital Statistics Essentials: User Manual