1
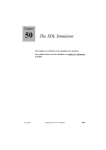
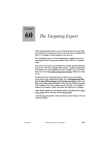
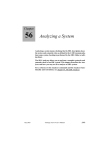
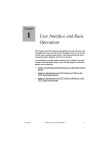
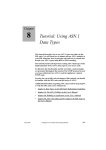
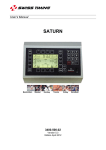
Chapter
51
Simulating a System
This chapters provides general information related to simulation in
the SDL suite and describes the actions you perform when simulating an SDL system.
For a reference to the simulator user interface, see chapter 50, The
SDL Simulator.
July 2003
Telelogic Tau 4.5 User’s Manual
,um-st1
2165
Chapter
51
Simulating a System
Structure of a Simulator
In order to generate a simulator, the SDL to C Compiler is used. The
simulators generated using the SDL to C Compiler consist of the following components:
•
•
•
•
The Simulated System (the application itself)
The Environment Process
The Interactive Monitor System
The Graphical User Interface (the Simulator UI).
Additional tools support graphical trace when executing a simulator:
•
•
The SDL Editor
The MSC Editor.
The simulated
system
Process
instances
Timer
instances
Signals sent
to /from the
environment
Interactive
monitor
system
env:1
Environment
process instance
USER
Graphical
User
Interface
SDL
Editor
MSC
Editor
USER
USER
USER
Figure 457: Structure of a running simulator
2166
,um-st1
Telelogic Tau 4.5 User’s Manual
July 2003
Structure of a Simulator
The Simulated System
The application is a representation in C code of the implementation of
the SDL system. Having generated the application (that is, translated
the SDL system into C code), the SDL to C compiler generates a makefile which contains instructions about how to compile and link the application together with the appropriate runtime library. A number of libraries are provided, which allow you to generate an application with
the desired behavior. For instance, it is possible to have multiple simulators communicate with each other or communicate with an external
application, provided that application has the facility to communicate
through the Postmaster.
An executing simulation program contains a number of data objects that
represent certain SDL objects in the system that is being simulated. Process instances, signal instances (signals that are waiting in the input port
of a process instance), and timer instances (timers that are set, but that
have not output their corresponding signal instance) are all examples of
such objects. These objects, together with the process instance env:1,
which represents the environment of the system, and the monitor system, constitute the simulation program (see Figure 457).
The process instances in the simulated system will execute transitions
that consist of actions like tasks, decisions, outputs, procedure calls, and
so on, according to the rules of SDL. It is assumed that a transition takes
no time and that a signal instance is immediately placed in the input port
of the receiver when an output operation occurs.
The Environment Process
The function of the environment process instance, env:1, is to be a receiver of signal instances sent from the system to the environment of the
system. The input port of env:1 will always hold the last 20 signals sent
to the environment.
The Interactive Monitor System
When generating a simulating application, a monitor system is included,
the function of which is to allow the interaction between the application
and the user via a command-line user interface. The monitor system
provides a functionality similar to high-level language debuggers, in
which you can, for instance:
July 2003
Telelogic Tau 4.5 User’s Manual
,um-st1
2167
Chapter
51
•
•
•
•
•
Simulating a System
view and modify objects defined in your SDL system,
set breakpoints,
control the execution,
control the logging facilities,
and so on...
The interactive monitor is the interface between the user and the simulated system. The monitor can be seen as an ordinary process instance,
which, when executing a transition, accepts commands from the user.
One group of monitor commands terminate the current transition of the
monitor, allow one or several other process instances to execute their
transitions, and then start a new transition by the monitor.
The Graphical User Interface
A graphical user interface to the monitor system of a simulator, known
as the Simulator UI, is also provided. It is a window-based tool which
facilitates the use of the monitor system. It contains graphical components, such as buttons, menus, and scrollable lists, which make it easier
to run the simulator in an intuitive way. Also, it is designed to minimize
the required amount of user interaction.
Note:
Running the graphical user interface requires that the Cbasic SDL to
C Compiler is present in your configuration.
When running the Simulator UI, the user has the option to take advantage of the graphical features which are provided, or to enter commands
in a command line fashion in the same way as the textual interface.
Generating and Starting a Simulator
There are two ways to generate and start a simulator:
•
A quick way in one single step, adequate for most situations
•
A more complex way in several steps, giving you complete control
of the generation and start process.
In the following, the more complex way will be described first, to give
a full understanding of the process. The quick way is described in
“Quick Start of a Simulator” on page 2171.
2168
,um-st1
Telelogic Tau 4.5 User’s Manual
July 2003
Generating and Starting a Simulator
Generating a Simulator
A Simulator for an SDL system, or a part of an SDL system, consists of
the C code generated by the SDL to C compiler together with a predefined run-time kernel. To start a Simulator, it is thus necessary to first
generate an executable simulator. This is performed in the Organizer.
To generate an executable simulator:
1. Select a system, block, or process diagram in the Organizer.
2. Select Make from the Generate menu. The Make dialog is opened.
3. Turn on the options Analyze & generate code and Makefile.
4. From the Standard kernel option menu, select Simulation.
5. If you need to check the Analyzer options, click the Analyze Options
button. In the dialog, set the options and click the Set button. For
more information about these options, see “Analyzing Using Customized Options” on page 2548 in chapter 56, Analyzing a System.
6. Click the Make button.
On UNIX, a simulator for the system is now generated in the current
directory with the name <system>_xxx.sct (the _xxx suffix is
platform specific).
In Windows, a simulator for the system is now generated in the current directory with the name <system>_xxx.exe (the _xxx suffix
is kernel and compiler specific).
The Status Bar of the Organizer reports the progress of the generation; the last message should be “Compiler done.”
7. Open the Organizer Log window from the Tools menu and check
that no errors occurred and that a simulator was generated.
July 2003
–
If errors were found, correct them and repeat the generation process. See “Locating and Correcting Analysis Errors” on page
2554 in chapter 56, Analyzing a System.
–
If no simulator was generated, repeat the generation process, but
click the Full Make button in the Make dialog instead.
Telelogic Tau 4.5 User’s Manual
,um-st1
2169
Chapter
51
Simulating a System
Starting a Simulator
An executable simulator can be run in two different modes; graphical
mode and stand-alone mode (textual mode).
Graphical Mode
In graphical mode, the Simulator takes advantage of the graphical user
interface and integration mechanism of the SDL suite. A separate
graphical user interface, the Simulator UI, is started, giving access to
the monitor system through the use of menus, command buttons, etc.
To start a simulator in graphical mode:
1. Select SDL > Simulator UI from the Organizer’s Tools menu. The
graphical user interface of the Simulator is opened (see “The Graphical Interface” on page 2176).
2. Select Open from the Simulator UI’s File menu. A File Selection
Dialog is opened.
–
Alternatively, click the Open quick button in the tool bar.
3. In the dialog, select an executable simulator and click OK.
A welcome message is printed in the text area of the Simulator UI. The
monitor system is now ready to accept commands. Please see “Supplying Values of External Synonyms” on page 2172 for some additional information that may affect the start-up.
Stand-Alone Mode (Textual Mode)
In stand-alone mode, the Simulator uses the input and output devices
currently defined on your computer, which provide a textual, commandline based user interface. A very limited graphical support is provided
when running the Simulator in this mode.
To start a simulator in stand-alone mode, the generated simulator is executed directly from the OS prompt, e.g.
csh% ./system_sma.sct
A welcome message is printed on the terminal:
Welcome to SDL SIMULATOR. Simulating system <system>
Command :
2170
,um-st1
Telelogic Tau 4.5 User’s Manual
July 2003
Generating and Starting a Simulator
The monitor system is now ready to accept commands. Please see “Supplying Values of External Synonyms” on page 2172 for some additional
information that may affect the start-up.
Note:
On UNIX, before a simulator can be run in stand-alone mode, you
must execute a command file from the operating system prompt.
The file is called telelogic.sou or telelogic.profile and is
located in the binary directory that is included in your $path variable.
For csh-compatible shells: source <bin dir>/telelogic.sou
For sh-compatible shells: . <bin dir>/telelogic.profile
Quick Start of a Simulator
A simulator can also be generated and automatically started in graphical
mode in one single step.
To quick start a simulator, click the Simulate quick button in the Organizer’s tool bar. The following things happen:
•
A simulator is generated by using the simulator kernel that is specified in the Make dialog. (If no simulator kernel is specified, a default simulator kernel is used.)
•
The graphical Simulator UI is started. If a Simulator UI with the
same simulator name is already open, this UI is reused. If another
Simulator UI is open, a dialog is opened where you can select to
start a new UI, or to reuse one of the existing UI’s.
•
The generated simulator is started from the Simulator UI.
Restarting a Simulator
An executing simulator can be restarted from the beginning to reset its
state completely:
July 2003
•
In graphical mode, select Restart from the Simulator UI’s File
menu. (This is the same as opening the same simulator again.) A
confirmation dialog is opened.
•
In stand-alone mode, the simulator has to be exited with the Exit
command and then executed from the OS prompt again.
Telelogic Tau 4.5 User’s Manual
,um-st1
2171
Chapter
51
Simulating a System
Supplying Values of External Synonyms
The SDL system for the simulator may contain external synonyms that
do not have a corresponding macro definition (see “External Synonyms” on page 2580 in chapter 57, The Cadvanced/Cbasic SDL to C
Compiler). In that case, you will be asked to supply the values of these
synonyms, either by selecting a file with synonym definitions, or by entering each synonym value from the keyboard.
In stand-alone mode, the following prompt appears:
External synonym file :
Enter the name of a file containing synonym definitions, or press
<Return> to be prompted for each synonym value.
In graphical mode, a file selection dialog is opened. Either select a file
(*.syn) containing synonym definitions, or press Cancel to be prompted for each value in a separate dialog. In this dialog, the name and type
of the synonym is shown together with an input text field. You can now
do the following:
•
Enter a value and click OK.
•
Click Default value to get a “null” value for the synonym type entered in the input field. Accept or edit this value and click OK.
•
Click Cancel to give the synonym a “null” value (without the possibility to edit the value).
•
Click Cancel all to give the synonym and all following synonyms a
“null” value.
If a synonym file is selected in the file selection dialog, this file is also
used when the simulation is restarted. (If you want to use another synonym file you have to set-synonym-file simulator UI command.)
If you set the environment variable SDTEXTSYNFILE to a file before
starting the SDL suite, this file will automatically be used. If SDTEXTSYNFILE is set to “[[“ all synonyms are given “null” values.
Note that the simulator lists all external synonyms that have been given
values in another way than from a synonym file. This is done to make it
easy to cut and paste information to a synonym file, for future use. An
example:
The following external synonyms were not found in
2172
,um-st1
Telelogic Tau 4.5 User’s Manual
July 2003
Issuing Monitor Commands
synonym file
/home/lat/simulator.syn:
myThirdSynonym (integer)
The syntax of a synonym file is described in “Reading Values at Program Start up” on page 2581 in chapter 57, The Cadvanced/Cbasic SDL
to C Compiler.
Actions on Simulator Start-up
When a simulator is started, the static process instances in the system
are created, but their initial transitions are not executed.
If a file called siminit.com exists in the current directory an implicit
Include-File command will be done on this file at startup.
Issuing Monitor Commands
Whenever the interactive monitor system becomes active, commands
are accepted from the user. When running the simulator in stand-alone
mode, commands can only be entered textually from a command
prompt. When running the simulator in graphical mode, commands may
be issued both textually and through the use of menus and buttons.
Activating the Monitor
The simulator’s monitor system becomes active when the simulator is
started, when the execution has reached a stop condition or a breakpoint, when the system is completely idle, when a semantic error occurs, or when the execution is manually stopped.
These conditions are listed in greater detail in “Activating the Monitor”
on page 2063 in chapter 50, The SDL Simulator.
The Textual Interface
The commands to the monitor system consist of a command name and
possibly one or more parameters to the command, separated by spaces
or carriage return. The following general rules apply:
•
July 2003
All command names and parameter values are case insensitive.
They may also be abbreviated, as long as they are unique. For in-
Telelogic Tau 4.5 User’s Manual
,um-st1
2173
Chapter
51
Simulating a System
stance, the command List-Ready-Queue can be entered in any of the
following ways:
List-Ready-Queue
list-ready
l-r-q
•
If not all parameters to a command are given on the command line,
the missing parameters will be prompted for. A parameter may be
optional, in which case a default value always exists. Default values
may also exist for required parameters.
•
If you enter an unallowed value for a parameter, an error message is
printed and the command is not executed. This is the only way to
cancel a command that has been entered.
Getting Command Help
To get a simple list of all possible command names, enter a ‘?’ at the
command prompt. A command can then be entered after the list.
To get a list of all commands, grouped into different categories, use the
command Help without parameters.
To get a list of all possible commands starting with a certain string, enter
the string and hit <Return>. Unless the string was a complete command, all command names starting with the entered string are listed.
The following example shows how to list all output commands:
Command : out
Command was ambiguous, it might be an abbreviation
of:
Output-To Output-Via Output-None Output-Internal
To get short help on a specific command, use the Help command and
specify the command in question as a parameter, e.g.
Command : help help
Help <Optional command name>
Issuing the help command will print all the
available commands. If help is entered with a
command name, this command will be explained.
2174
,um-st1
Telelogic Tau 4.5 User’s Manual
July 2003
Issuing Monitor Commands
Entering Parameters
To get a list of possible parameter values, enter a ‘?’ on the command
line or when prompted for a missing parameter.
To specify a default value for a parameter, enter a ‘-’ on the command
line or when prompted for a missing parameter.
If a default value exists for a parameter, you may also hit <Return>
when prompted for the parameter to accept the default value. However,
if no default value exists, this will list the possible values and prompt
for the parameter again.
Hint:
Before you are acquainted with the monitor commands and their parameters, it is generally a good idea to only enter the command
names, without parameters. When prompted for parameters, use ‘?’
to list possible values, and ‘-’ to accept default values.
July 2003
Telelogic Tau 4.5 User’s Manual
,um-st1
2175
Chapter
51
Simulating a System
The Graphical Interface
The graphical Simulator UI is illustrated in the figure below:
Figure 458: The Simulator UI
All input and output texts to and from the simulator monitor is displayed
in the text area to the right.
Entering Commands Textually
To enter monitor commands textually:
1. Place and click the mouse pointer inside the Command: input field
at the bottom right, below the text area.
2. Enter the command on the input line. The same syntax is used as
when running in stand-alone mode; see “The Textual Interface” on
page 2173. However, prompting for missing parameters are done by
issuing dialogs, where the parameter value can be entered or select-
2176
,um-st1
Telelogic Tau 4.5 User’s Manual
July 2003
Issuing Monitor Commands
ed from a list of possible values. See “Selecting Parameters” on
page 2177.
Monitor commands entered textually are saved in a history list. To reexecute a command in the history list:
1. Place the mouse pointer inside the input field.
2. Use the arrow keys <Up> and <Down> to display the commands
that have been entered earlier.
3. Hit <Return> on the command line to re-execute the displayed
command. You may edit the command before executing it.
Issuing Commands Using Buttons
The preferred way to issue monitor commands is by using the command
buttons in the left area of the Simulator UI, or by using menu choices in
the menu bar. Each button or menu choice correspond to a certain monitor command. The buttons are grouped into modules, corresponding to
different categories and uses of the commands. The groups are similar
to those listed when using the Help command in the textual interface.
To “preview” the command associated with a button or menu choice,
without executing it:
1. Place the mouse pointer on the button or menu choice and press the
mouse button. The name of the monitor command is displayed in
the Status Bar at the very bottom of the Simulator UI.
2. Move the mouse pointer outside the button or menu and release the
mouse button.
To execute a command, simply click on a button.
Selecting Parameters
Parameters to monitor commands are prompted for in dialogs (unless
they have been specified on the command input line). If a parameter has
a set of possible values, the list of values is presented from which you
may select a value:
July 2003
Telelogic Tau 4.5 User’s Manual
,um-st1
2177
Chapter
51
Simulating a System
Figure 459: A typical parameter dialog
In this dialog, the values can be sorted alphabetically by clicking the
Sort button. After having entered an initial string, you can also press
<Space> to select the first value starting with this string, or press ‘?’
to select the first value containing this string. Additional <Space> or
‘?’ characters will select the next value, etc. When there are no more
matches, a real space or ‘?’ character will be added after the string you
initially entered.
File parameters are prompted for in File Selection Dialogs. Other parameters, like integers, are prompted for in a simple text input dialog.
•
To accept a selected or entered value, click OK in the dialog.
•
To enter a “null” value for the parameter in the input field, click Default value (only available for some parameter types).
•
To specify a possible default value, click OK without having selected or entered any value, or enter a ‘-’ in the dialog’s text input field.
•
To cancel a command, click Cancel in any of the parameter dialogs,
or enter an unallowed value in the dialog’s text input field.
Selecting Signal Parameters
If a command parameter is an output signal and you select a signal
which in turn have parameters, the signal parameters are asked for in a
separate dialog. In this dialog, all parameters are listed with their default
(“null”) values:
2178
,um-st1
Telelogic Tau 4.5 User’s Manual
July 2003
Issuing Monitor Commands
Figure 460: Editing signal parameters
To edit a signal parameter, you select the parameter and then edit the
value displayed in the input field. If the parameter is of an enumerated
type, the possible values can also be selected from the option menu just
above the input field. By clicking Default value, the “null” value will be
inserted in the input field. A changed parameter value is not updated in
the parameter list until a parameter is selected in the list.
Click OK to accept all parameter values, and Cancel to abort the monitor command. The validity of the parameter values is not tested until
you click the OK button.
Undo/Redo Commands
To undo a previous command, click the Undo quick button in the tool
bar, or select Undo in the popup menu that is available in the text area.
Then you get a dialog with all commands you have given so far. All
commands are shown, even the ones entered using buttons or menu
choices.
July 2003
Telelogic Tau 4.5 User’s Manual
,um-st1
2179
Chapter
51
Simulating a System
Figure 461: Undoing a command
Initially all commands except the last is selected. If you click OK the
simulation is restarted and all the selected commands will be re-executed. By clicking on the commands in the dialog you can decide which
commands you want to be re-executed in the restarted simulation.
Note:
The Undo function cannot handle to undo commands for setting or
removing graphical breakpoints.
To redo a command in the current simulation, select Command in the
popup menu in the text area. Then you also get a dialog with all commands you have given so far, in the same way as for Undo.
Figure 462: Redoing a command
2180
,um-st1
Telelogic Tau 4.5 User’s Manual
July 2003
Customizing the Simulator UI
After selecting one of the commands and clicking OK the command is
executed. You can also change the command on the command line before clicking OK.
Customizing the Simulator UI
In the Simulator UI, you may change the contents and appearance of
button modules and some additional windows. All these configurations
are stored in a number of definition files, which are read at start-up of
the Simulator UI. If you change any of the configurations, you are
prompted to save them when you exit the Simulator UI.
Managing Command Buttons
You may wish to add your own command buttons for frequently used
commands, or to change or delete existing command buttons. These operations are invoked from the Group menu in the button modules:
Figure 463: The Group menu
Adding a Button
To add a button to a module:
1. Select Add from the Group menu. A dialog is opened:
Figure 464: Adding a button
July 2003
Telelogic Tau 4.5 User’s Manual
,um-st1
2181
Chapter
51
Simulating a System
2. Enter a button label and a monitor command definition. The same
syntax is used as when entering commands textually. If you omit a
parameter value, it will be asked for in a parameter dialog when the
command is executed.
3. Click OK to add the button and close the dialog. If you click Apply,
the button is added and you can specify another button to add.
Note:
You cannot specify the location of the button in the module. It will
be placed in the next available empty position.
Changing a Button
To change an existing button in a module:
1. Select Edit from the Group menu. A dialog is opened:
Figure 465: Selecting a button
2. Select the button to edit and click OK. A dialog similar to when adding a button is opened (see Figure 464).
3. Edit the button label and/or the command definition and click OK.
2182
,um-st1
Telelogic Tau 4.5 User’s Manual
July 2003
Customizing the Simulator UI
Deleting a Button
To delete an existing button in a module:
1. Select Delete from the Group menu. A dialog similar to when editing a button is opened (see Figure 465).
2. Select the button to delete and click OK. The button is deleted from
the module and the remaining buttons are possibly re-arranged.
Managing Button Modules
In addition to the command buttons, you may also add, rename, delete
and collapse/expand the button modules.
Collapsing and Expanding Modules
Modules may be collapsed and expanded to only show the command
buttons of interest at the moment. A collapsed module hides all of its
buttons and only displays the title bar:
Figure 466: A collapsed button module
To collapse and expand a module, click the toggle button to the left of
the module name in the title bar.
To collapse and expand all modules, select Collapse Groups or Expand
Groups in the Buttons menu.
Adding, Deleting and Renaming a Module
To add a new module to the bottom of the button module area, select
Add Group in the Buttons menu. In the dialog, enter the module’s name
and click OK.
To delete a module, select Delete Group from the module’s Group
menu. In the confirmation dialog, click OK.
To rename a module, select Rename Group from the module’s Group
menu. In the dialog, enter a new name and click OK.
July 2003
Telelogic Tau 4.5 User’s Manual
,um-st1
2183
Chapter
51
Simulating a System
The Command and Watch Windows
In the Simulator UI, you can continuously view the internal status of the
system by using the Command and Watch windows. These windows are
opened from the View menu. They are both updated automatically
whenever the monitor system becomes active.
The Command Window
In the Command window, you can execute a number of monitor commands automatically. The commands are executed in command modules, similar to button modules in the main window of the Simulator UI:
Figure 467: The Command window
By default, the commands List-Ready-Queue and List-Process are executed. You are advised to only use commands for examining the system,
see “Examining the System” on page 2196.
The command modules are managed in the following ways:
•
2184
,um-st1
To add a command module, select Command from the Command
menu in the menu bar. In the dialog, enter the monitor command to
execute, including possible parameters.
Telelogic Tau 4.5 User’s Manual
July 2003
Customizing the Simulator UI
•
To change the command executed in a module, select Edit from the
module’s Command menu. In the dialog, enter a new command and
click OK.
•
To delete a command module, select Delete from the module’s
Command menu. No confirmation dialog is issued.
•
To change the size of a module’s text output area, select Size from
the module’s Command menu. In the dialog, use the slider to set the
number of text lines to be visible.
•
To collapse or expand a module, click the toggle button to the left
of the module name in the title bar.
The Watch Window
In the Watch window, you can automatically monitor values of variables in the system. The variables are displayed on separate lines in the
window:
Figure 468: The Watch window
By default, the Watch window is empty. To add a variable, select Add
from the Watch menu. In the dialog, enter the variable specification and
click OK. A variable specification consists of the process instance name
within parenthesis, followed by the variable name, e.g.
(game:1) count.
To change a variable specification, select Edit from the Watch menu. In
the dialog, select the variable to edit and click OK. In the next dialog,
you can edit the specification and click OK.
To delete a variable specification, select Delete from the Watch menu.
In the dialog, select the variable to delete and click OK.
July 2003
Telelogic Tau 4.5 User’s Manual
,um-st1
2185
Chapter
51
Simulating a System
Tracing the Execution
When the SDL system is executing during simulation, you can obtain
trace information of the execution. This makes it easier to follow the
events that happen during execution.
There are three types of execution traces:
•
Textual Trace, printed in the Simulator UI’s text area, or on the terminal (in stand-alone mode)
•
GR Trace, graphically illustrated by selecting SDL symbols in an
SDL Editor
•
MSC Trace and Logging, illustrated by drawing MSC events in an
MSC Editor, or by saving the MSC events to a log file.
The amount of trace is determined by a trace value for each of the three
trace types. The trace value controls the level of detail in the trace; the
trace value 0 (zero) means no trace. Setting appropriate trace levels is
often something you would like to do before the execution is started.
Apart from these continuous trace functions, there are also other possibilities to trace the execution. See “Other Tracing Functions” on page
2193.
Specifying Unit Names
Trace values can be assigned to different units of the SDL system; the
system as a whole, blocks, process types, and process instances.
2186
•
When using the Simulator UI, you will be presented with a list of all
units in the system, from which you may select the appropriate unit.
•
When running the simulator stand-alone, you have to specify a unit,
unless you want to set the trace for the system. In the trace commands described below, you may abbreviate the name of the unit.
However, if several units match a unit name, the first unit found
from the system level will be used. To make sure the correct unit is
specified, the name can be prefixed with the diagram type or a qualifier.
,um-st1
Telelogic Tau 4.5 User’s Manual
July 2003
Tracing the Execution
Example 322: Specifying Trace Unit Names –––––––––––––––––––––
System Demongame
Block GameBlock
Process Game
In this diagram structure, the unit name “Game” would refer to the
block GameBlock. To specify the process Game instead, the unit could
be expressed as “process Game” or “<<System Demongame / Block
GameBlock>> Game”.
––––––––––––––––––––––––––––––––––––––––––––––––––––––––––
Determining the Scope of Trace
When a process instance executes a transition, or part of a transition, the
trace value for the instance is found using the following algorithm:
1. If a trace value is defined for the process instance executing the transition, that value is used.
2. If not, and a trace value is defined for the process type, that value is
used.
3. Otherwise, if a trace value is defined for the block enclosing the process, that value is used.
4. If still no trace value is found, the block structure is followed outwards until a unit is reached which has a trace value defined. The
system always has a trace value defined.
For MSC trace the situation is slightly more complex; see “MSC Trace”
on page 2191.
Textual Trace
Textual trace is printed for the transition or the SDL symbols that were
last executed.
To quickly set the maximum textual trace level (6) for the system, click
the TEXT button in the Trace module.
July 2003
Telelogic Tau 4.5 User’s Manual
,um-st1
2187
Chapter
51
Simulating a System
The general procedure to set the trace value for textual trace is:
1. Choose Text Level : Set in the Trace menu, or enter the command
Set-Trace. The command takes two parameters, an optional unit
name and the trace value.
2. Select or enter the name of the unit to set the trace for. If you do not
specify a unit name, or the default name ‘-’ is entered, the trace will
be set for the whole system.
3. Select or enter a trace value between 0 and 6. The trace values are
shortly described in the dialog, or after hitting <Return> in standalone mode. The following table explains them in more detail; for a
full explanation, see “Trace Limit Table” on page 2116 in chapter
50, The SDL Simulator. The default textual trace value is 4 for the
system.
Value
Trace Explanation and Examples
0
No trace
1
Trace of signals sent to the environment, as seen from the
specified unit. This is useful if you only want to look at the
external behavior of the unit. Example:
*
*
2
OUTPUT of Score from Game:1 to env:1
Parameter(s) : -1
Trace of transition start and timer outputs, i.e. what is causing the transition to occur.
For transition starts, the process instance, initial state, input
signal, sender process and value of Now is printed, e.g.:
*** TRANSITION START
*
PId
: Demon:1
*
State : Generate
*
Input : T
*
Sender : Demon:1
*
Now
: 1.0000
For timer outputs, the timer name, receiver process and value of Now is printed, e.g.:
***
*
*
***
2188
,um-st1
TIMER signal was sent
Timer
: T
Receiver : Demon:1
Now
: 1.0000
Telelogic Tau 4.5 User’s Manual
July 2003
Tracing the Execution
Value
Trace Explanation and Examples
3
As 2 + trace of important SDL actions, e.g. signal output,
create, timer set and reset, nextstate and stop. Examples:
*
*
*
***
4
SET on timer T at 1.0000
CREATE Game:1
OUTPUT of Bump to Game:1
NEXTSTATE Generate
As 3 + trace of other SDL actions as well, e.g. task, decision
and export. Example:
*
ASSIGN
Count :=
5
As 4 + result of actions, e.g. null transitions, implicit resets,
and discarded signals.
6
As 5 + print of parameter values for signals, timers, create
actions, etc. Examples:
*
*
*
ASSIGN Count := 1
OUTPUT of Score to env:1
Parameter(s) : 1
To list the textual trace values that are defined for the units in the system, choose Trace Level : Show in the Trace menu, or enter the command List-Trace-Values.
You can also reset the trace value for textual trace for a unit, i.e., set it
to undefined. To do this, enter the command Reset-Trace and specify a
unit (there is no button for this command).
GR Trace
GR trace will open an SDL Editor and continuously select the next SDL
symbol to be executed in the corresponding process diagram. (See also
“Tracing Simulations (Graphical Trace)” on page 1785 in chapter 44,
Using the SDL Editor.)
To quickly set the GR trace level for the system to 1 (see below), click
the SDL button in the Trace module.
July 2003
Telelogic Tau 4.5 User’s Manual
,um-st1
2189
Chapter
51
Simulating a System
The general procedure to set the trace value for GR trace is:
1. Choose SDL Level : Set in the Trace menu, or enter the command
Set-GR-Trace. The command takes two parameters, an optional
unit name and the trace value.
2. Select or enter the name of the unit to set the trace for. If you do not
specify a unit name, or the default name ‘-’ is entered, the trace will
be set for the whole system.
3. Select or enter a trace value between 0 and 2. The trace values are
shortly described in the dialog, or after hitting <Return> in standalone mode. The following table explains them in more detail. The
default GR trace value is 0 for the system.
Value
Trace Explanation
0
No trace.
1
In an SDL Editor, show the next SDL symbol to be executed. This only happens when the monitor is activated the
next time, i.e. when it becomes ready to accept a new command. No symbols are selected during execution when the
monitor is inactive.
2
In an SDL Editor, follow the execution and show each SDL
symbol as it is executed, until the monitor is activated
again.
To list the GR trace values that are defined for the units in the system,
choose SDL Level : Show in the Trace menu, or enter the command
List-GR-Trace-Values.
You can also reset the trace value for GR trace for a unit, i.e., set it to
undefined. To do this, enter the command Reset-GR-Trace and specify
a unit (there is no button for this command).
MSC Trace and Logging
MSC trace will enable transformation of the SDL events that take place
during execution into corresponding MSC events. Of course, not all
SDL events are possible to transform into MSC events; typically, the
events that can be transformed are sending and consumption of signals,
setting and expiration of timers, and creation and termination of processes. By default, this transformation is enabled for the whole system.
2190
,um-st1
Telelogic Tau 4.5 User’s Manual
July 2003
Tracing the Execution
The MSC events that are created by MSC trace can then be logged in
two different ways:
•
by opening an MSC Editor and continuously adding the events to an
MSC diagram created for this purpose, or
•
by continuously saving the events to a log file that later can be
opened from an MSC Editor.
Therefore, setting the MSC trace value does not start the actual logging
of MSC events in an MSC Editor or on file.
MSC Trace
To set the trace value for MSC trace:
1. Choose MSC Level : Set in the Trace menu, or enter the command
Set-MSC-Trace. The command takes two parameters, an optional
unit name and the trace value.
2. Select or enter the name of the unit to set the trace for. If you do not
specify a unit name, or the default name ‘-’ is entered, the trace will
be set for the whole system.
3. Select or enter a trace value between 0 and 3. The trace values are
shortly described in the dialog, or after hitting <Return> in standalone mode. The following table explains them in more detail; for a
full explanation, see “Message Sequence Chart Traces” on page
2119 in chapter 50, The SDL Simulator. The default MSC trace value is 1 for the system.
July 2003
Value
Trace Explanation
0
No trace.
1
For an MSC event that involves another unit, trace only if
that unit’s trace value is greater than 0.
2
For an MSC event that involves another unit, trace always,
even if that unit’s trace value is 0. Such an MSC event will
be logged to interact with a special “void” instance in the
MSC diagram.
3
Trace on block levels.
Telelogic Tau 4.5 User’s Manual
,um-st1
2191
Chapter
51
Simulating a System
To list the MSC trace values that are defined for the units in the system,
choose MSC Level : Show in the Trace menu, or enter the command
List-MSC-Trace-Values.
You can also reset the trace value for MSC trace for a unit, i.e., set it to
undefined. To do this, enter the command Reset-MSC-Trace and specify a unit (there is no button for this command).
Logging of MSC Events
To start the continuous logging of MSC events in an MSC Editor:
1. Choose MSC Trace : Start in the Trace menu, or enter the command
Start-Interactive-MSC-Log. The command takes one parameter, a
symbol level determining the amount of information that should be
part of the MSC.
2. Select or enter a symbol level between 0 and 2 (see the table below).
An MSC Editor is opened and the execution is then traced by adding
MSC events to the created diagram. (See also “Tracing a Simulation
in a Message Sequence Chart” on page 1681 in chapter 40, Using
Diagram Editors.)
To quickly start the continuous logging of MSC events in an MSC Editor with symbol level 1, click the MSC button in the Trace module.
To start the continuous logging of MSC events in a log file:
1. Choose MSC Trace : Start Batch in the Trace menu, or enter the
command Start-Batch-MSC-Log. The command takes two parameters, a symbol level and the name of the log file. The symbol level
determines the amount of information that should be logged.
2. Select or enter a symbol level between 0 and 2 (see the table below).
3. Select or enter a log file name, preferably with the suffix .mpr.
When an MSC log is started, the amount of information that should be
part of the log can be decided by giving the symbol level parameter an
appropriate value, according to the table below:
2192
,um-st1
Telelogic Tau 4.5 User’s Manual
July 2003
Tracing the Execution
Level
Information in MSC
0
Basic MSC, i.e. containing events for signals and timers
plus create and stop.
1
Basic MSC extended with condition symbols for each nextstate.
2
Basic MSC extended with condition symbols for each nextstate and action symbols for task, decision, call, and return.
Note that you cannot have both types off logging enabled at the same
time. To see what type of logging is enabled, enter the command
List-MSC-Log (this command has no button).
To stop the logging, choose MSC Trace : Stop in the Trace menu, or enter the command Stop-MSC-Log. If you used logging to an MSC Editor, you should then save the trace from the editor. If you used logging
to file, the file is automatically saved and closed.
Other Tracing Functions
Showing SDL Symbols
If you do not have GR trace enabled, it is still possible to show the next
symbol to be executed in an SDL Editor. To do this, choose
Next Symbol in the Show menu, or enter the command
Show-Next-Symbol.
In a similar fashion, the last executed symbol can be shown in an SDL
Editor. This will give you a correspondence between textual trace and
the SDL Editor, since textual trace always is printed for the last executed symbols. To do this, choose Prev Symbol in the Show menu, or enter
the command Show-Previous-Symbol.
Tracing Back to C Code
A trace-back to the generated C source code for the system is also possible. To show where in the C code the execution is at the moment,
choose C Line in the Show menu, or enter the command
Show-C-Line-Number. The file name and line number of the C source
file is printed, and the C source file is opened in the Text Editor, positioned on the correct line.
July 2003
Telelogic Tau 4.5 User’s Manual
,um-st1
2193
Chapter
51
Simulating a System
Generating Coverage Information
To see how much of the SDL system you have covered during simulation, you can open the coverage information in a Coverage Viewer, and
for instance examine which parts of the system that have not been executed during the simulation. To start the Coverage Viewer, choose Coverage in the Show menu, or enter the command Show-Coverage-Viewer.
Executing a Simulator
There are a number of monitor commands for executing one or more
transitions in process instances, and for stepping symbol by symbol
within a transition.
Note:
During execution, you may be prompted for input before the execution can continue. See “Run-time Prompting” on page 2128 in
chapter 50, The SDL Simulator for more information.
Continuous Execution
To start executing the simulation program continuously, click the Go
button in the Execute module, or enter the command Go. The execution
continues until one of the conditions listed in “Activating the Monitor”
on page 2173 becomes true, for instance when reaching a breakpoint.
See also “Stopping the Execution” on page 2196.
Note:
The button Forever, corresponding to the command Go-Forever,
behaves very similar to the above. The difference is that the monitor
does not become active when the system is completely idle. This
feature is valuable when communicating with other simulations or
applications.
Executing Until a Condition
To execute until a certain point in time:
1. Choose Until Time in the Execute menu, or enter the command
Proceed-Until. The command takes one parameter, the value of the
simulation time when to stop executing.
2194
,um-st1
Telelogic Tau 4.5 User’s Manual
July 2003
Executing a Simulator
2. Enter a time value, either an absolute value (without sign) or a value
relative to Now (with a ‘+’ sign). That is, “7.5” is an absolute time
value, whereas “+7.5” is the time value Now+7.5.
To execute until, but not including, the next timer output, click the Until
Timer button in the Execute module, or enter the command
Proceed-To-Timer.
Executing Transitions
To execute the next transition, or the remainder of the current transition,
click the Transition button in the Execute module, or enter the command Next-Transition.
To execute a number of transitions until a transition with a textual trace
value > 0 has been executed, choose Until Trace in the Execute menu,
or enter the command Next-Visible-Transition. This is very valuable
when you have set the trace value for some “uninteresting” parts of the
system to 0, and you want to skip over those parts.
Single-Stepping Symbols or Statements
To execute only the next SDL symbol, choose Over Symbol in the Execute menu, or enter the command Next-Symbol. This may execute several statements, and will step over procedure calls.
To execute only the next SDL statement, choose Over Stmt in the Execute menu, or enter the command Next-Statement. This will step over
procedure calls.
Executing Procedures
The only way to follow the execution into a procedure is to use the following single-stepping functions.
To execute only the next SDL symbol, and to step into possible procedure calls, click the Symbol button in the Execute module, or enter the
command Step-Symbol. This may execute several statements.
To execute only the next SDL statement, and to step into possible procedure calls, choose Into Stmt in the Execute menu, or enter the command Step-Statement.
July 2003
Telelogic Tau 4.5 User’s Manual
,um-st1
2195
Chapter
51
Simulating a System
To execute a procedure up to and including its return, choose Finish in
the Execute menu, or enter the command Finish. In a process, this command behaves exactly like Next-Transition.
Stopping the Execution
To stop the execution of transitions and symbols manually:
•
In the Simulator UI, click the Break button in the Execute module.
•
In stand-alone mode, press <Return> during printing of trace information (repeatedly, if necessary). No other characters may be
typed before <Return> is pressed.
Caution!
There are some situations in which it is not possible to stop the execution in this way, for instance in an endless loop within an SDL
symbol. The only way to stop the simulator in these situations is to
terminate the simulation program from the operating system, for instance by pressing <Ctrl+C>, in which case all simulation results
are lost.
Examining the System
In the Simulator, you can issue a number of monitor commands to examine the internal status of the system. Detailed information concerning
processes, procedure calls, signals, timers, and variables can be requested. Using the Simulator UI, you may continuously view the internal status by using the Command and Watch windows; see “The Command
and Watch Windows” on page 2184.
Current Process and Scope
Some of the commands used for examining the system operate on a specific process instance, the current process, identified by the current
scope. A scope is a reference to a process instance, a reference to a service instance if the process contains services, and possibly a reference
to a procedure instance called from this process/service (the current
procedure). The scope is also used by some of the commands for modifying the system; see “Modifying the System” on page 2212.
2196
,um-st1
Telelogic Tau 4.5 User’s Manual
July 2003
Examining the System
The scope is automatically set by the execution commands, when entering the monitor, to the next process instance in turn to execute. You may
change the scope if you would like to examine (or modify) another process, service or procedure instance. Changing the scope does not change
the execution order of process instances. As soon as the execution continues again, the scope is reset to the next process instance in turn to execute.
The Process/service Scope
To print the current process/service scope enter the command Scope.
To set the current process/service scope:
1. Choose Set Scope in the Examine menu, or enter the command
Set-Scope. This command takes one parameter, a process instance,
and optionally if the process contains services, a second parameter
which specifies a service name.
2. Select or enter the name of a process instance.
3. If the process instance contains services, select or enter the name of
a service instance.
The scope is set to the specified process/service, at the bottom procedure call.
The Procedure Scope
To print the procedure call stack for the process/service instance defined by the current scope, choose Call Stack in the Examine menu, or
enter the command Stack.
To change the procedure scope within the current process/service
scope, you can move the scope one step up or down in the procedure call
stack by entering the command Up or Define-MSC-Trace-Channels.
Going up from a service leads to the process containing the service. To
go down in a service within a process, select or enter the name of the
service instance.
Printing the Simulation Time
To print the current value of the simulation time, in case it is not displayed by the textual trace, choose Now in the Examine menu, or enter
the command Now.
July 2003
Telelogic Tau 4.5 User’s Manual
,um-st1
2197
Chapter
51
Simulating a System
Printing the Process Ready Queue
The ready queue is the queue of process instances that are ready to execute a transition, i.e., those instances that have received a signal that
can cause an immediate transition, but that have not yet had the opportunity to execute this transition to its end.
To print an ordered list of the process instances in the ready queue,
choose Ready Q in the Examine menu, or enter the command
List-Ready-Queue. The list contains an entry number (queue position),
the process instance, its current state, the number of signals in its input
port, and the name of the signal that will cause the next transition. If a
process instance has active procedure calls, the current executing procedure instance is also listed. If the state name is followed by a ‘*’, then
the process/procedure is currently executing a transition starting from
this state.
The ready queue is by default printed in the Command window. It may
look like this:
Figure 469: The ready queue in the Command window
Examining Process Instances
To list all active process instances of a certain process type:
1. Click the Process List button in the Examine module, or enter the
command List-Process. The command takes one parameter, the
name of the process type. (The button already has the parameter ‘-’.)
2. Select or enter a process type. If no process type is specified, or it is
specified as ‘-’, all active process instances in the system are listed.
The list contains the same details as described for the process ready
queue, above.
To print information about the current process instance, enter the command Examine-PId. The information contains the current values of Par2198
,um-st1
Telelogic Tau 4.5 User’s Manual
July 2003
Examining the System
ent, Offspring, Sender and a list of all currently active procedure calls
made by the process instance (the stack). For more information on current process and procedure call stack, see “Current Process and Scope”
on page 2196. An example of output is:
Parent
: null
Offspring : Game:1
Sender
: env:1
PId
Main:1
Examining Signal Instances
To list all signal instances in the input port of the current process instance, choose Input Port in the Examine menu, or enter the command
List-Input-Port. The list contains an entry number (queue position), the
signal type, and the sending process instance. If the entry number is prefixed by a ‘*’, the signal instance is the one to be consumed in the next
transition performed by the process instance. For more information on
the current process, see “Current Process and Scope” on page 2196. An
example of output is:
Input port of Game:1
Entry
Signal name
*1
Bump
2
GameOver
Sender
Demon:1
Main:1
To print the parameters of a signal instance in the input port of the current process instance:
1. Choose Signal in the Examine menu, or enter the command
Examine-Signal-Instance. This command takes one parameter, an
entry number in the input port.
2. Enter an entry number. To see what entry number is associated with
the signal instance, list the input port as described above. An example of output is:
Signal name : Score
Parameter(s) : -1
July 2003
Telelogic Tau 4.5 User’s Manual
,um-st1
2199
Chapter
51
Simulating a System
Examining Timer Instances
To list all active timers in the system, choose Timer List in the Examine
menu, or enter the command List-Timer. The list contains an entry number, the timer name, the corresponding process instance, and the associated time. An example of output is:
Entry
1
Timer name
T
PId
Demon:1
Time
4.0000
To print the parameters of an active timer instance:
1. Enter the command Examine-Timer-Instance. This command takes
one parameter, an entry number in the timer list.
2. Enter an entry number. To see what entry number is associated with
the timer instance, list the active timers as described above. If only
one timer is active, the entry number is not needed.
Examining Variables
To print the value of a variable or formal parameter in the current process or procedure:
1. Click the Var In Scope button in the Examine module, or enter the
command Examine-Variable. This command takes two optional parameters, the name of the variable and a specification of a variable
component.
2. Select or enter the name of a variable, possibly abbreviated. If no
variable name is specified, all variables and formal parameters of
the current process or procedure are printed.
If a variable has several components (e.g. an array, struct or string)
and it is specified without a component, the values of all components of the variable is printed (e.g. the complete array).
2200
,um-st1
–
To print only a certain component, specify the component after
the variable name. (In the Simulator UI, this must be done on the
text input line in the dialog, after a variable name has been selected.)
–
To get a list of the possible components of a variable, enter a ‘?’
after the variable name. (In the Simulator UI, this must be done
on the text input line in the dialog, after a variable name has
Telelogic Tau 4.5 User’s Manual
July 2003
Managing Breakpoints
been selected; another dialog is then opened, in which the component can be selected.)
More information on the input and output of SDL data types can be
found in “Input and Output of Data Types” on page 2069 in chapter
50, The SDL Simulator.
To examine variables or formal parameters in any process, click the
Variable button in the Examine module. In addition to the variable
name and component (as described above), you will be prompted for the
process name.
Managing Breakpoints
By setting breakpoints in the system, the execution of a simulator can
be stopped and the monitor system activated at a certain point of interest. They can be used to trap certain SDL symbols, transitions, signal
outputs, and variable changes.
Breakpoints are often used together with continuous execution to reach
a certain state of the system (see “Continuous Execution” on page
2194). The monitor system becomes active when the breakpoint condition becomes true. Care should be taken when using continuous execution with breakpoints; if the breakpoint is never reached, the system
may continue executing “forever.”
Breakpoint Commands
When defining a breakpoint, you may specify one or more monitor
commands to be executed after the breakpoint has been reached. In this
way it is possible to, for instance, automatically print information about
the system by using the examine commands. The monitor commands
are specified using the same syntax as when entering them textually.
If you want to use several monitor commands, they have to be separated
by spaces and semicolons. It is even possible to use the execution commands in this context to automatically continue the execution after a
breakpoint has been reached. However, care should be taken to make
sure the system does not end up executing “forever.” An example of a
combination of breakpoint commands may be:
Examine-PId ; Go
July 2003
Telelogic Tau 4.5 User’s Manual
,um-st1
2201
Chapter
51
Simulating a System
Setting a Symbol Breakpoint
Symbol breakpoints are set on a specific SDL symbol. Symbol breakpoints are checked before a symbol is executed, i.e., the symbol is not
executed when the breakpoint is reached.
There are two ways to set a symbol breakpoint, either graphically by selecting the SDL symbol directly in the SDL Editor, or textually by specifying an SDT reference to the SDL symbol.
When a symbol breakpoint has been set, the breakpoint is indicated by
a red “stop” sign placed at the SDL symbol in the SDL diagram.
To set a symbol breakpoint graphically using the SDL Editor:
1. If necessary, open an SDL Editor on the diagram containing the
SDL symbol.
2. Choose Connect sdle in the Breakpoint menu in the Simulator UI,
or enter the command Connect-To-Editor. A new menu Breakpoints
now appear in the SDL Editor.
3. Select the symbol in the SDL Editor.
4. From the Breakpoints menu in the SDL Editor, choose one of the
two Set Breakpoint commands. The first command opens a dialog
to allow entering one or more optional breakpoint commands. The
second command sets the breakpoint without any breakpoint command.
To set a symbol breakpoint textually using an SDT reference:
1. Choose Symbol in the Breakpoint menu, or enter the command
Breakpoint-At. This command takes two parameters, a textual SDT
reference to the SDL symbol and an optional breakpoint command.
2202
,um-st1
Telelogic Tau 4.5 User’s Manual
July 2003
Managing Breakpoints
Setting a Transition Breakpoint
Transition breakpoints are set on a transition, i.e. the combination of a
process instance, state, signal and sender. Transition breakpoints are
checked before a transition is executed, i.e., the transition is not executed when the breakpoint is reached.
To set a transition breakpoint:
1. Choose Transition in the Breakpoint menu, or enter the command
Breakpoint-Transition. This command takes the following parameters: the process name and instance number, the name of a service,
the state of the process/service, the signal, the sender’s process
name and instance number, a breakpoint counter, and an optional
breakpoint command.
Any of the parameters may be omitted or given the value ‘-’, which
means that any value will match that parameter. In this way, transition breakpoints can be matched by more than one transition.
2. Select or enter the name of the process in which the transition exists.
If no process is specified, any process will match.
3. Enter the instance number of the process. If no instance number is
specified, any instance of the process specified above will match.
4. Select or enter the name of the service of interest.
5. Select or enter the state of the process where the transition is executed from. If no state is specified, any state will match.
6. Select or enter the name of the signal that causes the transition. If no
signal is specified, any signal will match.
7. Select or enter the name of the process sending the signal. If no process is specified, any sender process will match. Note that “env”
may be entered for the environment process.
8. Enter the instance number of the sender process. If no instance number is specified, any instance of the process specified above will
match.
9. Enter a breakpoint counter, i.e. how many times the breakpoint condition must be true before the execution is stopped. If no counter
value is specified, the default value 1 is used.
10. Enter one or more optional breakpoint commands.
July 2003
Telelogic Tau 4.5 User’s Manual
,um-st1
2203
Chapter
51
Simulating a System
Setting an Output Breakpoint
Output breakpoints are set on a signal output, i.e. the combination of a
signal, sender process and receiver process. Output breakpoints are
checked immediately after a signal is sent.
To set an output breakpoint:
1. Choose Output in the Breakpoint menu, or enter the command
Breakpoint-Output. This command takes the following parameters:
the signal name, the sender’s process name and instance number,
the receiver’s process name and instance number, a breakpoint
counter, and an optional breakpoint command.
Any of the parameters may be omitted or given the value ‘-’, which
means that any value will match that parameter. In this way, output
breakpoints can be matched by more than one signal output.
2. Select or enter the name of the signal. If no signal is specified, any
signal will match.
3. Select or enter the name of the process sending the signal. If no process is specified, any sender process will match. Note that “env”
may be entered for the environment process.
4. Enter the instance number of the sender process. If no instance number is specified, any instance of the process specified above will
match.
5. Select or enter the name of the process receiving the signal. If no
process is specified, any receiver process will match. Note that
“env” may be entered for the environment process.
6. Enter the instance number of the receiver process. If no instance
number is specified, any instance of the process specified above will
match.
7. Enter a breakpoint counter, i.e. how many times the breakpoint condition must be true before the execution is stopped. If no counter
value is specified, the default value 1 is used.
8. Enter one or more optional breakpoint commands.
2204
,um-st1
Telelogic Tau 4.5 User’s Manual
July 2003
Managing Breakpoints
Setting a Variable Breakpoint
Variable breakpoints are set on a specific variable and are triggered
whenever the value of the variable is changed. Variable breakpoints are
checked after a variable assignment, i.e., the execution stops immediately after the symbol or assignment statement where the value was
changed.
To set a breakpoint on a variable in the current process:
1. Choose Variable in the Breakpoint menu, or enter the command
Breakpoint-Variable. This command takes two parameters: the
variable name and an optional breakpoint command.
2. Select or enter a variable name in the current process.
3. Enter one or more optional breakpoint commands.
Listing and Removing Breakpoints
To list all defined breakpoints, choose List in the Breakpoint menu, or
enter the command List-Breakpoints. The list contains an entry number
and the break condition for each breakpoint, i.e. the values of the parameters specified when the breakpoint was defined. An omitted parameter
value, where permitted, is listed as “any.”
A symbol breakpoint can be visualized by opening the SDL diagram
and selecting the SDL symbol in an SDL Editor. To see where a specific
symbol breakpoint has been defined:
1. Enter the command Show-Breakpoint (this command has no associated button or menu choice). This command takes one parameter,
an entry number in the breakpoint list.
2. Enter an entry number. (To see what entry number is associated
with the symbol breakpoint, list the breakpoints as described
above.) The SDL symbol, pointed out by the SDT reference specified for the breakpoint, becomes selected in an SDL Editor.
July 2003
Telelogic Tau 4.5 User’s Manual
,um-st1
2205
Chapter
51
Simulating a System
To remove a defined breakpoint using the Simulator UI:
1. Choose Remove in the Breakpoint menu, or enter the command
Remove-All-Breakpoints. This command takes one parameter, an
entry number in the breakpoint list.
2. Enter an entry number. (To see what entry number is associated
with the symbol breakpoint, list the breakpoints as described
above.) The breakpoint is removed.
To remove all symbol breakpoints set on an SDL symbol:
1. If necessary, open an SDL Editor on the diagram containing the
SDL symbol.
2. If the Breakpoints menu is not visible in the SDL Editor menu bar,
choose Connect sdle in the Breakpoint menu in the Simulator UI, or
enter the command Connect-To-Editor. The menu Breakpoints now
appear in the SDL Editor.
3. Select a symbol with a red breakpoint symbol in the SDL Editor.
4. From the Breakpoints menu in the SDL Editor, choose the Remove
Breakpoint command. All symbol breakpoints are removed.
To remove all defined breakpoints:
•
2206
,um-st1
Enter the command Remove-All-Breakpoints (this command has no
associated button or menu choice). All defined breakpoints are now
removed.
Telelogic Tau 4.5 User’s Manual
July 2003
Sending Signals from the Environment
Sending Signals from the Environment
Usually, you have to send signals into the system to make something of
interest happen, for instance when the system is completely idle. You
can send signals directly to a process instance, or indirectly by specifying a channel.
Sending Signals to a Process
To send a signal from the environment to a certain process:
1. Click the Send To button in the Send Signal module, or enter the
command Output-To. This command takes three parameters: the
signal name, any signal parameters, and the process instance of the
receiver.
2. Select or enter the name of the signal to send.
3. If the signal has parameters, set the values of the parameters in the
dialog that is opened. Select a parameter in the list, enter/edit its value using the input line, or the option menu containing possible values (for enumeration type parameters). Click the Default value button to get a “null” value for the parameter.
4. Select or enter the name of a process instance to send the signal to.
The Simulator tries to find a path of channels and signal routes to
the receiver. If no path was found, an error message is printed. If a
path was found, the signal is either successfully sent (and placed in
the input port of the receiver), or is discarded (an immediate null
transition occurred), i.e. the receiver is in a state that cannot receive
or save the specified signal.
Sending Signals via a Channel
To send a signal from the environment via a channel:
1. Click the Send Via button in the Send Signal module, or enter the
command Output-Via. This command takes three parameters: the
signal name, any signal parameters, and an optional channel.
2. Select or enter the name of the signal to send.
3. If the signal has parameters, set the values of the parameters in the
dialog that is opened. Select a parameter in the list, enter/edit its valJuly 2003
Telelogic Tau 4.5 User’s Manual
,um-st1
2207
Chapter
51
Simulating a System
ue using the input line, or the option menu containing possible values (for enumeration type parameters). Click the Default value button to get a “null” value for the parameter.
4. Select or enter the name of a channel to send the signal via. If no
channel is specified, any channel from the environment may be
used.
The Simulator tries to find a single process instance that can receive
the signal. If no or several possible receivers were found, an error
message is printed. If a single receiver was found, the signal is either
successfully sent (and placed in the input port of the receiver), or is
discarded (an immediate null transition occurred), i.e. the receiver
is in a state that cannot receive or save the specified signal.
Causing a Spontaneous Transition
To send a “none” signal to a process, i.e. to try to cause a spontaneous
transition in the process:
1. Click the Send None button in the Send Signal module, or enter the
command Output-None. This command takes one parameter: the
process name. If the process contains services, it is also necessary
to specify one of the services.
2. Select or enter the name of the process to send a “none” signal to. A
message is printed, indicating whether a spontaneous transition occurred.
2208
,um-st1
Telelogic Tau 4.5 User’s Manual
July 2003
Logging the Execution
Logging the Execution
The following types of interaction during simulation can be logged to
file:
•
The commands issued by the user.
•
The complete interaction with the user, i.e. commands issued and
resulting print-outs. In other words, all texts visible in the Simulator
UI’s text area or in the terminal window.
•
The signals sent to, from and via a unit in the system.
Note:
The logging of MSC events to file is described in “MSC Trace and
Logging” on page 2190.
Logging Commands
To start logging of all issued monitor commands from now on:
1. Select Start Command Log from the Log menu, or enter the command Command-Log-On. This command takes one parameter, the
name of the log file.
2. Select or enter a log file name; on UNIX preferably with the suffix
.com.
To stop the logging, select Stop Command Log from the Log menu, or
enter the command Command-Log-Off.
After logging has been stopped, it can be continued on the same log file,
i.e. the existing log file is appended, or on a new log file.
To continue logging of monitor commands:
•
July 2003
If using the Simulator UI’s menu commands, select Start Command
Log from the Log menu. Select or enter the same file name as before, or a new file name.
–
If a new file name was specified, the logging is continued on the
new file.
–
If the name of an existing log file was specified, a dialog is
opened:
Telelogic Tau 4.5 User’s Manual
,um-st1
2209
Chapter
51
Simulating a System
Figure 470: Continued logging on an existing file
Click Append to append the existing log file. Click Create to overwrite the existing log file.
•
If using monitor commands, enter the command
Command-Log-On, with or without a file name parameter.
–
If you do not specify any file name, the logging is continued on
the same lag file as before.
–
If a file name is specified, the logging is continued on this file.
All monitor commands issued by the user so far in the Simulator UI session can also be saved on a command file, without starting continuos
logging of commands. To do this, select Save from the popup menu on
the input line and select a command file.
A command log file may later be read in and executed to repeat the same
command session. To do this:
1. Choose Script in the Execute menu, or enter the command
Include-File. This command takes one parameter: the name of a file
containing monitor commands.
2. Select or enter the name of an existing command file. When the file
has been specified, it is read and the commands in the file are executed exactly as they are stated in the file.
Logging the User Interaction
Complete logging of all user interaction works in the same way as logging of monitor commands, described above. The only difference is the
name of the menu choices and commands. Either select Start Complete
Log and Stop Complete Log from the Log menu, or enter the commands
Log-On and Log-Off.
2210
,um-st1
Telelogic Tau 4.5 User’s Manual
July 2003
Logging the Execution
Logging Signal Interaction
The signals that are sent to, from or via a unit in the system can be
logged on file. The signal log file will contain a line for each signal sent,
including the simulation time, the name of the signal, the sender process
instance and the receiver process instance. Values of signal parameters
are also printed.
More than one signal log can be active at a time, each one in a separate
log file.
To start a signal log:
1. Enter the command Signal-Log (this command has no associated
button). This command takes two parameters: a unit in the system,
and the name of a log file.
2. Select or enter a unit whose signals are to be logged. A unit can be
one of the following:
–
A channel or signalroute. Signals sent through the channel or
signalroute are logged.
–
A process type or process instance. Signals sent to and from any
of the process instances are logged.
–
A block or a system. Signals sent within, to and from the system
or block are logged.
–
The process “env.” In this way, the signal interface between the
system and the environment is logged.
3. Select or enter a file name of the signal log file.
To list the active signal logs, enter the command List-Signal-Log (this
command has no associated button). The list contains an entry number,
the unit name and the log file name.
To stop a signal log:
1. Enter the command Close-Signal-Log (this command has no associated button). This command takes one parameter, an entry number
in the signal log list.
2. Enter an entry number. To see what entry number is associated with
the timer instance, list the active signal logs as described above. If
only one signal log is active, the entry number is not needed.
July 2003
Telelogic Tau 4.5 User’s Manual
,um-st1
2211
Chapter
51
Simulating a System
Modifying the System
The are a number of commands that change the behavior of the simulated system. These commands are useful to make debugging easier. They
can, for example, be used to recover from logical errors, or to put the
system in a state that could be difficult to achieve otherwise.
Caution!
When these commands are used, it is no longer the original system
that is simulated, as the commands modify the behavior of the system. It is completely up to the user to interpret the simulation and its
relation to the original system.
Some of these commands operate on the current process. For more information on the current process, see “Current Process and Scope” on
page 2196.
Sending an Internal Signal
To simulate the sending of an internal signal between two process instances:
1. Enter the command Output-Internal. This command takes the following parameters: the name of the signal, values of any signal parameters, receiver process instance, and sender process instance.
2. Select or enter the name of the signal to send.
3. If the signal has parameters, set the values of the parameters in the
dialog that is opened. Select a parameter in the list, enter/edit its value using the input line, or the option menu containing possible values (for enumeration type parameters). Click the Default value button to get a “null” value for the parameter.
4. Select or enter the receiver process instance. Note that “env” may
be entered for the environment process.
5. Select or enter the sender process instance. Note that “env” may be
entered for the environment process.
The signal is put in the input port of the receiver process, if it is in the
valid input signal set; otherwise, it is discarded. No checks are made
whether a path exists between the sender and the receiver.
2212
,um-st1
Telelogic Tau 4.5 User’s Manual
July 2003
Modifying the System
Changing the Process State
To change the state of the current process, service, or procedure:
1. Choose State in the Change menu, or enter the command Nextstate.
This command takes one parameter: the name of the new state.
2. Select or enter the name of the state to go to.
Creating and Stopping Processes
To create a new process instance:
1. Choose Create Process in the Change menu, or enter the command
Create. This command takes the following parameters: the process
to create, the parent process instance, and any process parameters.
2. Select or enter the name of the process to create a new instance for.
3. Select or enter the parent process instance. “env” may be entered for
the environment process, and “null” may also be entered.
4. If the process has parameters, enter the values of the parameters one
by one.
If the number of instances already is greater than or equal to the
maximum number for this process type, you have to verify the create action. The following message appears:
Attempt to create more than the max number of
concurrent instances.
Do you still want to create the instance :
5. Enter ‘y’ or ‘Y’ to create; all other answers cancels the create.
To stop a running process instance:
1. Choose Stop Process in the Change menu, or enter the command
Stop. This command takes one parameter, the process instance to
stop.
2. Select or enter the name of the process instance to stop.
July 2003
Telelogic Tau 4.5 User’s Manual
,um-st1
2213
Chapter
51
Simulating a System
Setting and Resetting Timers
To set a timer in the current process:
1. Choose Set Timer in the Change menu, or enter the command
Set-Timer. This command takes the following parameters: the name
of the timer, any timer parameters, and a time value.
2. Select or enter the name of a timer in the current process.
3. If the timer has parameters, enter the values of the parameters one
by one.
4. Enter a time value when the timer is to expire, either an absolute value (without sign) or a value relative to Now (with a ‘+’ sign). That
is, “7.5” is an absolute time value, whereas “+7.5” is the time value
Now+7.5.
To reset a timer in the current process:
1. Choose Reset Timer in the Change menu, or enter the command
Reset-Timer. This command takes the following parameters: the
name of the timer, and any timer parameters.
2. Select or enter the name of a timer in the current process.
3. If the timer has parameters, enter the values of the parameters one
by one.
Changing a Variable
To change the value of a variable in the current process:
1. Choose Variable in the Change menu, or enter the command
Assign-Value. This command takes the following parameters, the
name of the variable, an optional specification of a variable component, and the new value.
2. Select or enter the name of a variable, possibly abbreviated.
If a variable has several components (e.g. an array, struct or string)
and it is specified without a component, the values of all components of the variable have to be specified (e.g. the complete array).
2214
,um-st1
Telelogic Tau 4.5 User’s Manual
July 2003
Modifying the System
To assign a component only, the same rules as for examining a variable apply (see “Examining Variables” on page 2200):
–
To assign only a certain component, specify the component after the variable name. (In the Simulator UI, this must be done on
the text input line in the dialog, after a variable name has been
selected.)
–
To get a list of the possible components of a variable, enter a ‘?’
after the variable name. (In the Simulator UI, this must be done
on the text input line in the dialog, after a variable name has
been selected; another dialog is then opened, in which the component can be selected.)
More information on the input and output of SDL data types can be
found in “Input and Output of Data Types” on page 2069 in chapter
50, The SDL Simulator.
Changing the Input Port
To remove a signal instance in the input port of the current process:
1. Enter the command Remove-Signal-Instance. This command takes
one parameter, an entry number in the input port.
2. Enter an entry number. To see what entry number is associated with
the signal instance, list the input port as described in “Examining
Signal Instances” on page 2199.
Note:
Entry numbers are just positions in the input port. The removal of a
signal changes the entry numbers of the remaining signals.
To change the placing of a signal instance in the input port of the current
process:
1. Choose Input Port in the Change menu, or enter the command
Rearrange-Input-Port. This command takes two parameters, the
current and new entry number in the input port.
2. Enter the current entry number of the signal instance. To see what
entry number is associated with the signal instance, list the input
port as described in “Examining Signal Instances” on page 2199.
3. Enter the new entry number of the signal instance. The current signal instance at this position will be moved down in the queue.
July 2003
Telelogic Tau 4.5 User’s Manual
,um-st1
2215
Chapter
51
Simulating a System
Rearranging the Ready Queue
You can change the order of process instances in the ready queue, i.e.
the execution order of processes.
To change the placing of a process instance in the ready queue:
1. Choose Ready Q in the Change menu, or enter the command
Rearrange-Ready-Queue. This command takes two parameters, the
current and new entry number in the ready queue.
2. Enter the current entry number of the process instance. To see what
entry number is associated with the process instance, list the ready
queue as described in “Printing the Process Ready Queue” on page
2198.
3. Enter the new entry number of the process instance. The current
process instance at this position will be moved down in the queue.
Exiting a Simulator
To exit a simulator, choose Stop Sim in the Execute menu, or enter the
command Exit or Quit. If the command is abbreviated, you have to confirm the exit operation; the following message appears:
Do you really want to exit program :
Enter ‘y’ or ‘Y’ to exit; all other answers cancels the exit.
To exit the Simulator UI, select Exit from the File menu. If you have
changed the configuration of the Simulator UI, you are asked whether
to save these changes. See “Customizing the Simulator UI” on page
2181. If you save them under the default file names, they are read in and
restored the next time the Simulator UI is started.
2216
,um-st1
Telelogic Tau 4.5 User’s Manual
July 2003