1
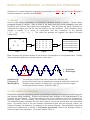
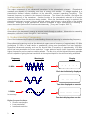
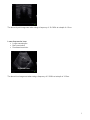
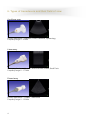
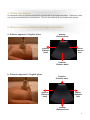
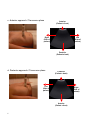
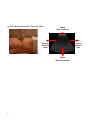
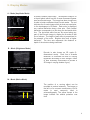
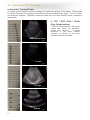
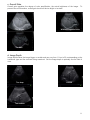
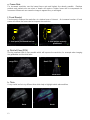
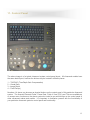
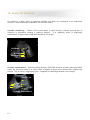
CONTENTS page 1-15 BASIC 2-DIMENSIONAL ULTRASOUND PRINCIPLES page 16 Multiple Choice Test Test Number cpd 41640 Tanya Reynolds (Nat. Dip. Diag. Rad., B. Tech. Diag. Rad., B. Tech. Ultrasound) Tanya is a qualified Diagnostic Radiographer and Sonographer. She studied at the University of Johannesburg (formally Wits Technikon). Her work experience includes stints in various hospitals including Johannesburg Hospital, Helen Joseph Hospital, Coronation Hospital and Chris Hani Baragwanath Hospital. . She is currently studying towards a Masters Degree in Ultrasound. 0 BASIC 2-DIMENSIONAL ULTRASOUND PRINCIPLES Ultrasound for medical diagnostic purposes was developed from SOund Navigation And Ranging in submarine detection, hence the word SONAR. 1. Sound Sound is the orderly transmission of mechanical vibrations through a medium. Sound cannot propagate through a vacuum. Gas as found in the bowel has poor sound propagation and solid structures such as bone have good sound propagation. Gas and bone are poorly visualized on ultrasound but organs such as the liver and kidneys are well visualized. Sound vibrations travel through a medium by a series of compression and then rarefaction of the particles (..|||||||……..||||||||…….|||||||||……||||||||….). The closer the particles are together the better the sound transmission. O O O O O O O O O O O O O Gas O O O O O O O O O O O O O O O O Liquid O O O O O OOOOOOOOOOOOOOOO OOOOOOOOOOOOOOOO OOOOOOOOOOOOOOOO OOOOOOOOOOOOOOOO OOOOOOOOOOOOOOOO Solid Most commonly the particles oscillate in the direction of propagation as a longitudinal wave. Plotting these oscillations against time usually produces a sine wave. 1 1 – Amplitude 2 – Wavelength 2 Amplitude (A) Frequency (f) Wavelength ()ּג The strength or height of the wave, measured in decibels (dB). Number of times the wave is repeated per second as measured in hertz (Hz). Distance a wave travels in a single cycle. As frequency becomes higher, wavelengths become shorter. (Sanders 1998: 2) 2. Pulse-Echo Ultrasound Pulse-echo ultrasound transducers operate by periodically sending short bursts of sound energy into the structure being examined. Echoes are produced when changes in the characteristics of the structure are encountered. When these echoes return to the transducer, they are converted into electrical signals. After processing, the information received forms an image of the studied area. The ultrasound system measures the time that it takes to receive the echoes after each transmitted pulse. By keeping track of the time between transmitted pulses and the returning echoes, the ultrasound system can determine the distance to the various reflectors. Most diagnostic ultrasound systems are calibrated for a velocity of 1540 meters per second, which is the average velocity of sound through human soft tissue. (Curry and Tempkin 1995: 4) 1 3. Piezoelectric Effect The major component of an ultrasound transducer is the piezoelectric element. Piezoelectric materials are capable of converting one form of energy into another. A voltage supplied to a piezoelectric element initiates vibrations at the element’s resonant (operating) frequency. The resonant frequency is related to the element’s thickness. The thinner the element, the higher the resonant frequency of the transducer. Another function of the piezoelectric element is to receive echoes that return from the structure being studied. When the mechanical energy is received, the piezoelectric element converts it into an electrical voltage, which forms a visual image of the studied structure. Although a single piezoelectric element is capable of either transmitting or receiving, it cannot be used to perform both functions simultaneously. (Curry and Tempkin 1995: 3) 4. Attenuation Attenuation is the decrease in energy as a wave travels through a medium. Attenuation is caused by absorption, reflection, beam divergence, and scattering. 5. Understanding Frequency One of the fundamental principles of understanding ultrasound scanning is understanding frequency. Deep ultrasound scanning such as the abdominal organs uses a frequency of approximately 3.5 MHz (sometimes 5.0 MHz in small adults or paediatrics) giving more penetration but less resolution. Superficial ultrasound scanning such as the thyroid uses a frequency of approximately 10.0 MHz which has less penetration but more resolution. Larger patients require lower frequencies whereas higher frequencies can be used on smaller patients. The aim is to use the highest frequency possible which is capable of giving the best resolution at the required depth for the structure being examined. Frequency Display Wavelength . 10 MHz . . . . . . . . Each dot individually displayed ___ ___ ___ ___ 5 MHz Two dots displayed as one dot 2.5 MHz ______ _______ _______ In summary: Four dots displayed as one dot Higher frequencies have: • Shorter wavelengths • Less penetration • Increased resolution 2 The above thyroid image was taken using a frequency of 10.0 MHz at a depth of 4.0 cm. Lower frequencies have: • Longer wavelengths • More penetration • Decreased resolution Right liver lobe The above liver image was taken using a frequency of 5.0 MHz at a depth of 16.0cm. Right liver lobe 3 6. Types of transducers and their field of view Curvilinear array Primary applications – Abdomen, Pelvis, Obstetrics, Gynaecology Frequency range 2 – 6 MHz Linear array Primary applications – Vascular, Musculoskeletal, Breast, Small Parts Frequency range 6 – 17 MHz Phased array Primary applications – Cardiac, Transcranial Frequency range 2 – 10 MHz 4 7. Probe orientation All transducers have a reference mark which corresponds to the image orientation. Reference marks can vary from manufacturer to manufacturer. This can be confirmed in your system user manual. 8. Basic scanning planes and image orientation a. Anterior approach / Sagittal plane Anterior (Patient’s front) Inferior (Patient’s feet) Superior (Patient’s head) Posterior (Patient’s back) b. Posterior approach / Sagittal plane Posterior (Patient’s back) Inferior (Patient’s feet) Superior (Patient’s head) Anterior (Patient’s front) 5 c. Anterior approach / Transverse plane Anterior (Patient’s front) Right (Side of patient) Left (Side of patient) Posterior (Patient’s back) d. Posterior approach / Transverse plane Posterior (Patient’s back) Left (Side of patient) Right (Side of patient) Anterior (Patient’s front) 6 e. Left lateral approach / Transverse plane Left (Side of patient) Posterior (Patient’s back) Anterior (Patient’s front) Medial (Patient’s midline) f. Similarly, a right lateral approach / transverse plane is shown below Right (Side of patient) Posterior (Patient’s back) Anterior (Patient’s front) Medial (Patient’s midline) 7 g. Left lateral approach / Coronal plane Lateral (Side of patient) Superior (Patient’s head) Inferior (Patient’s feet) Medial (Patient’s midline) 8 9. Display Modes A – Mode (Amplitude Mode) A-mode is seldom used today. The adjacent image is of a thyroid gland which has the A-mode activated together with the B-mode image. The image has been turned onto its side to better understand how A-mode works. The red indicates the A-mode image which is what was used prior to the development of B-mode. Each echo is displayed as a vertical deflection along a time axis. Each vertical deflection corresponds to a dot along the horizontal white line. The horizontal white line can be moved along any part of the B-mode image to display the A-mode at that line of echoes. The height of each echo is proportional to the strength of the echo. Brighter dots have a higher deflection. The time axis represents the distance or depth of the structure being examined. . B – Mode (Brightness Mode) B-mode is also known as 2D mode (2dimensional mode). Each line of A-Mode deflection is converted into dots of varying brightness according to their strength. Rows of dots eventually accumulate to provide a 2D image in varying shades of grey. Longitudinal section through thyroid lobe M – Mode (Motion Mode) The position of a moving object can be recorded at various instances. The image on the left is of a common carotid artery, but Mmode is most commonly used in echocardiography. The yellow arrows in the image indicate the arterial pulsation over time. 9 10. Optimizing the 2D Image a. Acoustic / Transmit Power The power control varies the amount of energy the transducer transmits to the patient. Power should be used at the lowest level possible whilst still producing acceptable image quality. This is for safety and resolution purposes. Paediatrics and small adults will use a lower acoustic power compared to larger adults. b. TGC / DGC (Time / Depth Gain Compensation) TGC/DGC compensates for the loss of energy that occurs by absorption, scatter and reflection. It shows structures of the same acoustic strength, as echoes of the same intensity whatever their depth. Within normal limits Too dark Too light Uneven 10 c. Overall Gain Overall gain regulates the degree of echo amplification, the actual brightness of the image. To prevent loss of information, overall gain should not be too bright or too dark. Too bright Within acceptable limits Too dark d. Image Depth Image depth makes the image bigger or smaller and can vary from 1.0 cm to 30 cm depending on the transducer type and the structure being examined. Set the image depth to optimally use the field of view. Too deep Correct Too shallow 11 e. Frame Rate For increased resolution use the lowest frame rate and highest line density possible. Restless patients and patients who are short of breath will require a higher frame rate to compensate for movement. Movement can cause the image to appear blurry or smudged. f. Focal Zone(s) Focal zone(s) enhance the resolution at a desired area of interest. An increased number of focal zones will reduce the frame rate but improve the resolution. 1 focal point positioned too low 4 focal points correctly positioned g. Field of View (FOV) Use the smallest field of view possible which will improve the resolution, for example when imaging the gallbladder and the fetal heart. Large FOV Small FOV Portal Vein h. Tints A very useful tool is to try different tints which help to highlight subtle abnormalities. Aorta 12 Aorta 11. Control Panel 1 2 3 4 The above image is of a typical ultrasound system control panel layout. All ultrasound models have the same basic layout, however the buttons may be located in different places. 1 – TGC/DGC (Time/Depth Gain Compensation) 2 – Overall Gain 3 – Image Depth 4 – Focal Zone(s) Numbers 1-4 above can be seen as physical buttons on the control panel of this particular ultrasound system. The Acoustic/Transmit Power, Frame Rate, Field of View (FOV) and Tints are available as on screen menu functions on the above system but could be an actual button on the control panel of other ultrasound makes and models. It is important to familiarise yourself with the functionality of your particular ultrasound system’s control panel and functionality. 13 12. Useful 2D Artifacts An artifact is a detail which is produced artificially and does not correspond to an anatomical structure. Most artifacts are undesirable, but some are useful. Acoustic shadowing – Failure of the sound beam to pass through a dense structure due to reflection or absorption causing a posterior shadow. It is especially useful in diagnosing calcifications. It appears as a black/dark shadow on the image. Gallstone s Acoustic Shadowing Acoustic enhancement – Sound travelling through a fluid-filled structure is barely attenuated which cause the structures distal to a cystic lesion to appear to have more echoes than neighbouring echoes. This is useful in diagnosing cysts. It appears as a white/light shadow on the image. Simple Cyst Acoustic Enhancement 14 13. References CHUDLEIGH, P & Pearce JM 1997: Obstetric ultrasound. 2nd ed. UK: Churchill Livingstone CURRY, RA & Tempkin BB 1995: Ultrasonography: an introduction to normal structure and functional anatomy. WB Saunders Company SANDERS, RC 1998: Clinical sonography. 3rd ed. USA: Lippencott-Raven TEMPKIN, BB 1999: Ultrasound scanning: principles and protocols. 2nd ed. USA: WB Saunders Company THRUSH, A & Hartshorne T 2005: Peripheral vascular ultrasound: how, why and when. 2nd ed. Elsevier Churchill Livingstone Curvilinear, Linear and Phased Array Transducer images courtesy Siemens Medical. CW image, Acoustic Shadowing image and Acoustic Enhancement image courtesy Siemens Medical. Remaining images acquired using Siemens ultrasound units. 15 14. Multiple Choice Test To answer your test: Step 1) Your answer SMS will look like this: Enter your answer for each question here c p d 4 1 6 4 0 1 2 3 4 5 6 7 8 9 10 11 12 ^ ^ space space Step 2) Send the SMS to 42030 Important: Your cellular phone must first be registered on CPD Solutions in order to answer the test. See the attached e mail instructions or visit: www.karenbezuidenhout.co.za >> CPD Services >> CPD Articles for a copy of the instructions 1) Which transducer would you use to perform a thyroid examination? a) Phased array b) Linear array c) Curvilinear array d) Low frequency 2) Lower frame rates can be used in: a) Restless patients b) Co-operative patients c) Patients who are short of breath d) All of the above 3) Which statement is correct? a) Shorter wavelengths have higher resolution b) Longer wavelengths have less resolution c) 10 MHz has a shorter wavelength than 5.0 MHz d) All of the above 4) Which of the following is not an artifact? a) Acoustic shadowing b) Acoustic enhancement c) Aliasing d) Image invert 16 5) Adding focal zones to your image will a) Increase the frame rate and improve the resolution b) Reduce the frame rate and improve the resolution c) Increase the frame rate and reduce the resolution d) Reduce the frame rate and reduce the resolution 6) The average velocity of sound through human soft tissue is a) 1540 meters per minute b) 3000 meters per second c) 120 kilometers per hour d) None of the above 7) Sound cannot propagate through a) A solid b) A vacuum c) Liquid d) The liver 8) Frequency is measured in a) Hertz b) Decibels c) Frames per second d) Meters per second 9) Attenuation is the increase in energy as a wave travels through a medium a) True b) False c) It’s the decrease in energy d) b and c 10) The frequency required to do an adult abdominal ultrasound scan would be a) 10 MHz b) 3.5 MHz c) 2 MHz d) 7.5 MHz 11) M Mode is most commonly used in a) Pediatrics b) Echocardiography c) Urology d) All of the above 12) The acoustic/transmit power of an ultrasound platform should be set at a) The highest possible level b) The lowest possible level c) It does not matter what level it is set at d) None of the above 17