1
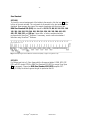
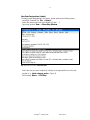
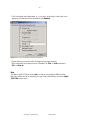
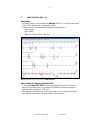
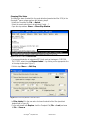
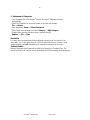
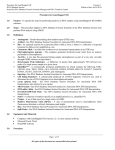
Biotype® Template Files for Genotyper® Software
Introduction
Biotype® Template Files are software sets (macros) for the Genotyper® Software in
order to simplify the analysis of GeneScan® data. Biotype® Template Files may be
used with ABI PRISM® single- and multi capillary instruments of Applied Biosystems.
Genotyper® Software with Biotype® Template Files assign the analyzed DNA
fragments relative to their length to the allele designation of the STR loci. Optionally,
the corresponding fragments length of peaks in base pairs or peak height in relative
fluorescent units (RFU) can be indicated. These data (genotypes) can be tabulated
and exported.
Biotype® Template Files are available for all STR-Kits:
- From Genotyper® Version 2.5 (Macintosh®)
- From Genotyper® Version 3.7 (Windows®)
Note
Both Genotyper and GeneScan Software applications from Applied Biosystems are
scheduled for discontinuation and will be unavailable for purchase as of June 1,
2004. Applied Biosystems have provided support, ending June 1, 2009.
The following documentation shows the analysis of PCR products of the Mentype®
Nonaplex I (6-FAM/HEX/NED) PCR Amplification Kit using the ABI PRISM® 310
Genetic Analyzer and Biotype’s DNA size standard 550 (ROX) consistently. Analyses
were performed with Genotyper® Software version 3.7 for Windows® and the
Mentype® Nonaplex I Template File.
For general introductions of the software, please read the Genotyper ® Software
User’s Manual.
Ordering Information
Biotype® Template Files
for Macintosh® and Windows®
CD-ROM
Cat. No. 49-10900-0000
-2-
Contents
1
Setup on the Analysis Computer................................................................3
2
Calibration using Allelic Ladders ................................................................3
3
Evaluation of Analysis Data .......................................................................4
4
Macros for Biotype® PCR Amplification Kits................................................5
A.
Calibrate Ladder (Ctrl + 0)...................................................................7
B.
Label 20% Filter/incl. bp/incl. peak height (Ctrl + 1/2/3) .......................8
C.
Label 10% Filter (Ctrl + 4).................................................................11
D.
Blue/Green/Yellow Panels (Ctrl + 5/6/7).............................................13
E.
Horizontal Table for 2 Alleles (Ctrl + 8)...............................................14
F.
Vertical Table for 10 Alleles (Ctrl + 9).................................................15
G.
Calculate Category Offsets ................................................................15
5
Adjustment of Categories........................................................................16
6
Troubleshooting Guide ............................................................................17
Genotyper® Template Files
March 2010
-3-
1 Setup on the Analysis Computer
Biotype® Template Files for Genotyper® Software are available as free downloads
from our homepage www.biotype.de or as CD-ROM on request. Before using the
Genotyper® Software for the first time, Biotype® Template Files have to be saved
inside a folder to the local analysis computer (Windows® or Macintosh®).
e. g. for Mentype® Nonaplex I
Mentype_Nonaplex I_v3c (or current version)
For Macintosh® computers please use the CD-ROM in order to avoid nonconformities during conversion.
2 Calibration using Allelic Ladders
Workings with the Genotyper® Software are done with related analysis data, i.e.
analyzed DNA samples with allelic ladders as gta-file. To analyse DNA samples with
the Genotyper® Software, calibration with a current run of the allelic ladder has to be
done. The allelic ladder of the used test kit should be analysed at the beginning and
the end of the DNA samples. For calibration the measured allele sizes are
transferred automatically to the expected sizes within the categories of the Template
File. In general, calibration bases on one current run of the allelic ladder.
Calibration using Multi-Capillary Analysers
To ensure a reliable allelic assignment on multi-capillary analysers, a number of
allelic ladders should be run on different capillaries.
The room temperature might influence the running performance of PCR products
that might result in split peaks especially at low temperatures or an altered run
velocity of DNA fragments. Please pay attention to keep conditions recommended by
the instrument manufacturer.
System Parameters
Different analysis instruments, DNA size standards or polymers might result in
different fragment lengths. Thus, DNA samples and allelic ladders from one sample
set should be analysed using the same system parameters.
Genotyper® Template Files
March 2010
-4-
3 Evaluation of Analysis Data
- Open Template File of the Biotype® test kit, Genotyper® Software will open
automatically
- Import data: File → Import → From GeneScan File
- Select GeneScan® Analysis Data Files: Add Sample Files → Add → Finish
- Data Files appear at the top of the window.
- To import, choose dye colours of the Biotype® test kit and the red colour for the
DNA size standard (e. g. B, Y, G, R):
Edit → Set Preferences → Import Colours
- To run macro, mark the appropriate macro or double click the macro (bottom left
of the main window): Macro → Run Macro
Note
Before analysing data, always run macro Calibrate Ladder first (see chapter 4A).
General Procedure for Analysis
1. Check Size Standard
2. Check Allelic Ladder
3. Check Positive Control
4. Check Negative Control
5. Review Sample Data
Genotyper® Template Files
March 2010
-5-
4 Macros for Biotype® PCR Amplification Kits
A.
B.
C.
D.
E.
F.
G.
Calibrate Ladder
Label 20% Filter
Label 20% Filter incl. bp
Label 20% Filter incl. peak height
Label 10% Filter
Blue Panels
Green Panels
Yellow Panels
Horizontal Table for 2 Alleles
Vertical Table for 10 Alleles
Calculate Category Offsets
Strg + 0
Strg + 1
Strg + 2
Strg + 3
Strg + 4
Strg + 5
Strg + 6
Strg + 7
Strg + 8
Strg + 9
Macro Calibrate Ladder always needs to be executed whereas the use of additional
macros is facultative.
Genotyper® Template Files
March 2010
-6-
Size Standard
SST-ROX
To check the correct assignment of the labels to the sample, click the icon R at the
left top of the main window. The red panels of all samples in the plot window will be
displayed. Now compare the sizes of the sample fragments with the sizes of the
DNA Size Standard 550 (ROX) that should be 50, 60, 70, 80, 90, 100, 120, 140,
160, 180, 190, 200, 220, 240, 260, 280, 300, 320, 340, 360, 380, 400, 425,
450, 475, 500, 525, and 550 bp. If sizes differ, a further analysis should be
performed with GeneScan® Software. If necessary, create a new size standard
definition using GeneScan® Software.
Fig. 1 Electropherogram of the DNA size standard 550 (ROX), Lengths of Fragments in bp
SST-BTO
For Biotype test kits in 5 Color Assay with the fluorescent labels 6-FAM, BTG, BTY,
BTR, and BT0 (matrix BT5) the DNA Size Standard 550 (BTO) in orange Panel (icon
O is necessary. Please use DNA Size Standard 550 (BTO) template SSTBTO_60-500bp to define fragment length for particular test kit.
Genotyper® Template Files
March 2010
-7-
A.
Calibrate Ladder (Ctrl + 0)
Description
- To calibrate the Template File with a current allelic ladder
- If Template File will be saved, the generated calibration may be used for DNA
sample data based on this allelic ladder
- After calibration the macro Label 20% Filter will run automatically
Identification of the Allelic Ladder
All colours of the imported allelic ladder have to be defined as ladder in the
Dye/Lanes window (Views → Show Dye/Lanes Window). Therefore, add the
term “ladder” to every colour in the text field Sample Info.
Fig. 2 Add the Term “ladder” to every Colour in the Text Field Sample Info
Note
Peaks in the allelic range which are not identified by the GeneScan® Software can
not be labelled by the GeneScan® Software!
Controls
In order to check allele designations please compare the alleles of the allelic ladder
and Control DNA of the test kit with data of the latest user’s manual.
Genotyper® Template Files
March 2010
-8-
B.
Label 20% Filter/incl. bp/incl. peak height (Ctrl + 1/2/3)
Description
- To analyze samples of one DNA, unsuitable for DNA mixtures
- Macro Label 20% Filter: Peaks are indicated with their allele designation
- Macro Label 20% Filter incl. bp: Peaks are indicated with their allele designation
and their sizes in base pairs
- Macro Label 20% Filter incl. peak height: Peaks are indicated with their allele
designation and their peak height in relative fluorescent units (RFU)
- A plot window will open up automatically with the following entries:
DNA samples
allelic ladder
DNA size standard (ROX), if imported
Fig. 3 Plot Window after Execution of Macro Label 20% Filter
Labelling of all relevant Peaks
- Peak designations below 20% of the height of the highest peak of the category
(STR loci) are not shown in the macro Label 20% Filter. For changing the
preselected 20% filter of the macro see Changing Filter Value (p. 12)
- Filter options are integrated in order to avoid stutter peaks and templateindependent nucleotide addition (minusA peaks)
- Peaks in the allelic range labelled with “allele?” can not be assigned to an allele
size. These labels have to be checked manually and may be deleted by clicking on
(see Troubleshooting on page 18). If necessary, scale down the window
Genotyper® Template Files
March 2010
-9-
New Peak Designations (Labels)
To change peak designations in the macro, please perform the following steps:
- Unlock the Template File: File → Unlock
- Select the macro which has to be adjusted (“Label …“)
- Open step window: View → Show Step Window
Fig. 4 Step Window of Macro Label 20% Filter
- Select the step you want to adjust by clicking on the appropriate line in the step
window (e. g. Label category peaks... Figure 4)
- Edit this step: Macro → Edit Step
Genotyper® Template Files
March 2010
- 10 -
- Click the desired peak designation (e. g. size in bp, peak height, peak area) in the
appearing window and fix the adjustment with Replace
Fig. 5 Window in the Step Window to edit Peak Designations
- Repeat the same procedure with all categories you want to adjust
- After performing the changes lock the Template File (File → Lock) and save it:
File → Save as
Note
The Macro Label 20% filter should not be used for the analysis of DNA mixtures.
New filter options has to be defined by the user itself. Alternatively, the macro Label
10% Filter can be used.
Genotyper® Template Files
March 2010
- 11 -
C.
Label 10% Filter (Ctrl + 4)
Description
- To analyze stains or mixed samples of different DNAs, e .g. for forensic case work
- Peaks will be labelled with the appropriate allele
- A plot window will open automatically with the following entries:
DNA samples
allelic ladder
DNA size standard (ROX), if imported
Fig. 6 Plot Window after Execution of Macro Label 10% Filter
Basic Setting for improved Peak Detection
- In the macro Label 10% Filter all peak designations higher than 10% of peak
height of the highest peak in this category are labelled to achieve an improved
peak detection (preselected: 10% filter)
- Filter options are already integrated in the macros in order to avoid stutter peaks
and template-independent nucleotide addition (minusA peaks)
Genotyper® Template Files
March 2010
- 12 -
Changing Filter Value
To change the lower threshold for the peak detection (preselection filter 20%) in the
Genotyper® macro, please perform the following steps:
- Unlock the Template File: File → Unlock
- Select the macro which has to be adjusted (“Label…“)
- Open the step window: Views → Show Step Window
▼ Threshold Peak Detection (Filter Value: 20%)
Fig. 7 Step Window of Macro Label 20% Filter
- For improved detection of categories (STR-Loci) such as Amelogenin, D3S1358,
TH01, SE33, select the step Remove Labels… by clicking on the appropriate line
in the step window (see Figure 7)
- Edit this step: Macro → Edit Step
Fig. 8 Window in the Step Window to edit Filter Values
- In Filter Labels fill in the new value for lower threshold of the filter (see black
shaded field in Figure 8)
- Fix the adjustment with Replace, lock the Template File (File → Lock) and save
it: File → Save as
Genotyper® Template Files
March 2010
- 13 -
D.
Blue/Green/Yellow Panels (Ctrl + 5/6/7)
Description
- To compare samples with the appropriate allelic ladder
- Shows the labels generated with macro “Label…“ (see chapter B+C)
- To simplify allocation, zoom up the appropriate area:
Views → Zoom → Zoom To (e. g. 150 to 190 bp)
Fig. 9 Plot Window after Execution of the Macro Blue Panels with allelic ladder and DNA Sample
Show Categories (STR-Loci)
To display all categories (STR loci) in the panel of one colour, set a tick at the check
box Category boundaries (Views → Plot Options → Plot Window, Upper
Panel and Plot Window, Lower Panel). In Plot Window, Upper Panel the allelic
ladder fixes at the top of the window. In Plot Window, Lower Panel the DNA
samples are shown at the bottom of the window. If different colours of the panels
are displayed one below the other, the Genotyper® Software is not able to indicate
categories such as Amelogenin, D3S1358, TH01, SE33,… any more.
Genotyper® Template Files
March 2010
- 14 -
E.
Horizontal Table for 2 Alleles (Ctrl + 8)
Description
- To analyze samples of one DNA, e. g. for a DNA-database
- Generates a table after the macro “Label…” has been performed
- Displays the allele designation of up to two peaks per category (STR locus) for each
sample in one line
- For genetical homozygote peaks the allele designation will be displayed twice (with
exception of X- and Y-chromosomal test kits)
- To discriminate between individual samples the field Sample Info of each sample
colour has to be filled in with an appropriate description:
Views → Show Dye/Lanes Window
- Use Table → Update Table to take over the current allele designation of the
peaks to the table. Misnomers resulting from pull-up peaks between different
panels can be deleted manually by clicking onto.
Fig. 10 Output File after Execution of the Macro Horizontal Table for 2 Alleles
Table Export
To export the table to Microsoft® Excel®, please perform the following steps:
- Table → Export to File (save with extension “xls“)
- Open Excel® software and load table
- open Excel® software, load table, and follow the conversion procedure up to step 3:
Step 3
Click Button → „Advanced“
Decimal separator → . (dot)
Thousands separator → (space)
Genotyper® Template Files
March 2010
- 15 -
F.
Vertical Table for 10 Alleles (Ctrl + 9)
Description
- To analyze stains or mixed samples of different DNAs
- Generates a table after the macro “Label…” has been performed
- Shows the allele designation of up to ten alleles in each category (STR locus) and
generates a vertical table. The categories are listed in one line, e. g. Nonaplex I: all
categories x 10 alleles
- In Sample Info the File Name (name of the sample) is displayed automatically
- For genetical homozygote peaks of a category the allele designation will be
displayed twice (with exception of X- and Y-chromosomal test kits)
- Use Table → Update Table to take over the current allele designation of the
peaks to the table. Misnomers resulting from pull-up peaks between different
panels can be deleted manually by clicking onto.
Fig. 11 Output File after Execution of the Macro Vertical Table for 10 Alleles
G.
Calculate Category Offsets
Macros for calibration of individual categories. They are used to “Calibrate Ladder“
and should not be implemented separately.
Genotyper® Template Files
March 2010
- 16 -
5 Adjustment of Categories
- Open Template File of the Biotype® test kit, Genotyper® Software will open
automatically
- Unlock the Template File (see lock symbol at the lower left sidebar):
File → Unlock
- Open categories: Views → Show Categories
- Select allele to be adjusted from table: Category → Edit Category
- Change allele features (tolerance range, fragment length):
Replace → File → Save
Annotation
For newly found (intermediate) alleles additional categories can be created in the
same way. Here, a tolerance range of ±0.45 bp should be chosen. However, these
added categories are not evaluated by the automatic calibration of the macro
Calibrate Ladder.
Biotype Diagnostic GmbH assumes no liability for changing of Template Files. The
actual versions for all test kits can be downloaded from the homepage www.biotype.de.
Genotyper® Template Files
March 2010
- 17 -
6 Troubleshooting Guide
Observation
Possible Cause
Comments
Error message during program
start “Could not start the
application because there is not
enough memory.”
Both Genotyper and GeneScan
Software applications have been
scheduled for discontinuance
and will be unavailable for
purchase as of June 1st, 2004.
Applied Biosystems stopped
support for these software
applications in June 2009.
Use appropriate windows
computer. Maybe a computer
with less than 1 GB memory
works with Genotyper software.
The template file cannot be
opened.
The Genotyper® Software has
not the Macintosh® version 2.5
or not the Windows® version
3.7.
Upgrade the Genotyper®
Software (The old Macintosh®
Version 2.1 can be updated to
Version 2.5 by free download
from the homepage
www.appliedbiosystems.com).
Genotyper® Software was not
installed on the local computer.
Install Genotyper® Software on
the local Computer.
Template Files or the CD-ROM
were damaged.
Download the files from the
homepage www.biotype.de
again or order the CD-ROM
again.
An additional signal can be
identified as peak of the allelic
ladder because of dysfunctions
during the electrophoresis. If
peaks of the allelic ladder are
miscalled, the ladder can not be
used for the analysis.
Use a different injection of the
allelic ladder. The analysed
fragments of the internal size
standard (in bp) of the allelic
ladder file should be examined
first.
One peak of the allelic ladder is
smaller than the peak detection
value (50-200 RFU) of the
GeneScan® Analysis parameter
used and is not identified as a
peak.
A larger quantity of the allelic
ladder has to be loaded again to
the instrument.
Alternatively, the allelic ladder
file can be analysed again with
a smaller peak detection value
in the GeneScan® Software.
One peak of the allelic ladder
was not identified, because the
size is not in the range (in bp)
expected by the software.
First compare the length of
fragments (in bp) of the first
allele in one colour of the allelic
ladder with the corresponding
value in the categories, then of
the other alleles.
Deviant fragment lengths
because of unsuitable size
standard.
Always use the internal DNA
size standard 550 for Biotype®
test kits.
Error message during analysis
“Could not complete your
request because the labeled
peak could not be found.”
Genotyper® Template Files
March 2010
- 18 -
Observation
Possible Cause
Comments
Error message during analysis
“Could not complete your
request because no dye/lanes
are selected.”
The allelic ladder file was not loaded.
Import the file with the allelic ladder.
The allelic ladder file was not
identified.
For every colour of the allelic ladder the
term “ladder” has to be listed in
Views → Show Dye/lanes Window
in the text field Sample Info.
Not all four dye colours (blue, green,
yellow, red) have been imported.
Choose all dye colours via Edit → Set
Preferences - Import Colours and
import them once again.
Bubbles in the capillary lead to pullup peaks in all colour panels
(„spikes”) that result in allele
misnomer.
Repeat electrophoresis to confirm
results.
Too high intensities at the analysis
instrument. If the peak heights of the
samples are outside the linear
detection range (>4000
RFU/ABI310; >5000 RFU/ABI3130),
stutters, split peaks, and artefacts
might be increased.
Reduce the injection time up to
1 second, reduce the amount of the
PCR amplification product for analysis,
or reduce the quantity of DNA for PCR.
The DNA size standard 550 (ROX or
BTO) was not defined or was
identified incorrectly.
Click on icon R for ROX or O for
BTO in the left upper corner of the
Genotyper software and display the red
or orange fragments of all samples in
the Plot Window.
Data from different analysers like ABI
310 and ABI 3130 have been saved
within one gta-file.
Data from different analysers always
have to be saved within different gtafiles.
The point alleles were not separated
in the GeneScan® analysis.
Check the settings of the GeneScan®
analysis parameters. Change the value
of the Peak Window Size to 11 pts
and save! Then, analyse the DNA
samples with the new parameters
again.
There are many peaks of the
sample termed allele?
Point alleles, i.e. alleles with at
least 1 bp difference to the next
integer allele (e. g. TH01
9.3/10), are not found.
Trademarks
Mentype® is a trademark of Biotype Diagnostic GmbH.
6-FAM, HEX, NED, ROX, ABI PRISM®, GeneScan®, Genotyper®, and Applied Biosystems are trademarks of
Life Technologies.
Macintosh® is a trademark of Apple Computers, Inc.
Windows® and Excel® are trademarks of Microsoft Corporation.
Genotyper® Template Files
March 2010