1
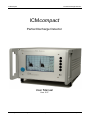
ICMcompact
Partial Discharge Detector
ICMcompact
Partial Discharge Detector
User Manual
Vers. 2.07
Power Diagnostix · Brüsseler Ring 95a · 52074 Aachen · Germany · Phone +49 241 74927 · Fax +49 241 79521 · www.pdix.com
ICMcompact
2
Partial Discharge Detector
Contents
I
General.....................................................................................................................................................4
I.1
About this Manual .............................................................................................................................. 4
I.2
Instrument Safety............................................................................................................................... 4
I.3
Principle of Operation ........................................................................................................................ 5
II
Installation ...............................................................................................................................................6
II.1
The Acquisition Unit........................................................................................................................... 6
II.1.1
Optional Functions for the ICMcompact ..................................................................................... 8
II.1.2
Connections................................................................................................................................ 9
III
Operation ...............................................................................................................................................12
III.1
Main Functions ................................................................................................................................. 12
III.1.1
Scope........................................................................................................................................ 13
III.1.2
Meter......................................................................................................................................... 15
III.2
Key Menus ....................................................................................................................................... 16
III.2.1
Overview................................................................................................................................... 16
III.2.2
Optional Key Menus ................................................................................................................. 17
III.2.3
Key Menus Description............................................................................................................. 18
III.3
Optional Functions........................................................................................................................... 28
III.3.1
HVM - High Voltage Meter Display (optional) .......................................................................... 28
III.3.2
VLF - Very Low Frequency....................................................................................................... 30
III.3.3
DSO - Digital Storage Oscilloscope (optional) ......................................................................... 32
III.3.4
MUX - Channel Multiplexer (optional) ...................................................................................... 50
III.3.5
AUX - Auxiliary Inputs (optional) .............................................................................................. 51
III.3.6
STP - Additional Setups (optional) .......................................................................................... 51
III.3.7
LOG - Logarithmic amplifier (optional) ..................................................................................... 52
III.4
Calibration........................................................................................................................................ 53
III.4.1
Calibration Impulse Generator ................................................................................................. 53
III.4.2
Calibration test set up............................................................................................................... 54
III.4.3
Calibration menu ...................................................................................................................... 55
III.5
Noise Reduction .............................................................................................................................. 56
III.5.1
LLD noise ground (Low-Level Discriminator) ........................................................................... 56
III.5.2
Window Mask (Software).......................................................................................................... 57
III.5.3
External Signal Gating (TTL Gating, optional) ......................................................................... 57
III.5.4
Gating With External Sensor (Optional, Analog Gating) .......................................................... 58
IV
The ICMcompact Software (overview) ................................................................................................60
V
Standard Software ICMcompact ......................................................................................................... 60
Power Diagnostix · Brüsseler Ring 95a · 52074 Aachen · Germany · Phone +49 241 74927 · Fax +49 241 79521 · www.pdix.com
ICMcompact
Partial Discharge Detector
3
VI
Extended Software 'ICMcompact' with cable fault location ............................................................. 61
VII
Specialized Software HVpilot (optional) .......................................................................................... 62
VIII Miscellaneous .......................................................................................................................................65
VIII.1
Maintenance................................................................................................................................. 65
VIII.2
Shipment Instructions................................................................................................................... 65
VIII.3
Declaration of Conformity............................................................................................................. 66
IX
FAQ (Troubleshooting).........................................................................................................................67
X
Technical Data of the ICMcompact (standard)...................................................................................68
X.1
ICMcompact with 'HVM' (integrated voltage measurement) ........................................................... 69
X.2
ICMcompact with DSO (digital signal processor) ............................................................................ 70
XI
INDEX .....................................................................................................................................................71
Copyright 2007 by Power Diagnostix. All rights reserved. No part of the content of this manual may be
reproduced or transmitted in any form or by any other means without the written permission of the publisher. Product and company names herein may be the trademarks of their respective owners.
Power Diagnostix · Brüsseler Ring 95a · 52074 Aachen · Germany · Phone +49 241 74927 · Fax +49 241 79521 · www.pdix.com
ICMcompact
4
I
I.1
Partial Discharge Detector
General
About this Manual
This manual describes the hardware, software and usage of the ICMcompact in its current version. Some of
the hardware features of the most recent versions are not available with earlier versions of the instrument.
It is possible to upgrade most of the previous instruments to the features of the current instruments. Please
contact Power Diagnostix for details.
Software updates are available through Power Diagnostix's web site (www.pdix.com). The access to the
download area of that Web Site is password protected and requires a valid software maintenance contract.
Contact Power Diagnostix for details. Revisions of this manual and current brochures are available for
download (Adobes PDF-Format) through that Web Site as well.
This manual describes the ICMcompact including its miscellaneous functions. These functions have to be
ordered separately and are marked as optional functions. For information regarding the accessories and
special applications of the ICMcompact please contact Power Diagnostix
I.2
Instrument Safety
Before using the ICMcompact, read the following safety information and this manual carefully. Especially
read and obey the information, which are marked with the words 'Warning' and 'Caution'. The word 'Warning' is reserved for conditions and actions that pose hazards to the user, while the word 'Caution' is reserved for conditions and actions that may damage the instrument, or its accessories, or that may lead to
malfunction.
Always obey the safety rules given with the warnings and with this chapter. Especially take care of the
safety issues while performing field measurements. Never disregard safety considerations even under time
constraints found often with on-line and off-line test on site.
!
Warning:
• Always provide solid grounding of the instrument and the coupling units. Use the rear side
wing nut terminal for ground connection (System Ground see II.1.2) Never operate the instrument without protective grounding.
• Use isolation techniques, such as isolation transformers or fiber optic isolation to avoid hazard and injury. With applications bearing a high risk of electrical shock or breakdown use fiber optic isolation in general.
• Avoid working alone.
• Do not allow the instrument to be used if it is damage, or its safety is impaired.
• Inspect the ground leads and signal cables for continuity.
• Select the proper coupling circuit and connection for your application.
• Do not use the instrument in condensing or explosion endangered environment.
Power Diagnostix · Brüsseler Ring 95a · 52074 Aachen · Germany · Phone +49 241 74927 · Fax +49 241 79521 · www.pdix.com
ICMcompact
I.3
Partial Discharge Detector
5
Principle of Operation
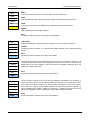
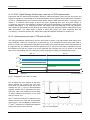
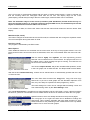
The ICMcompact partial discharge detector is designed for quality assurance and quality control tests of high,
medium and low voltage insulation in a test laboratory environment. The instrument may be adapted to non
conventional testing tasks such as field testing and diagnostics by use of various preamplifier and couplers.
The standard set (Fig.1, red marked) of the ICMcompact consists of a coupling unit CIL4L, a preamplifier
RPA1 and the instrument.
The ICMcompact partial discharge detector is an autonomous instrument. Simple screen shots and storage of
results can be done by means of the optional serial interface and a PC program. A precise evaluation of the
measurements is possible using databases, specific knowledge bases or getting in contact with Power
Diagnostix' people. For tasks requiring extended computer control, protocol functions and data manipulation
we recommend the ICMsystem.
PD Signal
Coupling Unit:
- capacitor + CIL4L
- CC20B
- CC25C/V
- CC100
- CT1
- CT100
- ...
Database:
- Software evaluation
- Data files
- MS Excel
- ...
Test Object:
- Bushing
- Cable
- Switchgear
- Capacitor
- GIS
- Transformer
- Motor
- Generator
- ...
PD Instrument:
- ICMcompact
- ICMmonitor
- ICMsystem
Preamplifier:
- RPA1
- RPA2, RPA2B
- RPA3
- RPA4
- RPA5
- RPA6c (log)
Knowledge Base:
- experts
- meetings
- papers
- reports
PD Support:
- Power Diagnostix
- Agents worldwide
Fig. 1: Principle PD Measurement
The ICMcompact is easy to use. The operator can choose between several display modes of the integrated
LCD screen, e.g. meter display, scope display or partial discharge pattern display. All instrument settings
including calibration are done via the on-screen menus by pushing the five buttons on the right side of the
instrument. These settings are automatically stored in a non volatile memory when the system is shut
down. The following section describes the use of the ICMcompact PD detector.
Power Diagnostix · Brüsseler Ring 95a · 52074 Aachen · Germany · Phone +49 241 74927 · Fax +49 241 79521 · www.pdix.com
ICMcompact
6
II
II.1
Partial Discharge Detector
Installation
The Acquisition Unit
The standard ICMcompact package includes the partial discharge detector, the remote controlled preamplifier
and the standard coupling unit CIL4L. All PD detectors of Power Diagnostix’ are build on a modular concept.
Therefor it is possible to vary all external accessory parts like i.e. coupling units, preamplifiers or calibration
impulse generators. For more details about all accessories please contact Power Diagnostix. It depends on
each application, what kind of combination for coupling unit and preamplifier will bring best results.
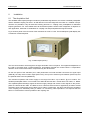
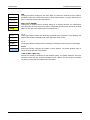
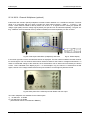
Fig. 2 shows a photo of the front view of the instrument in a half 19” rack. The backlit liquid crystal display has
a resolution of 240x128 pixels.
Fig. 2: ICMcompact (Photo)
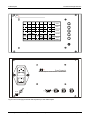
The five control buttons are arranged to the right hand side of the LCD panel. The brightness adjustment of
the LCD is accessed using a small screwdriver, immediately beneath the control buttons. A temperature
deviation of the environment will be compensated by the device itself.
On the rear panel of the standard (19½" wide) instrument are found the BNC connectors for signal input
(AMP IN), the strip chart recorder output (REC OUT), the input for external synchronization (SYNC IN) and
the optional serial connector (REMOTE).
The instrument operates with mains supply in the range from 85VAC up to 264VAC @ 47 to 440Hz. The
standard preamplifier RPA1 is connected to the AMP IN terminal with a normal 50Ω coax cable, i.e. RG58.
The amplified partial discharge signals as well as supply voltage and remote control signals to the preamplifier are carried via this cable. The RPA1 acts as a 50Ω line driver and thus significantly increases overall
sensitivity when working with longer cables (up to 200m). Furthermore, the RPA1 enhances the sensitivity
of the coupling unit, essentially acting to match it to connecting cable impedance. This requires that the
RPA1 be connected as close as possible to the coupling unit.
Power Diagnostix · Brüsseler Ring 95a · 52074 Aachen · Germany · Phone +49 241 74927 · Fax +49 241 79521 · www.pdix.com
ICMcompact
Partial Discharge Detector
7
PD
GAIN+
GAIN-
MODE
METER
SETUP
50.0 Hz
25.00 pC / DIV
Qp<= 12.50pC
MAIN
Power Diagnostix
Bruesseler Ring 95a D-52074 Aachen +49 241 74927
S/N:000
REMOTE
SYNC IN
REC OUT
AMP IN
Fig.3: Front Panel (top) and Rear Panel (bottom) of the ICMcompact
Power Diagnostix · Brüsseler Ring 95a · 52074 Aachen · Germany · Phone +49 241 74927 · Fax +49 241 79521 · www.pdix.com
ICMcompact
8
Partial Discharge Detector
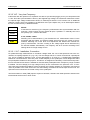
The CIL4L standard coupling unit is a so-called RL coupling unit (inductance-resistance), which is tuned to
coupling capacitors in the range of 600pF to 2500pF. Its permissible maximum charging current is 50mA.
Other coupling units can be supplied by Power Diagnostix on request.
Fig.4 and Fig.5 display the standard preamplifier and standard coupling unit for the ICMcompact.
PD •
PD •
Power Diagnostix Systems
Power Diagnostix
CC
GND
RPA1
Fig: 4
Preamplifier RPA1
CIL4L
C=0,6-5,5nF
I =50mA max
Fig: 5 Quadrupole CIL4L
II.1.1 Optional Functions for the ICMcompact
The instrument can be equipped with several optional features as:
•
•
•
•
•
•
•
•
•
•
•
•
•
•
•
•
•
VLF option (very low frequency) allows measurements with 0.1Hz, 0.05Hz, and 0.02Hz. This
option requires also the HVM extension for the automatic voltage synchronization.
Additional DSO board for Cable Fault Location. Single PD pulses and their echo’s are captured
with a high sampling rate to localize faults in long cables. The extended software version stores
and analyzes the data (see also chapter III.3.3 and VI).
Additional voltage measurement and display, HVM Display (see also chapter III.3.1).
Extended synchronization frequency up to 510Hz.
MUX The channel multiplexer allows a manual switching between 4 or 12 different PD sources.
AUX The auxiliary inputs record further data like power, temperature, speed (III.3.5).
STP A quick change of 12 different setups including the calibration data (III.3.6).
LOG Offers a logarithmic scaling for broad range PD signals (III.3.7).
Remote control interface (RS232). Serial hardware link to the software packages.
Software Driver. If the ICMcompact should be controlled by others than the original software, a
driver for ‘C’ is available. This driver is only useful for software programming. (on request)
Fiber Optic Link (FOL) for the serial interface RS232. Offers a safe insulation and an extended
distance between ICMcompact and the PC/Laptop.
Fiber Optic Link (FOL) to the preamplifier (RPA4). Allows measurements on the high voltage side
and safe insulation to the measurement unit.
TTL-Gating input. Via a BNC connector at the rear panel, a TTL-signal allows to blind out
disturbance signals (see also chapter III.5.3).
Analog Gating input. Allows to capture disturbance signals via an extra preamplifier (preferably
the logarithmic RPA6) which is used to blind out the noise signal (see also chapter III.5.4).
Current output. A signal of 4-20mA equivalent to the calculated charge, is provided on the rear
panel.
Full 19" wide box to fit the ICMcompact into a standard rack.
Software packages. Two software packages to communicate via a PC are available. (see also
chapter IV):
- ICMcompact Standard software to record PD measurements and create report documents.
Optional version for the cable fault location, only to use with the DSO.
- HVpilot
Used for voltage control and taking measurements over long periods
in combination with the STEPcompact.
Power Diagnostix · Brüsseler Ring 95a · 52074 Aachen · Germany · Phone +49 241 74927 · Fax +49 241 79521 · www.pdix.com
ICMcompact
Partial Discharge Detector
9
II.1.2 Connections
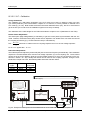
There are various circuits to take measurements of PD with the ICMcompact. The diagram below (Fig. 6)
illustrates the basic connections among the elements of the partial discharge measuring setup with the
ICMcompact. Here the coupling device (CIL4L) is put in series with the coupling capacitor. So the test object can be connected in parallel to the coupling capacitor and the voltage supply.
HV
supply
Coupling
Capacitor
Test
Object
Caution: The AMP IN is only to be connected with the preamplifier or a Spectrum Analyzer. The supply voltage for the preamplifier may damage the output circuit of the signal source.
Be sure not to connect anything but a RPA to this terminal or
to turn OFF the supply voltage. Only the SYNC IN terminal
can take voltages up to ~200Vpeak. Do not apply any voltage to
the REC OUT terminal (min. 100 Ω input impedance).
short
distance
PD •
Power Diagnostix
PD •
C=0,6-5,5nF
I =50mA max
RPA1
Power Diagnostix Systems
CC
System
ground
GND
CIL4L
max. 50m
(RG58)
Power Diagnostix
Bruesseler Ring 95a D-52074 Aachen +49 241 74927
S/N:000
REMOTE
Mains Supply
System Ground
Serial PC Port
SYNC IN
REC OUT
AMP IN
Ext. Sync.
To Recorder
(optional)
Fig. 6: Basic connections for PD measurement on a test set up. (Not drawn to scale).
In order to prepare a measurement, connect the input (CC) of the coupling unit CIL4L to the low side terminal
of the coupling capacitor and the ground input (GND) of the coupling unit to ground. The output of the
coupling impedance is directly connected to the RPA1 preamplifier preferably using a BNC/BNC adapter or a
short length of BNC cable, this minimizes the capacitive loading of the coupling unit and exploits the relatively
high input impedance (10kΩ//50pF) of the RPA1. The quality of the connecting cable between the RPA1
output and the ICMcompact display unit (AMP IN) is fairly uncritical. Up to lengths of 50m we recommend
normal RG58 BNC cable; RG213 cable (having a lower attenuation) is recommended for lengths up to 200m.
Power Diagnostix · Brüsseler Ring 95a · 52074 Aachen · Germany · Phone +49 241 74927 · Fax +49 241 79521 · www.pdix.com
ICMcompact
10
Partial Discharge Detector
II.1.2.1 Synchronizing the ICMcompact
In the absence of an external synchronization signal, the ICMcompact will automatically synchronize to the
sine wave of the line voltage supplying power to the ICMcompact itself. Often, the high voltage applied to
the test setup is not in phase with the line votlage and may not even be the same frequency as the line
voltage. In such cases, it is best to synchronize the ICMcompact with an external signal.
To synchronize the ICMcompact on the high voltage applied to the test setup, a voltage divider is needed to
create a copy of the voltage wave. The SYNC IN input is designed for voltage in the range of 1V to 100VRMS
(max. 200Vpeak). Regard, the input impedance of the SYNC IN input is about Zin = 1MΩ//200pF. With the
optional VLF function switched on it's about 10MΩ.
If you use a coupling unit from Power Diagnostix, either quadrupole or capacitor with a built in quadrupole,
the once with the extension .../V (like CC25C/V or CIL4M/V) will have an extra output labeled ‘U’. Connect
this low-voltage copy of the applied voltage to the SYNC IN connection on the rear of the ICMcompact.
Additionally, a TTL type trigger signal can be supplied to the SYNC IN connection to force synchronization.
Power Diagnostix · Brüsseler Ring 95a · 52074 Aachen · Germany · Phone +49 241 74927 · Fax +49 241 79521 · www.pdix.com
ICMcompact
Partial Discharge Detector
11
The connections to the ICMcompact are made on the rear panel of the instrument, to the four BNC connectors, one wing nut screw, and one serial connector. The functions of the connectors are as follows:
AMP IN: The AMP IN BNC connector is where the PD signal enters the ICMcompact. The AMP IN connector must be connected to a remote preamplifier (RPA). Notice the direction of the arrows engraved on the RPA; the arrows must point toward the ICMcompact.
RPA: The output arrow
engraved on the RPA (preamplifier) must be connected to the AMP IN of the
ICMcompact. The input arrow
of the RPA must be connected to the output of a quadrupole
(measuring impedance) or other PD signal sources (such as a current transformer).
The connection between the output of the coupling impedance and the RPA1 preamplifier should be
with a BNC/BNC adapter or a short length of BNC cable, in order to minimize the capacitive loading
of the coupling unit and fully benefit from the relatively high input impedance (10kΩ//50pF) of the
RPA1. The quality of the connecting cable between the RPA1 output and the ICMcompact display
unit (AMP IN) is fairly uncritical. Normal RG58 BNC cable is recommended for lengths up to 50m;
RG213 cable (which has a lower attenuation) is recommended for lengths up to 200m.
Quadrupole: The quadrupole captures the PD signal from the coupling capacitor, or alternatively, from the
test object itself. Power Diagnostix offers quadrupoles as separate modules or as built-in components of coupling capacitor units. The output of the quadrupole must be connected to the input of a
preamplifier. The input marked “CC” must be connected to the low side of the coupling capacitor (or
alternatively to the low side, or neutral, of the test object). The terminal marked “GND” must be connected to the system ground.
If the quadrupole has an optional voltage divider, the output marked “U” is a low-voltage copy of the
high voltage applied to the test object and coupling capacitor. This output can be used for external
synchronization when connected to the “SYNC IN” terminal of the ICMcompact.
REC OUT: The REC OUT terminal of the ICMcompact may optionally be connected to a paper recorder or
other device to provide a graph of the average charge magnitude. For the output level see chapter
III.2.3 table 1.
SYNC IN: The SYNC IN can optionally be used for external synchronization of the ICMcompact to the frequency of the applied high voltage. This can be the output of a voltage divider (such as the voltage
divider included with some Power Diagnostix quadrupoles) or of some other customized circuit. If the
SYNC IN is not connected, the ICMcompact will synchronize on the mains supply frequency (usually
50 or 60 Hz).
REMOTE: The REMOTE terminal provides the optional serial connection to a personal computer for remote communications, using the serial cable provided by Power Diagnostix.
Mains supply: The mains (power supply) plug must be connected to a power outlet providing power in the
voltage range 85VAC up to 264VAC, frequency 47 - 440Hz. The on/off switch for the unit is located
above the mains plug. A power supply fuse is located between the on/off switch and the mains power
inlet.
GND: The wing nut on the rear panel of the ICMcompact must be connected to ground.
GATE IN (optional): The GATE IN terminal, which is not included in all models of the ICMcompact, can be
used for noise rejection during measurements. To do so, connect the output of an additional RPA,
carrying the unwanted noise signal, to the GATE IN.
The minimum connections that must be made in order to use the ICMcompact are the mains power supply,
the AMP IN, and the system ground.
Power Diagnostix · Brüsseler Ring 95a · 52074 Aachen · Germany · Phone +49 241 74927 · Fax +49 241 79521 · www.pdix.com
ICMcompact
12
III
Partial Discharge Detector
Operation
III.1 Main Functions
After switching on the ICMcompact, the LC screen displays the ICMcompact-logo and software version for
about two seconds. The instrument is controlled by the five pushbuttons on the front panel. The individual
functions are assigned to each button by the menu fields on the right side of the display. There are several
display modes and submenus available.
After power up and display of the ICMcompact logo, the instrument automatically selects the display mode
and submenu that were active when the instrument was last switched off. In order to activate the MAIN menu,
you may need to press the EXIT button several times. In this MAIN menu you can select either the METER
(MAIN M) or the SCOPE (MAIN S) display mode. If implemented, also the HVM (high voltage meter) is available. Devices with an additional acquisition board (DSO board) for cable fault location have an additionally
display called DSO. Figure 7 shows the ICMcompact in the menu ‘MODE S’. An overview of the key menus
can be found in III.2.1.
Graphical Display of PD Data
Current
Functions
of Menu
Buttons
Current
Value of Apparent
Charge
Frequency
of Applied Voltage
Message
Abbreviation
Current
Screen Resolution
Label of Current Menu
Fig. 7: Parts of the ICMcompact display
The display of the ICMcompact consists of graphic elements like the grid, the voltage curve and the PD pattern and additionally text elements like the menu description, the values shown at the lower border and settings written at the upper border. Some conditions are displayed as abbreviations at the lower left side. The
following table shows these abbreviations and its meaning.
Abbreviation Meaning
RPA?............ missing preamplifier or damaged cable between preamplifier (i.e. RPA1) and input of the
ICMcompact (AMP IN);
EXT............... external synchronization; the device selects automatically the synchronization source, means
that the line voltage will be used if there is no external voltage connected to the SYNC IN at
the rear panel. For this, the ESYNC must be enabled.
RPA OFF....... within the submenu MISC the control voltage for the preamplifier can be turned off;
G ...................external gating is turned on (see chapter III.5.4)
Power Diagnostix · Brüsseler Ring 95a · 52074 Aachen · Germany · Phone +49 241 74927 · Fax +49 241 79521 · www.pdix.com
ICMcompact
Partial Discharge Detector
13
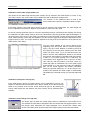
There are two displays to indicate the captured PD activity. In the Scope display every PD signal is shown
on a phase resolved graph. In the Meter display the peak value is shown on an analog meter.
III.1.1 Scope
Within the Scope mode there are 3 ways to display the PD pattern. These types can be selected in the
menu MODE and will be explained now.
Fig. 8: Scope Display (Norm Mode)
Fig. 8 shows the Scope display with NORM
mode activated (see menu description for
menu MAIN S): Every partial discharge pulse
is displayed as a vertical line at the phase
angle where it occurs. The length of the line
is proportional to the apparent charge amplitude. The display refresh rate of the ICMcompact is about 0.1s, thus every picture
shows the discharge pulses accumulated
over the last five cycles of the test voltage (at
50Hz!). The displayed sine wave helps to
identify the phase position of the discharge
impulses.
Fig. 9 shows the scope display with SINE
mode active. The only difference between
NORM mode and SINE mode is that in the
SINE mode, the impulses are superimposed
onto the sine wave.
Fig. 9: Scope Display (Sine Mode)
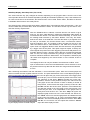
In the HOLD mode every partial discharge
impulse activates a display pixel at the location according to the pulse magnitude and the
phase angle of occurrence. Note that in this
case the display is refreshed every 100ms
which allows a visualization of the build-up
dynamics of a partial discharge pattern (also
called PD-Map or phase-amplitude distribution). Changing the gain will reset the this
display mode. Despite the fact that the ICMcompact can only 'count' up to 1 (pixel on/off)
and that other technical differences exist
Fig. 10: Scope Display (Hold Mode)
between the ICMcompact and the ICMsystem, the PD maps can be easily recognized
and compared to the results obtained by the ICMsystem. The resolution of the ICMsystem is ±128 x 256 x
65536 (16bit) whereby the ICMcompact is unipolar and has a resolution of 80 x 196 x 1 (amplitude x phase
x count depth).
Power Diagnostix · Brüsseler Ring 95a · 52074 Aachen · Germany · Phone +49 241 74927 · Fax +49 241 79521 · www.pdix.com
ICMcompact
14
Partial Discharge Detector
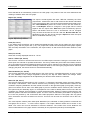
At the bottom of the display the synchronization frequency (left), the scaling of the y-axis in Coulomb per
division (right) and the current maximum value of discharge (large letters) is shown. This maximum is calculated from voltage periods during the last refresh cycle. For best results the gain should be set so that
this maximum appears in the range of 50-90% of the y-axis total range. In case the PD-values are out of
this range no valid Qp can be shown. This happens if the gain is either too high or too low. In the first case
‘>’ (max. value) and in the second case ‘<’ (min. value) is displayed. The setting of the gain can be adapted
manually or automatically by turning on or off the AUTO mode. This option is accessible at the MODE S or
MODE M menu.
Fig. 11: MAIN menu; charge level out of range
The evaluation of the PD pattern, measured in HOLD mode, enables to determine the kind of fault within the
test object. Most PD faults like e.g. isolation damages, voids, surface discharges or floating points will have
completely different PD pattern. Typical criteria’s to classify these pattern are:
•
•
•
•
•
•
phase position of the maximum
phase position of the starting electron
the gradient of discharges
the shape of discharges in the positive and negative half-cycle
the absolute value of discharge in pC or nC
short-time or continuous discharges
Some installations make it necessary to correct the phase position of the pattern. For example, measuring on
a three phase system without using the external synchronization, where the line synchronization comes from
one of the two other phases. In that case a correction of 120° would be necessary. This phase shift can be set
at the menu SETUP2 \ LLDSET. Please notice that the correct phase position is absolutely important for
proper evaluations of the PD pattern. To avoid the need for applying a phase shift, coupling units that include
a voltage divider circuit should be used to provide a signal for external synchronization (e.g. CC20B).
For successful interpretation it is also necessary to get as much information as possible about the test object and its environment. Such information can be, for example, temperature, installation condition, age of
the test object, previous faults or weather conditions. It is useful to store typical PD patterns of known faults
in an archive. This can be done by using the PC software (see “Standard Software ICMcompact”, chapter
IV.1). This customer specific database will be helpful for later evaluation on other test objects.
Power Diagnostix · Brüsseler Ring 95a · 52074 Aachen · Germany · Phone +49 241 74927 · Fax +49 241 79521 · www.pdix.com
ICMcompact
Partial Discharge Detector
15
III.1.2 Meter
Fig. 12 shows the instrument's display in the MAIN menu and METER mode. The buttons GAIN+ and GAINincrease or decrease gain resp. amplification factor. Meter scaling automatically tracks the actual calibration
and gain factor. The button SCOPE, DSO or
HVM activates the next display mode and the
button SETUP calls the configuration menus.
The line beneath the meter, displays the
synchronization signal frequency (line voltage,
or the external signal at the SYNC IN terminal),
the scaling of the meter and the actual peak
value of the apparent charge 'QP'. MODE calls a
submenu for controlling the pointer movement
and speed (see Fig. 13).
Fig. 12: Meter Display (Main Menu)
Fig. 13: Meter Display (Mode Menu)
Within the menu MODE M, three different
speeds for the pointer can be selected. The
chosen option is marked with an arrow ahead.
In >FAST, the actual peak charge value of an
acquisition cycle is displayed; this may lead to
unstable readings (i.e. jerky movement of the
pointer) when the pulse repetition rate is slower
-1
than about 5s . The actual peak value is also
displayed in >NORM mode, but here the
pointer is stabilized: New pulse values are
shown immediately yet the pointer falls back
slowly until a bigger pulse occurs.
The option >IEC270 treats the pulses with a weighting curve as mentioned in the actual revision drafts of the
IEC 60270. This weighting, which displays rarely occurring pulses only with a fraction of their real amplitude
(≥40%), leads to a strong stabilization of the pointer and a reduced reading.
The button AUTO activates the auto-range mode in which the gain is automatically adjusted: It is reduced if
the display reading continuously exceeds 90% full-range, and increased when the reading remains under
20% of the selected scale. Each change in gain is indicated by a short beep from the built-in loudspeaker.
From 1000 pC upwards, the displayed unit changes from [pC] to [nC]. Note: Using sensitive coupling with high
charge levels, the system can be over-ranged. In this case we can provide input attenuators (1:10 and 1:100).
The EXIT button moves back to the MAIN menu.
Power Diagnostix · Brüsseler Ring 95a · 52074 Aachen · Germany · Phone +49 241 74927 · Fax +49 241 79521 · www.pdix.com
ICMcompact
16
III.2
Partial Discharge Detector
Key Menus
All functions described in this chapter base on the current firmware version 2.66. You can find the firmware
number either by startup at the info-screen or by selecting the INFO submenu while the instrument is running. Older releases are not completely compatible to the newer ones. Please contact Power Diagnostix to
get update possibilities and prices.
Each menu consists of five entries (one for each button) and a name for the menu at the lower right hand
side. The background of the menu names are colored in the respective level-color. Each arrow shows the
menu the user enters when pushing that button. The EXIT button jumps back to the previous menu (upper
level). These ways are not visualized.
III.2.1 Overview
Fig. 14 gives an overview of the whole menus being accessible with the ICMcompact instruments. The
dimmed menus are optional and explained separately in the followed figures. Menus with a gray shadow
are optional menus (e.g. HVM, VLF, DSO and gating). They are only accessible if the respective function is
included.
GAIN+
GAINMODE
METER
GAIN+
GAINMODE
DSO
SETUP
MAIN S
SETUP
MAIN M
HVM
DIV
Cd
MODE
SCOPE
DSO
>AUTO
>pC
mV
MORE..
>FAST
NORM
IEC270
AUTO
UP
DOWN
<<
>>
>Urms
Û/√2
EXIT
MODE1S
EXIT
MODE2S
EXIT
MODE M
EXIT
DIV
EXIT
MODE H
OFF
ZM/POS
CURSOR
SPEED
UNIT
EXIT
CD
EXIT
FILTER
LLD/P
MISC
MORE..
RECOUT
ESYNC
KEYB
MORE..
ZOOM+
ZOOMPOS>>
POS<<
EXIT
SETUP1
EXIT
SETUP2
EXIT
SETUP3
EXIT
ZM/POS
GAIN+
GAINCAL+
CAL-
HIGHP
EXIT
CALF
EXIT
CAL
EXIT
FILTER
LLD+
LLDPH<<
PH>>
LIGHT
BEEP
INFO
DISPL
>RPA ON GAIN
MORE..
MORE..
EXIT
LLDSET
EXIT
MISC1
EXIT
MISC2
RUN
UP
DOWN
<<
>>
CAL
CALF
GATE
MORE..
GAIN+
GAINCF+
CF-
GN/TRG
HOLD
MODE
HVM
SETUP
MAIN D
SETUP
MAIN H
>NORM
SINE
HOLD
MORE..
WIN
MAN
AUTO
BANDW
EXIT
GATE
VLF
1
2
3
4
EXIT
KEYB
ESYNC
> 0.1Hz
0.05Hz
0.02Hz
EXIT
SYNC
>m
ft
>mV
pC
SPEED+
SPEED-
EXIT
UNIT
EXIT
SETUP3
SPEED
10pC
100pC
>1nC
10nC
EXIT
RECOUT
10mV
100mV
>
GAIN+
GAINTRG L+
TRG LEXIT
CURS1
POS<<
POS>>
LENGTH
EXIT
CURSOR
LEN+
LEN-
1 V
EXIT
RECOUT
EXIT
LENGTH
VLF
TH+
TH-
GT+
GT-
MODE1
>MODE2
> 40kHz
80kHz
100kHz
> 800kHz
600kHz
250kHz
5 MIN
>30 MIN
60 MIN
ON
EXIT
MAN G
ON
EXIT
AUTO
<< >>
>> <<
POS>>
1 WIN
EXIT
BANDW
EXIT
WIN
EXIT
HIGHP
EXIT
LOWP
EXIT
LIGHT
Gating
SLOW
>FAST
EXIT
GAIN
>SCOPE
>METER
DSO
HVM
EXIT
DISPL
>LOW
HIGH
SOUND
EXIT
BEEP
PD
Power Diagnostix
ICMcompact
Menu Structure Ver.2.67
Fig. 14: Whole menu overview
Power Diagnostix · Brüsseler Ring 95a · 52074 Aachen · Germany · Phone +49 241 74927 · Fax +49 241 79521 · www.pdix.com
ICMcompact
Partial Discharge Detector
17
III.2.2 Optional Key Menus
Some text entries can vary, depending on the several setup settings and of the state of the device. All exit
buttons will bring you back to the menu one level higher. This path is not signed in. The arrows are showing
the way from menu to menu if pushing the appropriate button. At the bottom of each menu its name is written (level-wise colored background).
WIN
MAN
AUTO
BANDW
EXIT
GATE
TH+
TH-
GT+
GT-
MODE1
>MODE2
ON
EXIT
MAN G
ON
EXIT
AUTO
EXIT
BANDW
Fig. 15: Optional Menus (Gate)
Fig. 15 shows the optional gating menus. These menus become visible if the device has an external
GATE IN input channel. In this case, an additional logarithmic preamplifier RPA6 is built in. The noise signal can directly be connected to the GATE IN channel.
GN/TRG
HOLD
MODE
HVM
SETUP
MAIN D
RUN
ZM/POS
CURSOR
SPEED
UNIT
EXIT
ZOOM+
ZOOMPOS>>
POS<<
EXIT
ZM/POS
>m
ft
>mV
pC
EXIT
UNIT
SPEED+
SPEED-
EXIT
SETUP3
SPEED
GAIN+
GAINTRG L+
TRG LEXIT
CURS1
POS<<
POS>>
LENGTH
EXIT
CURSOR
SETUP3
CURS2
LEN+
LEN-
EXIT
LENGTH
Fig. 16: Optional Menus (DSO extension)
Devices with a DSO acquisition board for cable fault location get the entry UNIT within the SETUP4. This
option allows to select the display unit for cable fault positions. There will also be an additional menu
MAIN D for working with the DSO board. This is shown in figure 16.
Power Diagnostix · Brüsseler Ring 95a · 52074 Aachen · Germany · Phone +49 241 74927 · Fax +49 241 79521 · www.pdix.com
ICMcompact
18
Partial Discharge Detector
III.2.3 Key Menus Description
The following list explains step by step all menus coming with standard ICMcompacts’ with firmware releases
higher than Ver. 2.40 .
GAIN+
GAINMODE
METER
SETUP
MAIN S
GAIN+ / GAINSets the amplification of the ICMcompact signal path up or down. The total amplification
is a combination of pre-amplification (external preamplifier, i.e. RPA1) and mainamplification (internal). By selecting the automatic mode (see MODE S), the gain will be
adjusted automatically to the current maximum discharge level. The peaks of discharges
should be visible at 60 to 90 percent of the total display range. With very high gain settings the noise becomes visible on the screen. If there is no phase dependency of the
signals (no discharges), set the noise level to 5% of the total range of the display. This
ensures that all newly-appearing discharges will be recognized if their level is higher than
the noise at the input.
MODE
Pushing this button changes to the MODE S menu.
METER, DSO or HVM
Depending on the optional DSO acquisition board and the switched on displays (see
menu DISPL) this function switches to the next display type.
SETUP
Pushing this button changes to the setup menu. As there are several setup menus, this
function enters ever the last setup you’ve been before.
GAIN+
GAIN+ / GAINsee explanation above;
GAINMODE
DSO
SETUP
MAIN M
MODE
Pushing this button changes to the MODE M menu.
METER or DSO
Depending on the optional DSO acquisition board and the switched on displays (see
menu DISPL) this function switches to the next display type.
SETUP
Pushing this button changes to the setup menu. As there are several setup menus, this
function enters ever in the last setup you’ve been once before.
Depending on the optional Functions two main menus and their submenus are added.
For more information see:
MAIN H
MAIN D
III.3.1 HVM Display
III.3.3 DSO Display
Power Diagnostix · Brüsseler Ring 95a · 52074 Aachen · Germany · Phone +49 241 74927 · Fax +49 241 79521 · www.pdix.com
ICMcompact
>NORM
SINE
HOLD
MORE..
EXIT
Partial Discharge Detector
19
NORM
Setting this option (>) enables the normalized visualization for the phase resolved PD
display (SCOPE). The differences between NORM, SINE and HOLD are described in
chapter III.1.1.
SINE
Setting this option (>) enables the ‘sine’ visualization for the phase resolved PD display
(SCOPE).
MODE1S
HOLD
Setting this option (>) enables the ‘hold’ visualization for the phase resolved PD display
(SCOPE).
MORE..
Pushing this button changes to the menu MODE2S.
EXIT
Pushing this button changes to the MAIN S menu.
>AUTO
>pC
mV
MORE..
EXIT
MODE2S
AUTO
Setting this mode (>) means that the gain will be adjusted automatically to the maximum
level of the current PD-pulses.
pC
Setting this mode (>) changes from the acoustic measurement mode ('mV') back to the
charge measurement mode.
mV
Setting this option (>) changes the display unit to 'mV' for the acoustic measurement. For
a correct calculation of the input voltage it is mandatory to connect the RPA1D preamplifier or to disconnect the RPA supply in the menu MISC1. Within this mode, the CAL and
CALF menus are blocked and the FILTER setting are fixed to the frequency range 40 to
800kHz. All these settings are stored before and will be recalled when changing back to
the 'pC' display mode.
MORE..
Pushing this button changes to the menu MODE1S.
EXIT
Pushing this button changes to the MAIN S menu
Power Diagnostix · Brüsseler Ring 95a · 52074 Aachen · Germany · Phone +49 241 74927 · Fax +49 241 79521 · www.pdix.com
ICMcompact
20
>FAST
Partial Discharge Detector
FAST
Setting this option enables the fast movement speed of the pointer in the METER display.
NORM
IEC270
AUTO
EXIT
MODE M
NORM
Setting this option enables the normal movement speed of the pointer in the METER display.
IEC270
Setting this option enables IEC60270 mode for updating the pointer in the METER display.
AUTO
Setting this mode (>) means that the gain will be adjusted automatically to the maximum
level of the current PD-pulses.
EXIT
Pushing this button changes to the MAIN M menu.
Depending on the optional Functions two mode menus and their submenus are added.
For more information see:
MODE H
MODE D
III.3.1 HVM Display
III.3.2 DSO Display
Power Diagnostix · Brüsseler Ring 95a · 52074 Aachen · Germany · Phone +49 241 74927 · Fax +49 241 79521 · www.pdix.com
ICMcompact
CAL
CALF
GATE
MORE..
EXIT
SETUP1
Partial Discharge Detector
21
CAL
Pushing this button changes to the calibration menu CAL.
CALF
Pushing this button changes to the menu CALF. Here the calibration factor can be set directly.
GATE
Pushing this button changes to the menu GATE. The gating function reduces noise coming from e.g. antennas and preprocesses the analog disturbance signal. To use this option the device need to be equipped with an external gating input and the hardware of the
device has to be greater than Ver. 2.60. A special logarithmic preamplifier (RPA6) is also
needed to amplify the distrubance signal.
MORE
Pushing this button changes to the setup menu SETUP2.
EXIT
Pushing this button changes to the main menu (MAIN S, MAIN M or MAIN D).
FILTER
LLD
MISC
MORE..
EXIT
SETUP2
FILTER
Pushing this button changes to the filter setting menu FILTER.
LLD
Pushing this button changes to the menu LLD to adjust the low level discriminator.
MISC
Pushing this button changes to the menu MISC for miscellaneous settings.
MORE
Pushing this button changes to the setup menu SETUP3.
EXIT
Pushing this button changes to the main menu one level up.
RECOUT
>ESYNC
KEYB
MORE..
EXIT
SETUP3
RECOUT
Pushing this button changes to the menu RECOUT. Here the ratio of charge value to
output voltage can be set.
ESYNC
If this button is selected (>) the frequency measurement and synchronization signal is
taken from the SYNC IN input, if possible. To manually turn to the line (mains) sync., deselect the button.
With the optional 'VLF', this button is labeled 'SYNC' and changes to the menu SYNC.
See also chapter III.3.2. VLF.
KEYB
Pushing this button changes to the menu KEYB. In here crucial menus, which will directly
affect the PD measurement settings, can be locked and unlocked. To unlock the keyboard, a sequence of the numbers: 3 4 3 2 must be entered.
MORE
Pushing this button changes to the setup menu SETUP1.
EXIT
Pushing this button changes to the main menu (MAIN S, MAIN M or MAIN D).
Power Diagnostix · Brüsseler Ring 95a · 52074 Aachen · Germany · Phone +49 241 74927 · Fax +49 241 79521 · www.pdix.com
ICMcompact
22
GAIN+
GAINCAL+
CALEXIT
CAL
Partial Discharge Detector
GAIN+/GAINPushing this button increments/decrements the total gain by one step. The calibration
signal should be 50%-90% of the total y-axis range. Changing the gain does not calibrate the system. Use the buttons CAL+ or CAL- to recalibrate.
CAL+/CALThese buttons can be used to enter the calibration value. Together with the measured
peak charge level, the calibration factor is calculated and stored. There is no possibility to
make it undo! The value should be set equal to the value shown on the connected pulse
generator (e.g. CAL1A). For detailed information’s about the calibration procedure see
chapter III.4.
EXIT
Pushing this button changes to the setup menu SETUP1.
GAIN+
GAINCF+
CFEXIT
CALF
GAIN+/GAINPushing this button increments/decrements the total gain by one step. This will have no
impact on the calibration factor.
CF+/CFThese buttons can be used to set the calibration factor directly. This function can be used
to copy a previously done calibration. For more detailed information’s about the calibration procedure see chapter III.4.
EXIT
Pushing this button changes to the setup menu SETUP1.
HIGHP
LOWP
EXIT
FILTER
HIGHP
Pushing this button changes to the menu HIGHP for setting up the lower cut-off frequency.
LOWP
Pushing this button changes to the menu LOWP for setting up the upper cut-off frequency.
EXIT
Pushing this button changes to the setup menu SETUP2.
Power Diagnostix · Brüsseler Ring 95a · 52074 Aachen · Germany · Phone +49 241 74927 · Fax +49 241 79521 · www.pdix.com
ICMcompact
>40kHz
Partial Discharge Detector
23
>40KHZ
Pushing this button sets the lower cut-off frequency to 40kHz.
80kHz
100kHz
80KHZ
Pushing this button sets the lower cut-off frequency to 80kHz.
EXIT
100KHZ
Pushing this button sets the lower cut-off frequency to 100kHz.
HIGHP
EXIT
Pushing this button changes to the setup menu FILTER.
>800kHz
>800KHZ
Pushing this button sets the upper cut-off frequency to 800kHz.
600kHz
250kHz
600KHZ
Pushing this button sets the upper cut-off frequency to 600kHz.
EXIT
250KHZ
Pushing this button sets the upper cut-off frequency to 250kHz.
LOWP
EXIT
Pushing this button changes to the setup menu FILTER.
LLD+
LLDPH<<
PH>>
EXIT
LLDSET
LLD+/LLDPushing these buttons increments or decrements the level of the Low Level Discriminator. This value is displayed at the upper right side of the screen in percent. All discharges
below that level are deleted and not displayed on the screen.
PH<</PH>>
Pushing these buttons increments or decrements the position of the PD in relation to the
zero point of the voltage synchronization line. This value is displayed at the upper left
side of the screen in degree.
EXIT
Pushing this button changes to the setup menu SETUP2.
Power Diagnostix · Brüsseler Ring 95a · 52074 Aachen · Germany · Phone +49 241 74927 · Fax +49 241 79521 · www.pdix.com
ICMcompact
24
LIGHT
INFO
>RPA ON
MORE..
EXIT
MISC1
Partial Discharge Detector
LIGHT
Pushing this button changes to the menu LIGHT for setting up the timer for the screen
saver.
INFO
Pushing this button changes to the INFO display. This display gives information about the
current firmware version, hardware release and the mailing address of Power Diagnostix.
>RPA ON
If this button is selected (>) the power supply for the preamplifier is turned on. Pushing
this button until the checkmark is off, turns off the supply to the preamplifier and enables
to use the AMP IN terminal directly without preamplifier.
MORE..
Pushing this button will change to MISC2.
EXIT
Pushing this button changes to the setup menu SETUP2.
5 MIN
>30 MIN
60 MIN
EXIT
5 MIN, 30 MIN, 60 MIN
Pushing these buttons sets the automatic screen saver to 5, 30 or 60 minutes. That
means, when for about 5, 30 or 60 minutes no button has been pressed, the background
lighting of the display will be turned off. The light will be turned on by pressing any button.
EXIT
Pushing this button changes to the setup menu MISC.
LIGHT
EXIT
Pushing this button changes to the setup menu MISC.
EXIT
INFO
The INFO menu contains information about:
• the actual firmware version and release day (SW Version, SW Release)
• the hardware version (HW Version)
• some optional instrument functions
• contact details of Power Diagnostix
Power Diagnostix · Brüsseler Ring 95a · 52074 Aachen · Germany · Phone +49 241 74927 · Fax +49 241 79521 · www.pdix.com
ICMcompact
BEEP
Partial Discharge Detector
25
BEEP
The sound when pressing one of the five keys can be modified here.
DISPL
GAIN
DISPL
Display modes (SCOPE, METER, DSO and HVM) can be deselected in this menu.
MORE..
EXIT
GAIN
The speed of the AUTO gain (MODE menu) adjustment can be selected here.
MISC2
MORE..
Pushing this button will change to MISC1.
EXIT
Pushing this button changes to the setup menu SETUP2.
LOW
LOW, HIGH
Pushing these buttons switches between a higher or lower sound for the buttons.
HIGH
>SOUND
EXIT
BEEP
> SCOPE
> METER
DSO
SOUND
Pushing this button enables (>) or disables the audible indicator for the partial discharge
signals.
EXIT
Pushing this button changes to the setup menu MISC.
The display modes which are installed in the instrument can be deselected, if they are not
currently visible. Modes which are deselected in this menu can not be selected in the
MAIN menu and will be skipped. This will increase the handling, especially when the
modes are changed frequently.
HVM
EXIT
DISPL
> SLOW
FAST
EXIT
GAIN
EXIT
Pushing this button changes to the setup menu MISC2.
The AUTO gain is turned on and off in the menu MODE S or MODE M. The sensitivity or
speed of the auto-gain can be changed between slow and fast. The SLOW mode is useful if a PD level is quite constant, or if random spikes will disturb a continuous measurement. The FAST mode is useful if rapid changes of the PD level should be captured e.g.
when measuring the inception voltage of a specimen. A single PD level which will over
range the preamplifier stops the acquisition and the gain is adjusted instantly.
EXIT
Pushing this button changes to the setup menu MISC2.
Power Diagnostix · Brüsseler Ring 95a · 52074 Aachen · Germany · Phone +49 241 74927 · Fax +49 241 79521 · www.pdix.com
ICMcompact
26
LOCK
EXIT
KEYB
ESYNC
0.1 Hz
0.05 Hz
0.02 Hz
EXIT
SYNC
Partial Discharge Detector
LOCK
This button allows to lock the keyboard, leaving only the functions available, which will
not affect the parameters of the instrument. The locked functions are labeled in the Menu
Structure (chapter III.2.1) by:
Entering the KEYB menu while being locked, the buttons
are labeled 1, 2, 3, 4, EXIT. To unlock the keyboard a sequence of the numbers: 3 4 3 2
must be pressed.
EXIT
Pushing this button changes to the setup menu SETUP3.
ESYNC
If this button is selected (>) the frequency measurement and synchronization is taken
from the SYNC IN input, if possible. To manually turn to the line (mains) sync., deselect
the button.
0.1Hz, 0.05Hz, 0.02Hz
For the acquisition with the VLF (very low frequency) option, the external voltage signal
from the SYNC IN is mandatory. Selecting one of the three VLF frequencies will deselect
the external frequency measurement, and set the sampling time according to the set VLF.
The synchronization is done automatically by the SYNC IN input.
EXIT
Pushing this button changes to the setup menu SETUP3.
10pC
>100pC
10pC,100pC, 1nC, 10nC
Pushing these buttons sets the level of the analog voltage output (RECOUT). The scaling
is linear.
1nC
10nC
EXIT
RECOUT
Record
button
button
button
button
Output
10pC
100pC
1nC
10nC
0V
0 pC
0 pC
0 nC
0 nC
5V
5 pC
50pC
0.5 pC
5 nC
10V
≥10 pC
≥100 pC
≥1 nC
≥10 nC
Tab.1: Ranges of the Voltage Output
EXIT
Pushing this button changes to the setup menu SETUP3.
Power Diagnostix · Brüsseler Ring 95a · 52074 Aachen · Germany · Phone +49 241 74927 · Fax +49 241 79521 · www.pdix.com
ICMcompact
WIN
MAN
AUTO
BANDW
EXIT
GATE
<< >>
>> <<
POS>>
1 WIN
EXIT
WIN
Partial Discharge Detector
27
WIN
Pushing this button changes to the menu WIN. The firmware ‘window’ function makes it
possible to blind out pulses with respect to their phase position. At older devices (Firmware <2.00) this function was called GATE.
MAN, AUTO, BANDW
Gating with an external sensor (analog gating) is an optional function. An ICMcompact
with this gating function will have a built in preamplifier (RPA6) and a ‘GATE IN’ terminal
(BNC) on the rear panel. Please also see chapter III.5.4.
<< >>
Pushing this button widens the window(s) for blinding out the pulses on the display. The
width of the windows is displayed at upper right side of the screen.
>> <<
Pushing this button scales down the window(s) for blinding out the pulses on the display.
POS>>
Pushing this button changes the position of each window. The phase position value is
shown at upper left side of the display.
1 WIN (2 WIN, 3 WIN, OFF)
Selects the number of windows for this software gating. The phase distances using two
windows is 180° and 120° for three windows. Press ‘1 WIN’ if you want to get one window
for gating. The key always indicates the next option.
Power Diagnostix · Brüsseler Ring 95a · 52074 Aachen · Germany · Phone +49 241 74927 · Fax +49 241 79521 · www.pdix.com
ICMcompact
28
Partial Discharge Detector
III.3 Optional Functions
III.3.1 HVM - High Voltage Meter Display (optional)
Instruments with the option of a HVM display (high voltage meter) are able to calculate and display the
voltage waveform connected to the SYNC IN terminal. The scaling of the amplitude and time base is done
automatically so that one full waveform is displayed. The calculated values URMS and Û/√2 can also be
shown in the other selected displays (SCOPE, METER, DSO), however this will decrease their refreshing
rate. The Software ICMcompact is able to record these values together with PD level and the date/time.
Please also regard the software introduction in chapter IV and the technical data in chapter VII.1.
The displayed waveform has no impact on the calculation of the values shown in the top two rows or other
Û
peak _ voltage
=
resulting in a factor of 1.41 for
menus. The crest factor (Crest) is calculated by
URMS effective _ voltage
not distorted sine waves.
To adjust the signal voltage entering (SYNC IN) to
the measured voltage the divider factor (DIV.) can
be changed by using the buttons DIV+ and DIV-.
Holding these buttons will increase the step width.
The voltage frequency and the scaling factor for the
displayed waveform are shown in the bottom row
together with the peak PD value taken from the
AMP IN terminal.
Fig. 17: HVM display showing voltage waveform
To select a value (URMS, Û/√2) which should be
displayed in SCOPE, METER or DSO mode switch
to MODE H and select the respective value.
Fig. 18: MODE menu for the HVM mode
Fig. 19: SCOPE display with URMS value
Power Diagnostix · Brüsseler Ring 95a · 52074 Aachen · Germany · Phone +49 241 74927 · Fax +49 241 79521 · www.pdix.com
ICMcompact
DIV
Cd
MODE
SCOPE
SETUP
MAIN H
Partial Discharge Detector
29
DIV
Changes to the submenu DIV. Here the divider ratio of the high voltage divider can be
set.
Cd
Changes to the submenu Cd. Here the low voltage capacitance can be entered. This
menu is only visible if one of the three VLF is selected in the menu SYNC.
MODE
Pushing this button changes to the MODE H menu. (see description below)
SCOPE, DSO or METER
Depending on the optional DSO acquisition board this function switches to the next
display type.
SETUP
Pushing this button changes to the last selected SETUP menu.
UP
DOWN
<<
This menu is only visible, if one of the three VLF is selected in the menu SYNC.
UP / DOWN
Sets the low voltage capacitance. The selected character (.) can be increased (UP) or
decreased (DOWN) by pushing the button.
>>
EXIT
CD
UP
DOWN
<<
>>
EXIT
DIV
Urms
Û/√2
> OFF
EXIT
MODE H
<< / >>
To select the character which should be changed the cursor (.) can be moved up (<<)
or down (>>) in range by this buttons.
UP / DOWN
Sets the divider ratio of the high voltage divider. The selected character (.) can be increased (UP) or decreased (DOWN) by pushing the button. The ratio has to be inserted as a factor of 1/x e.g. with a divider factor of DIV = 1000 a maximum measuring
range of 100kVeff is possible. Since the maximum input Voltage is 100Veff or 200Vpeak.
<< / >>
To select the character which should be changed the cursor (.) can be moved up (<<)
or down (>>) in range by this buttons.
Urms
Setting this option displays additionally the root-mean-square value of the voltage in
the further selected displays (see Fig.19)
Û/√2
Setting this option displays the peak value divided by 1.414 in the further selected displays.
OFF
Turns off the additional display of the voltage value in the selected displays (see menu
DISPL). This will increase the refreshing cycles in the other displays since the voltage
value is not calculated.
Power Diagnostix · Brüsseler Ring 95a · 52074 Aachen · Germany · Phone +49 241 74927 · Fax +49 241 79521 · www.pdix.com
ICMcompact
30
Partial Discharge Detector
III.3.2 VLF - Very Low Frequency
Instruments with the optional VLF acquisition are able to synchronize (trigger) at very low frequencies like
0.1 Hz. Since the synchronization is done by the supplied high voltage, the instrument needs also to have
the optional high voltage measurement HVM. An ICMcompact with the VLF function has an additional
submenu 'SYNC' which is accessible in the SETUP3 menu (see chapter III.2). At an ICMcompact without
the VLF function this key is labeled 'ESYNC'.
ESYNC
0.1Hz
0.05Hz
0.02Hz
EXIT
SYNC
ESYNC
If this button is selected (>) the frequency measurement and synchronization with frequencies >10Hz is taken from the SYNC IN input, if possible. To manually turn to the
line (mains) sync., deselect the button.
0.1Hz, 0.05Hz, 0.02Hz
Selecting one of these buttons (>) will activate the VLF measurement mode. For the
acquisition with this option, an external voltage signal from the VLF system is recommended. Selecting one of the three VLF frequencies will deselect the external frequency measurement. The zero crossing of the voltage signal will be determined by
the internal software automatically. The frequency has to be chosen according to the
settings at the VLF high voltage source.
III.3.2.1 VLF - Installation, Connection
For partial discharge measurement on a medium voltage cable, the core of the specimen has to be connected to a coupling capacitor CC (e.g. 1nF). The low voltage side of CC is then connected to a quadrupole
(e.g. CIT4L) suitable to stand the max. current determined by CC and Umax. A broad-band preamplifier
should be connected with a short link (coax or BNC-adapter) to the quadrupole. Power Diagnostix offers
two preamplifier suitable for this purpose. The RPA1L is designed for laboratory environment and production line and the RPA1H which is suitable for field test. Both preamplifier have a frequency range of 40kHz
to 20MHz. The test voltage (VLF high voltage source) is also connected to the specimen core. To minimize noise and unwanted oscillations of the PD signal, the coupling capacitor CC should be connected as
close as possible to the cable under test. Also the earthing connections should be kept short as well. The
specimen screen should be connected closely to the quadrupole.
The fault location on cable (TDR) requires a point of reflection, therefore the cable specimen should not be
terminated at the far end nor short circuit.
Power Diagnostix · Brüsseler Ring 95a · 52074 Aachen · Germany · Phone +49 241 74927 · Fax +49 241 79521 · www.pdix.com
ICMcompact
Partial Discharge Detector
31
III.3.2.2 VLF – Calibration
Charge Calibration
The calibration for a PD pattern acquisition in the VLF mode can be done in advance, while in the line
sync mode (50/60 Hz). This is described in chapter III.4.3. However, it is also possible to calibrate in the
VLF mode (e.g. 0.1Hz). Both modes will result in the same calibration factor (CF), but CF is more facile to
get in the line sync mode since the calibration signal is more easy to identify.
The calibration of the cable length for the TDR is described in chapter III.3.3.3 (Calibration for the TDR).
Divider Factor Adjustment
The HVM option (high voltage meter) is mandatory to get the correct phase synchronization with the VLF
mode. Therefor, the divider factor (DIV) should also be adjusted. The divider factor can either be read off
the coupling unit directly (e.g. CC50/V with DIV=500) or calculated by:
DIV =
CC + C d
CC
whereas CC relates to the HV coupling capacitor and Cd to the low voltage capacitor.
For Cd>>CC applies DIV ˜ Cd / CC.
Phase Shift Adjustment
The ICMcompact will adjust the phase shift (PH) due to the lower frequency automatically. This calculation
requires the nominal divider factor and the low voltage capacitor (Cd) of the coupling unit. These values
can be set in the menu 'MAIN H' while the synchronization frequency is set to one of the three VLF's (e.g.
SETUP3 / SYNC / >0.1 Hz). Usually this values can be found on the coupling capacitor. Using the combined Filter-Coupler unit TCC, the following table shows the relevant values:
Cd
Coupler
Type:
TCC25
TCC30
TCC50
Divider factor at 50Hz
250
500
500
250nF
500nF
500nF
cable specimen
short
Far End (Open)
PD
ICM compact
VLF
voltage supply
Power Diagnostix
Bruesseler Ring 95a D-52074 Aachen +49 241 74927
PD
PD
CT1
Quadrupole
U
1:500
Po w e r D i a g n o st i x Sy s t em s
S/N:000
GATE IN
SYNC IN
REC OUT
AMP IN
optional
RPA1H
PD •
RPA1H
short
REMOTE
Power Diagnostix Systems
Fig. 20: Example test set-up for a VLF measurement on a HV cable with a TCC filter-coupler-unit
Power Diagnostix · Brüsseler Ring 95a · 52074 Aachen · Germany · Phone +49 241 74927 · Fax +49 241 79521 · www.pdix.com
ICMcompact
32
Partial Discharge Detector
III.3.3 DSO - Digital Storage Oscilloscope (optional) for TDR measurements
Instruments with an optional DSO acquisition board for cable fault location (TDR) are able to process and
display PD signals on a time based curve. Single PD pattern can be triggered and recorded with a resolution
of 10ns (= 100MSamples/s) and a maximum total display range of 80µs (with Firmware ≤ 2.16: 60µs). This
results in a maximum cable length of about 5km (max. measuring time 80µs and pulse velocity of
vC=140m/µs). Since the LCD resolution is limited to 200 pixel the data display is compressed. Using the PC
Software extended by 'c' e.g. ICMcompact 4.55c will enable to take full advantage of the high resolution.
This software is specialized to locate faults in long cables using the TDR (time domain reflectometry) at the
cable terminations. The cable length is limited to about 5km (using max. 80µs measuring time and
vc=140m/µs); it should be at least 10m. Please also regard the software description in chapter IV.2.
III.3.3.1 Measurement principle of TDR with the DSO
The TDR (time domain reflectometry) uses the travel time of pulses. Long high-voltage cable behave as a
wave conductor. Therefore, a pulse which is generated e.g. by a discharge, travels to both cable ends. If
these do not have the characteristic impedance of the cable (open ends), the pulse will be reflected back to
the opposite end. The distance from the fault (pulse source) to the end of the cable is calculated from the
time difference (∆t) the two pulses occur at the measured end (coupling unit). Fig. 21 shows an HV cable
with a fault. The traveling way of the first three pulses entering the coupling unit are displayed on top.
∆t2 · vc
∆t1 · vc
2nd
1st
R
Pulse Source
Coupling
Unit
Far End (Open)
Near End
Fig. 21: Propagation of a Pulse in a Cable
Fig. 22 shows the time diagram of the three
pulses entering the coupling unit. The reference pulse ('R') travels the direct way to the
st
coupling unit. The 1 reflection has traveled the
opposite direction and is reflected at the open
end of the cable. Thus resulting in a time delay
∆t1 which indicates the distance of the pulse
source to the far end.
nd
The 2 reflection results from a reflection of the
reference pulse at the near end and thereafter
at the far end. The time difference between the
st
nd
1 and 2 reflection (∆t2) indicates the distance
of the pulse source to the near end.
R
st
1
nd
2
time
∆t1
∆t2
Fig. 22: Time Diagram
Power Diagnostix · Brüsseler Ring 95a · 52074 Aachen · Germany · Phone +49 241 74927 · Fax +49 241 79521 · www.pdix.com
ICMcompact
Partial Discharge Detector
33
III.3.3.2 DSO – Software
The set-up for the acquisition of PD pulses in TDR ( single PD pulses are observed) has the same principle
than for the PD pattern acquisition. A detailed description of this set-up is already given with the VLF mode in
chapter III.3.2.1 VLF Installation. Except, that the external synchronization (SYNC) to the HV is not necessary.
x
Near End
Far End (Open)
ICMcompact with DSO
HV Transformer
or
Resonance
Test Set
Power Diagnostix
Bruesseler Ring 95a D-52074 Aachen +49 241 74927
S/N:000
REMOTE
PD •
Coupling Unit
SYNC IN
REC OUT
AMP IN
Power Diagnostix Systems
RPA1H
Fig.23: Example test set up for PD location on an HV cable
Although the ICMcompact can be used as stand alone instrument for cable fault location, the optional software extension greatly simplifies the acquisition and analysis with the DSO board. For this, each instrument
has a serial link RS232 labeled 'REMOTE', used to connect to a common PC. To protect the PC, a proper
earthing of the instrument is necessary. Additionally, an insulating fiber optical link for the RS232 should be
used. There are RS232/FOL converters available which are supplied by the serial-link itself.
With the first online session, the device code of the instrument has to be entered in the software. After a
successful initialization of the instrument, the set-up values of the instrument are loaded e.g. range, gain,
trigger level, cable length, pulse velocity.
A software with the DSO extension will have a function button (F9) labeled 'DSO Panel'. Pushing this button,
changes to the panel for the cable fault location. This panel has two x-y-graphs.
Power Diagnostix · Brüsseler Ring 95a · 52074 Aachen · Germany · Phone +49 241 74927 · Fax +49 241 79521 · www.pdix.com
ICMcompact
34
Partial Discharge Detector
All functions of the software are accessible by the pull down menu in the top line. This menu will change
with the selection of 'Main' or 'DSO' panel.
The left x-y-graph displays the 'DSO-graph'.
Here, the single PD pulses are shown, which
are transmitted from the instrument. The time
axis (X-axis) can be zoomed from 2µs to 80µs.
With a fixed A/D conversion time of 10ns this
relates to 200 to 8000 values. Each value has
an amplitude resolution of 8 Bit. A range mark
can be found underneath the DSO-graph.
The right x-y-graph (LOC) displays the results of evaluated measurement curves. After the acquisition of multiple PD events, the
user has to process each pulse by positioning the three cursors (R, 1 and 2) within the
left graph. Marks for cable specific elements
like sleeves or terminations are also shown
in this LOC-graph at the lower frame. The
LOC graph can be switched off in the 'Window' menu.
The center of the screen shows one line with different control windows for the instrument and software
settings. These values can be set by the user directly.
The fields above the function buttons display actual processed values like the cursor position or the
charge and voltage value. The charge value is calculated by the single displayed PD pulse, whereas the
voltage value is taken from the HVM menu. Hence the charge meter must be calibrated within the DSO
again. The divider factor for the voltage meter is taken from the HVM menu.
The most frequently used functions are additionally placed at the bottom line. They can also be accessed
by the function button F1 to F12 (left to right).
After launching the program and entering the DSO panel, there are two applications possible:
a) Online measurement for cable testing
Pressing the 'Run DSO' button (or F1) will start a continuous online acquisition. This mode displays the
acquired curves quickest possible on the software, according to the transmission rate and the set trigger
mode.
b) Offline use for data evaluation
To evaluate recorded data, the software should be disconnected with the instrument by pushing the
button 'Offline'. This will disable the 'Run DSO' button and change the 'Start Scan' button to 'Start Replay'. Pressing this button opens a further window to select the stored measurement files. One file displays one fault within the cable. All relevant files should be added and are then opened in an extra window. Here two cursors can be set manually to determine the different fault locations. The results of this
evaluation is shown in the LOC graph (see above) by red bars, relating to the distance and number of
faults.
Power Diagnostix · Brüsseler Ring 95a · 52074 Aachen · Germany · Phone +49 241 74927 · Fax +49 241 79521 · www.pdix.com
ICMcompact
Partial Discharge Detector
35
Position
The displayed range of the x-axis can be shifted by the value
'Position'. Whereas the trigger is always set as zero position
of the x-axis and a pre-trigger time of 1µs is fixed by the instrument. However, while in the RUN-mode, the 'Position' will
change this pre-trigger time. In the HOLD-mode or when the
instrument is offline, the 'Position' will change the displayed
range but not the acquired data. 'Position' and 'Zoom' will be
adjusted in the HOLD-mode automatically if one value is out
of range.
'Position' will shift the x-axis. With
the default value of 0µs a pretrigger time of –1µs is displayed.
Fig.24: Screenshot of the DSO-graph
Range / Zoom
While in the RUN-mode this value defines the total range in µs. This time base should be kept short to avoid
unnecessary data transmission between the instrument and the software.
Example: The ideal range for a cable of 1.4 km length and a known pulse velocity of 165 m/µs
is between 18 and 20 µs. (2 x 1400m / 165m/µs = 16.97µs)
Due to the dispersion within the cable, the time range should be set 10-20% higher than calculated. This will
ensure to get the complete reflected signal. The value must be a multiple of 2µs and can not exceed 80µs.
The white bar underneath the DSO-graph indicates the maximum possible range. The gray bar indicates the
actual set range. Within the HOLD-mode, a light gray bar indicates the displayed range of the measured
data.
It is also possible to adjust the 'Position' and 'Zoom'/'Range' by the mouse cursor. The mouse arrow will
change to a hand for shifting the position or to a double-headed arrow for changing the range/zoom. The
colored lines underneath the bar (gray, green and blue) indicate the cursor positions within the DSO-graph.
The red 'T' stands for the trigger position and is fixed.
Position Rang
Fig.25: Marking of the range within the RUN-mode
Position
Zoom
and in the HOLD-mode.
The visible part within the HOLD-mode (zoom) can only be part of the acquired data (i.e.: zoom ≤ range).
Therefore the range during the measurement should be large enough to be able to zoom during the analysis.
Power Diagnostix · Brüsseler Ring 95a · 52074 Aachen · Germany · Phone +49 241 74927 · Fax +49 241 79521 · www.pdix.com
ICMcompact
36
Partial Discharge Detector
Gain, Trigger Level
The 'Gain' value defines the total amplification of the high frequent signal. The gain can be set between 1
and 80000 (0 – 98dB) in different steps. The trigger level ('Trg.Level') can be set between 0 and 100%. Both
values are only accessible in the RUN-mode. Some possible reason for a lack of a repeating signal on the
DSO-graph are listed as followed:
- gain level too low; the trigger level is not reached
- trigger level too high; with weak signals, a lower trigger level might be necessary
- no partial discharge activity; even with very high gain only noise signals are triggered-on
A sensible combination of gain and trigger level can be achieved by using a calibrator signal (like described
in chapter III.4). The trigger level should be set between 50% and 90% of the calibration signal. The gain
should be set, so that the reflection of the cable end is seen clearly and the first pulse is not too much overranged. For a later data analysis it is mandatory to capture at least one reflection.
green arrow: trigger o.k.
red arrow: no trigger,
gain too low or trigger
level too high
Trigger level in percent;
no distinction between
positive and negative
pulses; the arrow is
movable with the mouse
or settable by the
'Trg.Level' value.
Trigger mode selectable
between: Auto / Normal /
Single shot
automatic
gain adjustment
Fig.:26: Screenshot of a DSO-graph
Pushing the button 'A' next to the 'DSO Gain' will automatically adjust the total amplification. For this, the
gain is increased stepwise until the first signal reaches the trigger level.
The button next to the 'Trg.Level' ? selects the trigger mode. With the 'Auto' mode, the DSO-graph is updated continuously, independently of a trigger event. With the 'Normal' mode, only triggered signals are displayed. With the 'Single shot' mode, just one trigger event is shown (the first possible) then the software
turns to the HOLD-mode.
Max. Display
This value limits the indicating range of the x-axis within the LOC-graph. It is possible to choose a value
greater than the cable length, however a sensible range is limited by the 'Range' and the pulse velocity. The
maximum acquired length can be calculated by:
Max.Display max =
VC ⋅ Range
2
Power Diagnostix · Brüsseler Ring 95a · 52074 Aachen · Germany · Phone +49 241 74927 · Fax +49 241 79521 · www.pdix.com
ICMcompact
Partial Discharge Detector
37
Calibration of the cable length (Cable Len.)
The values for the cable length and the pulse velocity can be entered in the fields directly, if known. If only
one value is known, the second value can be determined with a calibration measurement.
The selection of the calibrated value is done in the
menu: DSO Panel / Options / Calibration Mode / Length.
If the pulse velocity of the cable type is known it can be entered in the related field. The cable length can
then be calibrated by injecting an impulse at preferably the near end of the cable.
For this an impulse generator (CAL1A, CAL1B or equivalent) must be connected to the coupling unit. During
the calibration the high voltage must be turned off, otherwise the impulse generator might be damaged. To
get continuously new curves on the graph, the software must be connected (‘Online’) and put into the ‘RUN’
mode. While injecting a pulse with the calibrator, the gain and the trigger level should be adjusted so that a
triggered pulse is seen. The range should be adjusted in the way that the first reflection of the pulse at the
cable head is seen clearly.
Fig.27: Cursor positioning for length calibration
The gray cursor labeled 'R' can now be placed at the
beginning of the first pulse, which is around 0.0µs(see
fig.27). The blue cursor labeled '2' should be placed at
the beginning of the first pulse reflection from the cable
head. The green cursor ('1') is not used during the calibration. Now the 'Start Calibration' button (or F7) should
be pressed. After selecting a suitable folder and number
of files to be recorded (usually one is sufficient), the
record starts. Each triggered curve is saved in a separate *.dso file, and the position of the blue cursor (‘2’)
within this graph is transferred to the LOC graph (right)
and summed up in the red bars. Finally the calibration
files can be saved together with further information
about the specimen (Report) in a *.cfl file. After the acquisition has finished, the cable length is automatically
calculated by the entered velocity (Vc) and the tallest red
bar.
Calibration of the pulse velocity (Vc)
If the cable length is known, the pulse velocity can be calibrated. For this a calibration as described above should be done. With a double click of the left mouse
button at the position of the red bar a new window will pop up. By entering the
precise cable length into this window, the pulse velocity will be calculated automatically.
Fig.28: Vc calibration
Calibration of the charge value (Qp Cal)
The button 'Qp Cal' within the charge meter allows to calibrate the current DSO curve.
The entered PD value will be assigned to the area underneath the triggered pulse. Thus,
this charge value represents the single displayed curve, whereas the charge value
shown in the Main panel represents the peak charge value since the last data refresh.
Power Diagnostix · Brüsseler Ring 95a · 52074 Aachen · Germany · Phone +49 241 74927 · Fax +49 241 79521 · www.pdix.com
ICMcompact
38
Partial Discharge Detector
Description of the Functions
The function keys at the bottom of the window offer the major functions needed for a cable fault location. In
the following these are described in detail as well as the different conditions of the program. Active function
keys are marked with dark gray. The keys are labeled with the function that will start when pressed. They are
not showing the current state of the program. E.g if the program is in the HOLD-mode, the first key (F1) is
labeled RUN. By pressing this button, the program turns to the run-mode (starts the acquisition) and the
button is labeled HOLD. Without a serial connection to an instrument, the program can not be turned into the
RUN-mode.
Fig.29: Offline (instrument not connected)
Fig.30: Offline, Replay function started
Fig.31: Online, in RUN-mode
Fig.32: Online, in RUN-mode with Scan- and Calibration function started
Run / Hold DSO (F1, Ctrl+u or Ctrl+o)
The program has two states for the DSO-graph. With the first state ‘RUN’ the program takes continuously
data from the instrument. Depending on the trigger mode, the DSO-graph is updated continuously as well.
Three trigger modes can be selected by pushing the arrow ? next to the 'Trig. Level' field:
- With the AUTO mode selected, each transmitted curve is displayed.
- With the NORM mode selected, only triggered curves are displayed.
- With the SINGLE mode selected, only the first triggered curve is displayed, then the program turns to the
HOLD mode.
The HOLD mode always displays the last triggered curve or last file which was loaded. The program must be
in the HOLD-mode to start a replay of recorded data.
Power Diagnostix · Brüsseler Ring 95a · 52074 Aachen · Germany · Phone +49 241 74927 · Fax +49 241 79521 · www.pdix.com
ICMcompact
Partial Discharge Detector
39
Start/Stop Replay, Start/Stop Scan (F2, Ctrl+A)
The second function key (F2) changes its function depending on the program status. Here are one of the
most important functions for the data acquisition (SCAN) and evaluation (REPLAY). Only if the software has
an online connection to the instrument, the SCAN-function can be used. While ‘offline’, the REPLAY-function
is available. Both functions are closely linked.
The SCAN-function saves measurement data in different files. These files will have the extension ‘*.dso’ and
can be loaded and processed later, while the software is offline. The dso-files contain only raw data to minimize the memory requirements.
Fig.33: Settings entry window
Fig.34: File selection window
After the SCAN-function is started, a window like the one shown in fig.33
pops up. The entry ‘Data Directory’ defines the destination folder where all
recorded files are stored. It can either be entered manually, or chosen from
the existing folder structure by the button ‘Browse’. The entry ‘File Prefix’
defines the name of the data-files. The later file-name is put together from
the entry in 'File Prefix', the chosen 'Phase' name, a consecutive number,
and the extension '.dso'. The quantity of files recorded can be set in the
'Max. File Number' field. A value between 1 and 1000 can be chosen. The
option 'Scan non triggered' allows to save also files which are not generated
by a trigger event of the pulse. This option might be helpful, if heavily distorted signals are present and a firm triggering to dominant PD pulses is not
possible. With this option, randomly taken data are recorded and analyzed
later. For this, the 'range' should be long enough to search for PD pulses
and their reflections within the data stream. The acquisition is started by the
'Ok' button and stopped by the 'Cancel' button or if the number of files is
complete.
The Replay-function can only be started if the instrument is offline. It will
open a sub-window in which the scanned data-files can be selected. It must
be pointed out that only data with the same time-range should be selected
at once.
After confirming the selection with the OK button, a new sub-window opens. Here the recorded graphs are
shown one after the other together with two cursors. The path and filename of the current displayed graph is
shown in the upper right hand corner. Now the user can place the gray cursor at the base of the trigger-pulse
(around 0µs). The red cursor should be placed at the base of the
first reflection of that pulse. 'Select' will take this cursor interpretation, save the cursor positions, and put one red bar into the
LOC-graph of the main window. If there is already a red bar at
that position, it will increase the length (number) of this bar. 'Select All' will take the saved cursor positions of all selected files
and add the results to the LOC-graph in the main window. This
should only be done, if an interpretation of the graphs was already done and saved in the *.dso files. 'Skip' will ignore the
displayed graph and move to the next selected one without action. 'Back' moves one selected graph back and deletes the last
result in the LOC-graph, e.g. to correct a misinterpretation. 'Delete File' will remove the displayed file from the disc. With 'Save
File As', the current file can be copied and renamed. 'Cancel'
Fig.35: Replay window for data analysis
stops the whole replay function.
Power Diagnostix · Brüsseler Ring 95a · 52074 Aachen · Germany · Phone +49 241 74927 · Fax +49 241 79521 · www.pdix.com
ICMcompact
40
Partial Discharge Detector
Each selected file is automatically counted in the LOC-graph. The position of the red cursor determines the
marking of a defect within the LOC-graph.
Report (F3, Ctrl+R)
This report is saved together with each *.CFL file created by the 'Save'
(F5) function. It allows the user to add comments and further information
to the measurement data. The report will be printed and exported to textfiles. 'Set Date&Time' places the current PC time into the related entries. 'Load Report' allows to change the *.dso graph which is saved
together with the report data. 'Edit Accs' (Edit Accessories) opens a
further sub-window where the 'List of Accessories' can be changed.
They are also saved with the CFL-file. With the 'Browse Data Dir' the
destination of the CFL file can be changed. 'Export' will save the report
data as a standard ASCII file (*.txt).
Fig.36: Report entry window
Load (F4, Ctrl+L)
In the offline-mode saved files can be loaded and displayed. Both types can be loaded, the pure scanned
graphs (*.dso) and the project files (*.cfl). The project files contain the last displayed DSO graph together
with the setup information of the instrument, the report entries, as well as the fault location within the LOC
graph.
Save (F5, Ctrl+S)
Saves the currently displayed data in an *.cfl file.
Search / Offline (F6, Ctrl+E)
This function connects or disconnects the link to an ICMcompact instrument. During the connection all selected ports are scanned for possible instruments. This are by default the ports COM1 and COM2, however
up to 16 COM ports as well as GPIB and virtual LAN ports can be selected. The selection can be changed in
the MAIN Panel / Options / Interface Settings / RS232 or GPIB or LAN. During the program launch and when
changing the panel, the search function is activated automatically.
Start Calibration (F7, Ctrl+B)
This function calibrates either the cable length or the pulse velocity. A detailed description is given on page
37. The calibration of the charge magnitude is done by the ‘Qp Cal’ button within the ‘Charge’ meter.
Whereas the voltage magnitude can be adjusted by the 'Divider' button within the voltmeter.
Start LOC (F8, Ctrl+T)
This function starts the fault-location (LOC / Location). To activate the automatic mode, the option 'Options /
LOC Graph / Calculations / Auto' must be selected. The processing of the measurements is based on the
correlation frequency-distribution and the results are shown in the right-hand graph (LOC-graph). Each triggered curve which can be seen in the DSO-graph is put into correlation with a reference pulse. This reference pulse was prior artificially 'aged' i.e. the dispersion of the cable is already taken into account. After the
correlation, the maxima are put together in a three-dimensional field. With an increasing measuring time, the
reflection position will show accumulation points. The sum of this accumulation points within on segment of
the x-axis are pictured by red vertical bars also called projections within the LOC-graph. But only points
which exceed the set level are taken into account. This level can be seen as red arrow next to the LOCgraph.
The most frequent maxima (also called peak distribution) are indicated as faulty positions underneath the
LOC-graph next to 'Pos1'... 3. Via the menu 'Options / LOC Graph' different results can be shown or disabled. Two cursor can here be activated to 'measure' distances. The results of the cursor distances are
shown underneath the LOC-graph. Also the sensitivity for the projections (red bars) can be adjusted.
Power Diagnostix · Brüsseler Ring 95a · 52074 Aachen · Germany · Phone +49 241 74927 · Fax +49 241 79521 · www.pdix.com
ICMcompact
Partial Discharge Detector
41
The LOC function is automatically started with the replay of saved measurements. It must be pointed out,
that the counting within the LOC-graph starts from the far end. The display range for the x-axis
('Max.Display') should always be larger than the cable length, otherwise faults can be overlooked.
Note: The automatic analysis of the curves (correlative peak distribution) should not be the only criterion for the fault location. To verify the results the original DSO curves, the installation plan and the
impact of disturbances should be taken into account!
If the software is offline, the 'Start LOC' button will start the manual fault location as does the button 'Start
Replay'.
Main Panel (F9, Ctrl+P)
This button changes the instrument back to the PD mode, the software will also change it's acquisition mode.
One brief interruption during this switch is usual.
Exit (F10, Ctrl+X)
The program is terminated by the EXIT button.
Menu Options
Some additional functions are accessible via the menu block at the top of the program window. In the following those functions of the menu block are described, which are not accessible within the main user interface.
With the buttons 'PgUp' and 'PgDown', the next respectively previous
DSO file can be loaded from the current folder. The program has to be in
the offline mode. A brief message will give a warning, if no DSO file can
be found in the selected folder.
Fig. 37: Pull down menu 'File'
The function 'Export Results' will put the calculated fault positions, shown
in the LOC graph, into an ASCII text file. The 'Report' data are also added.
With the function 'Default Directory', a folder can be selected which is automatically opened with the 'Load'
or 'Save' function.
The menu 'Edit' offers functions like 'Copy DSO', 'Copy LOC' and 'Copy
DSO+LOC' to put one or both graphs into the Windows clipboard. From
here, they can easily be exported into other programs by 'Ctrl+V'.
Fig. 38: Pull down menu 'Edit'
The basic settings for a scan can be changed without starting a scan and
even without being online by the 'Scan Settings' menu.
The 'List of Accessories' is a helpful tool to add information into the LOC-graph. In here, cable accessories
like sleeves, junctions or terminations can be added and will be shown as small icons within the LOC-graph.
The pull down menu ' Acquisition' repeats functions, which are already described on the previous pages.
The LOC-graph on the right hand side can be disabled to enlarge the
DSO-graph. This is helpful, especially with long cable specimen to get a
better resolution for the positioning of the measurement cursor. By default
the 'DSO+LOC' is set to see both graphs.
Fig.39: Pull down menu 'Window'
Power Diagnostix · Brüsseler Ring 95a · 52074 Aachen · Germany · Phone +49 241 74927 · Fax +49 241 79521 · www.pdix.com
ICMcompact
42
Partial Discharge Detector
The 'Pulse Velocity' (propagation speed of electrical signals within the
cable) can be displayed as absolute value 'v' or as halved value 'v/2'.
The units in which length and speed are shown, can be altered between
the 'SI-System' (MKS = meter, kilo, second) and the 'fps-System' (= feet,
pounds, second).
Fig. 40: 'Options \ Pulse Velocity'
If the 'Sliding Average' is 'on', multiple acquisitions of the DSO graph are
averaged before they are displayed. For this it is necessary to trigger always to the same fault signal.
Fig.41: 'Options \ DSO Graph'
The 'Trigger Mode' allows to select 'Auto', 'Normal' and 'Single Shot'. This
mode affects the repetition of the acquired graphs.
The cursor within the DSO-graph can be hidden 'off' or shown 'on', so can
the cursor within the LOC-graph.
Most of the settings refer to the LOC-graph.
The analysis of the LOC-graphs 'Calculation Mode' can be done automatically or manually. However, if the graph is more complex it is recommended to do a manual analysis to avoid misinterpretations.
Fig.42: 'Options \ LOC Graph'
By the physical properties of TDR, the cable measurement always starts
from the far end i.e. the opposite end with no sensor. Therefore the default
display also measures and shows the results from the 'Far End'. However,
the 'Mapping Reference' can be changed to start with the 'Near end'.
This will be indicated by a capacitor symbol as sensor at the zero position
of the cable.
Fig.43: Coupling capacitor symbol
Fig. 44: 'Options \ LOC Graph'
The 'Peak Distribution' shows each measurement result by a small 'x'.
This function can be enabled ('Visible') or disabled ('Not Visible').
The 'Projections' (red bars) indicate the quantity of measured faults at
one cable position. They also can be shown ('on') or hidden ('off').
The 'Projection Sensitivity' defines kind of summation. Depending on the
setting 'High', 'Medium' or 'Low', the segments in which the peak distribution is summed up as one red bar can be changed. A 'High' projection
sensitivity results in small segments which will increase the total number
of red bars and decrease the number of counts.
When exporting the data from the LOC-graph and the Report entries, the
selection 'Export File' allows to suppress pulses from the cable ends
('Suppress End Reflections'). This is helpful, if the user is only interested
in faults within the cable and doesn't want to see pulses from the cable
terminations.
Fig. 45: 'Options \ Export File'
With 'Language' the inscription of the software as well as in the report files can be changed between English, German and Spanish. Some shortcuts used with 'ALT+...' will change also. Generally the letter which is
underlined on a function button can be used as a shortcut. Outside the pull down menu the 'ALT' button has
to be pressed while using the shortcut letter. Within the pull down menu the underlined letter can be pressed
directly to jump into the specific function.
Power Diagnostix · Brüsseler Ring 95a · 52074 Aachen · Germany · Phone +49 241 74927 · Fax +49 241 79521 · www.pdix.com
ICMcompact
Partial Discharge Detector
43
III.3.3.3 Calibration for the TDR
Before raising the voltage on a cable for the actual PD location, a TDR snapshot is done for calibrating the
PD magnitude. This can also provide information on the length of the cable, locations of joints, condition of
the neutral wire, and the level of sensitivity you can expect to obtain with PD measurements. For the calibration followed calibrators are recommended to use:
XLPE (Polymeric Cable) ⇒ CAL1B (0.1 to 10 nC)
or CAL1D (10 to 1000pC)
Mass Impregnated Cable ⇒ CAL1B (0.1 to 10 nC)
or CAL1E (1 to 50pC)
Laboratory Measurements ⇒ CAL1A (1 to 100 pC)
A list of all available calibrators can be found in chapter III.4.1.
Caution: For calibration the system has to be de-energized.
With the cable de-energized the calibrator has to be connected to the conductor and neutral by two short
leads at the near end of the cable (see figure 46). After increasing the gain of the ICMcompact, the magnitude of the calibration pulse should be increased until the pulse reflections are visible. Either the pulse velocity (Vc) of the cable or the cable length can be determined by the instrument or the software.
cable length
Near End (Coupling Unit)
Far End (Open)
Fig.46: Connection of the Calibrator
2x cable length
In the example given in figure 47 the
pulse velocity (vC = 192 m/µs) was
inserted. After the two cursors were
positioned, the cable length (∆X2 =
155 m) was calculated.
It is also possible to calculate the pulse
velocity if the cable length is know.
Fig. 47: Time Diagram taken from the ICMcompact software
Power Diagnostix · Brüsseler Ring 95a · 52074 Aachen · Germany · Phone +49 241 74927 · Fax +49 241 79521 · www.pdix.com
ICMcompact
44
Partial Discharge Detector
Measurement example with the TDR
The next figures show measurement examples of a cable having a cable joint. In figure 49 a joint was detected at 95,7m measured from the far end.
Cable Joint
Near End (Coupling Unit)
Joint Distance
Far End (Open)
Fig.48: Joint location
2x Joint Distance
Fig. 49: Joint location on a cable
Power Diagnostix · Brüsseler Ring 95a · 52074 Aachen · Germany · Phone +49 241 74927 · Fax +49 241 79521 · www.pdix.com
ICMcompact
Partial Discharge Detector
45
Once the cable length has been specified and the joints are located, the cable can be energized. Figure 51
shows a measurement with one fault at 185,3m taken from the far end. Consider that the distance is now
st
nd
nd
rd
taken between the 1 and 2 cursors and not between the 2 and 3 , like at the calibration.
Pulse Source
Distance Fault Location
Near End (Coupling Unit)
Far End (Open)
Fig. 50: PD location on a cable
2x Distance Fault Location
Fig. 51: Time Diagram of a PD location
Power Diagnostix · Brüsseler Ring 95a · 52074 Aachen · Germany · Phone +49 241 74927 · Fax +49 241 79521 · www.pdix.com
ICMcompact
46
Partial Discharge Detector
III.3.3.4 Functions for the DSO
To get a proper PD pulse, the gain and trigger values have to be set correctly. These factors are independent from the calibration factor described in chapter III.4.3. Figure 52 shows an example of a triggered PD
pulse with all its echoes taken from a HV test cable. Setting the trigger level and the amplification can be
done in the submenu TRG_M, which is found
under the main menu MAIN_D. The Gain has to
be increase until a trigger event occurs. Pushing one of the two gain buttons (GAIN+ / GAIN) will display the absolute gain value at the upper right border of the screen for a short moment (Provided a preamplifier is connected).
The Gain can be set from 2 to 80000 in 17
steps. With a very high amplification the trigger
level reaches the range of the input noise. The
trigger level should be set between 50 and 90
percent of the y-axis range. Pushing the trigger
Fig. 52: Set Trigger Level
buttons (TRG+/TRG-) will display the trigger
level as a horizontal line for about 3 seconds. The trigger makes no difference between positive or negative
pulses, it is an absolute value. For better evaluation it is necessary to see the area in front of the trigger
pulse. This pretrigger is fixed to 1µs (100 samples).
Fig.53: Indicator for the Displayed Area
For the cable fault location it is mandatory to
use a preamplifier with a high bandwidth. Power
Diagnostix offers for this application the preamplifier RPA1L or RPA1H (40kHz-20MHz). The
higher bandwidth is necessary to measure the
pulses and its reflections running over the HV
cable without attenuation and distortion of the
preamplifier. The time-distance of the pulses is
the decisive criteria for the location. Parameters
like pulse velocity or cable length will be
needed to calculate precisely the fault position
within the cable. These settings can be
changed with the menus SPEED or LENGTH.
The user can select between the units meter or
feet within the menu UNIT. This submenu can
be entered via the setup menu SETUP3.
Power Diagnostix · Brüsseler Ring 95a · 52074 Aachen · Germany · Phone +49 241 74927 · Fax +49 241 79521 · www.pdix.com
ICMcompact
Partial Discharge Detector
47
After setting the correct trigger and gain, the PD pulse becomes visible. The triggered pulse and two reflections
should be displayed before going on with further evaluations. Adjust the zoom if less or more reflections are
visible.
After a single PD pulse is captured and hold (menu MAIN D, HOLD), the current display can be zoomed in.
Each step of zooming (ZOOM+ / ZOOM-) will increase or decrease the visible part by 2µs (200 Samples).
The black stripe at the lower side of the display illustrates the relation of visible time to the total acquired time
of 80µs (60µs). Shifting the left position of the visible area by pushing the buttons POS>> or POS<< enables
to analyze the complete wave in a high resolution.
The easiest way to evaluate the pulses is using
the cursor functionality for the display. Two cursors are supported. Each of them can be set
individual to a time position by pushing the buttons POS>> or POS<< within the menu
CURSOR. Select first the cursor by pressing the
upper button (CURS1 or CURS2). Always the
active cursor will be marked with a black filled
triangle at the upper end of the vertical dotted
line. It is best to hold first the running acquisition
before setting the cursors. Moving the cursors
will automatically calculate the new time distance
Fig. 54: Cursor Measurement on a PD pulse
and the result for the distance in meter (feet).
These values can be read off from the upper border of the display. The distance on the HV cable is measured
beginning from the far end of the measurement point (also see chapter III.3.2.1). A sensible result can only be
ensured if the pulse velocity is set correctly.
Fig.55: Cursor Settings: Length and Velocity
The pulse velocity can be calculated if the cable
length is know. For this a calibration impulse has
to be injected into the near end of the cable.
Caution: For calibration the HV supply has to be
turned off!
Once the trigger is set to the first (largest) pulse,
also the echoes become visible. Setting one
cursor to the first pulse and the other to the second pulse will read the calculated cable length.
Within the menu LENGTH the precise cable
length can be set. The pulse velocity is then
calculated automatically using the settings of the
cursors which are displayed at the upper right
hand side.
Another possibility to get the specimen settings is to modify the pulse velocity directly. This can be done in the
menu SPEED which is accessible from the menu MODE_D. This function is useful if the cable length is not
know but the type of cable. A calibration is not obligatory.
Power Diagnostix · Brüsseler Ring 95a · 52074 Aachen · Germany · Phone +49 241 74927 · Fax +49 241 79521 · www.pdix.com
ICMcompact
48
Partial Discharge Detector
III.3.3.5 Key Menus for the DSO (Overview)
Followed menus are accessible with an ICMcompact including the DSO for cable fault location.
GN/TRG
HOLD
MODE
SCOPE
SETUP
MAIN D
GN/TRG
Pushing this button changes to the submenu TRG_M. Within that menu the user can set
the gain and trigger level for the PD display in time domain (DSO display).
HOLD / RUN
Pushing this button switches between Hold and Run mode for the DSO display.
MODE
Pushing this button changes to the submenu MODE_D. This submenu gives access to
several settings of the DSO display as zoom, position and cursor settings.
SCOPE / METER
Depending on the switched on displays (see menu DISPL) this function switches o the
next display type.
SETUP
Pushing this button changes to the SETUP menu. As there are several setup menus, this
function enters ever in the last setup you’ve been once before.
ZM/POS
CURSOR
SPEED
UNIT
EXIT
MODE D
ZM/POS
Pushing this button changes to the submenu ZM/POS. Within that menu the user can set
the zoom and the zero position for the DSO display.
CURSOR
Pushing this button changes to the submenu CURSOR.
SPEED
Pushing this button changes to the submenu SPEED.
UNIT
Pushing this button changes to the submenu UNIT.
EXIT
Pushing this button changes to the setup menu MAIN D.
GAIN+
GAINTRGL+
TRGLEXIT
TRG_M
GAIN+/GAINPushing this button increments / decrements the total gain (details see above). These
settings are independent from the gain settings in the menus SCOPE and METER.
TRG L+/TRG LPushing this button displays and changes the trigger level. More details are described
above.
EXIT
Pushing this button changes to the MAIN D menu.
Power Diagnostix · Brüsseler Ring 95a · 52074 Aachen · Germany · Phone +49 241 74927 · Fax +49 241 79521 · www.pdix.com
ICMcompact
ZOOM+
Partial Discharge Detector
49
ZOOM+ / ZOOMWith these buttons the zoom can be adjusted. More details are described above.
ZOOMPOS>>
POS<<
EXIT
ZM/POS
CURS 1
POS<<
POS>>
LENGTH
EXIT
CURSOR
LEN+
LEN-
EXIT
POS>> / POS<<
With these buttons the displayed position can be adjusted. More details are described
above.
EXIT
Pushing this button changes to the setup menu MODE D.
CURS 1, CURS 2
Pushing this button toggles between the two cursors. The selected cursor is indicated by
a black filled triangle at the upper end of the dotted cursor line.
POS<<, POS>>
Pushing this button will shift the selected cursor to the corresponding side. If the cursors
are out of the display, push POS<<, POS>> or increase the ZOOM-.
LENGTH
Pushing this button changes to the menu LENGTH for setting up the cable length.
LEN+, LENPushing this button changes the setting for the cable length. The calculated value for the
distance between the two cursors can be set accordingly. This will change also alter the
pulse velocity. Please regard the calibration described above.
EXIT
Pushing this button changes to the menu CURSOR.
LENGTH
SPEED+
SPEED-
EXIT
SPEED+, SPEEDPushing this button changes the setting for the pulse velocity. This value is used to calculate the distance of the cursors.
EXIT
Pushing this button changes to the setup menu MODE D.
SPEED
>m
ft
>mV
pC
EXIT
m, ft
Pushing this button enables (>) the relevant system unit. This setting is only accessible
when the optional DSO is implemented.
mV, pC
Pushing this button changes the shown measurement value within the DSO panel.
'mV' is the peak value of the shown curve (single PD pulse),
'pC' is the peak charge value as shown in the SCOPE or METER display.
UNIT
EXIT
Pushing this button changes to the setup menu MODE D.
Power Diagnostix · Brüsseler Ring 95a · 52074 Aachen · Germany · Phone +49 241 74927 · Fax +49 241 79521 · www.pdix.com
ICMcompact
50
Partial Discharge Detector
III.3.4 MUX - Channel Multiplexer (optional)
Instruments with a built in (MUX) multiplexer are able to switch between 4 or 12 different channels. The front
panel of an instrument with this option includes five extra buttons labeled ‘∆ AMP ∇’, ‘∆ SYNC ∇’ and
‘LOCK’. These buttons enable to directly select one of the 4 or 12 signal sources. Hereby the partial discharge signal (AMP) and the voltage signal (SYNC) are split and can be selected separately. The gain setting, calibration factor and divider factor (if HVM is installed) are stored separately for each channel.
Fig. 56: ICMcompact with MUX (multiplexer) and HVM
Fig.57: Status Display
In the lower right hand corner the selected channel is displayed. The first number indicates the AMP channel
for the PD signal. The next number shows which channel is taken for the SYNC or voltage measurement. To
avoid an unintended change of the channels, the 5 extra buttons can be locked and unlocked by the button
‘LOCK’. This is indicated in the display by an ‘L’. In the example in Fig. 57 channel 1 is selected for the PD
signal, channel 4 for voltage measurement and synchronization. And the right keyboard is locked.
Fig. 58: Back panel of the ICMcompact with MUX4 and AUX input
Two main multiplexer are available for the ICMcompact:
1) 4x AMP and 4x SYNC
2) 12x AMP and 12x SYNC
(with external remote controlled box RB2/24)
Power Diagnostix · Brüsseler Ring 95a · 52074 Aachen · Germany · Phone +49 241 74927 · Fax +49 241 79521 · www.pdix.com
ICMcompact
III.3.5
Partial Discharge Detector
51
AUX - Auxiliary Inputs (optional)
Up to 8 auxiliary input channels (AUX) can be ordered for the ICMcompact. These inputs can be used to
record extra signals like power, temperature, pressure etc. Commonly used input levels of either 4 to 20mA
or 0 to 10VDC are available. The rear panel of the instrument has one BNC
connector for each AUX channel, as can be seen in figure 59.
Caution: The AUX inputs are only to be connected with their designed
signal magnitude. Overvoltage (e.g. from the signal for the SYNC input)
might harm your instrument.
Fig. 59: AUX input connectors
A serial interface (RS232) is used to link the ICMcompact instrument with
the software, running on a standard PC. With this ICMcompact software it
is possible to label and scale the AUX inputs. Figure 60 shows the setup
frame for a 2 channel system. Within the main frame of the software the
processed AUX values are displayed together with the PD pattern and the
voltage values (if the HVM is installed). Long term records of the PD, voltage and AUX data are easily done and can be exported to standard data
file format. However, to access the AUX signal data, the ICMcompact
software is mandatory.
Fig. 60: Screenshot
III.3.6
STP - Additional Setups (optional)
If the ICMcompact is frequently used at different places, the optional function STP can store up to 12 different setups. Three extra buttons are added to the front panel to swap between the different setups. The top
buttons ‘∆ SETUP ∇’ will change the setup number, whereas the lower button will lock this function. The
current setup number is shown in the lower right corner
Fig.61: ICMcompact with twelve selectable setups
Power Diagnostix · Brüsseler Ring 95a · 52074 Aachen · Germany · Phone +49 241 74927 · Fax +49 241 79521 · www.pdix.com
ICMcompact
52
Partial Discharge Detector
III.3.7 LOG - Logarithmic amplifier (optional)
When capturing PD signals offering a larger dynamic range, e.g. in a GIS (gas insulated switchgear) the
ICMcompact can be ordered with a logarithmic scaling. For this, a logarithmic preamplifier, the RPA6C is
required. This preamplifier also has the advantage to
capture PD signals in a high frequency band
(300MHz to 2GHz). Since the preamplifier itself has a
large dynamic range, there is no need for adjusting
the gain during measurements. Therefor, the functions ‘GAIN + and ‘GAIN –‘ are replaced by ‘Range +’
and RANGE –‘. Using this buttons will not change the
amplification of the signal, it just changes the range of
the logarithmic scaling on the display. Figures 62 and
40 shows a 50pC calibration pulse in the meter and
scope display mode.
Fig. 62: Meter menu with logarithmic scaling
Since the RPA6C has got a fixed bandwidth of
300MHz to 2GHz, the internal filter settings are disabled. Be aware that PD pattern will look different on
a logarithmic scaling and need some experience for
the analysis.
Fig.63: Scope menu with logarithmic scaling
Fig. 64 Calibration mode
While the gain setting is disabled in the measurement
menus, it is however possible to adjust the internal
gain to the application. This has to be done before the
system is calibrated. A later change of the gain will
need a new calibration. The calibration should be
done with a simulated PD pulse close to the expected
PD in respect of location and magnitude (see also
chapter III.4). The gain should then be set to about
50% of the maximum input level. This signal input
level is indicated by L=50%. Then the injected PD
pulse magnitude can be set with ‘CAL +’ and ‘CAL –‘.
After pressing one of the ‘CAL’ buttons, the calibration
factor is calculated and stored in a non-volatile memory.
Power Diagnostix · Brüsseler Ring 95a · 52074 Aachen · Germany · Phone +49 241 74927 · Fax +49 241 79521 · www.pdix.com
ICMcompact
III.4
Partial Discharge Detector
53
Calibration
PD measurements refer to the apparent charge and are relative measurements. Therefore, each new
installation, changes of relevant quantity (e.g. bandwidth, coupling capacitance etc.) requires a new
calibration. This is done by injecting a known PD pulse close to the origin of the real PD source (test object)
and from this calculating the scale factor for the measurement. The injected PD pulse should be in the range
of 50% to 200% of the expected PD magnitude.
III.4.1 Calibration Impulse Generator
There is a broad range of impulse generators offered by Power Diagnostix for different purposes. Table 2
gives an overview of these calibrators. All calibrators allow the calibration of PD measurements according to
IEC60270 / 2000, except the CAL2B. Since the CAL2B has left out the injection capacitor to enable
calibration on GIS.
Calibration
Impulse Generator
Range
Output
Frequency
CAL1A
1, 2, 5, 10, 20, 50, 100pC
Injection Capacitor <1pF
50Hz (60Hz)
CAL1B
100, 200, 500pC, 1, 2, 5, 10nC
Injection Capacitor <100pF
50Hz (60Hz)
CAL1C
1, 2, 5, 10, 20, 50, 100pC
Voltage output (50Ω)
50Hz (60Hz)
CAL1D
10, 20, 50, 100, 200, 500, 1000pC
Injection Capacitor <10pF
50Hz (60Hz)
CAL1E
0.5, 1, 5, 10, 20, 50nC
Injection Capacitor <500pF
50Hz (60Hz)
CAL1F
0.2, 0.5, 1, 2, 5, 10, 20nC
Injection Capacitor <200pF
50Hz (60Hz)
CAL1G
0.02, 0.05, 0.1, 0.2, 0.5, 1, 2 nC
Injection Capacitor <20pF
50Hz (60Hz)
CAL2A
0.5, 1, 2, 5, 10, 20, 50pC
Injection Capacitor <1pF
50Hz (60Hz)
CAL2B
0.5, 1, 2, 5, 10, 20, 50V
(into RL=50Ω)
Voltage output (50Ω)
50Hz (60Hz)
CAL2C
0.2, 0.5, 1, 2, 5, 10, 20V
(into RL=50Ω)
Voltage output (50Ω)
50Hz (60Hz)
Tab. 2: Output and Frequency Ranges of PD calibrators
Power Diagnostix · Brüsseler Ring 95a · 52074 Aachen · Germany · Phone +49 241 74927 · Fax +49 241 79521 · www.pdix.com
ICMcompact
54
PD •
Range
Partial Discharge Detector
Power Diagnostix Systems
All calibrators are switched on with the pushbutton On/Off. Both amplitude
(Range) and polarity (Pos/Neg) of the single charge pulse per cycle are displayed and can be adjusted by pressing of the two buttons. The instrument is
synchronized to line frequency by a photo diode. In case of insufficient pickup of power frequency light, it will select automatically the internal quartz
oscillator (50Hz and 60Hz versions available). The button On/Off must be
pressed for more than 1 second to switch the pulse generator off, while
automatic switch-off occurs after approximately 15 min.
Operation time of up to 200 hours are obtainable with the 9V lithium battery
due to an average supply current of approx. 5mA (quiescent current is negligible). An alkaline battery resulting in approx. 90 hours of continuous operation may replace the lithium battery. A weak battery is indicated by the LO
BAT sign of the LC display.
Pos / Neg
On / Off
Warning: While changing battery, be aware of internal parts carrying up to
125V of DC potential!
0311000
DKD-K31101
03-11
Power Diagnostix delivers their standard calibrators with a fully traceable
DKD calibration (DKD-K-31101). This calibration certificate documents the
traceability to national standards, which realize the units of measurement
according to the International System of Units (SI). The DKD (Deutscher
Kalibrierdienst) is signatory to the multilateral agreement of the European cooperation for Accreditation (EA) for the mutual recognition of calibration certificates.
Fig. 65: Calibrator
III.4.2 Calibration test set up
The entire signal path from the discharging source to the instrument, as well as some instrument properties as filters, for instance, are introducing an overall attenuation which is not precisely known. Thus the
calibrator (CAL1A or equivalent) has to be connected to the actual PD source as close as possible. Figure
66 shows an example of a calibration circuit diagram.
Filter
High
Voltage
Supply
Calibrator
Specimen
Coupling
Capacitor
ICM
CIL
RPA
Fig. 66: Example of calibration set up
To calibrate a test setup where a current transformer (as CT1 or CT100) is used, place the positive clip of
the calibrator on the high voltage side of the test object, and the negative clip of the calibrator on the low
voltage side of the test object. This will ensure that the calibration pulse will take the same signal path as
the actual PD pulse.
Power Diagnostix · Brüsseler Ring 95a · 52074 Aachen · Germany · Phone +49 241 74927 · Fax +49 241 79521 · www.pdix.com
ICMcompact
Partial Discharge Detector
55
III.4.3 Calibration menu
The ICMcompact offers a calibration menu (CAL) which can be found as first item in the menu SETUP1. To
have the complete information for doing the calibration, it is best to be in the SCOPE display. However, the
menu CAL is not available, when the optional displays HVM, or DSP are visible. Fig. 67 shows the
calibration menu in the SCOPE mode.
Fig. 67: Scope Display during Calibration
Once the calibration pulse is displayed on the
screen, GAIN+ and GAIN− should be used to
place the calibration signal reading between
50% and 90% of full scale (i.e. 4 divisions,
since maximum is at 5 divisions). The CAL+
and CAL− buttons then adjusts the calibration
value (shown in the upper part of the display).
This value has to be set equal to the one on
calibration impulse generator. The calibration
factor (CF) is calculated accordingly. There is
no possibility to make it undo!
Calibration factor and all other parameters remain stored when the system is switched off and are
automatically recalled when the system is switched on again. Be sure, that the calibration is only changed in
case of test setup modifications to keep the integrity of the monitoring results.
If the calibration factor is known from previous
calibrations or from an identical test setup, it is
also possible to directly enter this value. In the
menu ‘CALF’, the calibration factor can be
entered directly. For this change, it is not
necessary to adjust the gain, since there is no
processing of the measurement value. The
calibration factor (CF) is displayed in the top
left corner and relates to a virtual gain of 1.
Fig. 68: Setting the calibration factor
The software ICMcompact and HVpilot offers to save the whole instrument settings (as *.cmp rep. *.hvp) and
thus enables to repeat a test with same the settings and calibration. For using a stored calibration, it has to
be ensured, that the test circuit is the same. For saving and loading the instrument settings, see the
respective software manual.
Caution: For calibration the system has to be de-energized.
Power Diagnostix · Brüsseler Ring 95a · 52074 Aachen · Germany · Phone +49 241 74927 · Fax +49 241 79521 · www.pdix.com
ICMcompact
56
III.5
Partial Discharge Detector
Noise Reduction
III.5.1 LLD noise ground (Low-Level Discriminator)
Depending on the environment and the test circuit, different level of background noise are visible (see
Fig.69). Since this noise level is usually stable for the whole phase (360°), it can be removed by the LLD
function (low level discriminator). All PD
pulses falling beneath the LLD-threshold are
deleted. This will remove broad black band in
the NORM, SINUS mode of the SCOPE display.
Fig. 69: PD pattern including noise level (LLD=0%)
The LLD can be set in the menu SETUP2 \
LLD/P by the buttons LLD+ and LLD-. The
standard setting is 10%. The LLD function is
not active in the METER display.
Fig. 70: PD pattern without noise level
Power Diagnostix · Brüsseler Ring 95a · 52074 Aachen · Germany · Phone +49 241 74927 · Fax +49 241 79521 · www.pdix.com
ICMcompact
Partial Discharge Detector
57
III.5.2 Window Mask (Software)
Some disturbances like thyristor firing are
phase stable. They can be removed by the
software function WIN. This function selects
up to 3 windows which blank out pulses occurring in these windows. Pulses occurring
within these windows will neither contribute
to the displayed charge peak value of the
SCOPE display, nor will they affect the
reading of the meter.
Fig. 71: PD pattern with one phase stable disturbance
Fig. 71 and Fig. 72 show the same measurement, whereby in Fig. 72 one window is
set to blind the respective phase position.
The menu SETUP1 \ WIN offers to set 0 to 3
windows. The number of windows can be
changed by ‘OFF’, ‘1 WIN’, ‘2 WIN’, ‘3 WIN’
and is displayed at the bottom line. The width
of each window is identic and can be increased by ‘<<>>’ or decreased by ‘>><<’.
The phase position is changed by ‘POS>>’.
Fig. 72: PD pattern with one window at 93.2°
If a second windows is selected the distance
to the first will be 180°, for three windows the
distances are 120°.
As in the previous menu, the window parameters remain stored after deactivating the
window function or when the instrument is
switched off.
Fig. 73: Three windows of 120° distance, LLD=0%
III.5.3 External Signal Gating (TTL Gating, optional)
If disturbances, like switching of a relay or thyristor firing, have a known source, it might be possible to
create a TTL signal prior to the disturbance. This signal can be used to blind out the PD measurement
path. The TTL gating function is an optional function and has to be ordered separately. ICMcompact’s with
this optional function have a BNC connector on the back panel labeled ‘TTL gate’. For the time this input is
logically high (5VDC; TTL standard) no signal is taken from the AMP_IN terminal i.e. no PD signal is recorded.
Power Diagnostix · Brüsseler Ring 95a · 52074 Aachen · Germany · Phone +49 241 74927 · Fax +49 241 79521 · www.pdix.com
ICMcompact
58
Partial Discharge Detector
III.5.4 Gating With External Sensor (Optional, Analog Gating)
An effective noise reduction is required in case the ICMcompact is used for partial discharge measurements in an environment with high frequency (HF) disturbance. HF disturbances, which hamper partial
discharge detection and which can be handled by the gating function are, for instance, radar signals, corona discharge, or thyristor firing. Using the
analog gating function blind out such impulse
noise. Continuous radio frequency signals
from broadcasting, for example, cannot be
removed by the gating function. Here, the
active bridge adapter AB1 is used.
Fig. 74: PD pattern including disturbances
Fig. 75: PD pattern after manual gating
The analog gating function is an optional
function and has to be ordered separately.
An
ICMcompact with a gating function
comes with a built-in preamplifier (RPA6)
and a ‘GATE IN’ terminal (BNC) on the rear
panel. An antenna or another sensor that
picks up the disturbance signal is connected
to this ‘GATE IN’ terminal. With some applications a CT1 (current transformer) is used
to acquire the disturbance signal from a
ground conductor or from the screen of a
signal cable.
The gating function is activated in the menu
MAN G or AUTO G (see chapter III.2.2 Optional Key Menus). ‘>ON’ indicates activated
gating. In case the (disturbance) signal at
'GATE IN' terminal exceeds a threshold the
processing of the analog signal is blocked
for 10 to 100µs. Thus, the signals falling in
this period does not contribute to the instrument's display and derived quantities.
Two different modes of setting the trigger can be selected from the menu ‘GATE’:
MAN
- The manual mode offers to set the trigger from 1 to 100 % of the peak disturbance level. This
threshold is displayed in the upper right corner of the display (MAN G) once this mode is active. To change the trigger level press ‘TH +’ and ‘TH –‘. This option is used to remove a known
disturbance source in a stable environment.
AUTO
- The automatic mode calculates a gating time as a fixed portion of the measured time. E.g. setting the gating time to 10% results in a total blind-out time of 2ms for 20ms @ 50Hz. The trigger level will be set accordingly to this time. The total gating time, when activated, is displayed
in the upper right corner of the menu ‘AUTO G’. Pushing ‘GT +’ and ‘GT –‘ allows changing the
gating from 1% to 50%. This option is used to when the noise situation is likely to change over
time.
Bandwidth Mode Frequency Range
The built-in preamplifier (RPA6) has a logarithmic
MODE1
40kHz to 800kHz
amplification and can be set to three different frequency
MODE2
2MHz to 20MHz
ranges, which are selected in the submenu ‘BANDW’. The
MODE3
200MHz to 600MHz
active bandwidth mode is marked by ‘>’. The following table
lists the frequency bands for the three modes.
Power Diagnostix · Brüsseler Ring 95a · 52074 Aachen · Germany · Phone +49 241 74927 · Fax +49 241 79521 · www.pdix.com
ICMcompact
Partial Discharge Detector
59
An ICMcompact equipped with the gating function offers the following additional menus. They can be accessed only in the ‘SCOPE’ display ‘SETUP’/’GATE’ menu:
MAN
AUTO
BANDW
EXIT
GATE
TH+
TH-
>ON
EXIT
MAN G
GT+
GT-
>ON
EXIT
AUTO G
MODE1
MODE2
>MODE3
EXIT
BANDW
MAN
Pushing this button changes to the submenu for manual gating (see below).
AUTO
Pushing this button changes to the submenu for automatic gating (see below).
BANDW
Pushing this button changes to the sub-menu, where the frequency bands of the preamplifier (RPA6) can be set (see last menu bar on this page).
EXIT
Pushing this button changes one level up to the menu SETUP1.
TH+/THPushing these buttons increments or decrements the gating threshold level. This value
is displayed at the upper right side of the screen in percent. If the gating analog signal
exceeds this level, then the measurement PD signal is blocked for 100µs at 50Hz. The
gating time per noise event Tg depends on the synchronization
1
frequency and is calculated by
Tg =
f
sync ⋅ 197
(where fsync is the sync frequency displayed in the left bottom
corner of the display):
ON (>ON)
This button turns the gating function on (>ON) or off ( ON). The gating function remains
off, if no preamplifier is connected to the gating input. Usually, the preamplifier is build
in.
EXIT
Pushing this button changes one level up to the menu GATE.
GT+/GTPushing these buttons increments or decrements the total gating time. This value is
displayed at the upper right side of the screen in percent. The instrument automatically
adjusts the threshold level. If the gating signal exceeds this automatically set level,
then the PD signal (AMP IN) is blocked for maximum 100µs at 50Hz.
ON (>ON)
This button turns the gating function on (>ON) or off ( ON). The gating function remains
off, if no preamplifier is connected to the gating input. Usually, the preamplifier is build
in.
EXIT
Pushing this button changes one level up to the menu GATE.
MODE1
Pushing this button selects the frequency range 1 (40kHz to 800kHz) for the preamplifier RPA6 at the gating input.
MODE2
Pushing this button selects the frequency range 2 (2MHz to 20MHz) for the preamplifier RPA6 at the gating input.
MODE3
Pushing this button selects the frequency range 3 (200MHz to 600MHz) for the preamplifier RPA6 at the gating input.
EXIT
Pushing this button changes one level up to the menu GATE.
Power Diagnostix · Brüsseler Ring 95a · 52074 Aachen · Germany · Phone +49 241 74927 · Fax +49 241 79521 · www.pdix.com
ICMcompact
60
IV
Partial Discharge Detector
The ICMcompact Software (overview)
There are two software packages available to communicate with the ICMcompact via serial link (RS232).
•
•
ICMcompact : Standard software to record and save PD measurement data.
Optional version for the cable fault location, only to use with the DSO extension.
HVpilot :
Used to take measurements over long periods. Useful only with the STEPcompact.
Software has to be ordered separately and is delivered on a CD ROM. Software updates can be downloaded
from Power Diagnostix’ home page (www.pdix.com) using a valid login and password. After downloading the
requested software and extracting the files, the program ‘setup.exe’ will start the installation.
V
Standard Software ICMcompact
The standard software is also called ICMcompact and shows an image of the LCD (display) from the instrument. The acquired data, like PD, voltage (if the optional HVM installed) and AUX (if installed) are constantly
refreshed. The five menu buttons can be used like on the real instrument which allows a remote control even
over longer distances. For this, the serial link can be extended by a fiber optic or in combination with a modem on both sides (instrument and PC) by a common phone line.
Fig. 76: Main Control Panel of the standard software ICMcompact
The ICMcompact software can be used online and offline. In the first online session the device code of the
instrument has to be entered to keep the serial connection. The PC will then actively communicate with the
instrument and take the PD pattern and measurement values. These acquired data can be stored and exported in different ways, so that a repetition or later analysis of the measurement is feasible. The export
functions allow an easy way to create reports with all necessary information like data, pattern and graphs.
Power Diagnostix · Brüsseler Ring 95a · 52074 Aachen · Germany · Phone +49 241 74927 · Fax +49 241 79521 · www.pdix.com
ICMcompact
VI
Partial Discharge Detector
61
Extended Software 'ICMcompact' with cable fault location
The optional software extension for cable fault location is specialized for high or medium voltage cable diagnostic. This requires an ICMcompact instrument with the optional acquisition board ‘DSO’. For the general
functionality of this board and a detailed description of this software extension, see also chapter III.3.3 ‘DSO
Display’. Older instruments can be upgraded with the DSO board, please contact Power Diagnostix for details.
Fig. 77: Main Panel of ICMcompro with the DSO graph (left) and the LOC graph (right)
The main panel shows in the top part two graphs (DSO left and LOC right) as can be seen in Fig. 77.
On the left hand site the DSO graph (digital storage oscilloscope) displays the actual PD waveform including
its reflection at the cable terminations. This is in principle the same graph as shown on the display of the
instrument just with a higher resolution. The software offers three colored cursor to evaluate the PD pulse.
Since the time difference of the reflections refers to the fault position, the calculated values in time and meter/feet are listed in the
field below (see figure left 78)
Fig.78: First Evaluation Result from DSO graph
Usually multiple PD pulses are recorded and evaluated. This ensures to capture further PD sources and to
state more precisely the position of single defects. The graph on the right hand site collects the results from
the distance evaluation of the DSO graph. This localization graph (LOC graph) is usually created offline by a
manual or automatic mode. It requires for the calculation either the
total cable length or the pulse velocity. The number and charge of
all captured PD pulses is then displayed as a function of the cable
Fig.79: Final Fault Position from LOC graph
length. Finally the fault positions can be measured by two cursors
(blue and green) directly.
Power Diagnostix · Brüsseler Ring 95a · 52074 Aachen · Germany · Phone +49 241 74927 · Fax +49 241 79521 · www.pdix.com
ICMcompact
62
VII
Partial Discharge Detector
Specialized Software HVpilot (optional)
The HVpilot software is designed to control the voltage for a test set up and to take measurements of:
voltage (high voltage site), partial discharge (PD), tanδ (dissipation factor) , Cx (ideal capacitance of the test
object).
For this task, three further instruments beside a PC are necessary:
• the STEPcompact to control the variac of a high voltage transformer, observing the voltage for a possible
break down, and supply the HVpilot with the actual voltage value.
• the ICMcompact to take PD measurements of the test object.
• the TDAcompact (optional) to measure the tanδ and capacitance of the test object.
The STEPcompact together with the HVpilot software are newly developed to automate high voltage test
sequences. The three instruments are connected to a PC via serial link (RS232) and exchange data with the
HVpilot software. This software also provides the possibility to program a test sequence, analyze the measured data and generate a report automatically. Several different test sequences can be created to customize
the program for special measurement tasks. The report files are created as *.doc or *.html and can also easily be customized.
Fig.80: Main Panel of the HVpilot software for the automation of high voltage tests.
The main panel of the HVpilot software displays the 4 measurement values (Û/√2, PD, tanδ, CX) continuously
on a time axis. Beneath this, the programmed test voltage curve is displayed to follow a running test or to
compare the measured data later on. Actual measurement values from the cursor position are displayed on
the left hand site. The ten function buttons in the bottom row give a quick access to the main program functions.
Power Diagnostix · Brüsseler Ring 95a · 52074 Aachen · Germany · Phone +49 241 74927 · Fax +49 241 79521 · www.pdix.com
ICMcompact
Partial Discharge Detector
63
The first step to create a test sequence is the step
voltage curve. This can be done offline (without
the instruments) and downloaded later to the
STEPcompact (for the voltage control). Fig. 81
shows the function panel to create the step voltage curve.
Fig. 81: Panel to create the step voltage curve
The next step is to define the kind of test, which has to be done. Three different kinds of test sequences are
offered:
• The first is designed for tests which plainly acquire the PD activity and the tan δ / CX at predefined voltage levels.
• The second allows to set maximum PD levels at certain voltage values for e.g. acceptance tests.
• The third is designed for breakdown tests. E.g. several test specimen have to withstand an over voltage
for a certain time. The voltage is increased continuously stepwise, and the test procedure must be continued after a failed specimen is removed.
Once the test sequence is specified and saved, the
automated test can be started by loading the wanted
sequence. The specification data for the report have to
be entered and the test can be started. The test report
will then be saved as can be seen in figure 82.
Fig. 82: Specification Field
Power Diagnostix · Brüsseler Ring 95a · 52074 Aachen · Germany · Phone +49 241 74927 · Fax +49 241 79521 · www.pdix.com
ICMcompact
64
Partial Discharge Detector
Fig. 83: Example Report
Power Diagnostix · Brüsseler Ring 95a · 52074 Aachen · Germany · Phone +49 241 74927 · Fax +49 241 79521 · www.pdix.com
ICMcompact
Partial Discharge Detector
65
VIII Miscellaneous
VIII.1 Maintenance
The ICMcompact does not require any maintenance on a regular basis. There is no fine adjustment on a
regular basis required, as the partial discharge measurement is a relative measurement that is calibrated
with a reference source prior to a measurement. The calibration impulse generator as the reference source,
however, must be calibrated on an annual basis to ensure that its output signal remains within the recommended boundaries.
VIII.2 Shipment Instructions
In case a unit needs to be returned to the factory, make sure the acquisition unit is packed safely. As the
units are relative small, shipment by couriers, such as DHL, FedEx, or equivalent is the recommended
mode of transportation. If possible, declare the instrument as 'used instruments for evaluation' at a relative
low value. Consult Power Diagnostix for further details. Additionally, Power Diagnostix may provide you with
a temporary replacement unit, in case of urgent needs.
Power Diagnostix · Brüsseler Ring 95a · 52074 Aachen · Germany · Phone +49 241 74927 · Fax +49 241 79521 · www.pdix.com
ICMcompact
66
Partial Discharge Detector
VIII.3 Declaration of Conformity
Power Diagnoxtix Systems GmbH
Brüsseler Ring 95a
52074 Aachen
Germany
declares, that the instrument as specified below, meets the requirements of the standards and/or normative
documents as listed below.
Subsequently the instrument complies with the requirements of the EMC directive 2004/108/EC.
Partial Discharge Detector
Product:
ICMcompact
Description: Partial discharge detector for use in high voltage test area
Standards: EN 61000-6-1, EN 61000-6-2
EN 61000-6-3, EN 61000-6-4
EN 61010-1
Date:
Detlev Gross (managing director)
Remark: Since the measurement of partial discharge pulses is done in frequency bands partly occupied by
radio transmission, and since further test leads may act as antennas, disturbance free measurements may
require well shielded environments and/or additional filter techniques.
Power Diagnostix · Brüsseler Ring 95a · 52074 Aachen · Germany · Phone +49 241 74927 · Fax +49 241 79521 · www.pdix.com
ICMcompact
IX
Partial Discharge Detector
67
FAQ (Troubleshooting)
This chapter lists some problems that may be encountered in using the ICMcompact along with possible
causes and remedies.
The ICMcompact doesn’t do anything when powered up.
The power fuse might be blown. Unplug the unit and check the power supply fuse. This fuse is located on
the rear panel of the ICMcompact beneath the on/off switch (see figure 6 chapter II.1.2).
The personal computer cannot find the ICMcompact
A communications error with the serial connection to the ICMcompact might have occurred. Within the ICMcompact PC software, check to be sure that the serial com port selected in the menu ‘Connect’ is the com
port to which the ICMcompact is actually connected.
Try rebooting both the ICMcompact and the PC.
The ‘RPA?’ message appears in the lower left portion of the data display of the LCD panel, even
though the RPA (preamplifier from Power Diagnostix) is connected.
The RPA might be installed improperly (backwards). Check to be sure that the BNC connector
marked
leads from the sensor (quadrupole, CT, or coupling capacitor), and the BNC connector which
is marked by the sign
leads to the BNC connector labeled ‘AMP IN’ on the rear panel of the ICMcompact.
The pre-amplifier must be enabled if a RPA is connected. Ensure the >RPA ON is marked (see chapter III.2.3). Try substituting other BNC cables to be sure that the problem is not in the cables themselves.
The calibration pulse is not visible on the LCD panel.
First check that the calibrator is still on. The calibrator will shut off automatically after several minutes without having its buttons pushed. Check that the low battery indicator is not showing on the LCD panel of the
calibrator.
The calibration pulse setting might be too weak for the test setup. Try increasing the magnitude of the calibration impulse applied to the test setup.
The calibration pulse onscreen might be present but too small to be easily visible. Try putting the ICMcompact into ‘Scope Display’ \ ‘Norm’ mode. This will make the calibration pulse appear as a vertical bar, which
makes it easier to see onscreen that it appears in the ‘Hold’ mode.
Sometimes the calibration pulse is lost if the high-voltage power supply is connected to the test setup when
the calibration is performed, even if the high-voltage supply is completely powered off. Try physically disconnecting the high-voltage supply from the test setup during calibration. The calibrator will then be connected across only the test object quadrupole, and the coupling capacitor (if present).
If the problems persists, please contact Power Diagnostix for technical support.
Other problems
The troubleshooting section of the ICMcompact manual is evolving. If you encounter problems with your
ICMcompact that you think would be helpful to add to this troubleshooting section, please submit them to
Power Diagnostix. Thank you for your assistance.
Power Diagnostix · Brüsseler Ring 95a · 52074 Aachen · Germany · Phone +49 241 74927 · Fax +49 241 79521 · www.pdix.com
ICMcompact
68
X
Partial Discharge Detector
Technical Data of the ICMcompact (standard)
Mains Supply:
85-264VAC, 47-440Hz
(automatic)
Line Fuse:
1,6 A
(time-lag)
Power Requirements:
approx. 20VA
Display:
backlit LCD
Display Resolution:
128 x 240 Pixel S/W
Operation:
5 menu supported pushbuttons
Input Impedance (PD):
10kΩ//50pF
50Ω
(RPA1-Input)
(AMP IN)
Input Sensitivity:
< 200µV
< 2mV
(RPA1-Input)
(AMP IN)
Lower Cut-Off (-6dB):
40, 80 or 100kHz
(software controlled)
Upper Cut-Off (-6dB):
250, 600 or 800kHz
(software controlled)
Synchronization:
Line, with automatic change to external
Synchronization Range:
optional:
10Hz - 210Hz
10Hz - 410Hz
10Hz - 510Hz
External Synchronization:
max. 100Vrms or ±200Vpeak into 1MΩ // 200pF
Recorder Output:
0-10V with RO=100Ω
(re-converted analog value of the meter reading)
Operation Temperature:
10-40°C
(non condensing)
Size:
Width: 236mm
Height: 133mm
Depth: 300mm (exclusive BNC-Connectors)
Weight:
approx. 3kg
(with HVM and VLF option)
(>Vers.2.48)
(on special order)
Power Diagnostix · Brüsseler Ring 95a · 52074 Aachen · Germany · Phone +49 241 74927 · Fax +49 241 79521 · www.pdix.com
ICMcompact
X.1
Partial Discharge Detector
69
ICMcompact with 'HVM' (integrated voltage measurement)
(The HVM option is mandatory for the VLF option)
Input:
"SYNC IN"
Maximum level of voltage input: ±200Vpeak into 1MΩ // 200pF
Input Impedance:
10 MΩ // 200pF (with VLF option switched on)
1MΩ // 200pF
Synchronisation:
optional:
10Hz - 210Hz
10Hz - 510Hz
A/D Converter:
±11bit
Samples:
197 samples per cycle
e.g.: 20ms at 50Hz -> ≈100µs window per sample
Divider Ratio:
adjustable via DIV+/DIV- push buttons
Precision:
<1.5% (typical)
Values displayed:
URMS -value, Û/√2 -value, crest factor
Adapted Display:
The voltage curve is adjusted automatically to the range of 90 pixels of the
display; the curve is plotted 1:1 if the level of the input voltage is below 2.5V;
New menus:
at METER Display: HVM (2.buttons), Switch to voltage display HVM (High
Voltage Meter);
at HVM Display: MODE (3. buttons), sub-menu to set the shown voltage values at the scope display;
at SETUP sub-menu: Display HVM can be turned off
Additional software features:
"Data Record" function manages the recording and storage of values like:
- date and time
- PD level
- URMS -value
- Û/√2-value (lowest repetition rate for these value currently 2s)
(>Vers.2.48)
(on special order; not with VLF)
Power Diagnostix · Brüsseler Ring 95a · 52074 Aachen · Germany · Phone +49 241 74927 · Fax +49 241 79521 · www.pdix.com
ICMcompact
70
X.2
Partial Discharge Detector
ICMcompact with DSO (digital signal processor)
Fault location on cables (wide band measurement, time resolved)
Input:
‘AMP IN’
Trigger:
0 to 100% of input signal
step width in 3.125%
A/D Converter:
± 7bit
Samples:
100MSamples/s (Tsample = 10ns)
Displayed Time Window:
2 ... 80µs (200 ... 8000 Samples)
Serial Link:
56kBit/s
Specimen Cable Length:
10 to 5000m, for 80µs & vc=140m/µs
Localization Precision:
1m + 0.1% of the cable length
Power Diagnostix · Brüsseler Ring 95a · 52074 Aachen · Germany · Phone +49 241 74927 · Fax +49 241 79521 · www.pdix.com
ICMcompact
XI
Partial Discharge Detector
71
INDEX
0
F
M
0.1Hz .....................26
FAQ .......................67
FAST ...............20, 25
FEET .....................26
FILTER ............21, 23
FOL..........................8
frequency bands ....59
frequency range.....59
fuse........................67
mains supply .....9, 11
maintenance ..........65
manual gating ........59
max. display ..........36
menu options .........41
METER ......15, 26, 49
MUX.................50, 52
mV .........................19
G
N
G...gating ...............12
gain............22, 25, 36
GAIN................18, 48
GATE.....................21
GATE IN ................11
gating...............57, 58
gating time .............59
GN .........................48
GND...................9, 11
Noise Reduction ....56
NORM........13, 19, 20
A
acoustic .................19
AMP IN ..................11
analog gating .........58
and cable fault loc..61
AUTO.........15, 19, 58
automatic gating ....59
AUX .......................51
B
BANDW .................59
beep.......................25
brightness ................6
C
cable fault loc.........32
cable len. ...............37
cable length ...........49
CAL..................22, 55
CALF ...............22, 55
Calibration .............53
calibration factor.....55
calibrator................54
CF..........................22
clearing time ..........59
Conformity .............66
control buttons .........6
coupling unit ........8, 9
crest factor.............28
CURS.....................47
cursor...............49, 61
cutoff frequency .....23
H
HF disturbances ....58
HIGHP ...................22
HOLD...............13, 19
Hold DSO ..............38
HVM.................28, 30
HVpilot ...................62
I
ICMcompro ............61
ICMsystem.............13
IEC270.............15, 20
Impulse Generator.53
INFO ................24, 25
D
K
Declaration ............66
display..............12, 25
DIV.........................29
divider factor ..........31
divider ratio ............29
DSO...........32, 48, 61
DSO – Software.....33
key menus .............16
E
ESYNC ..................26
EXT........................12
L
LENGTH ................49
LIGHT ..............24, 25
LLD ..................23, 56
LOC .......................61
logarithmic .............52
low level discriminator
.....................23, 56
LOWP ....................22
scan.......................39
scope.....................13
serial link ...........9, 60
setup......................51
Shipment ...............65
SINE ................13, 19
SLOW ....................25
Software ................60
Software Driver ........8
SOUND .................25
SPEED ..................49
start .......................39
start LOC ...............40
STP .......................51
SYNC IN ..........10, 11
synchronization ..6, 10
O
optional............17, 28
P
PD pattern..............14
PH .........................23
phase shift .......14, 23
phase shift
adjustment .........31
POS ...........27, 47, 49
Position..................35
preamplifier ........9, 58
pulse velocity.........49
Q
Quadrupole............11
R
range .....................35
range ...............52, 54
REC OUT ........11, 26
refresh rate ............13
REMOTE ...............11
report .....................63
report .....................40
resolution...............13
RPA .9, 11, 12, 24, 25
RPA? ...............12, 67
RPA1D ..................19
run .........................38
RUN.......................48
T
TDR .......................32
Technical Data ......68
threshold level .......59
thyristor firing...57, 58
TRG.......................48
trigger level......36, 48
Troubleshooting.....67
TTL Gating ............57
U
Û/√2.......................29
Upeak ....................28
Urms ......................29
V
velocity ..................37
VLF............21, 26, 30
VLF – calibration ...31
voltage output........26
W
WIN .................27, 57
window ..................27
Window..................57
Z
ZM/POS.................49
zoom......................35
ZOOM..............47, 49
S
Safety ......................4
Power Diagnostix · Brüsseler Ring 95a · 52074 Aachen · Germany · Phone +49 241 74927 · Fax +49 241 79521 · www.pdix.com